CIM-Powered Multi-Hazard Simulation Framework Covering both Individual Buildings and Urban Areas


Abstract
:1. Introduction
1.1. Multi-Hazard Simulation
1.2. Literature Review
1.2.1. Multi-Hazard Simulation for Individual Buildings
1.2.2. Multi-Hazard Simulation for Urban Areas
1.2.3. Summary of the Literature Review
1.3. Overview of this Study
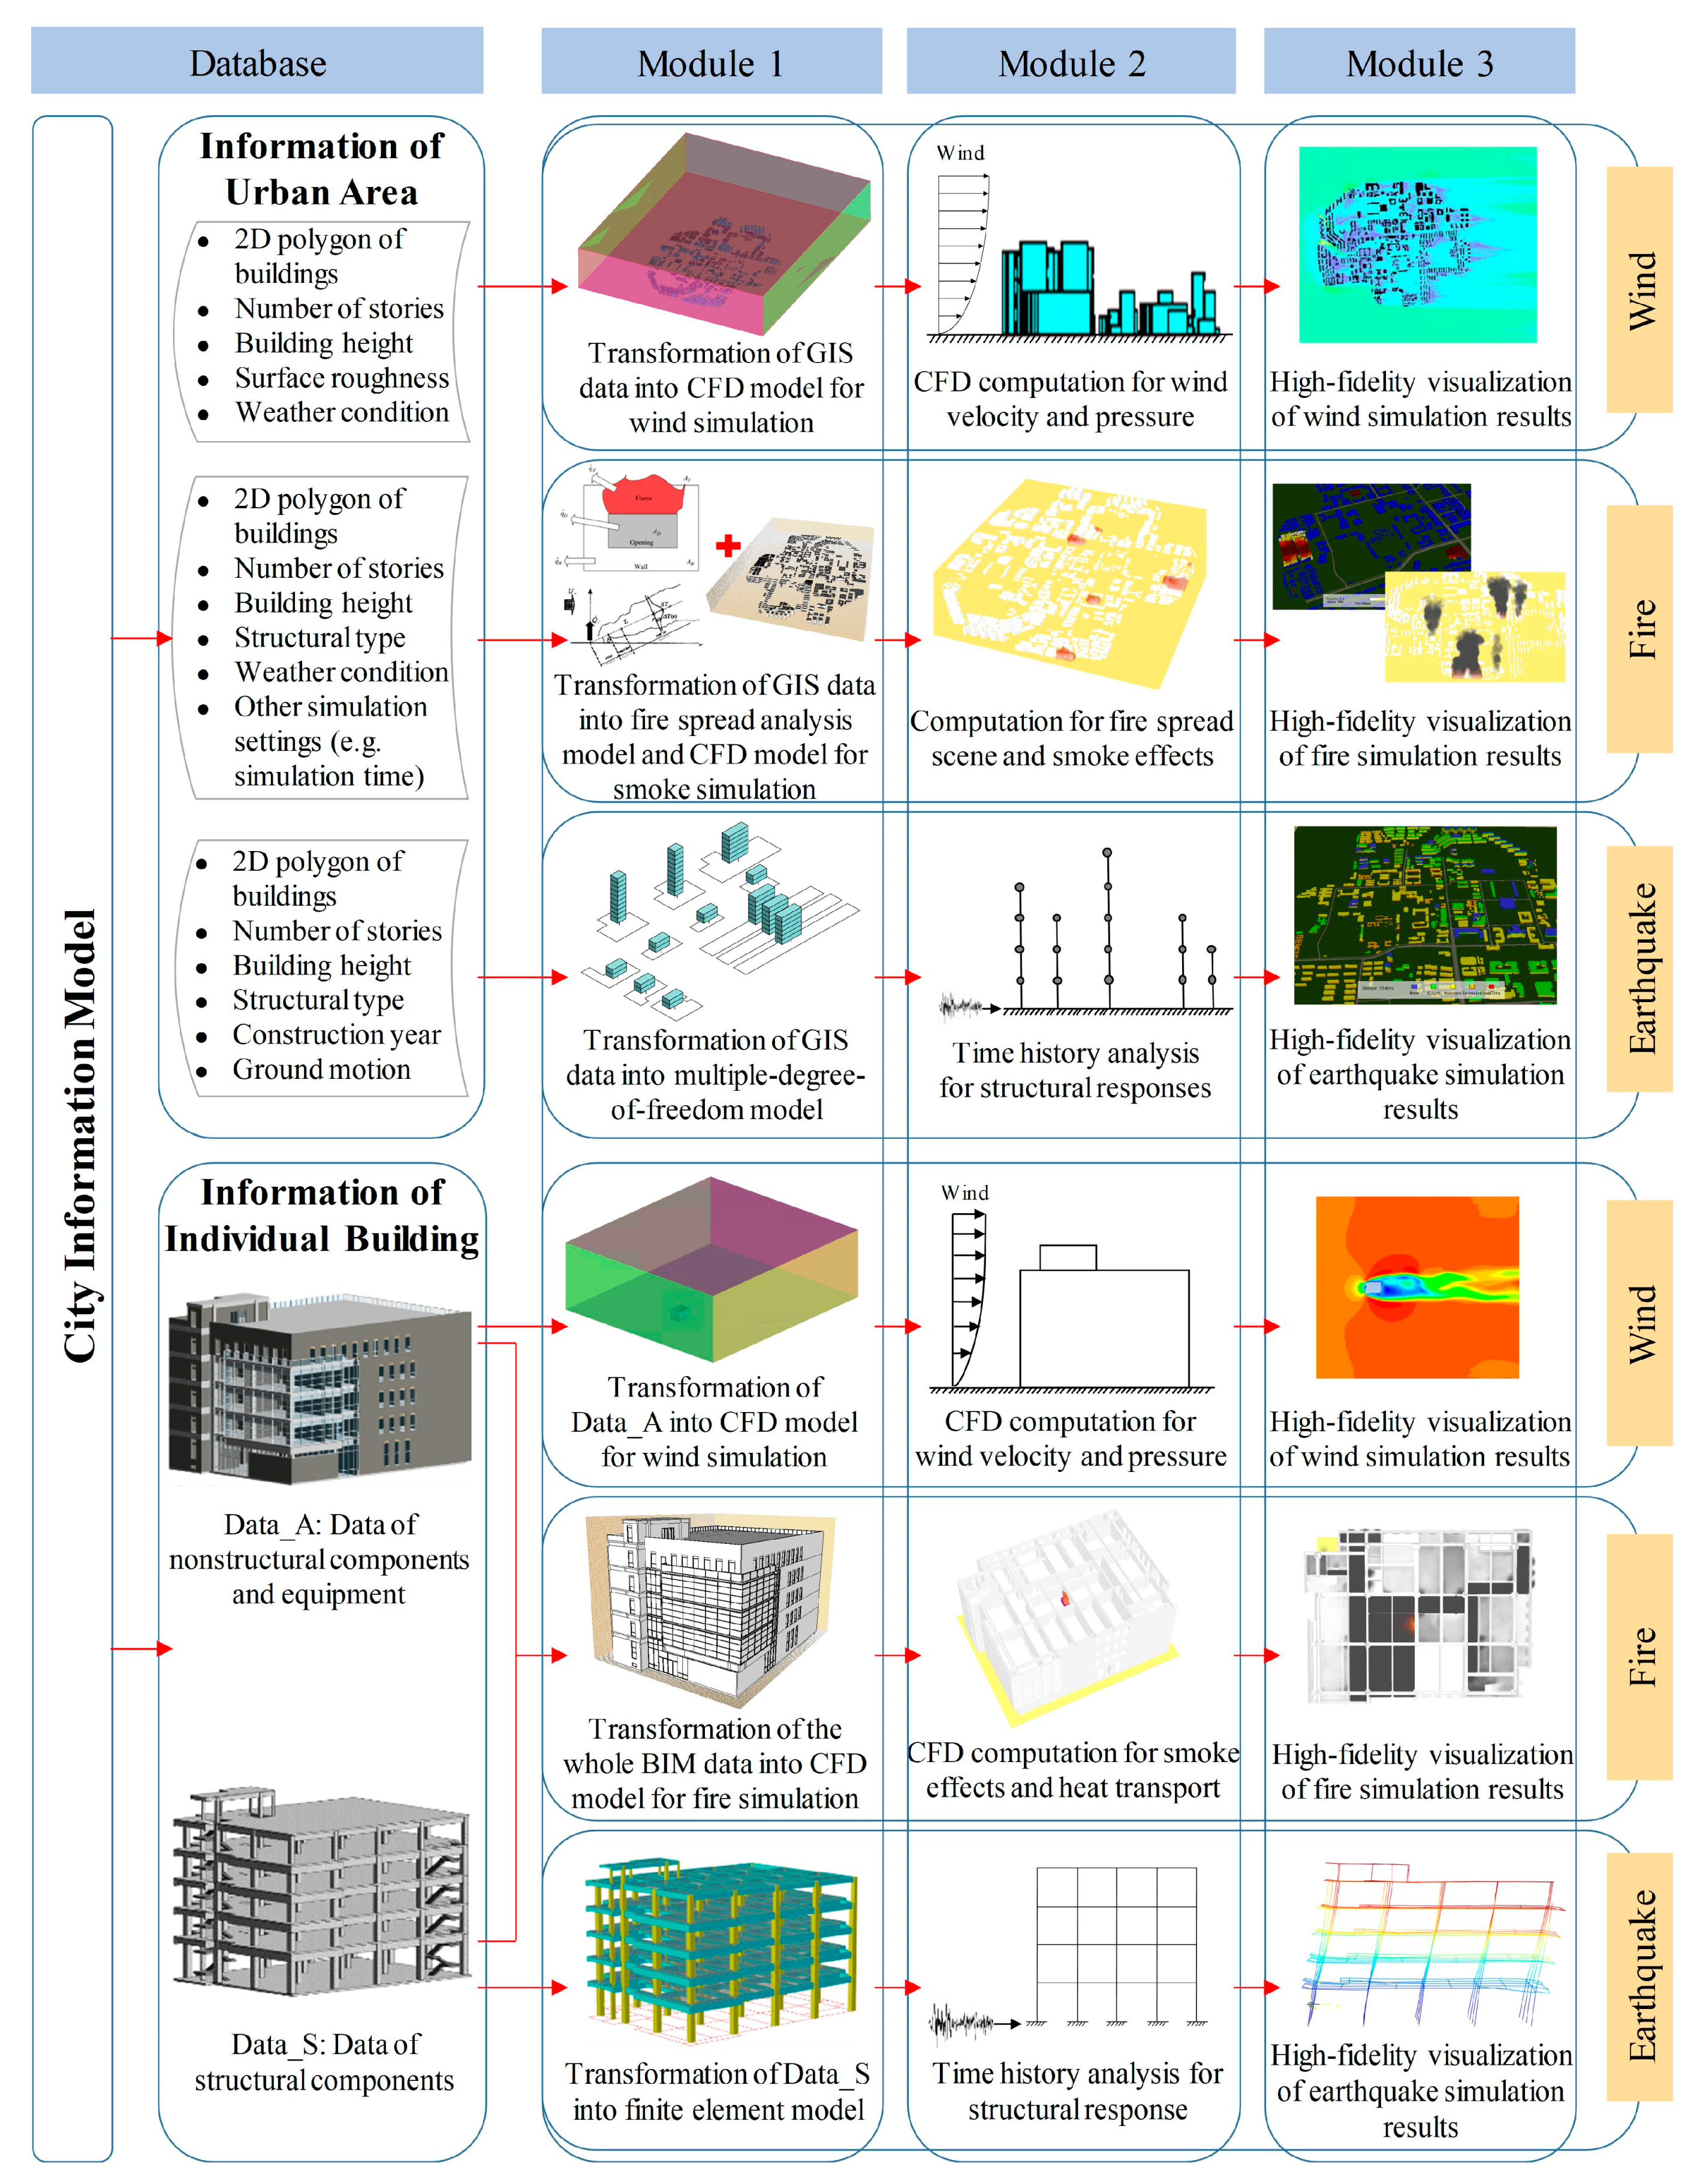
2. The Proposed Multi-Hazard Simulation Framework
2.1. City Information Model
2.2. Simulation Framework
2.2.1. Multi-Hazard Simulation for Individual Buildings
2.2.2. Multi-Hazard Simulation for Urban Areas
3. Methodology
3.1. Individual Building Case
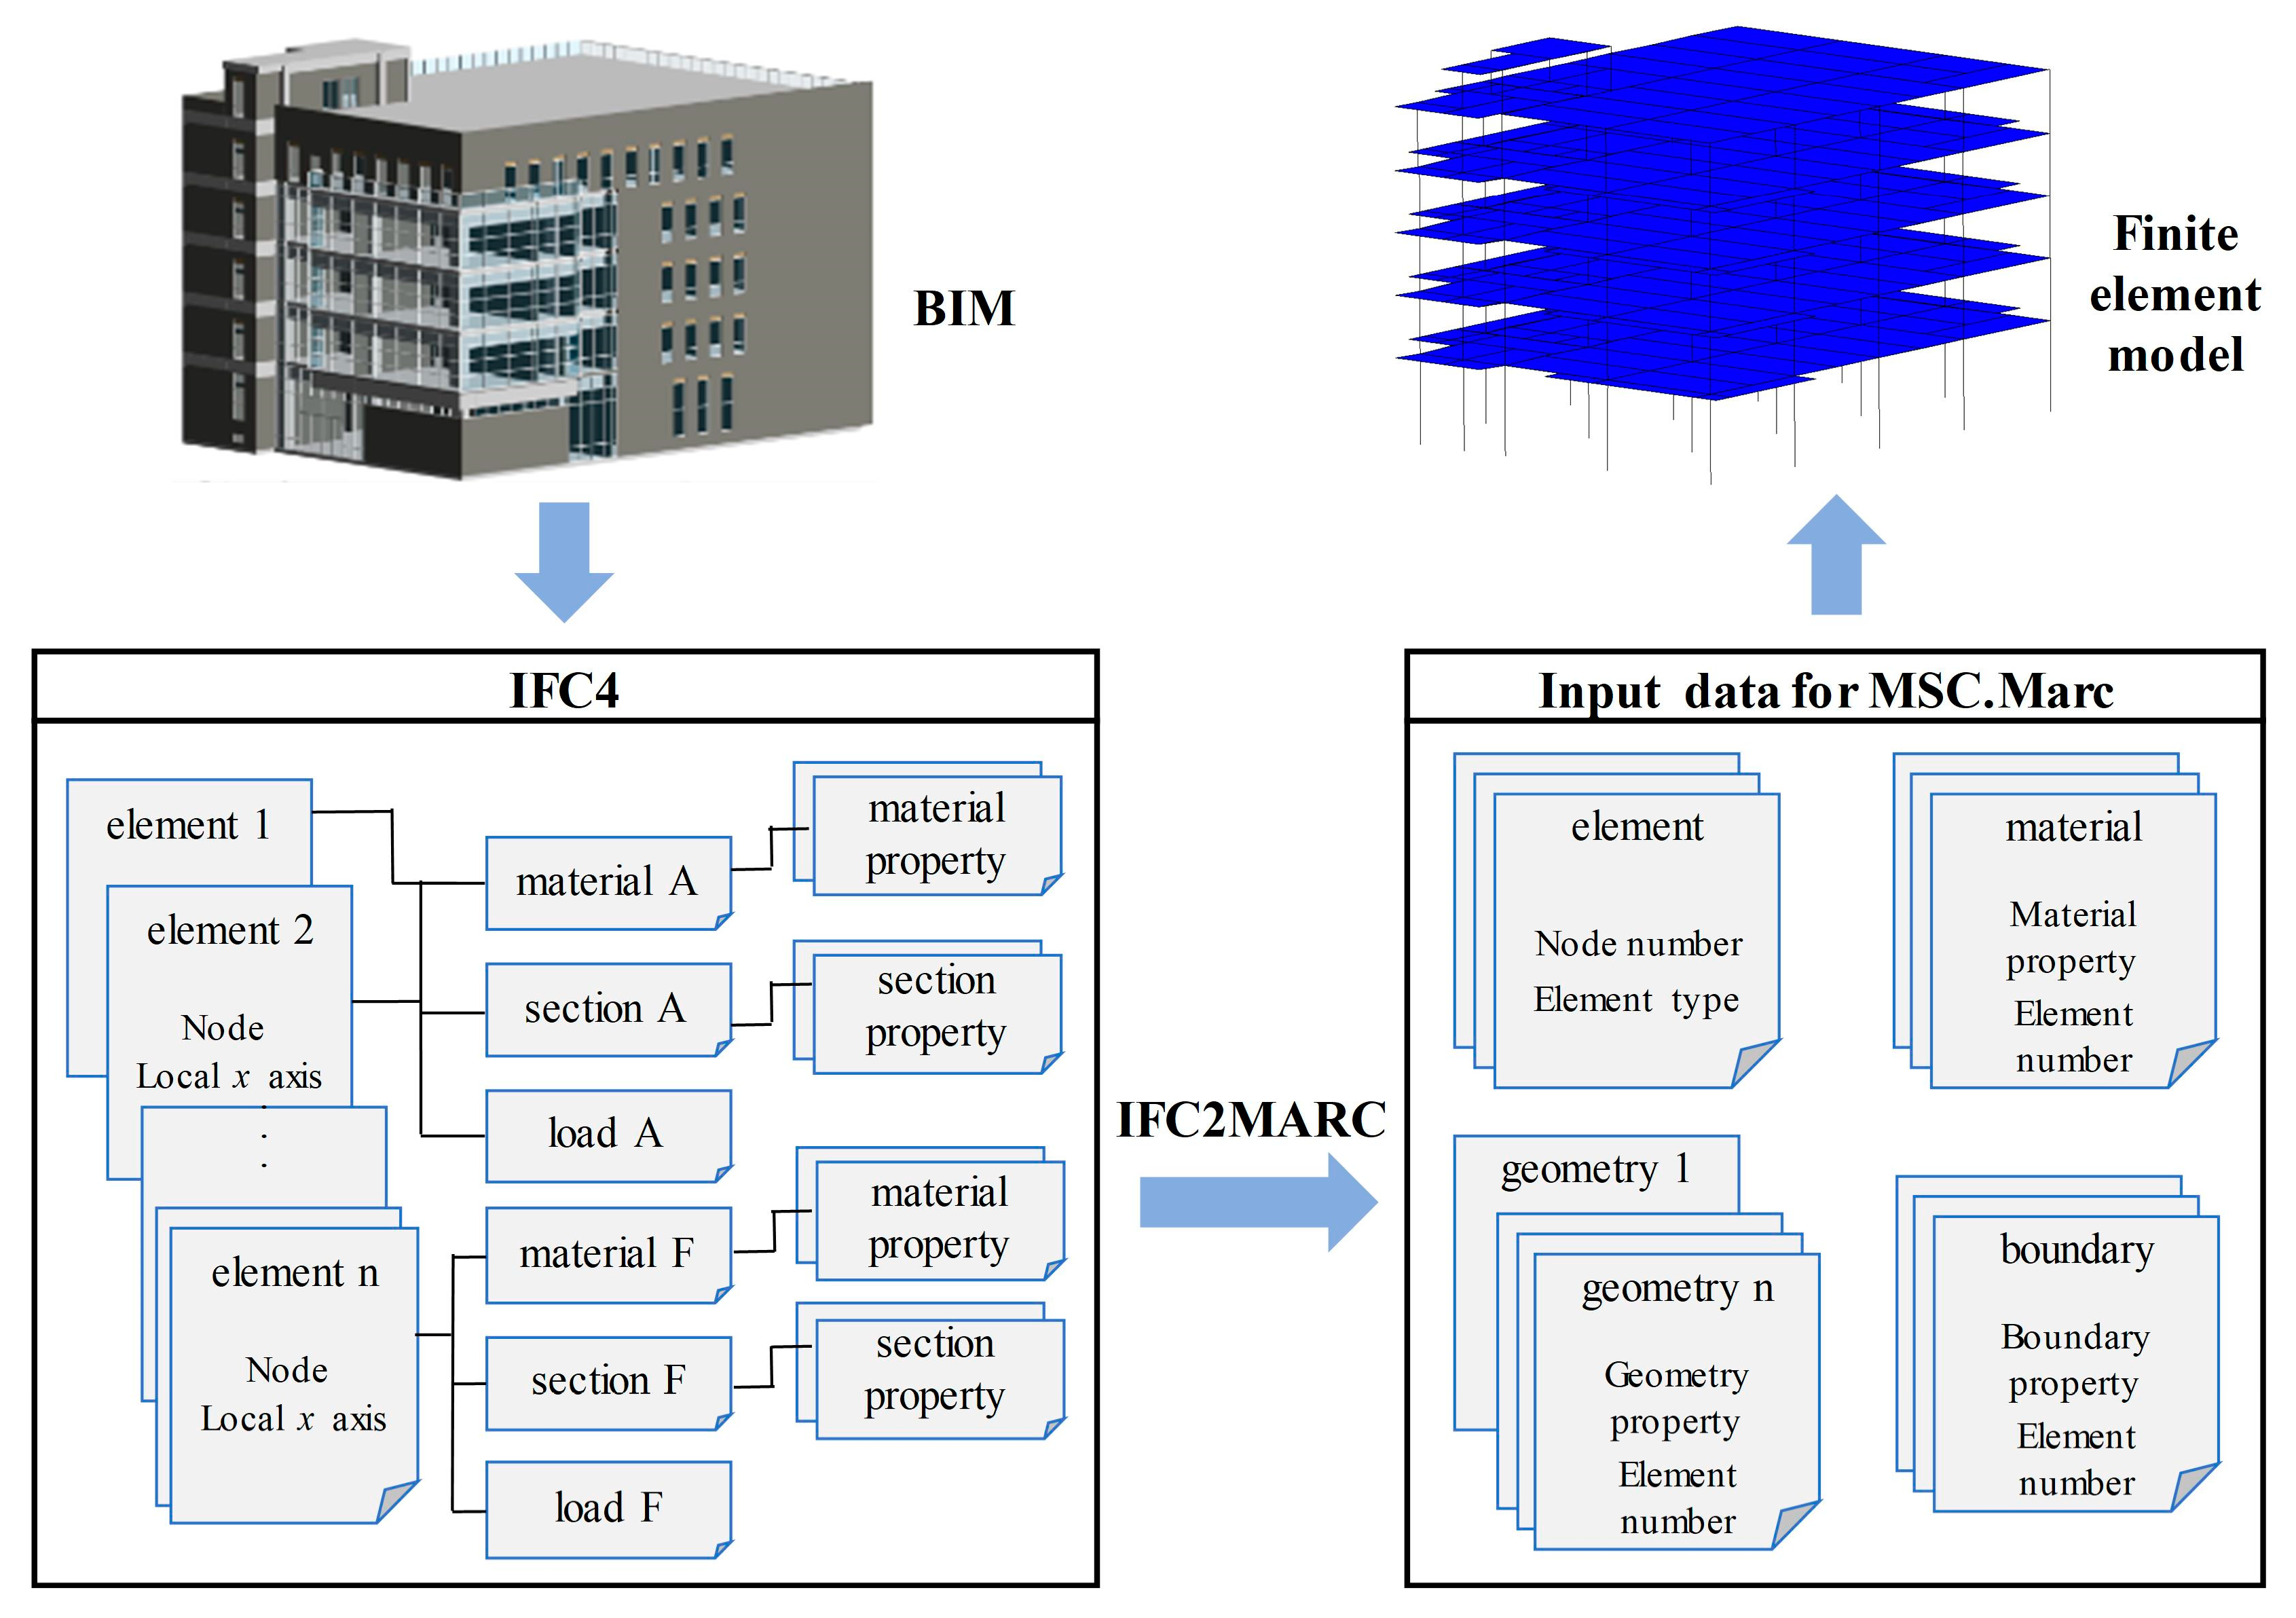
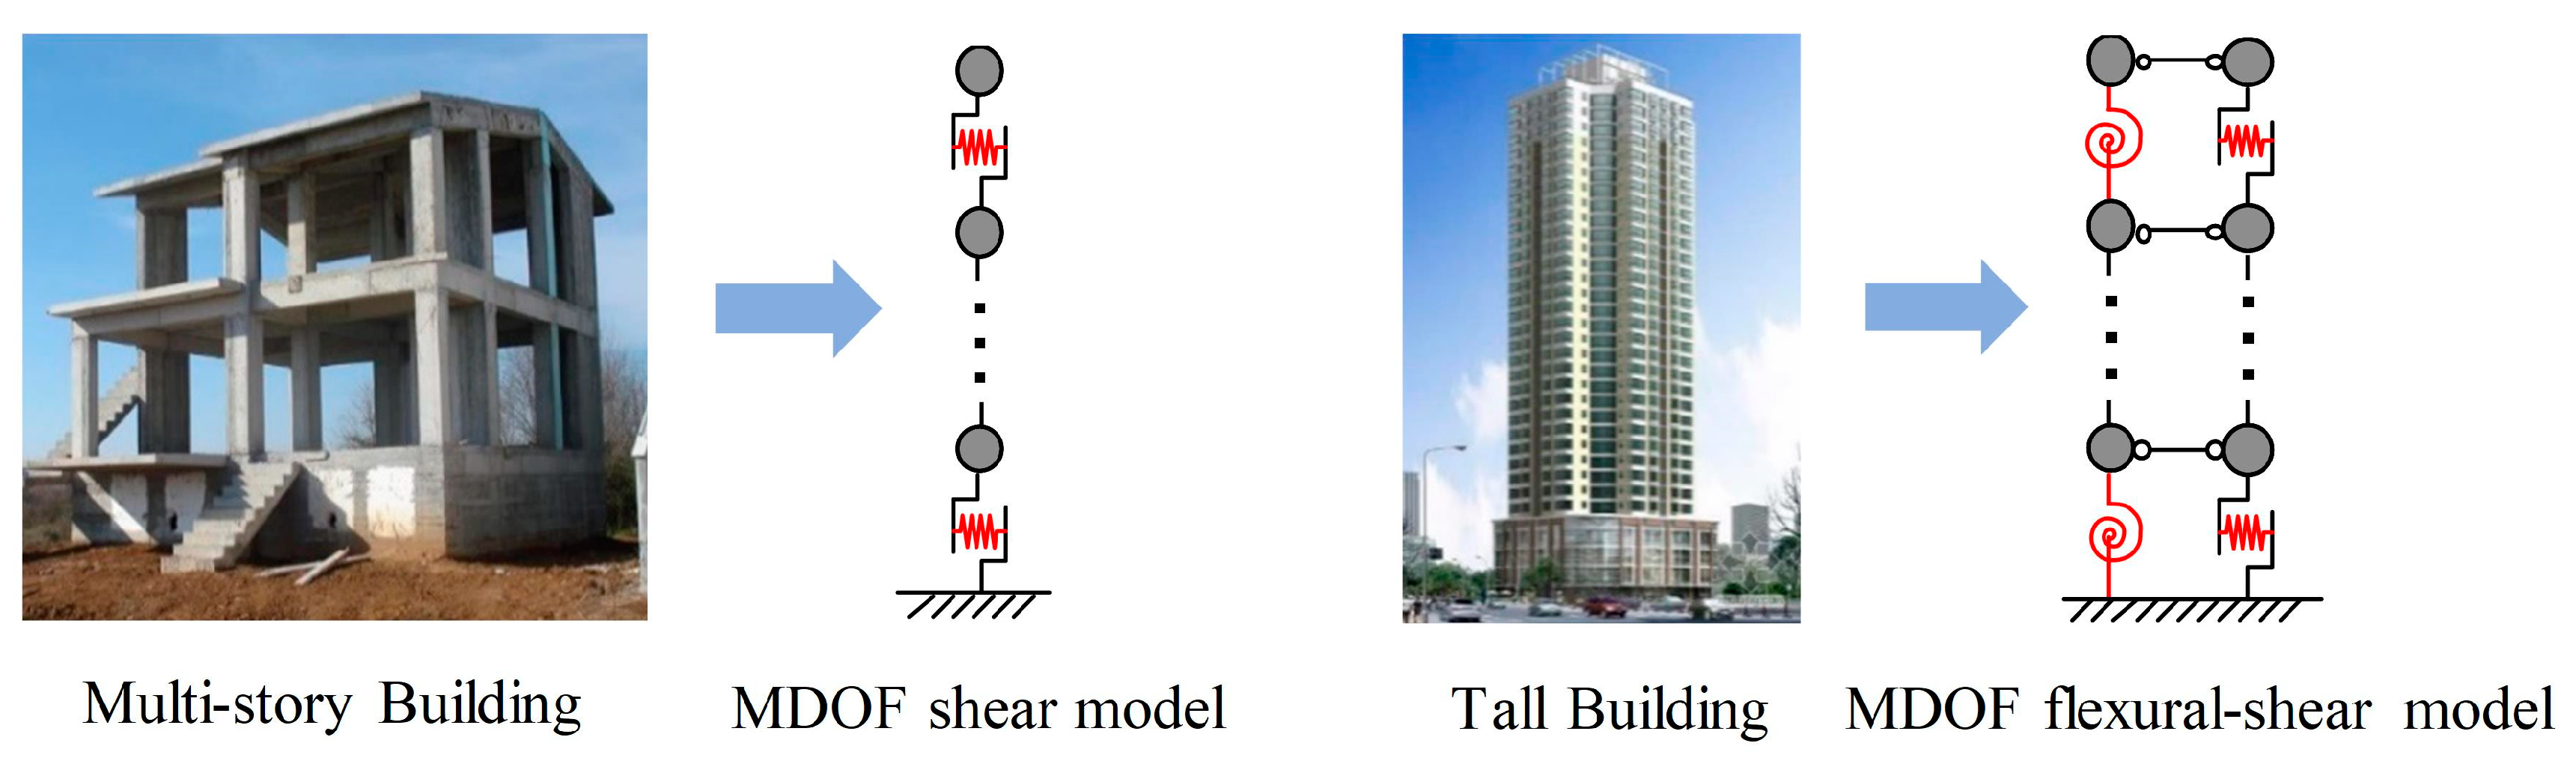
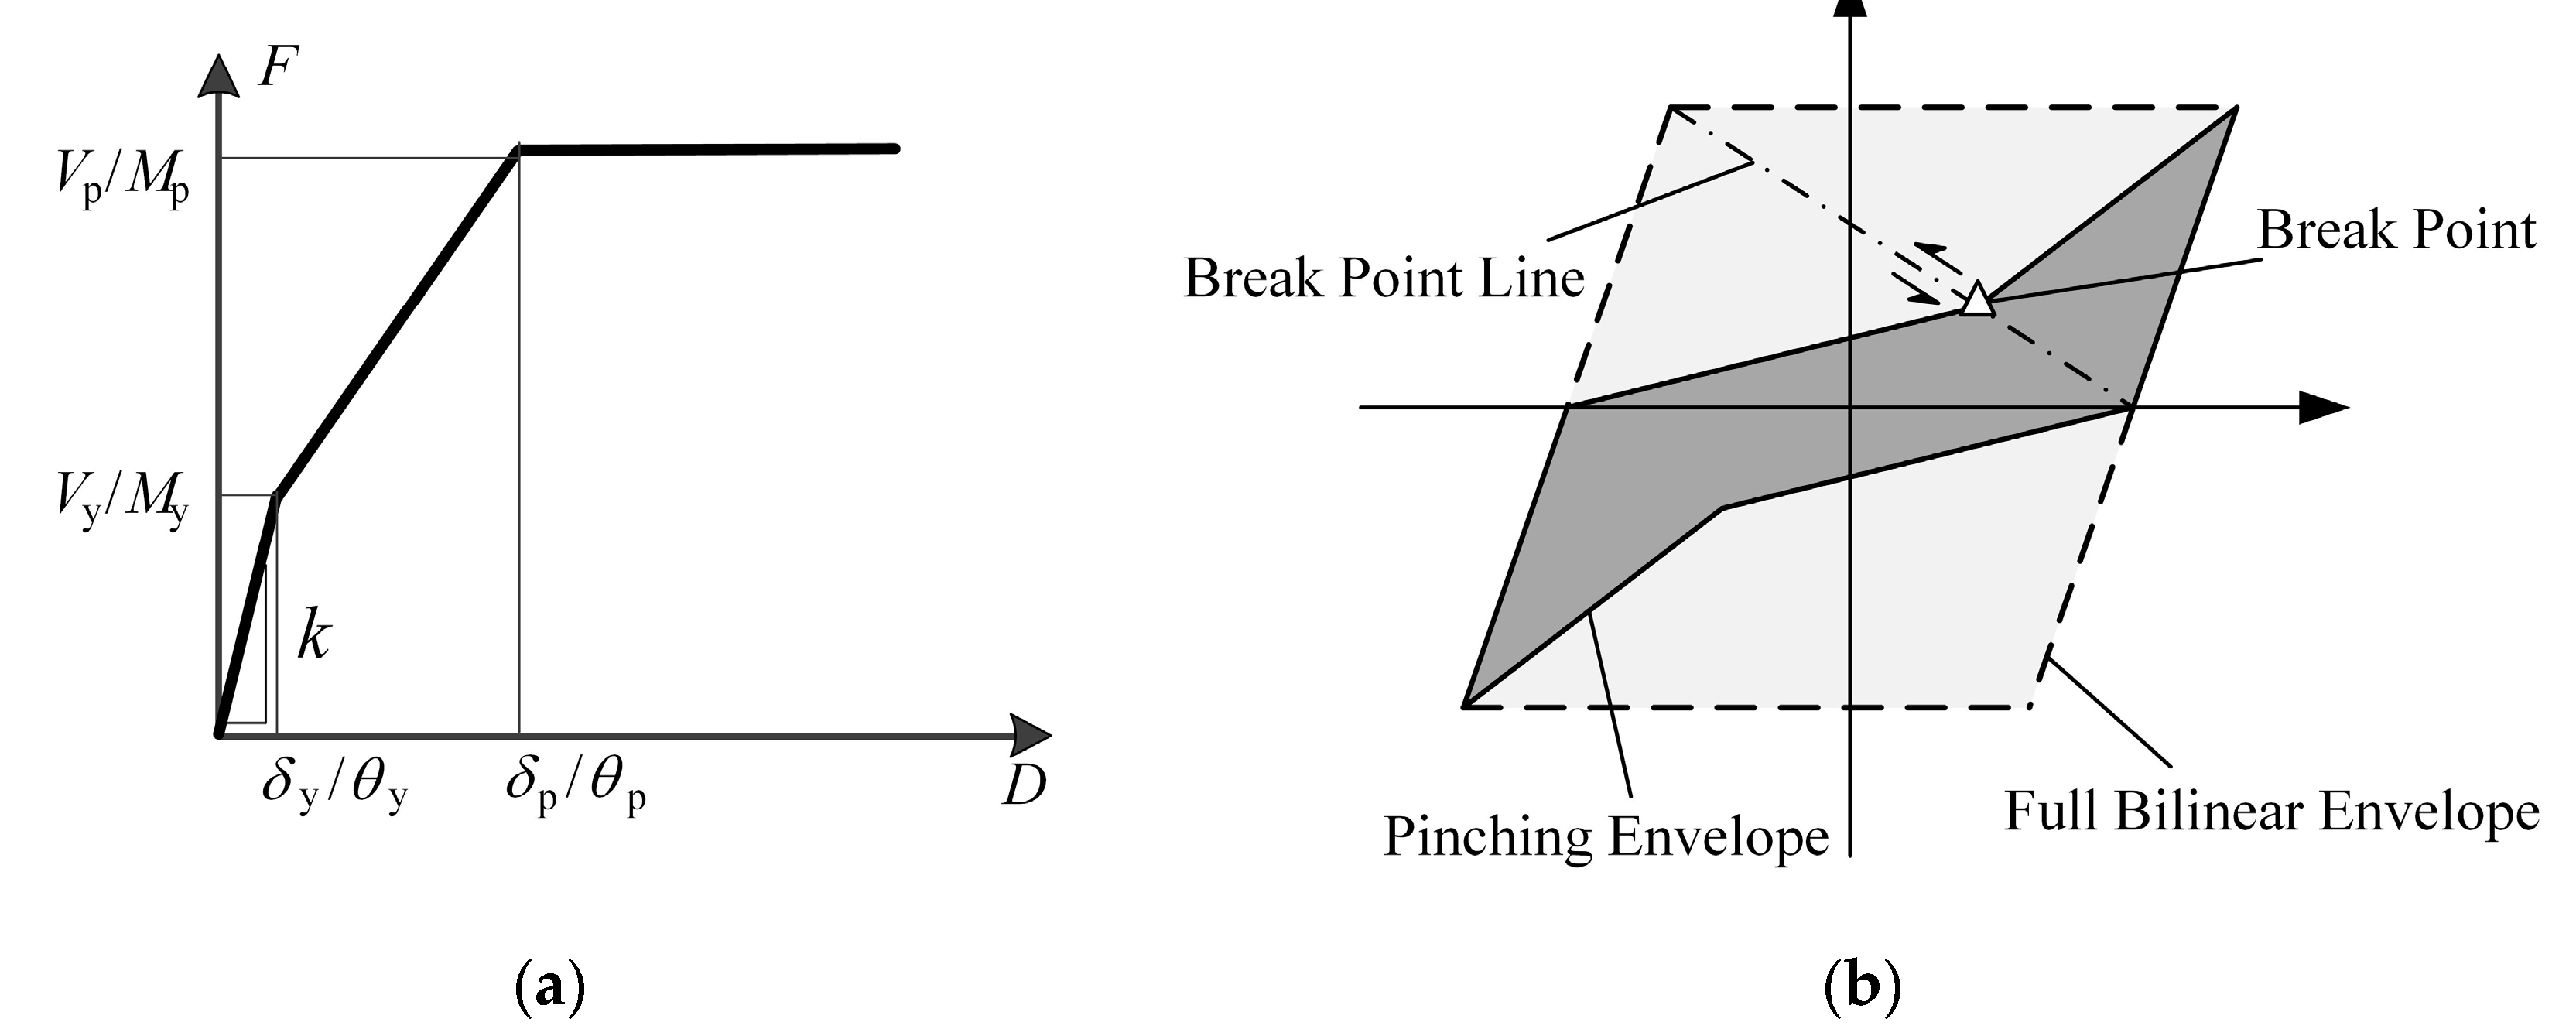
3.1.1. Earthquake Simulation
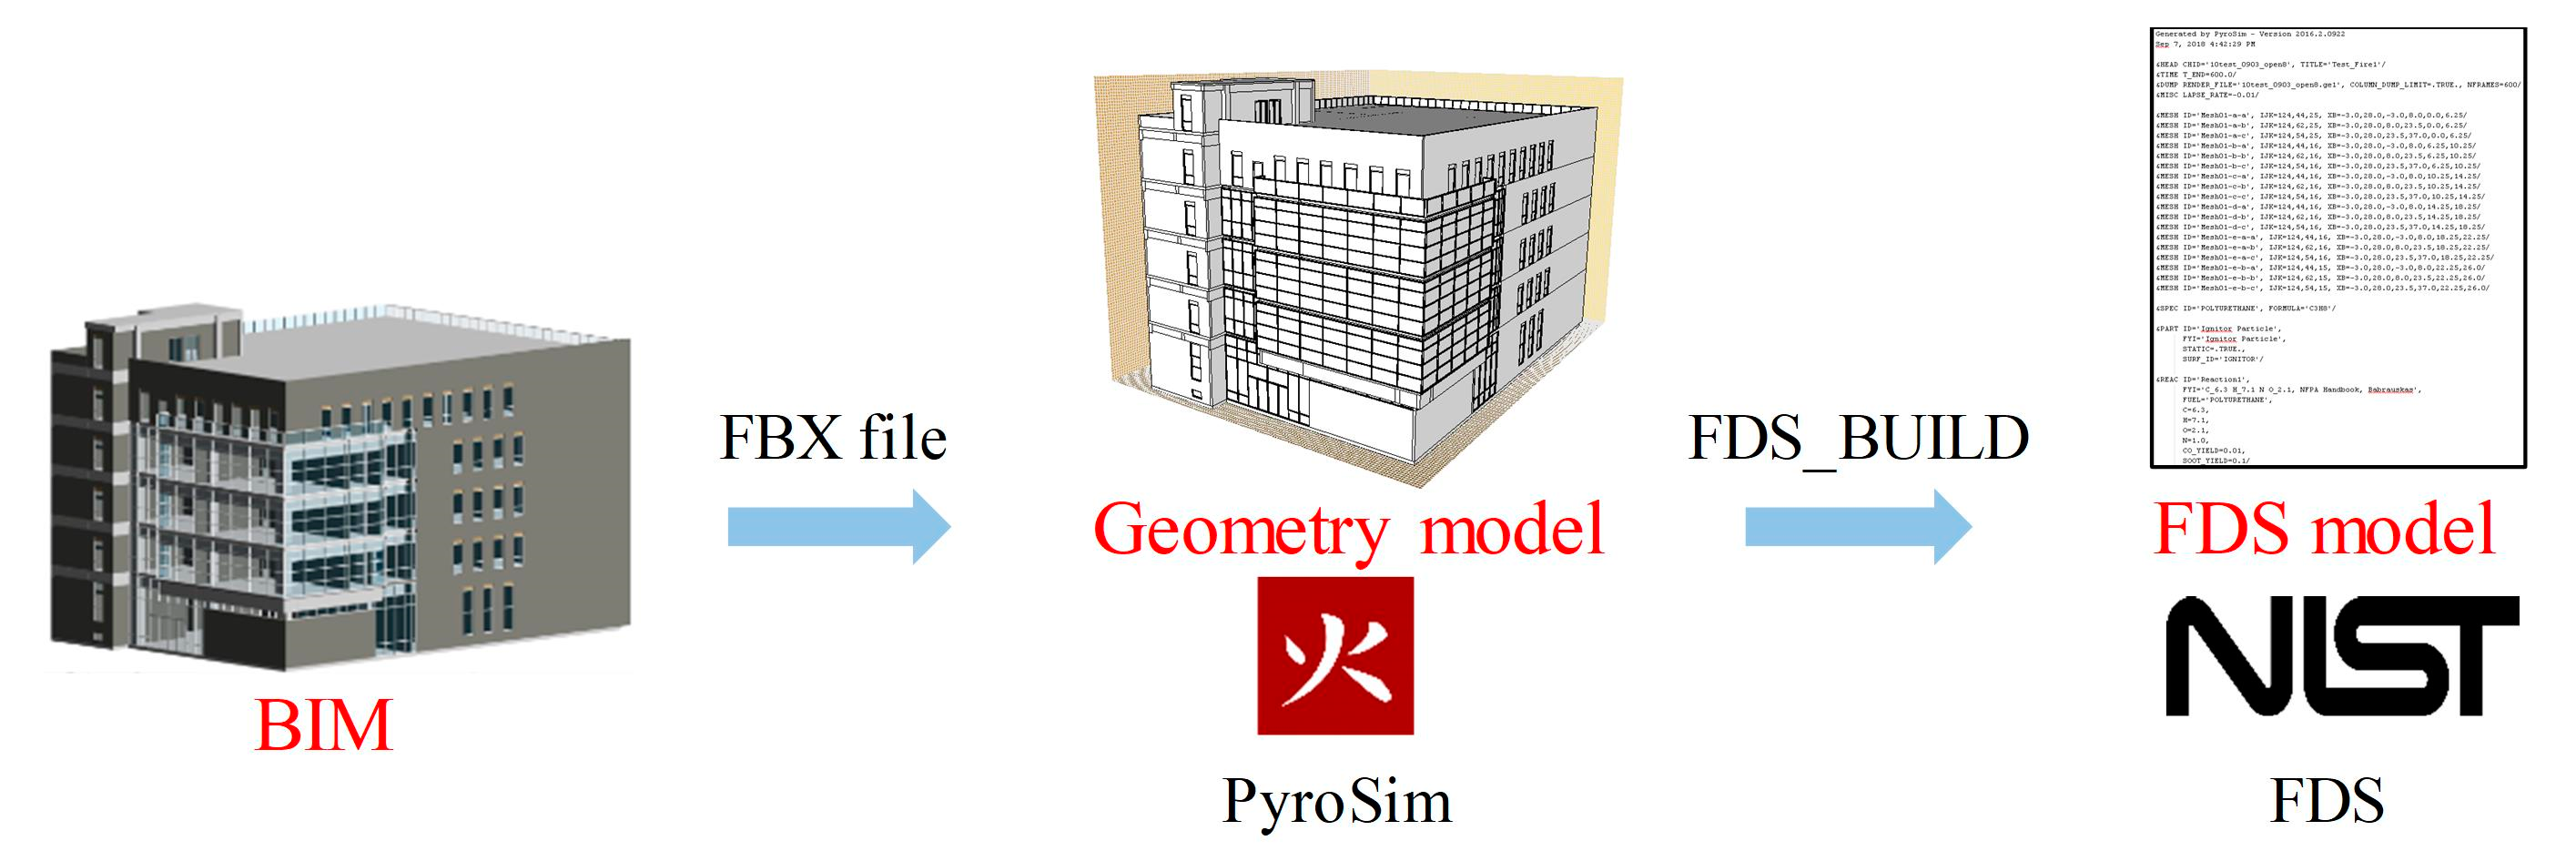
3.1.2. Fire Simulation
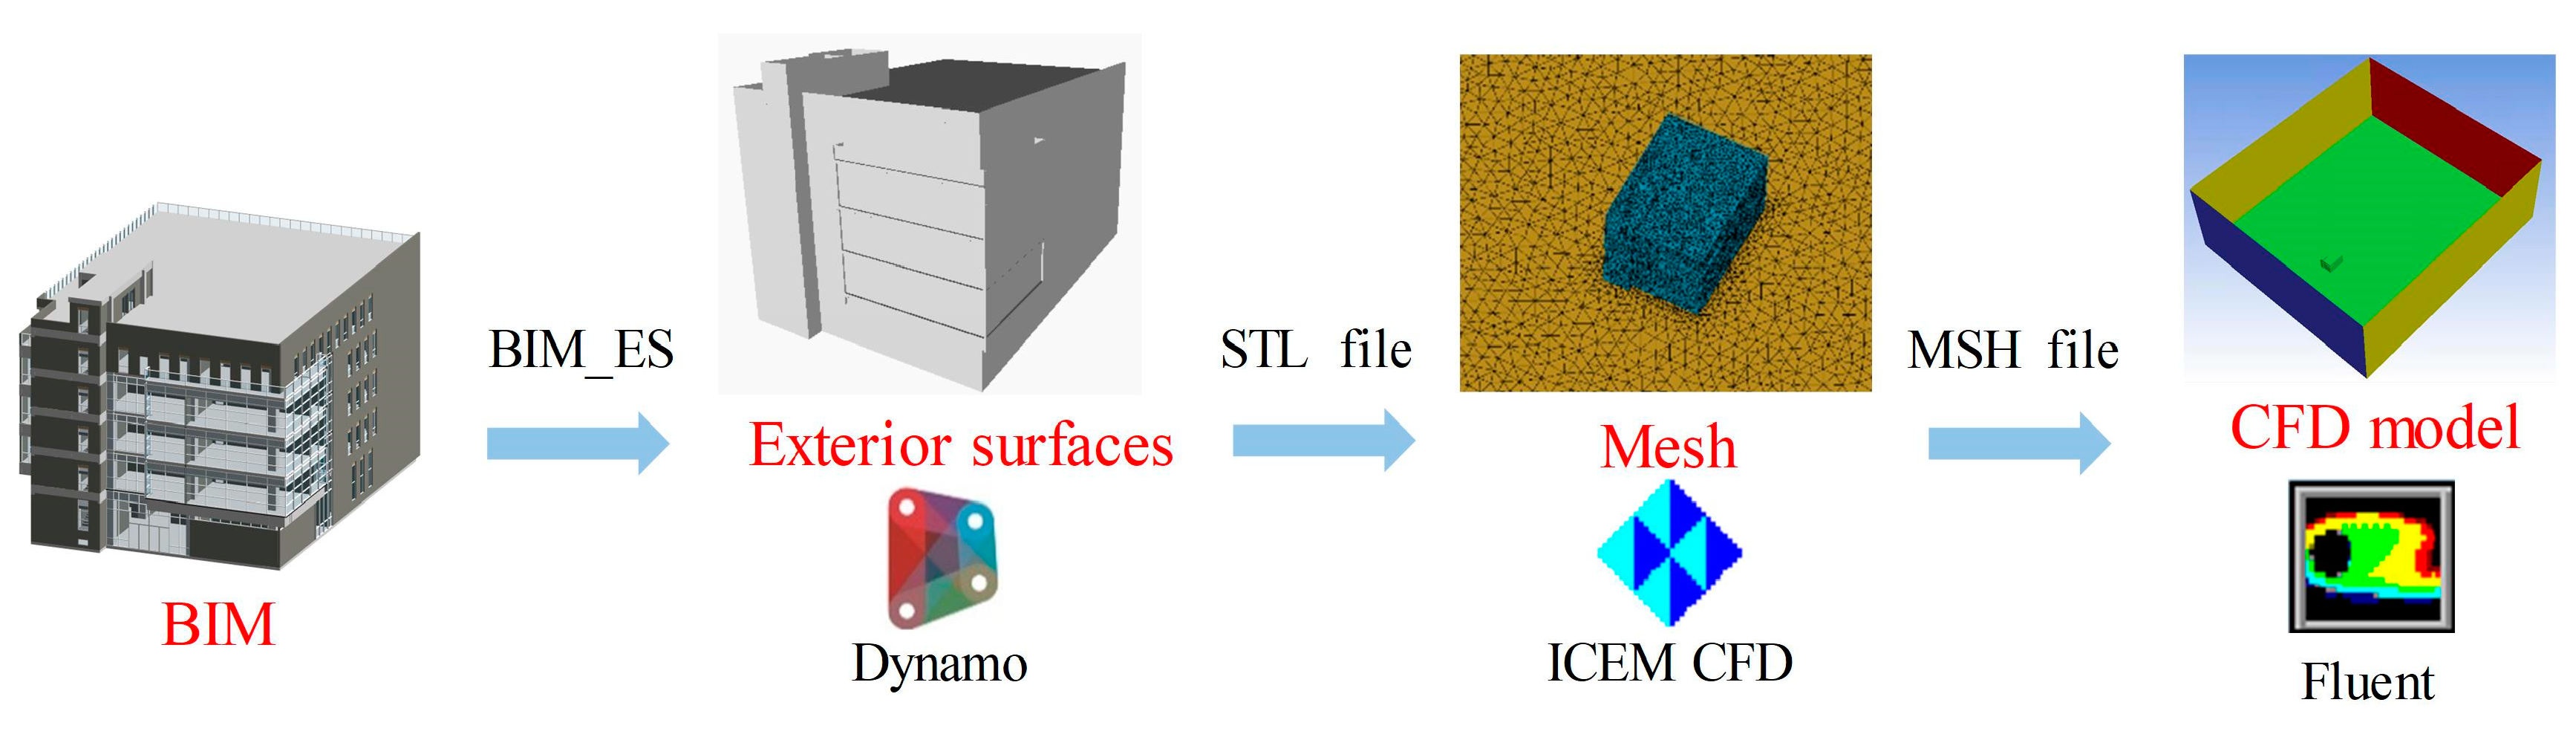
3.1.3. Wind Simulation
3.2. Urban Area Case
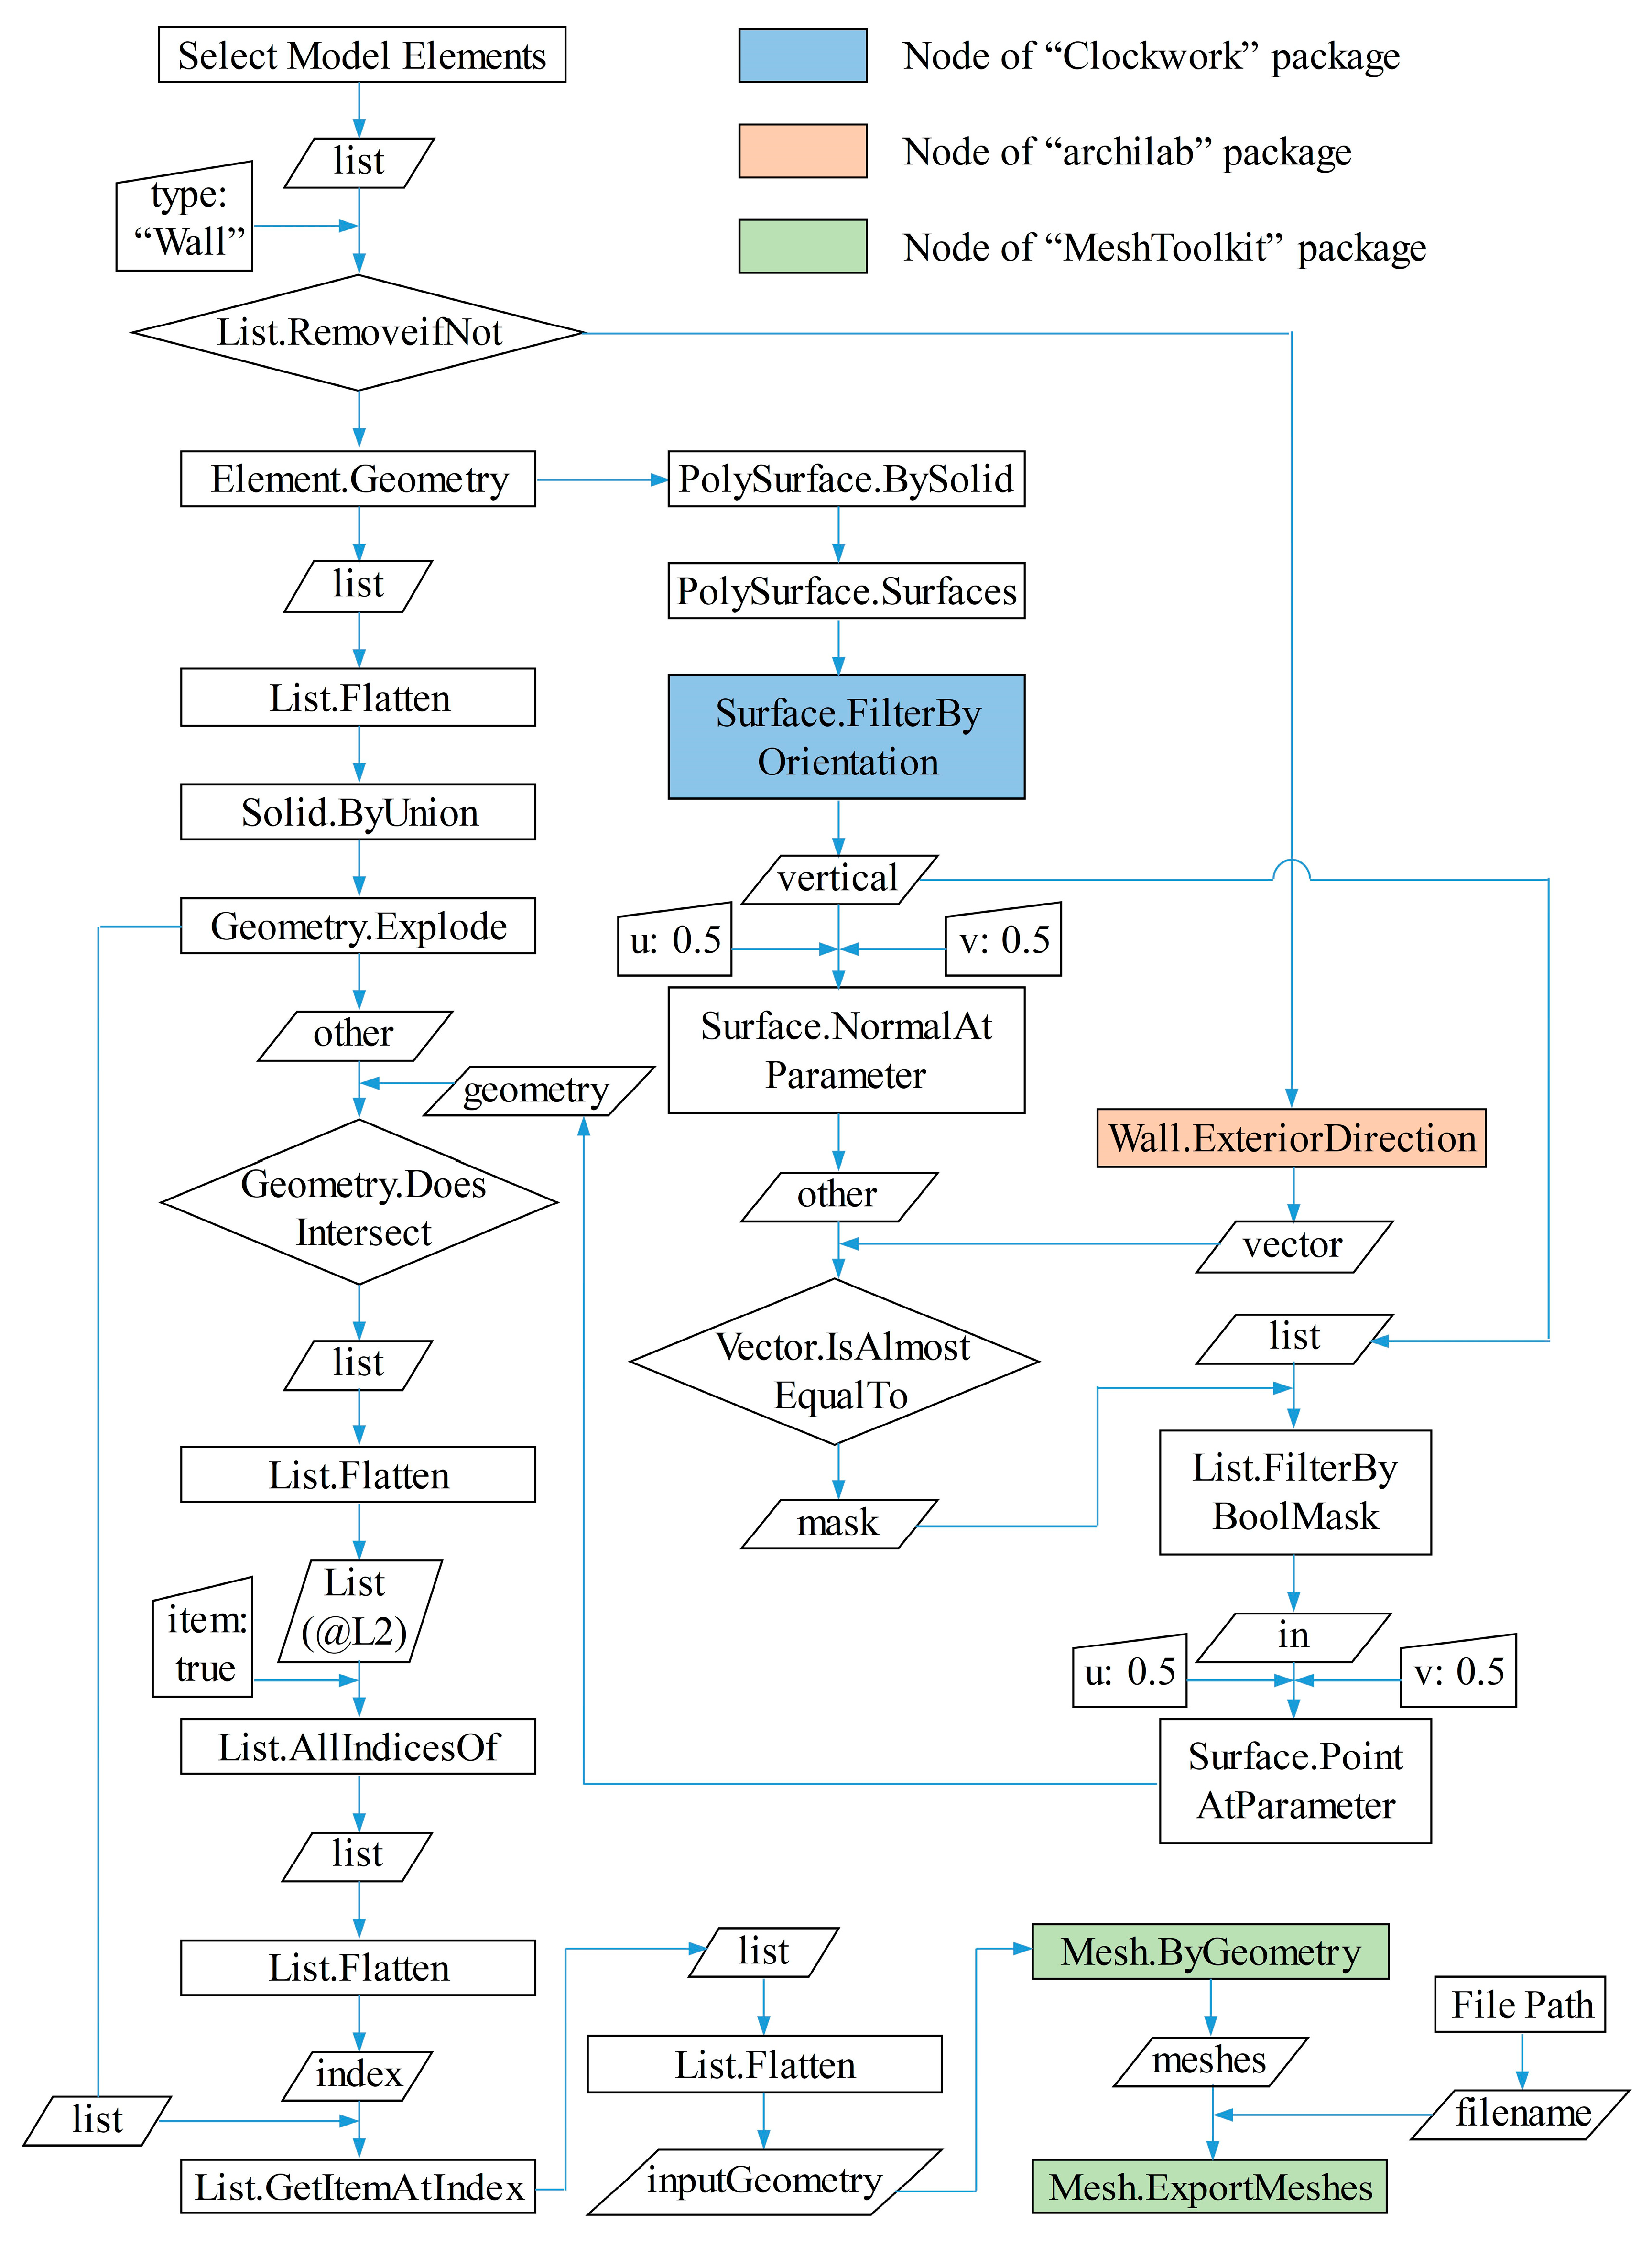
3.2.1. Earthquake Simulation
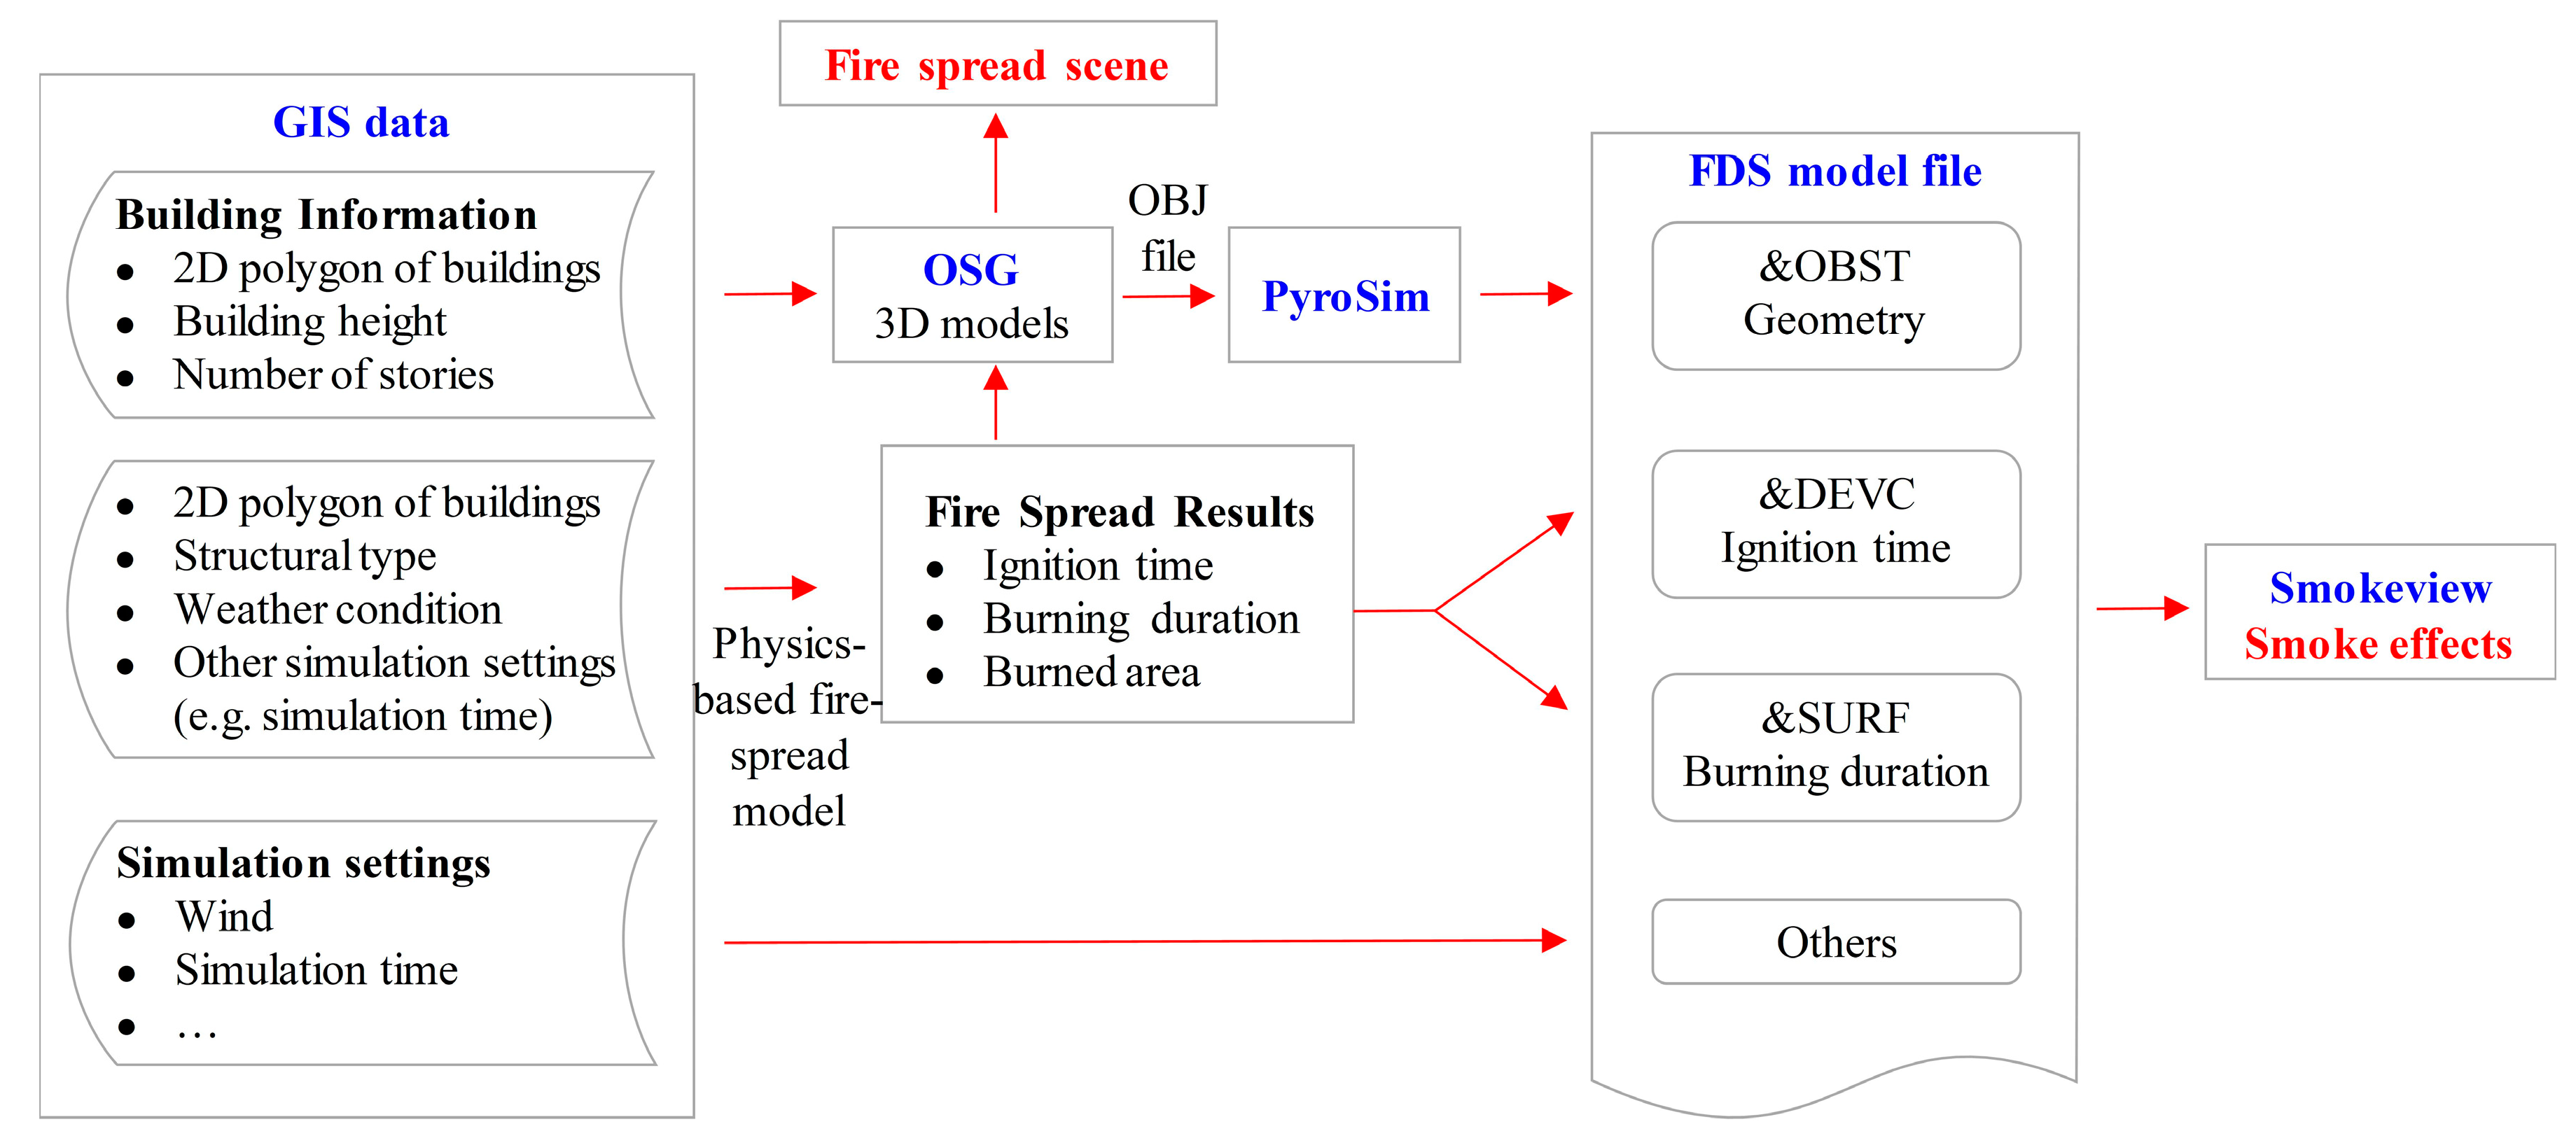
3.2.2. Fire Simulation
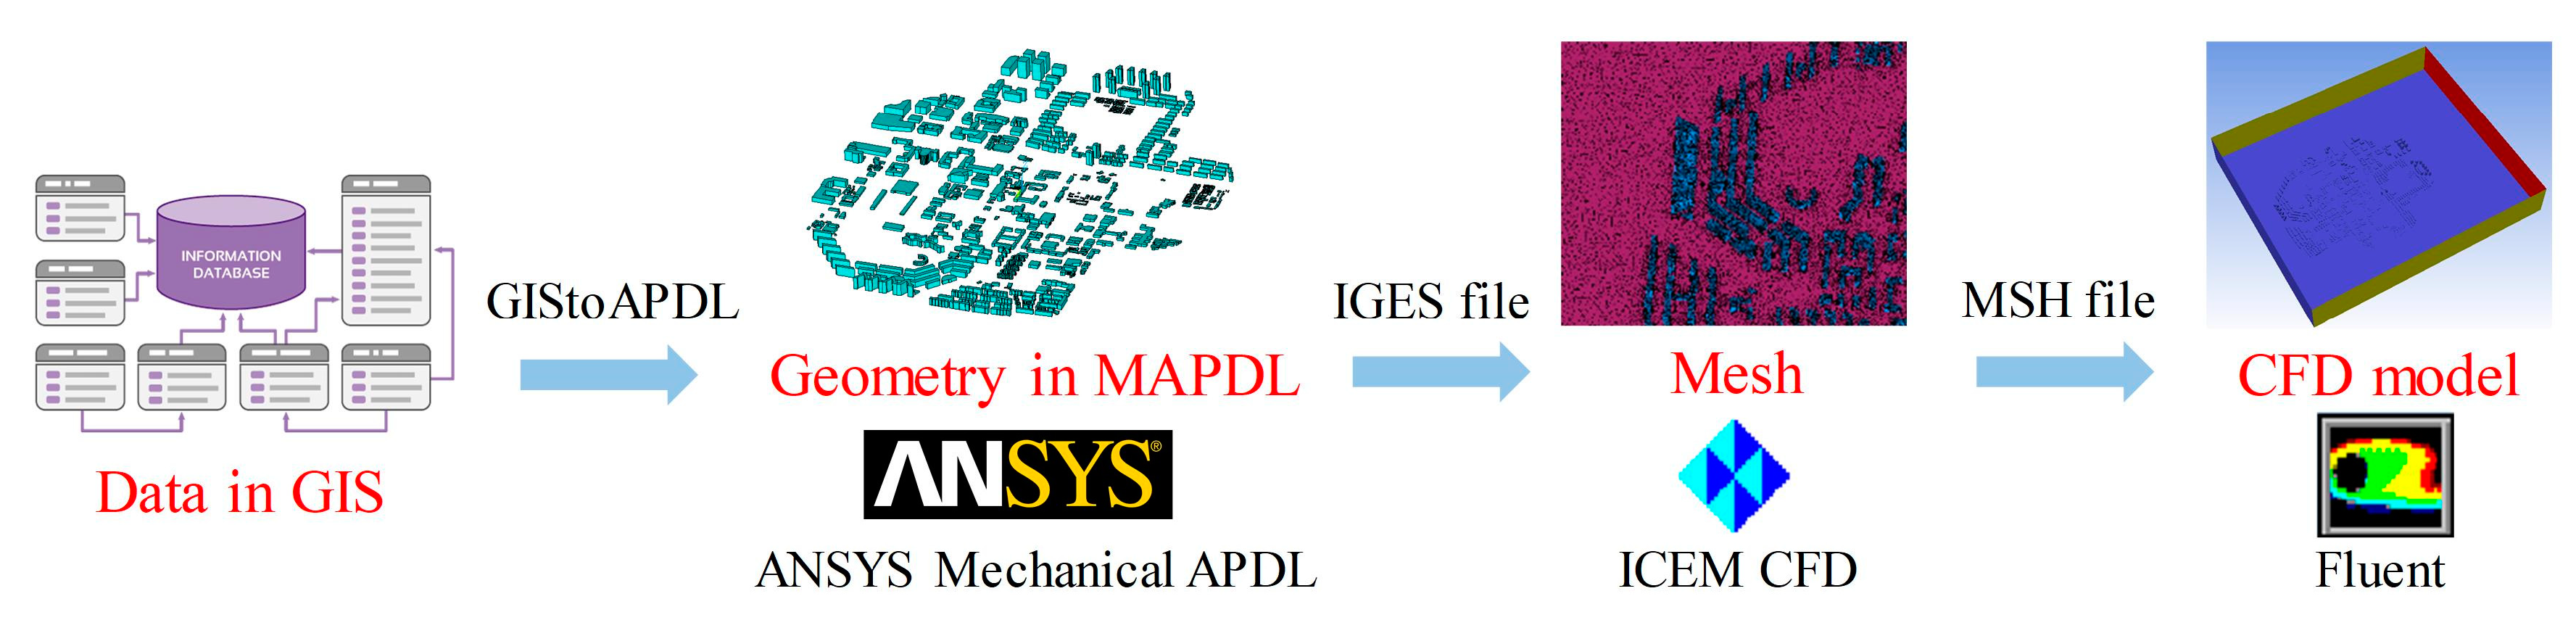
3.2.3. Wind Simulation
4. Case Study
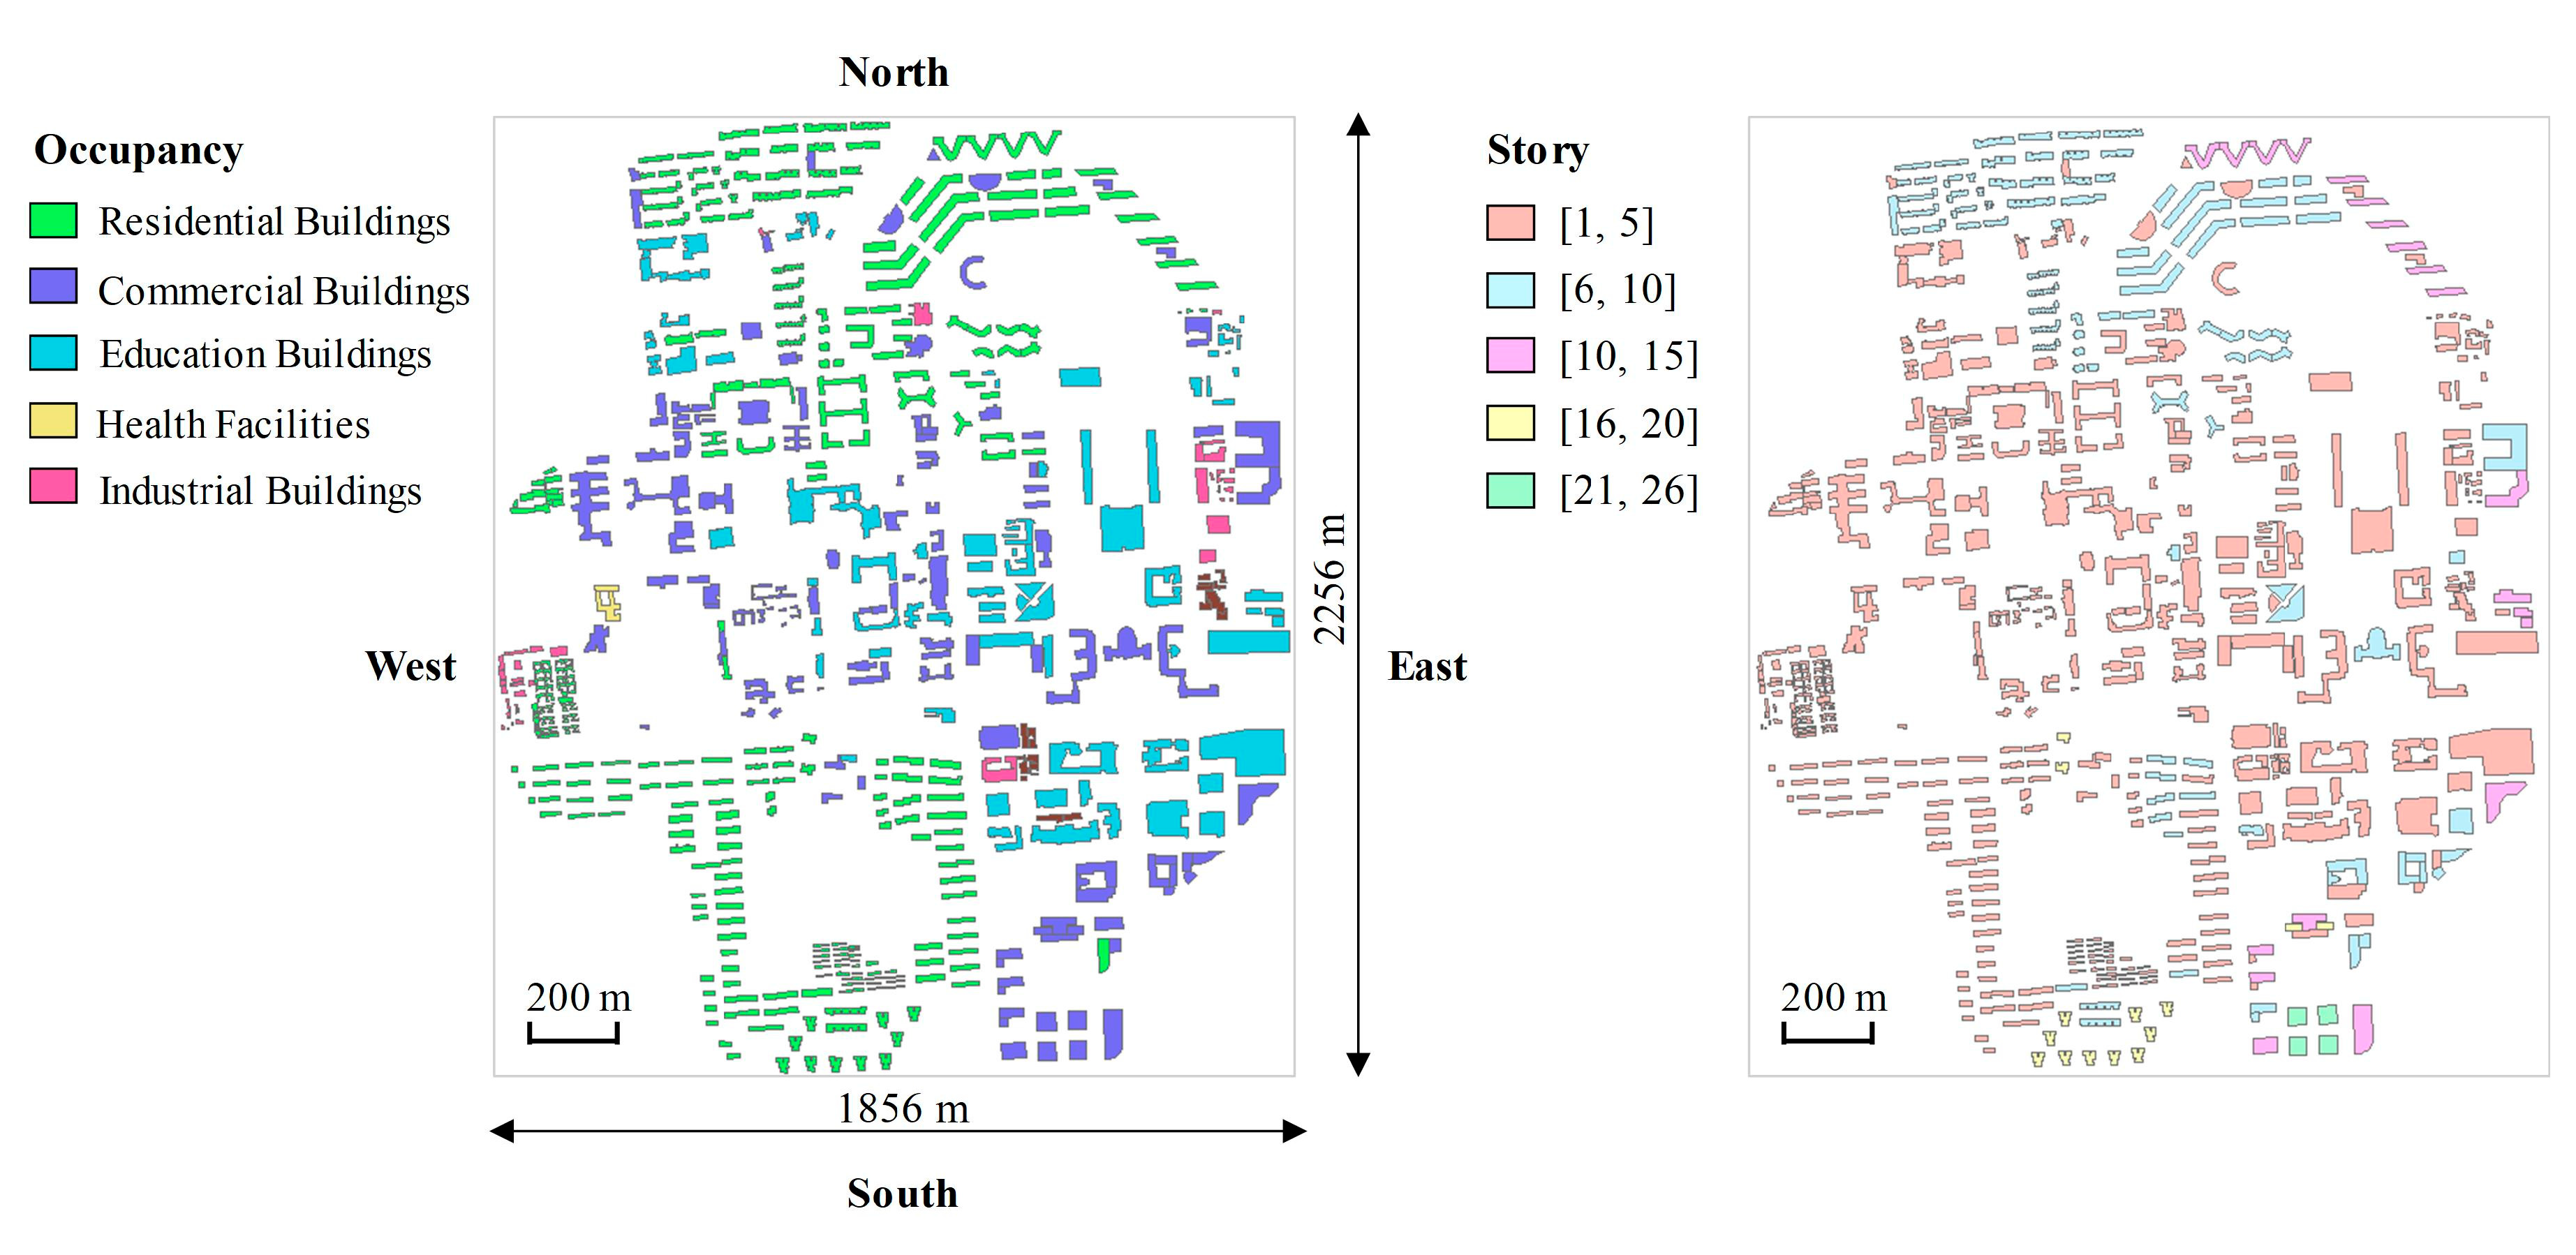
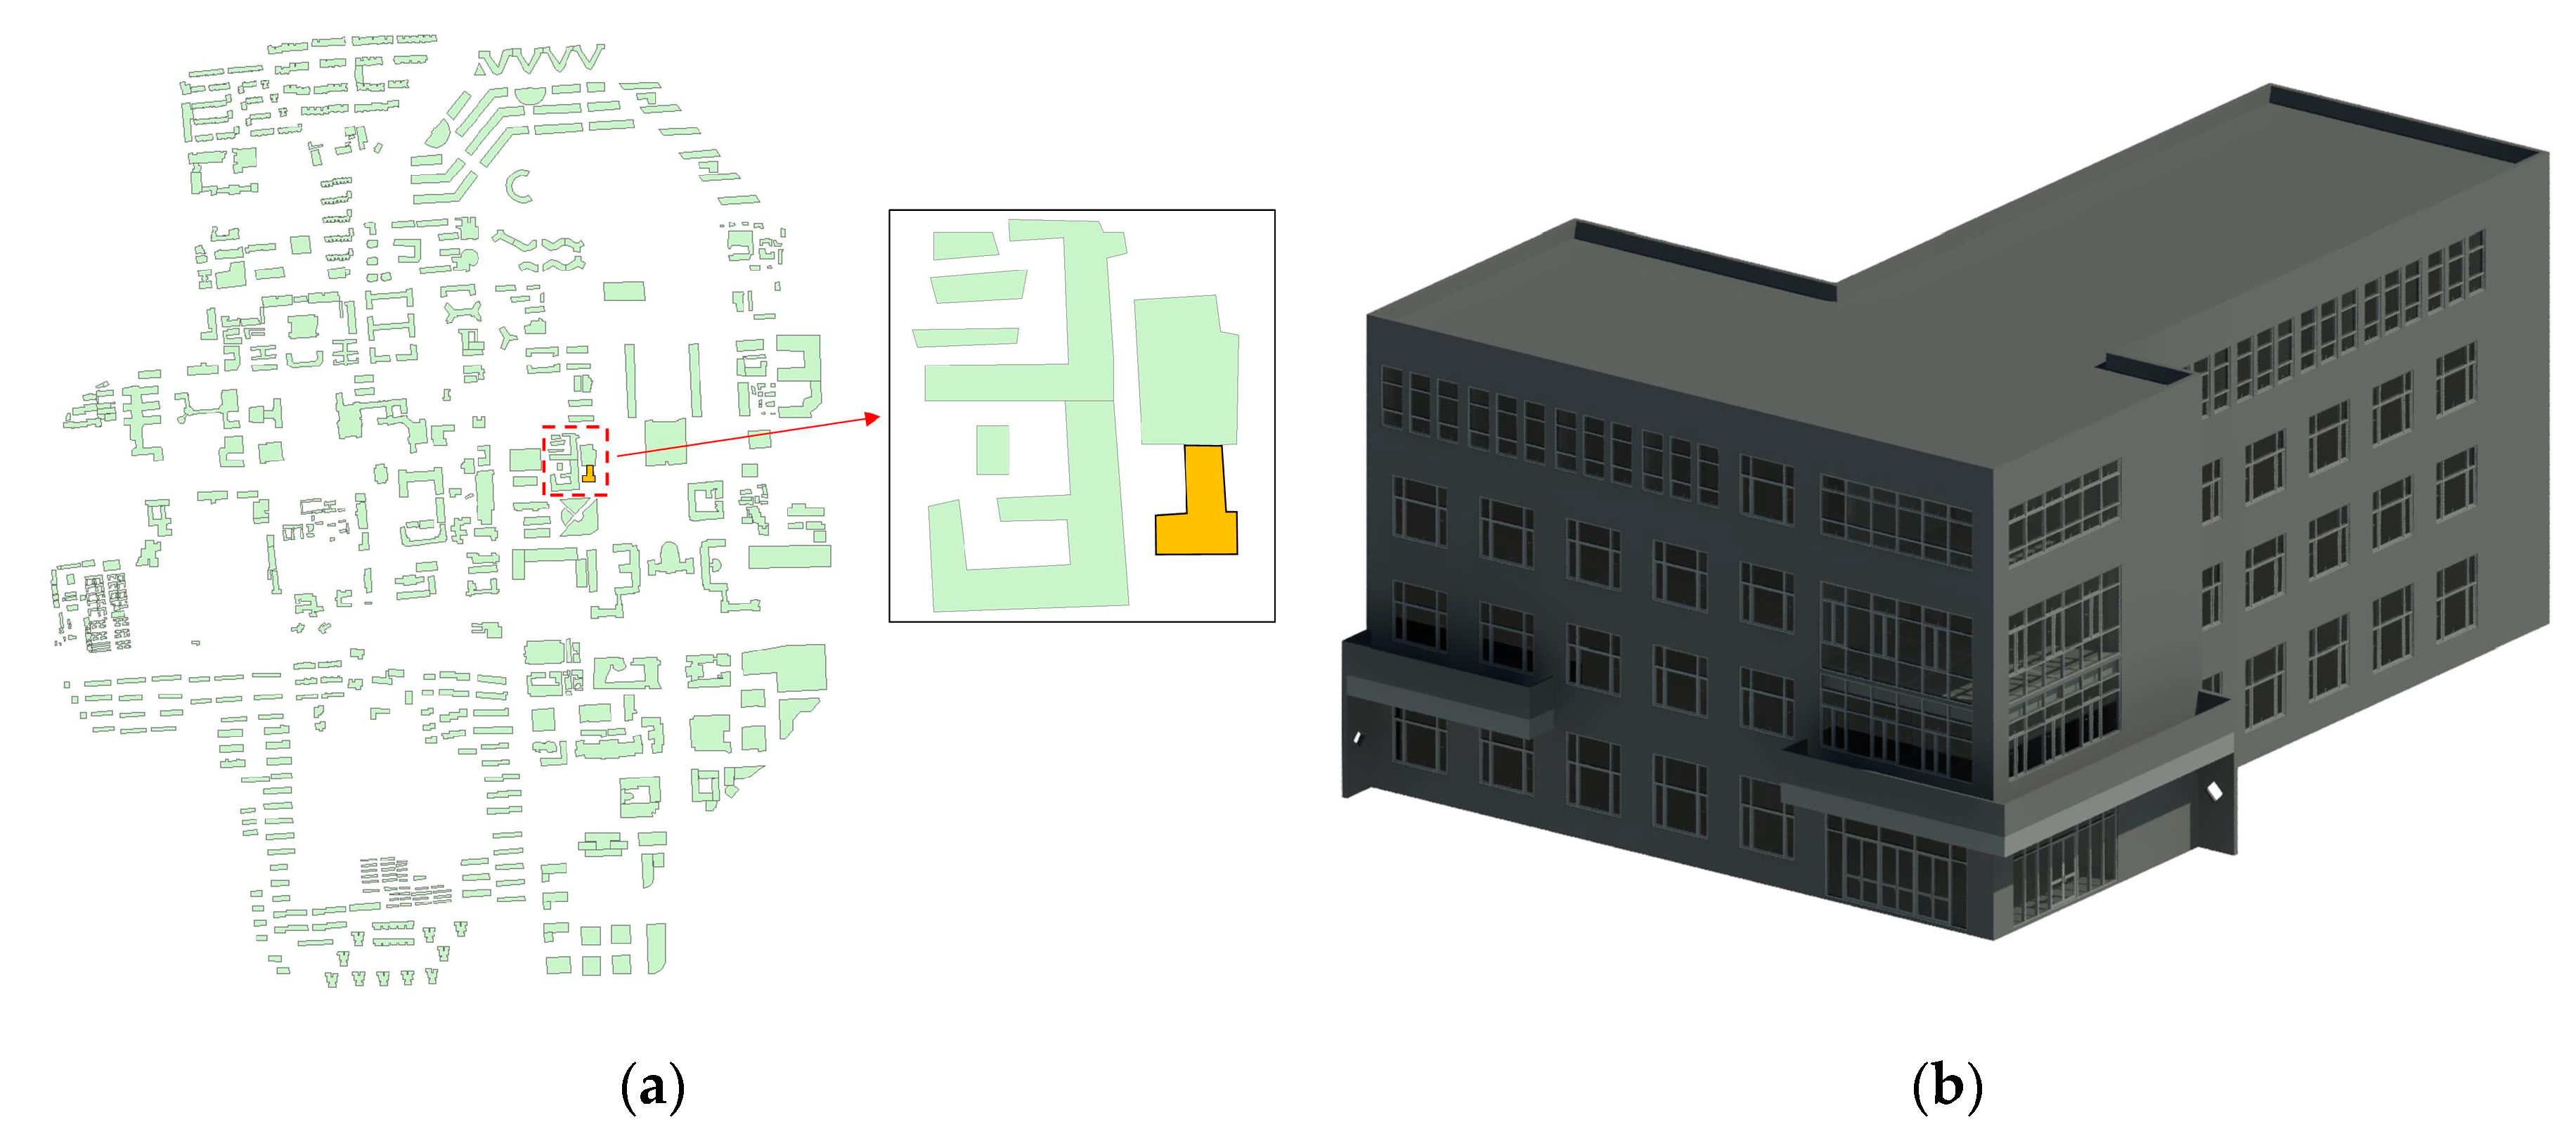
4.1. Study Area
4.2. Multi-Hazard Simulation of the Entire Campus
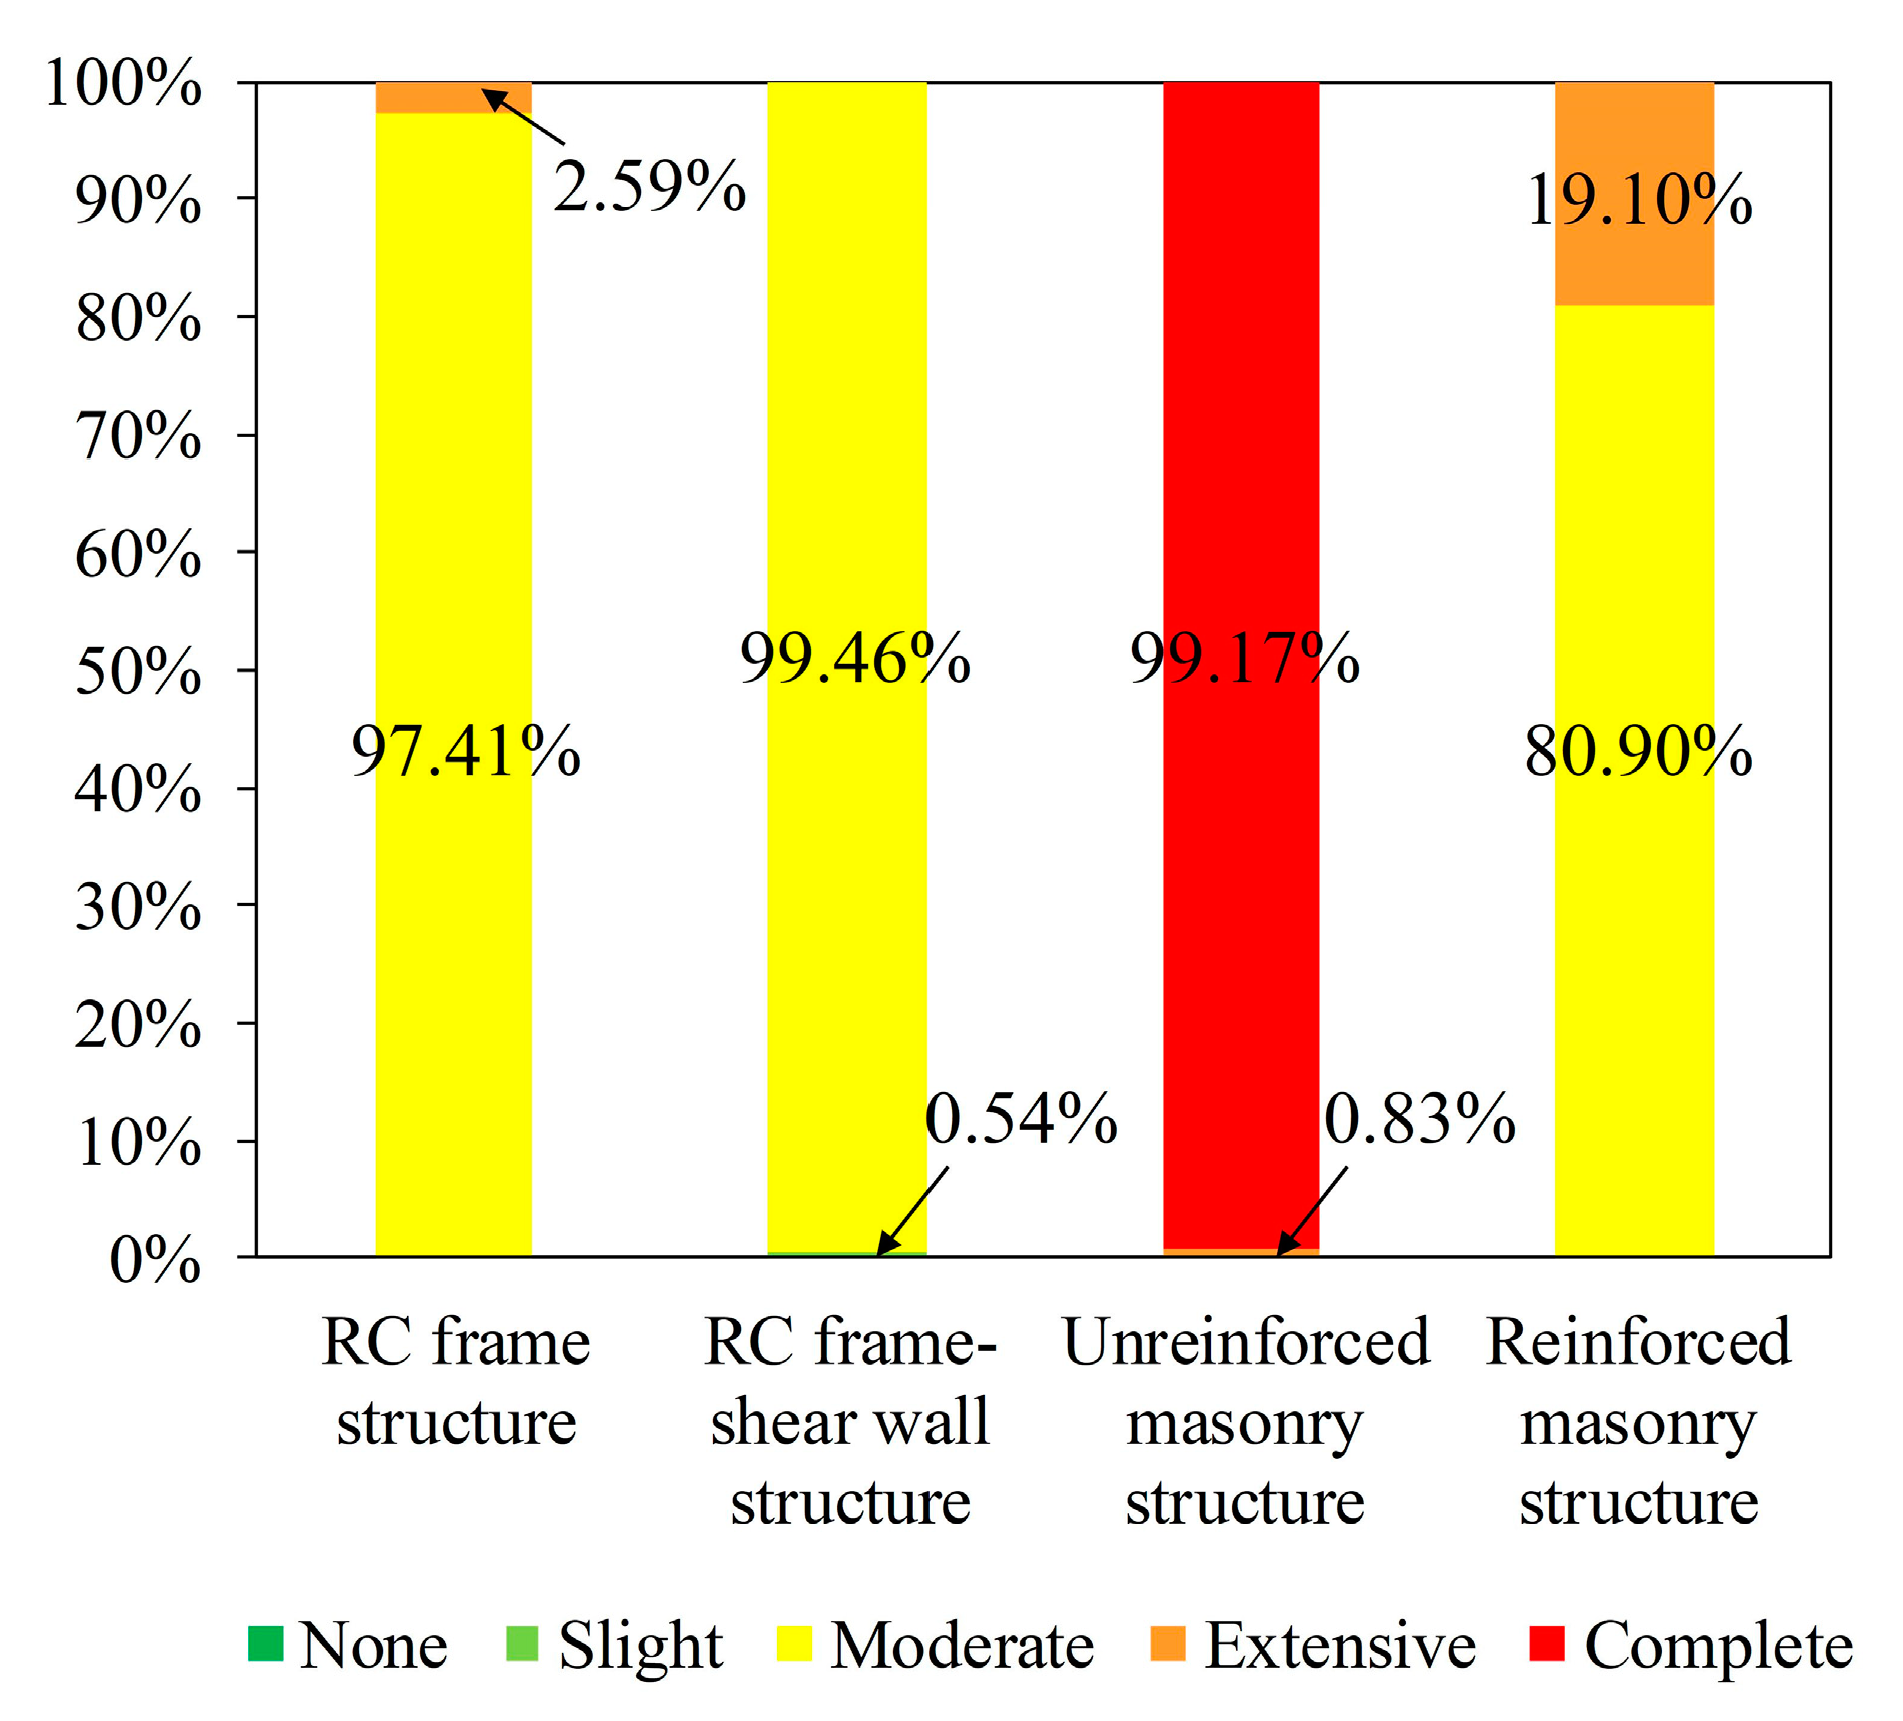
4.2.1. Earthquake Simulation
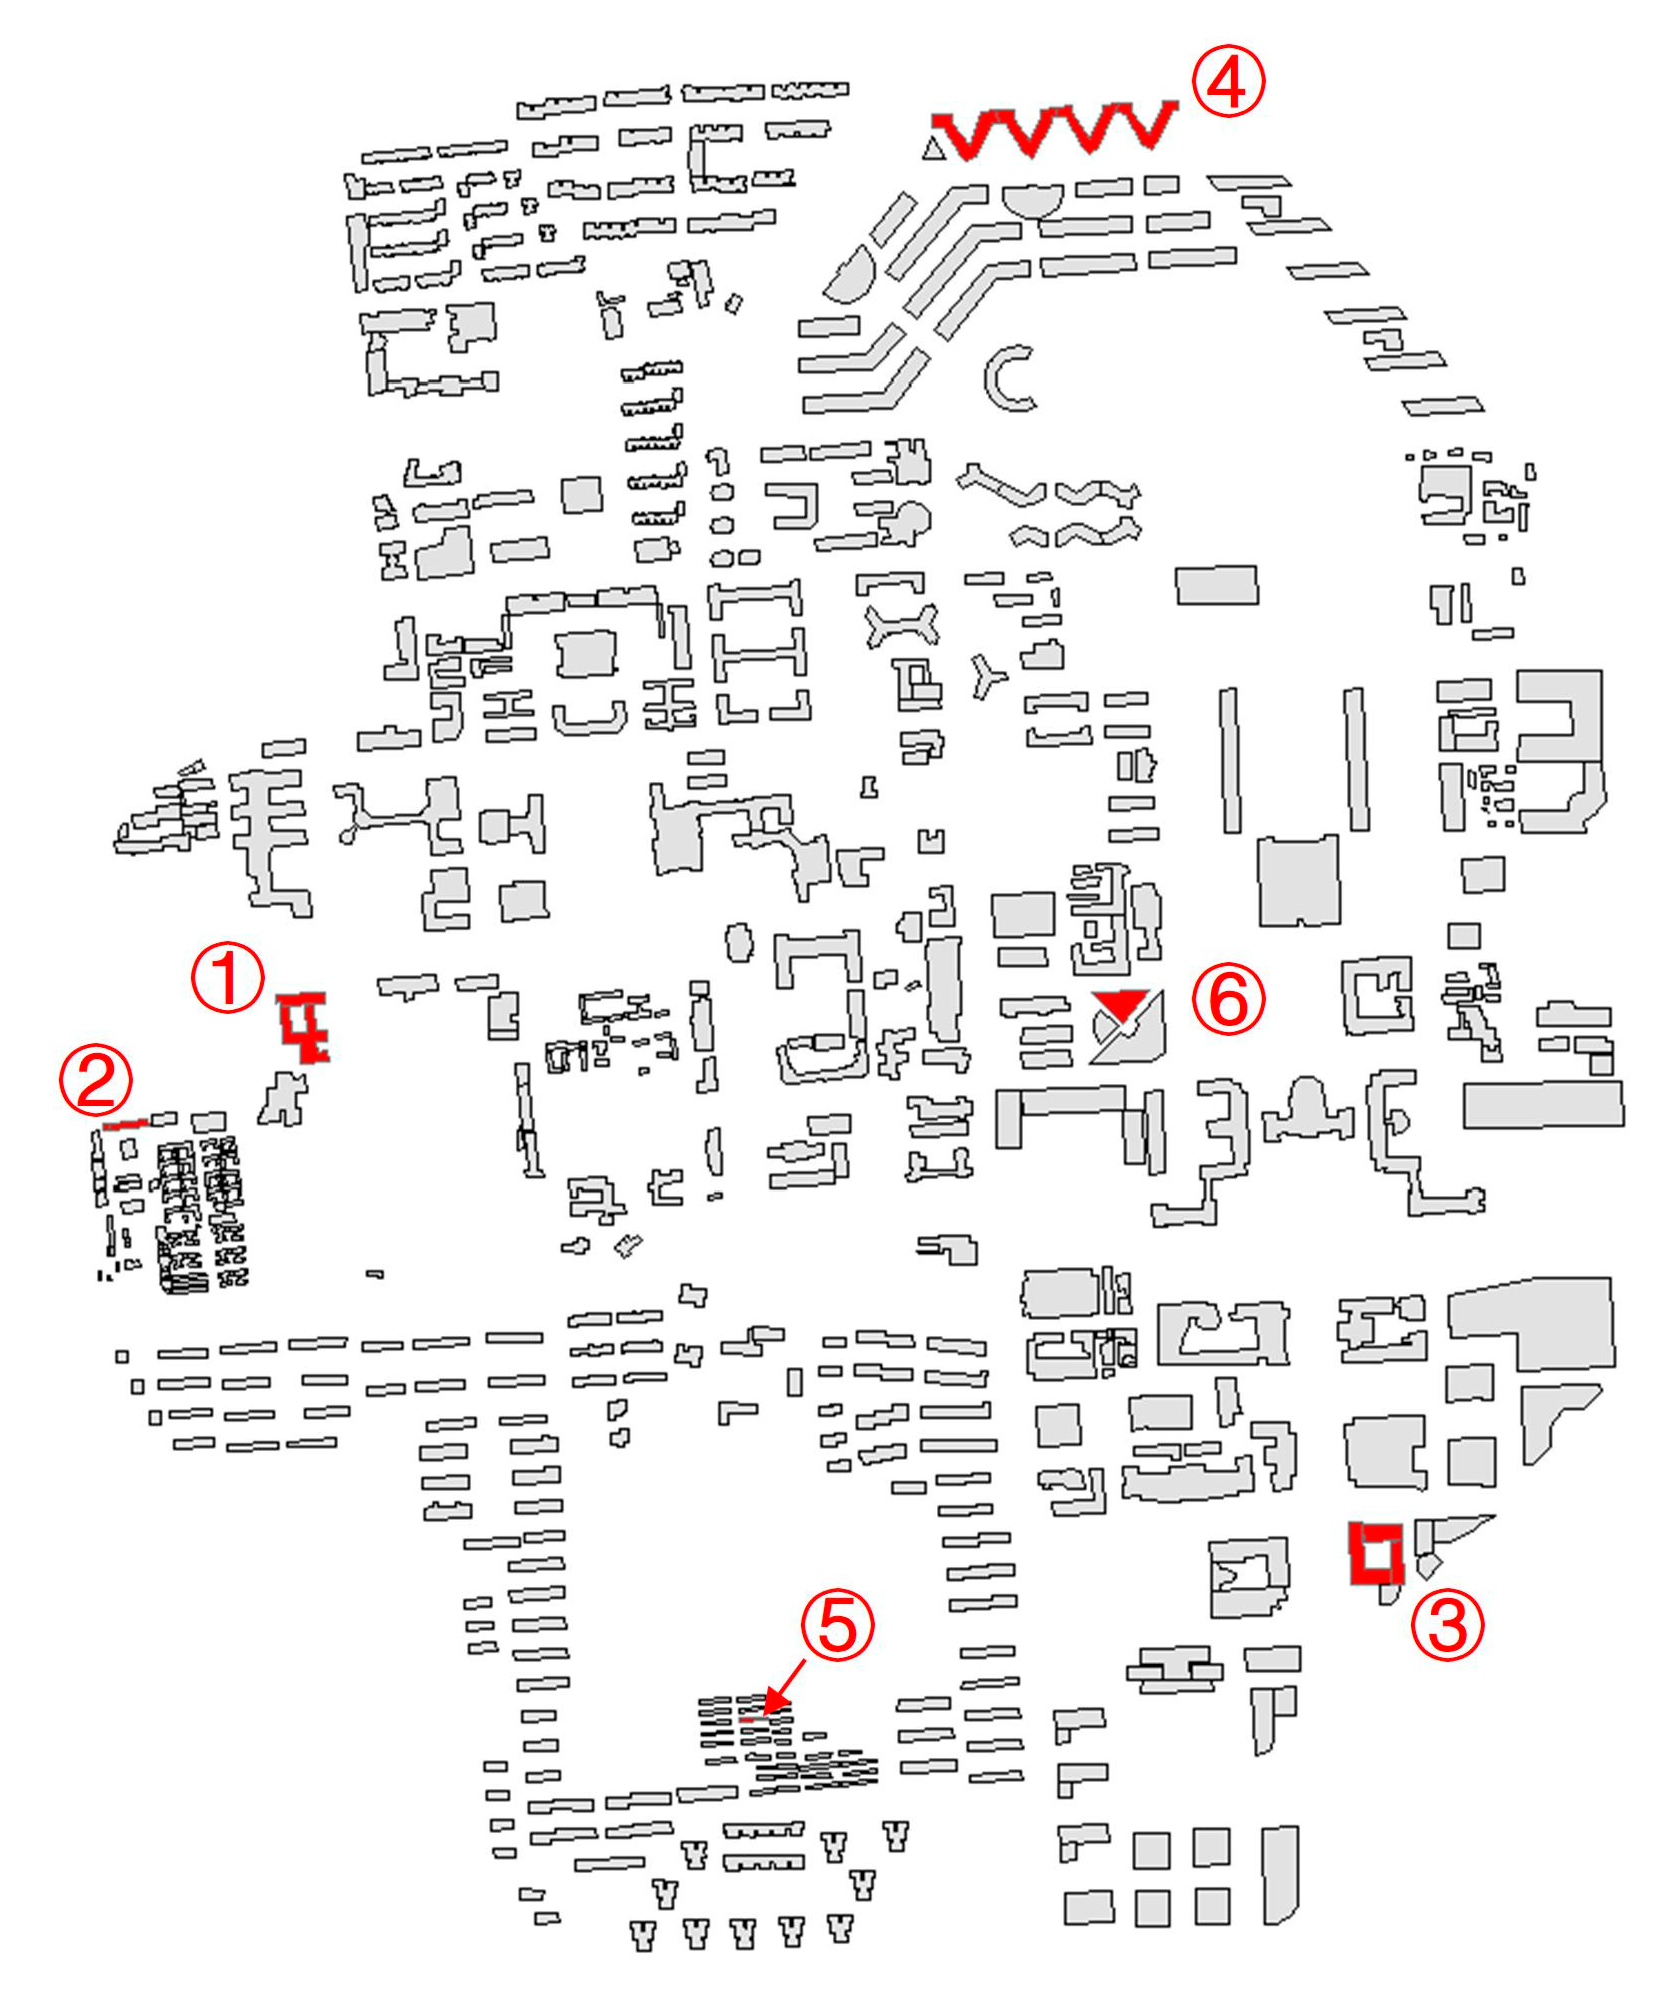
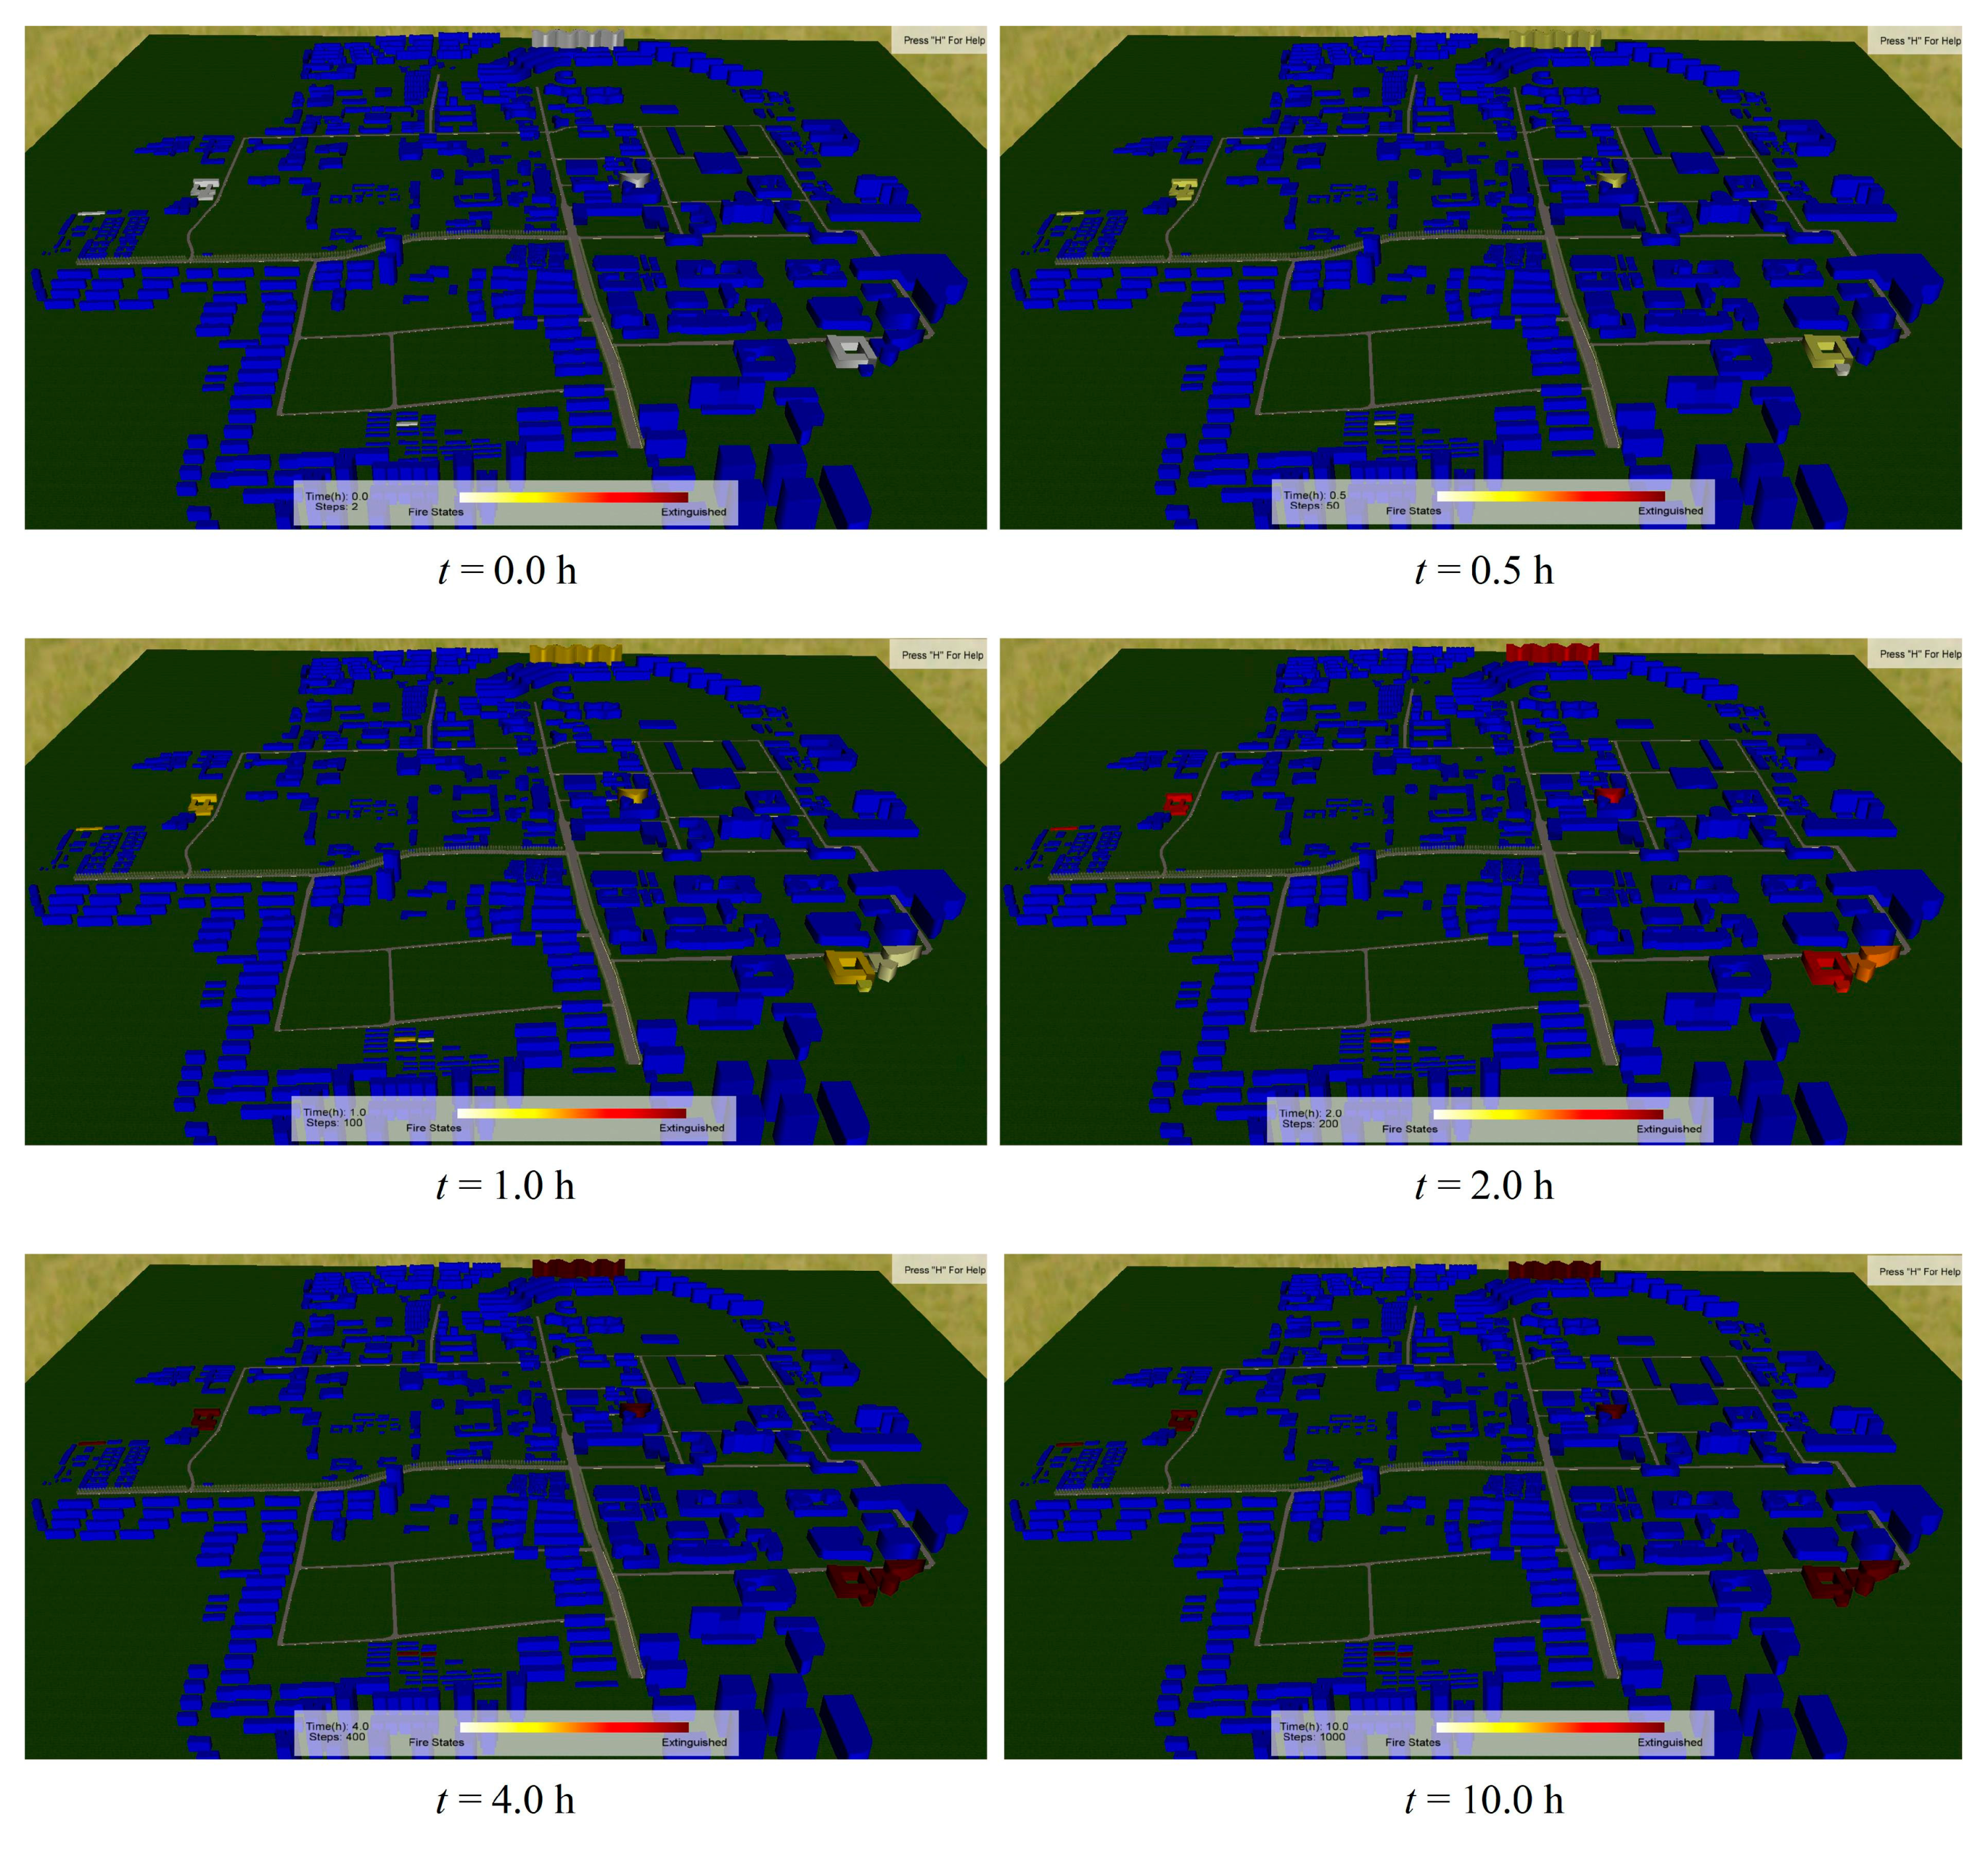
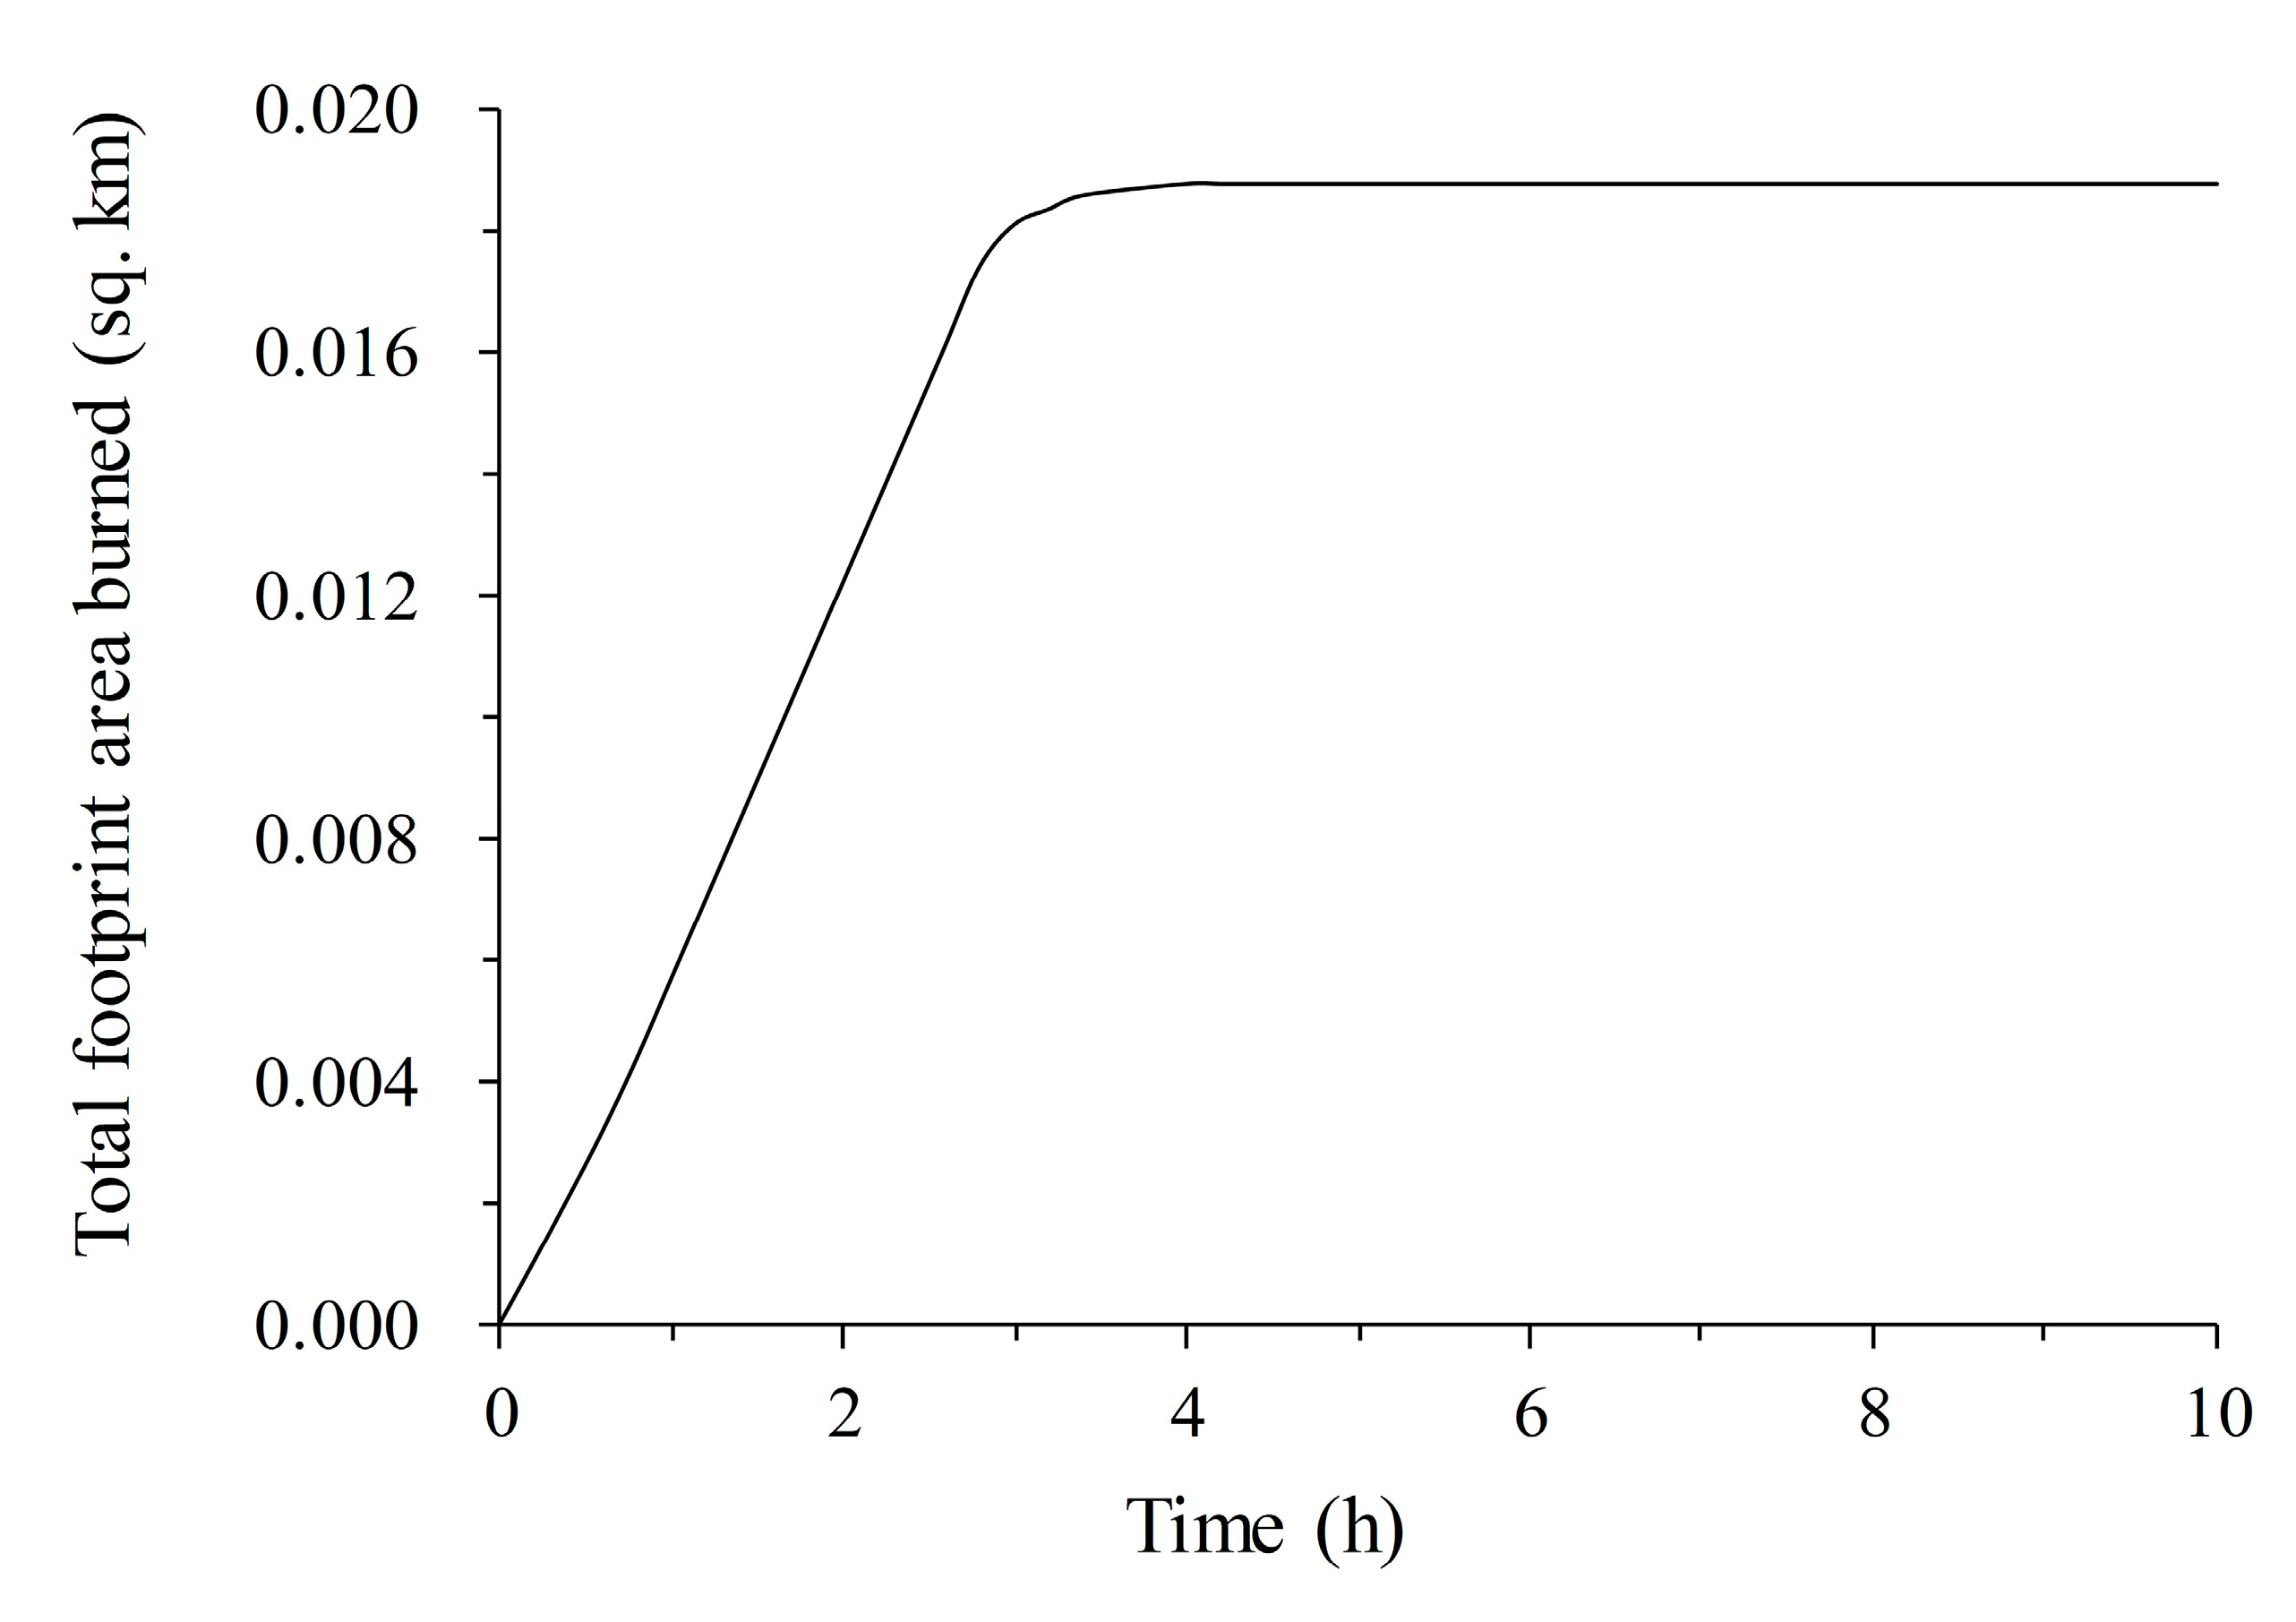
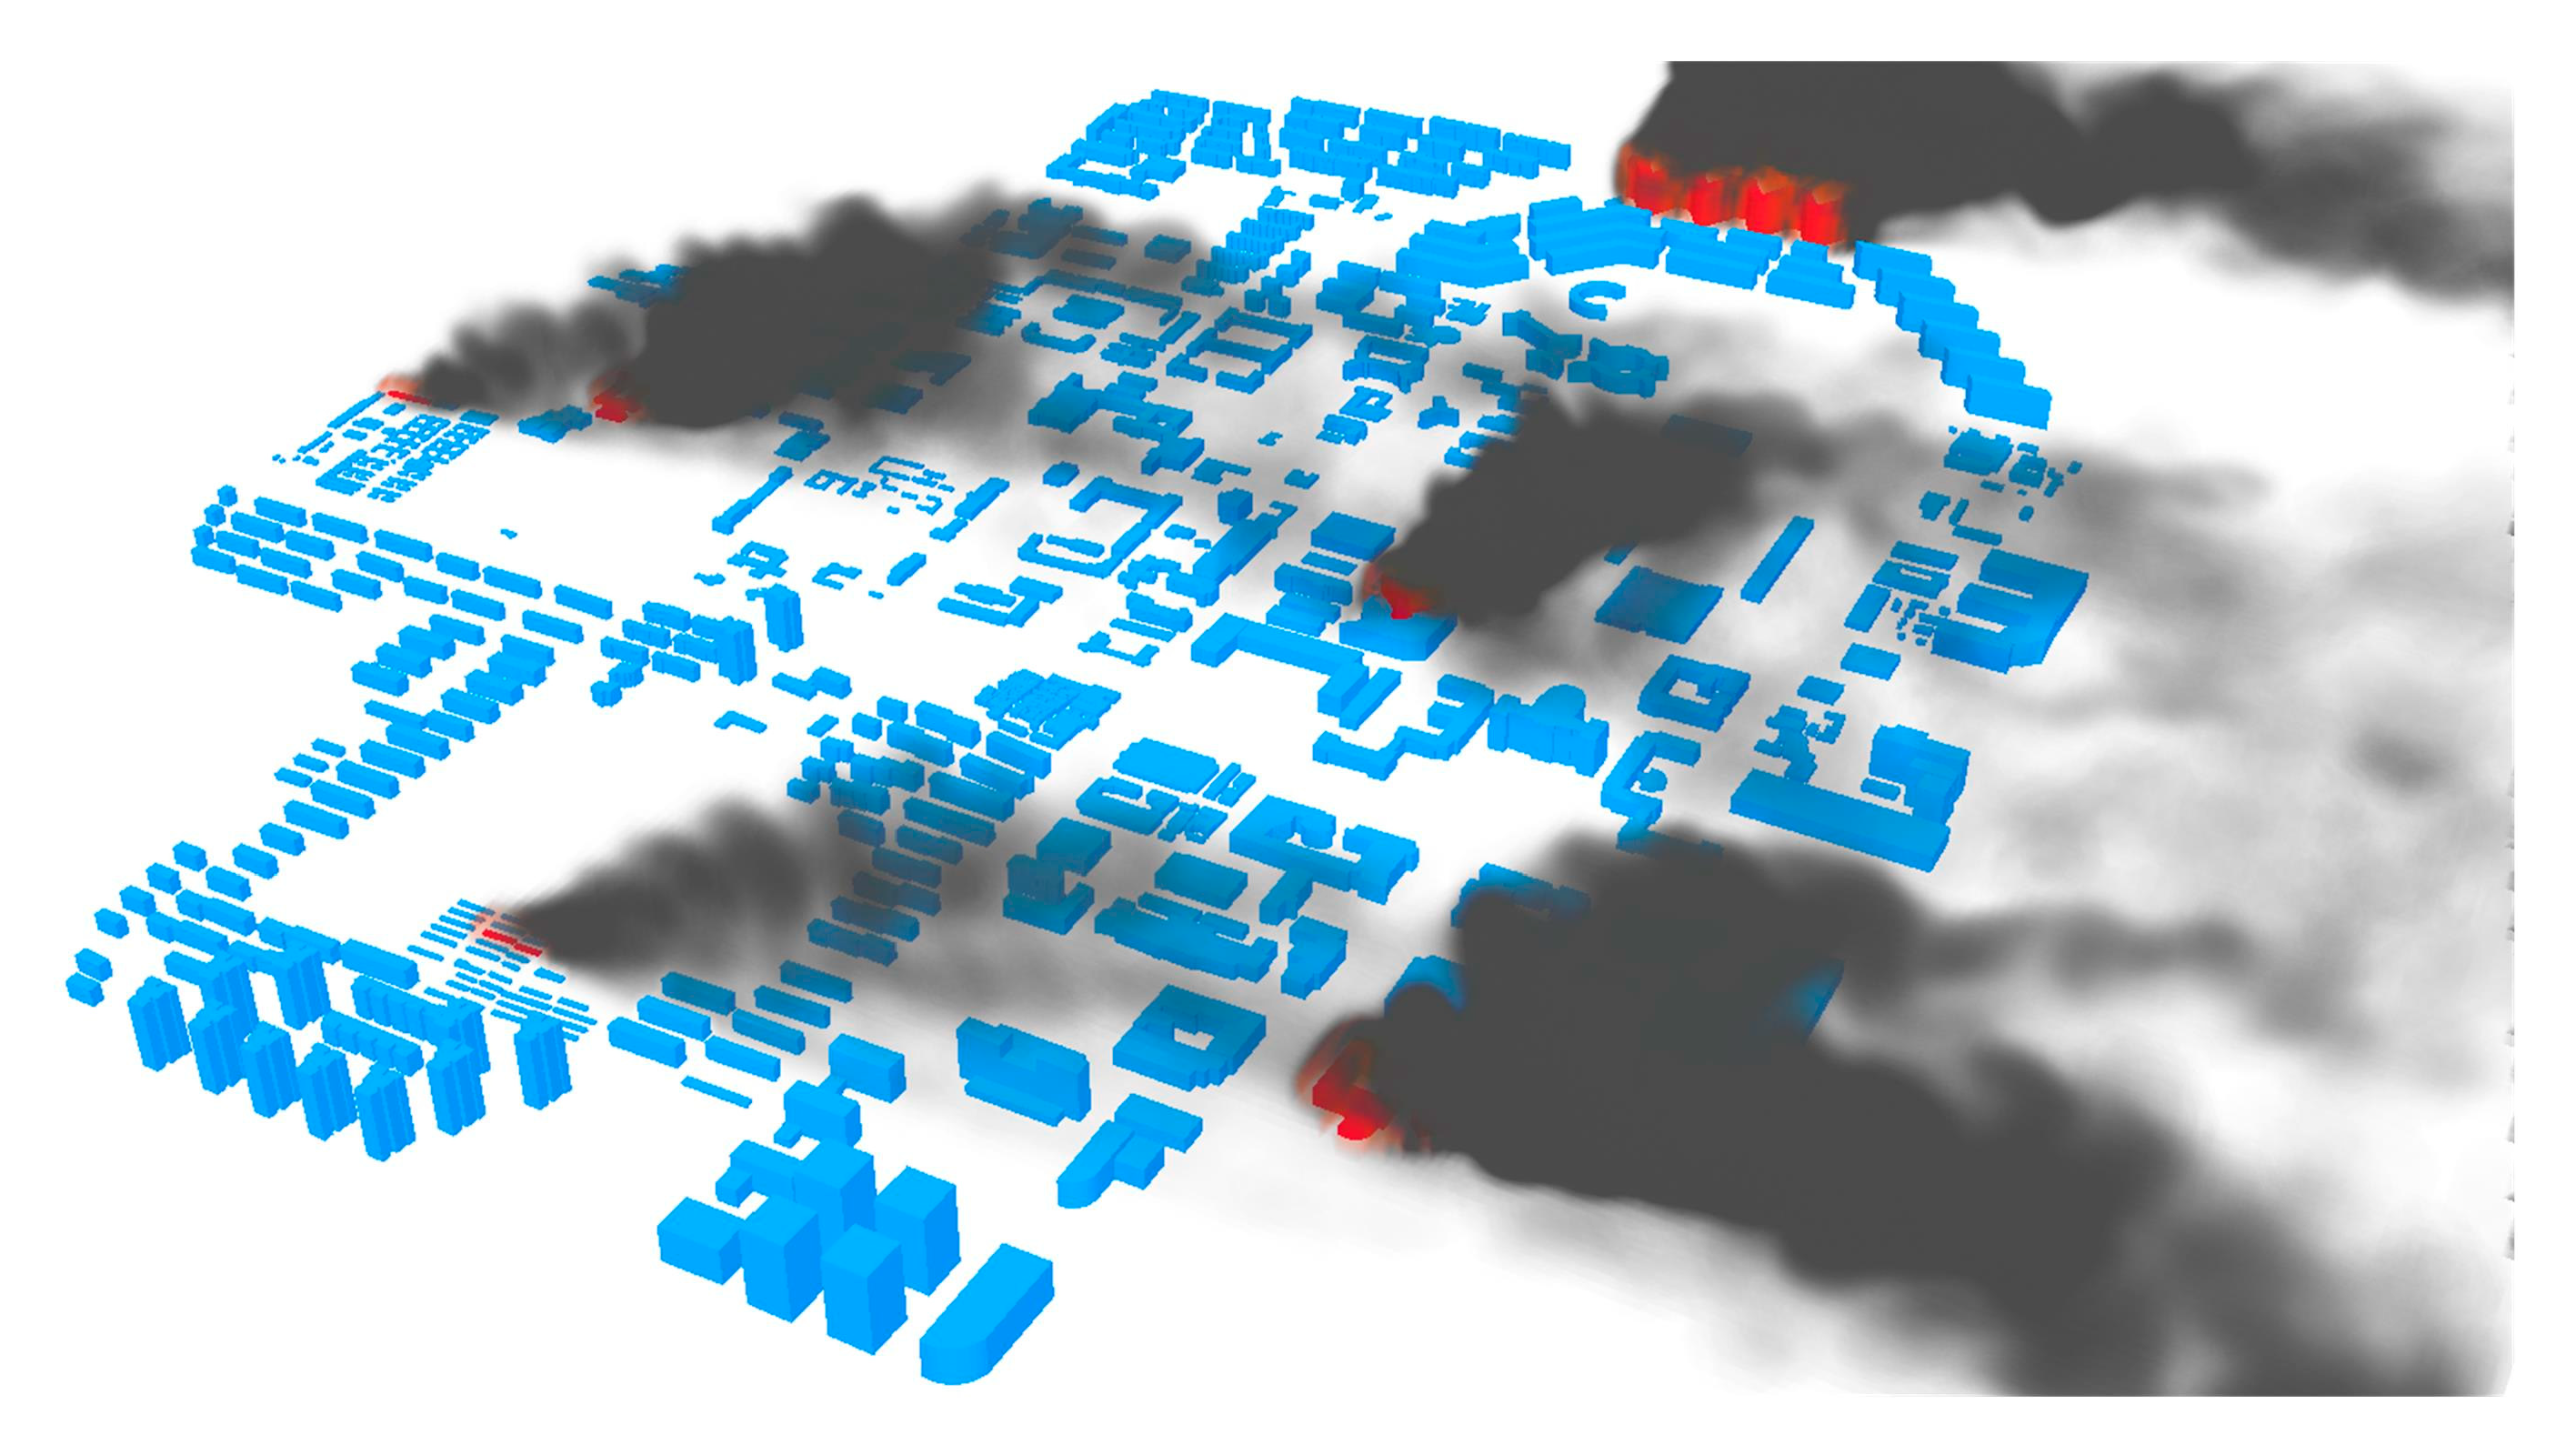
4.2.2. Fire Simulation
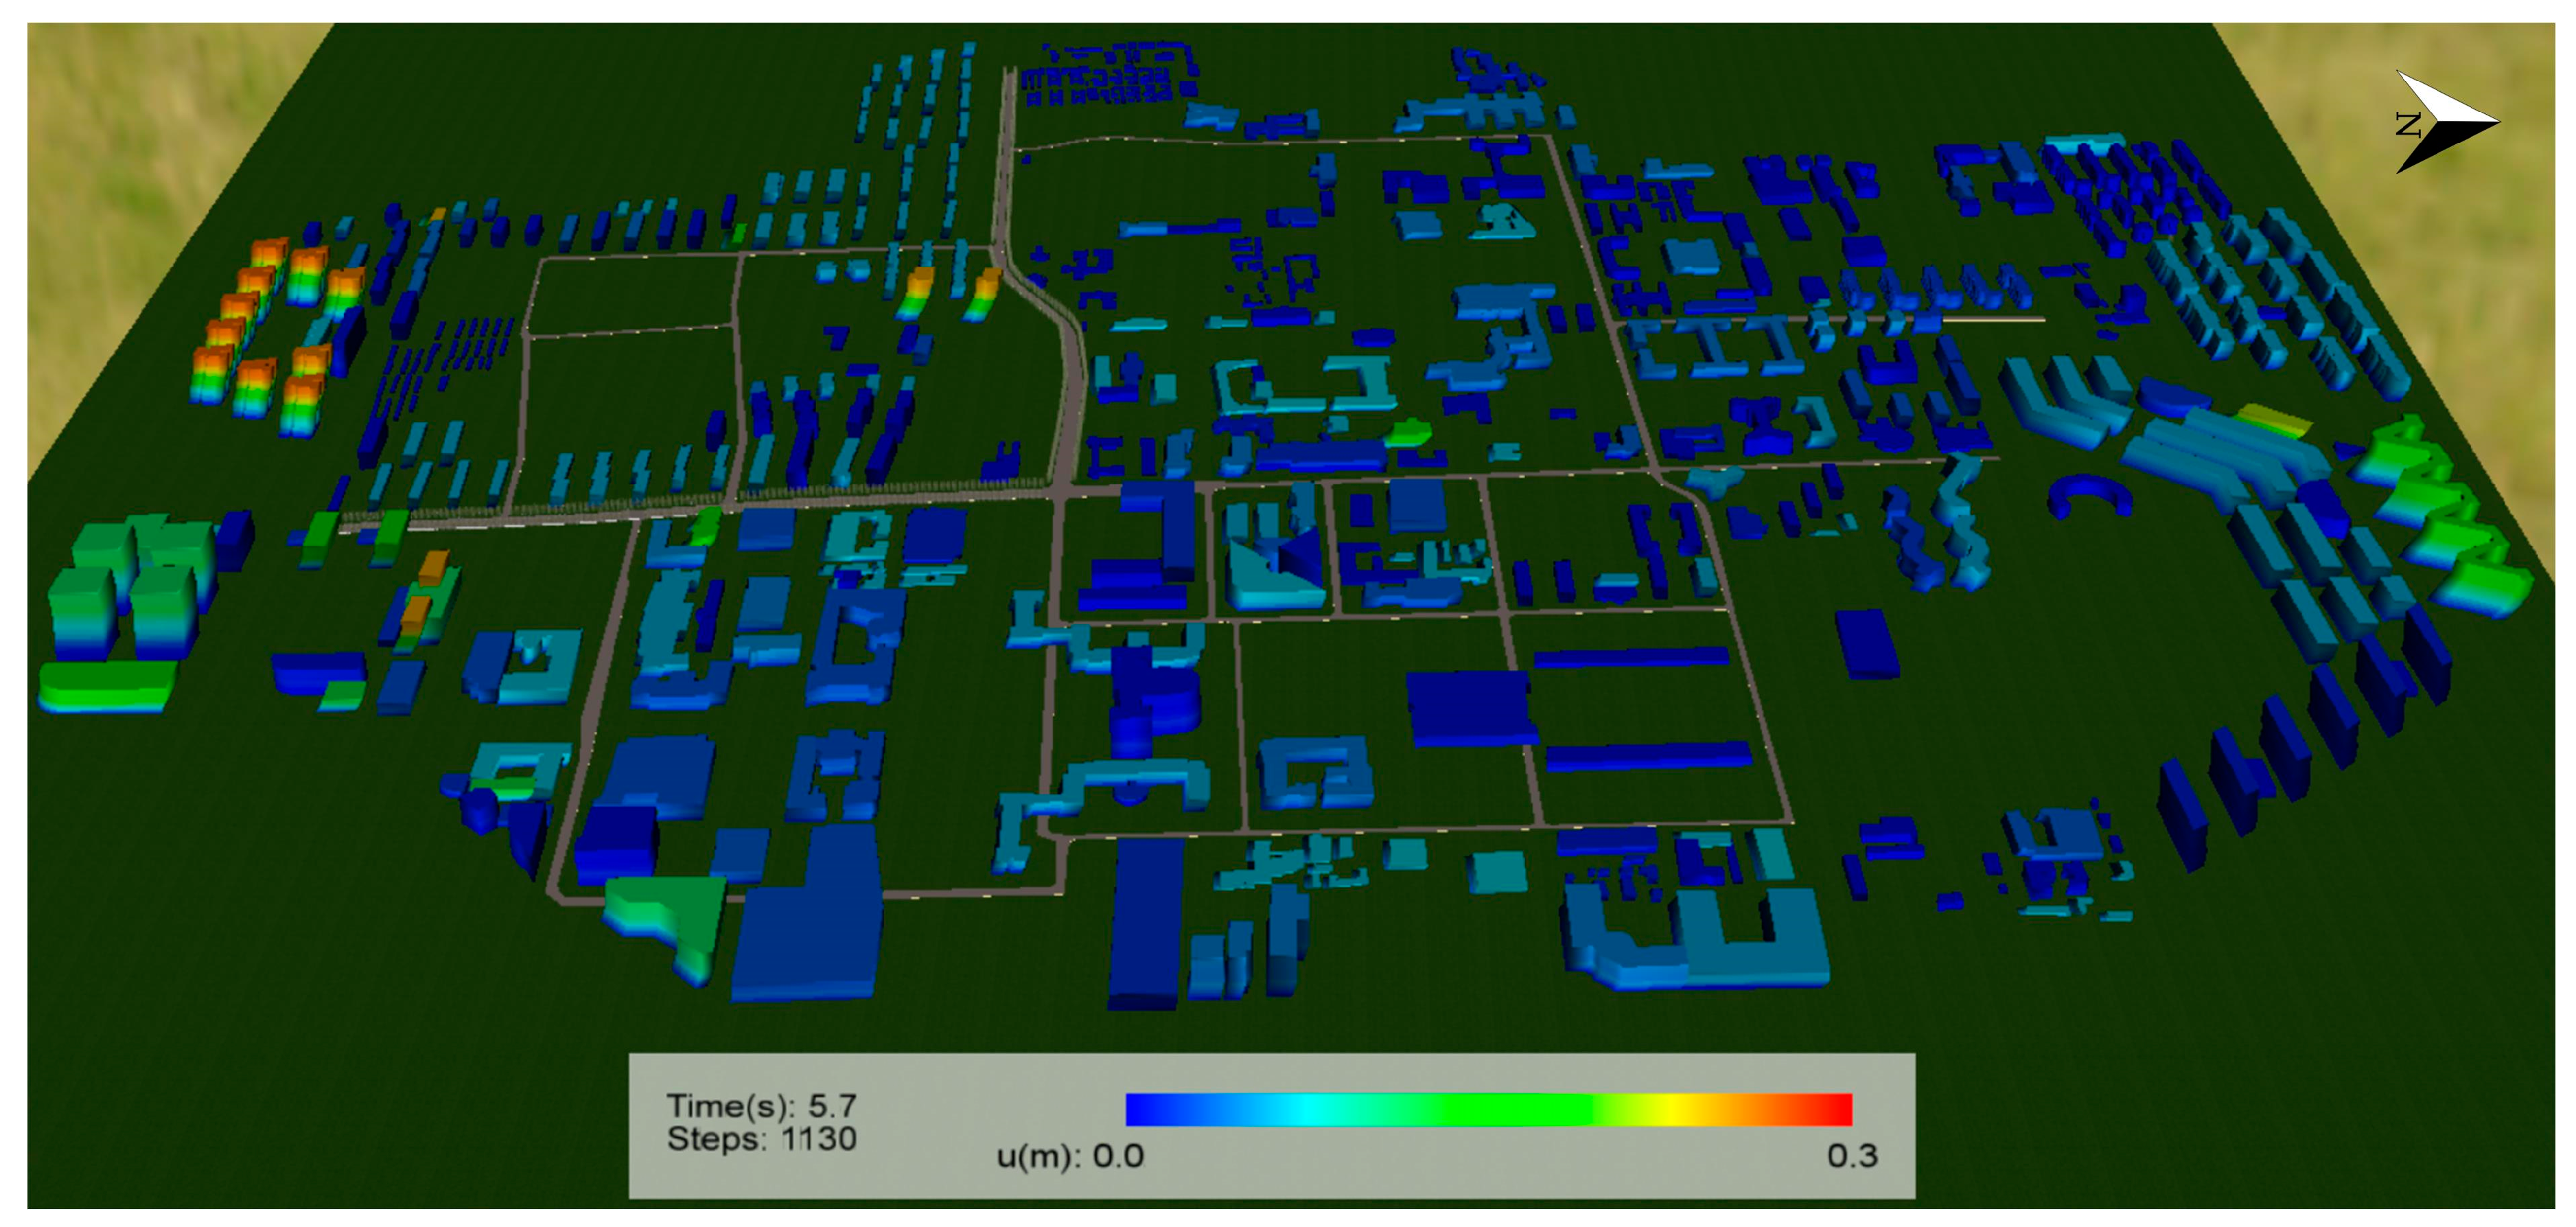
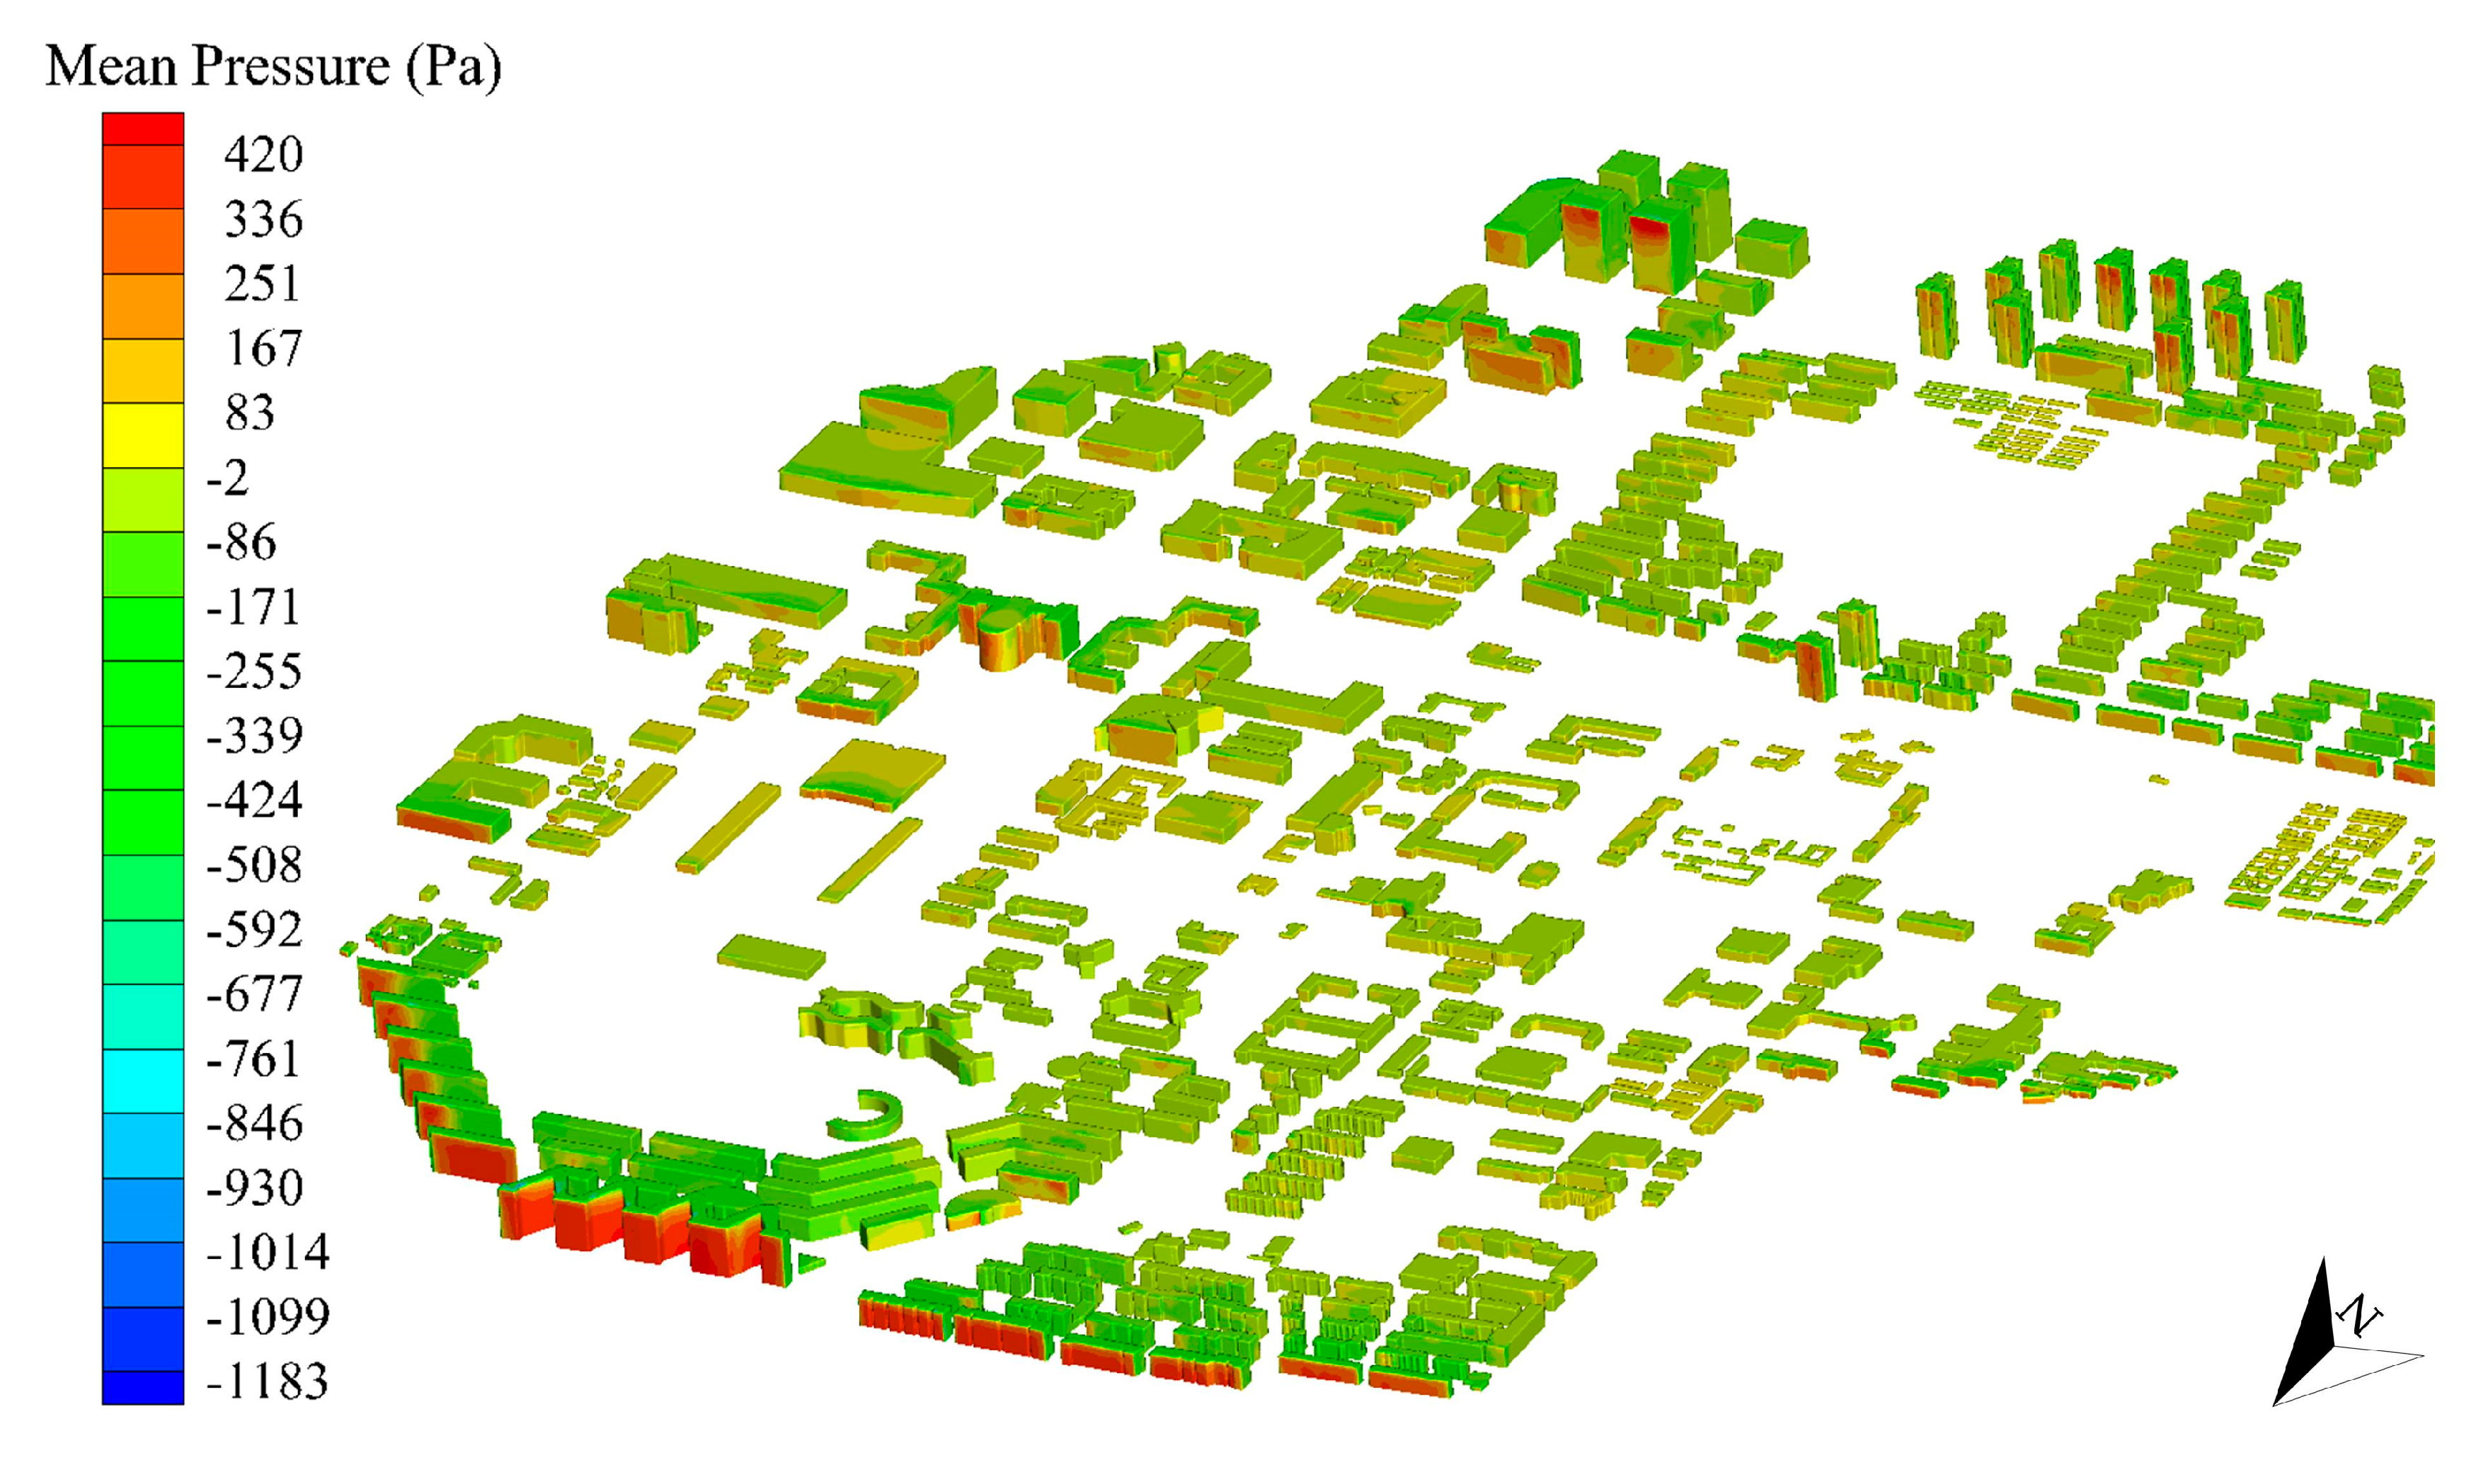
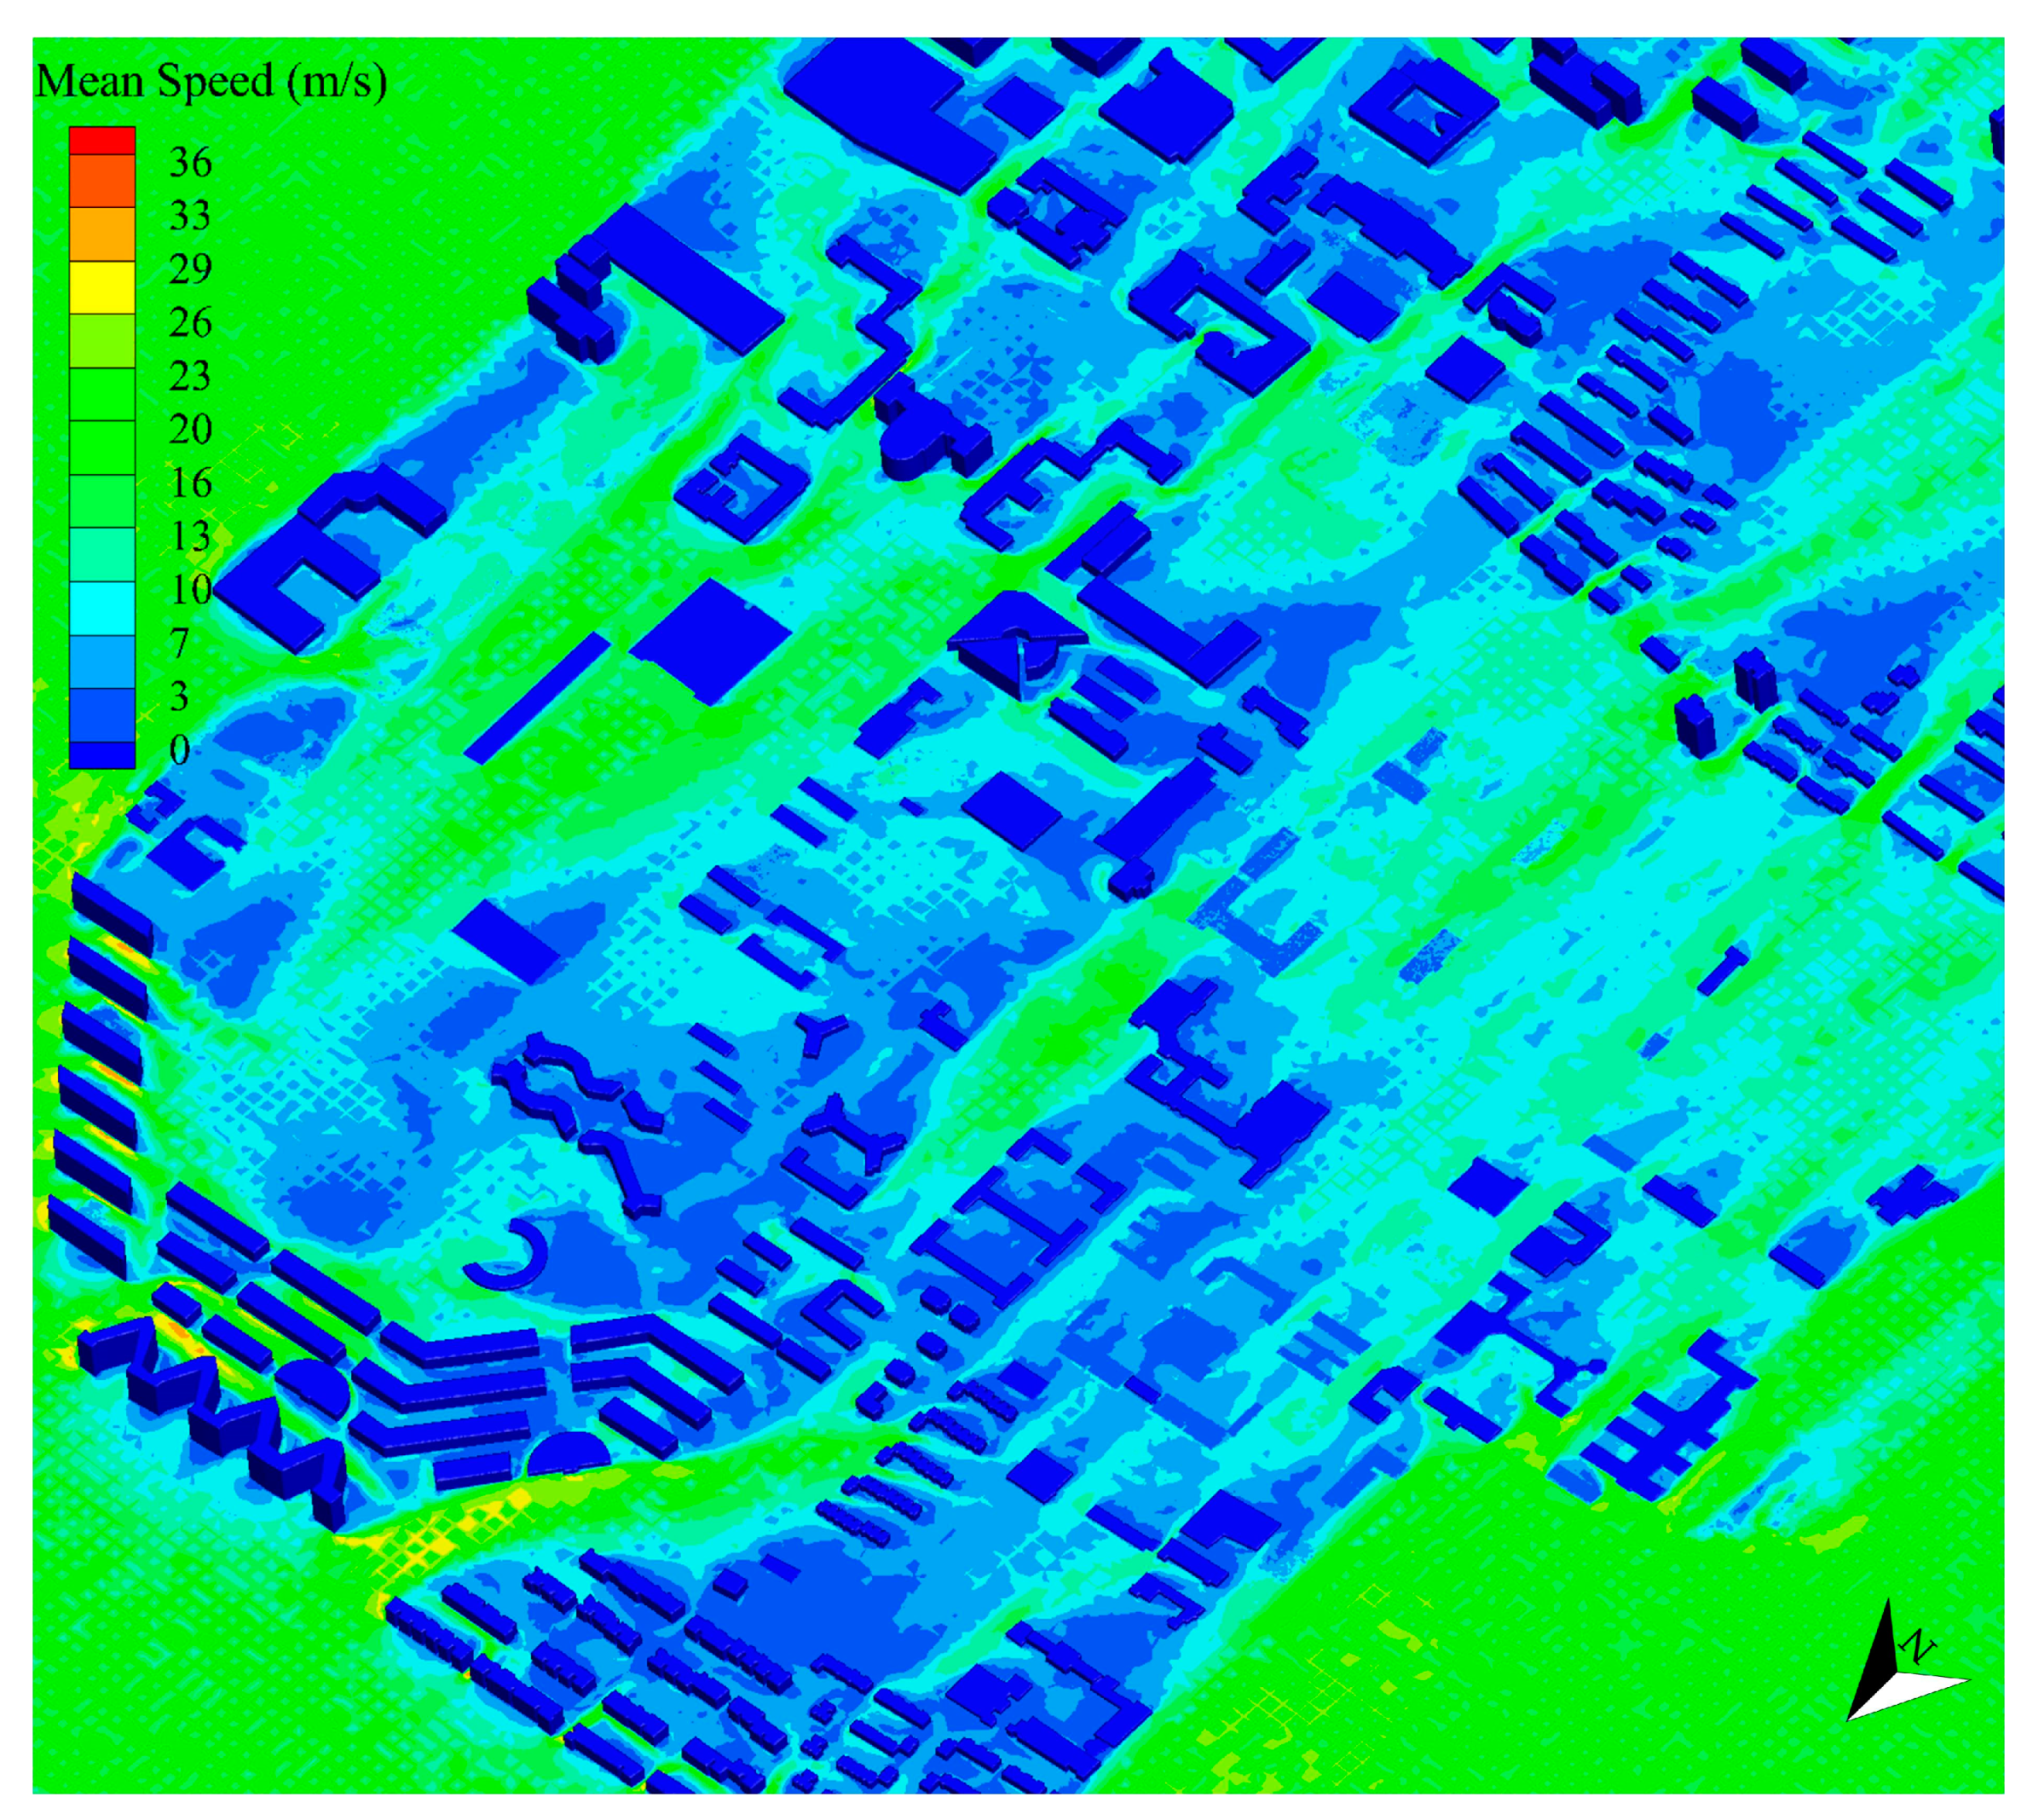
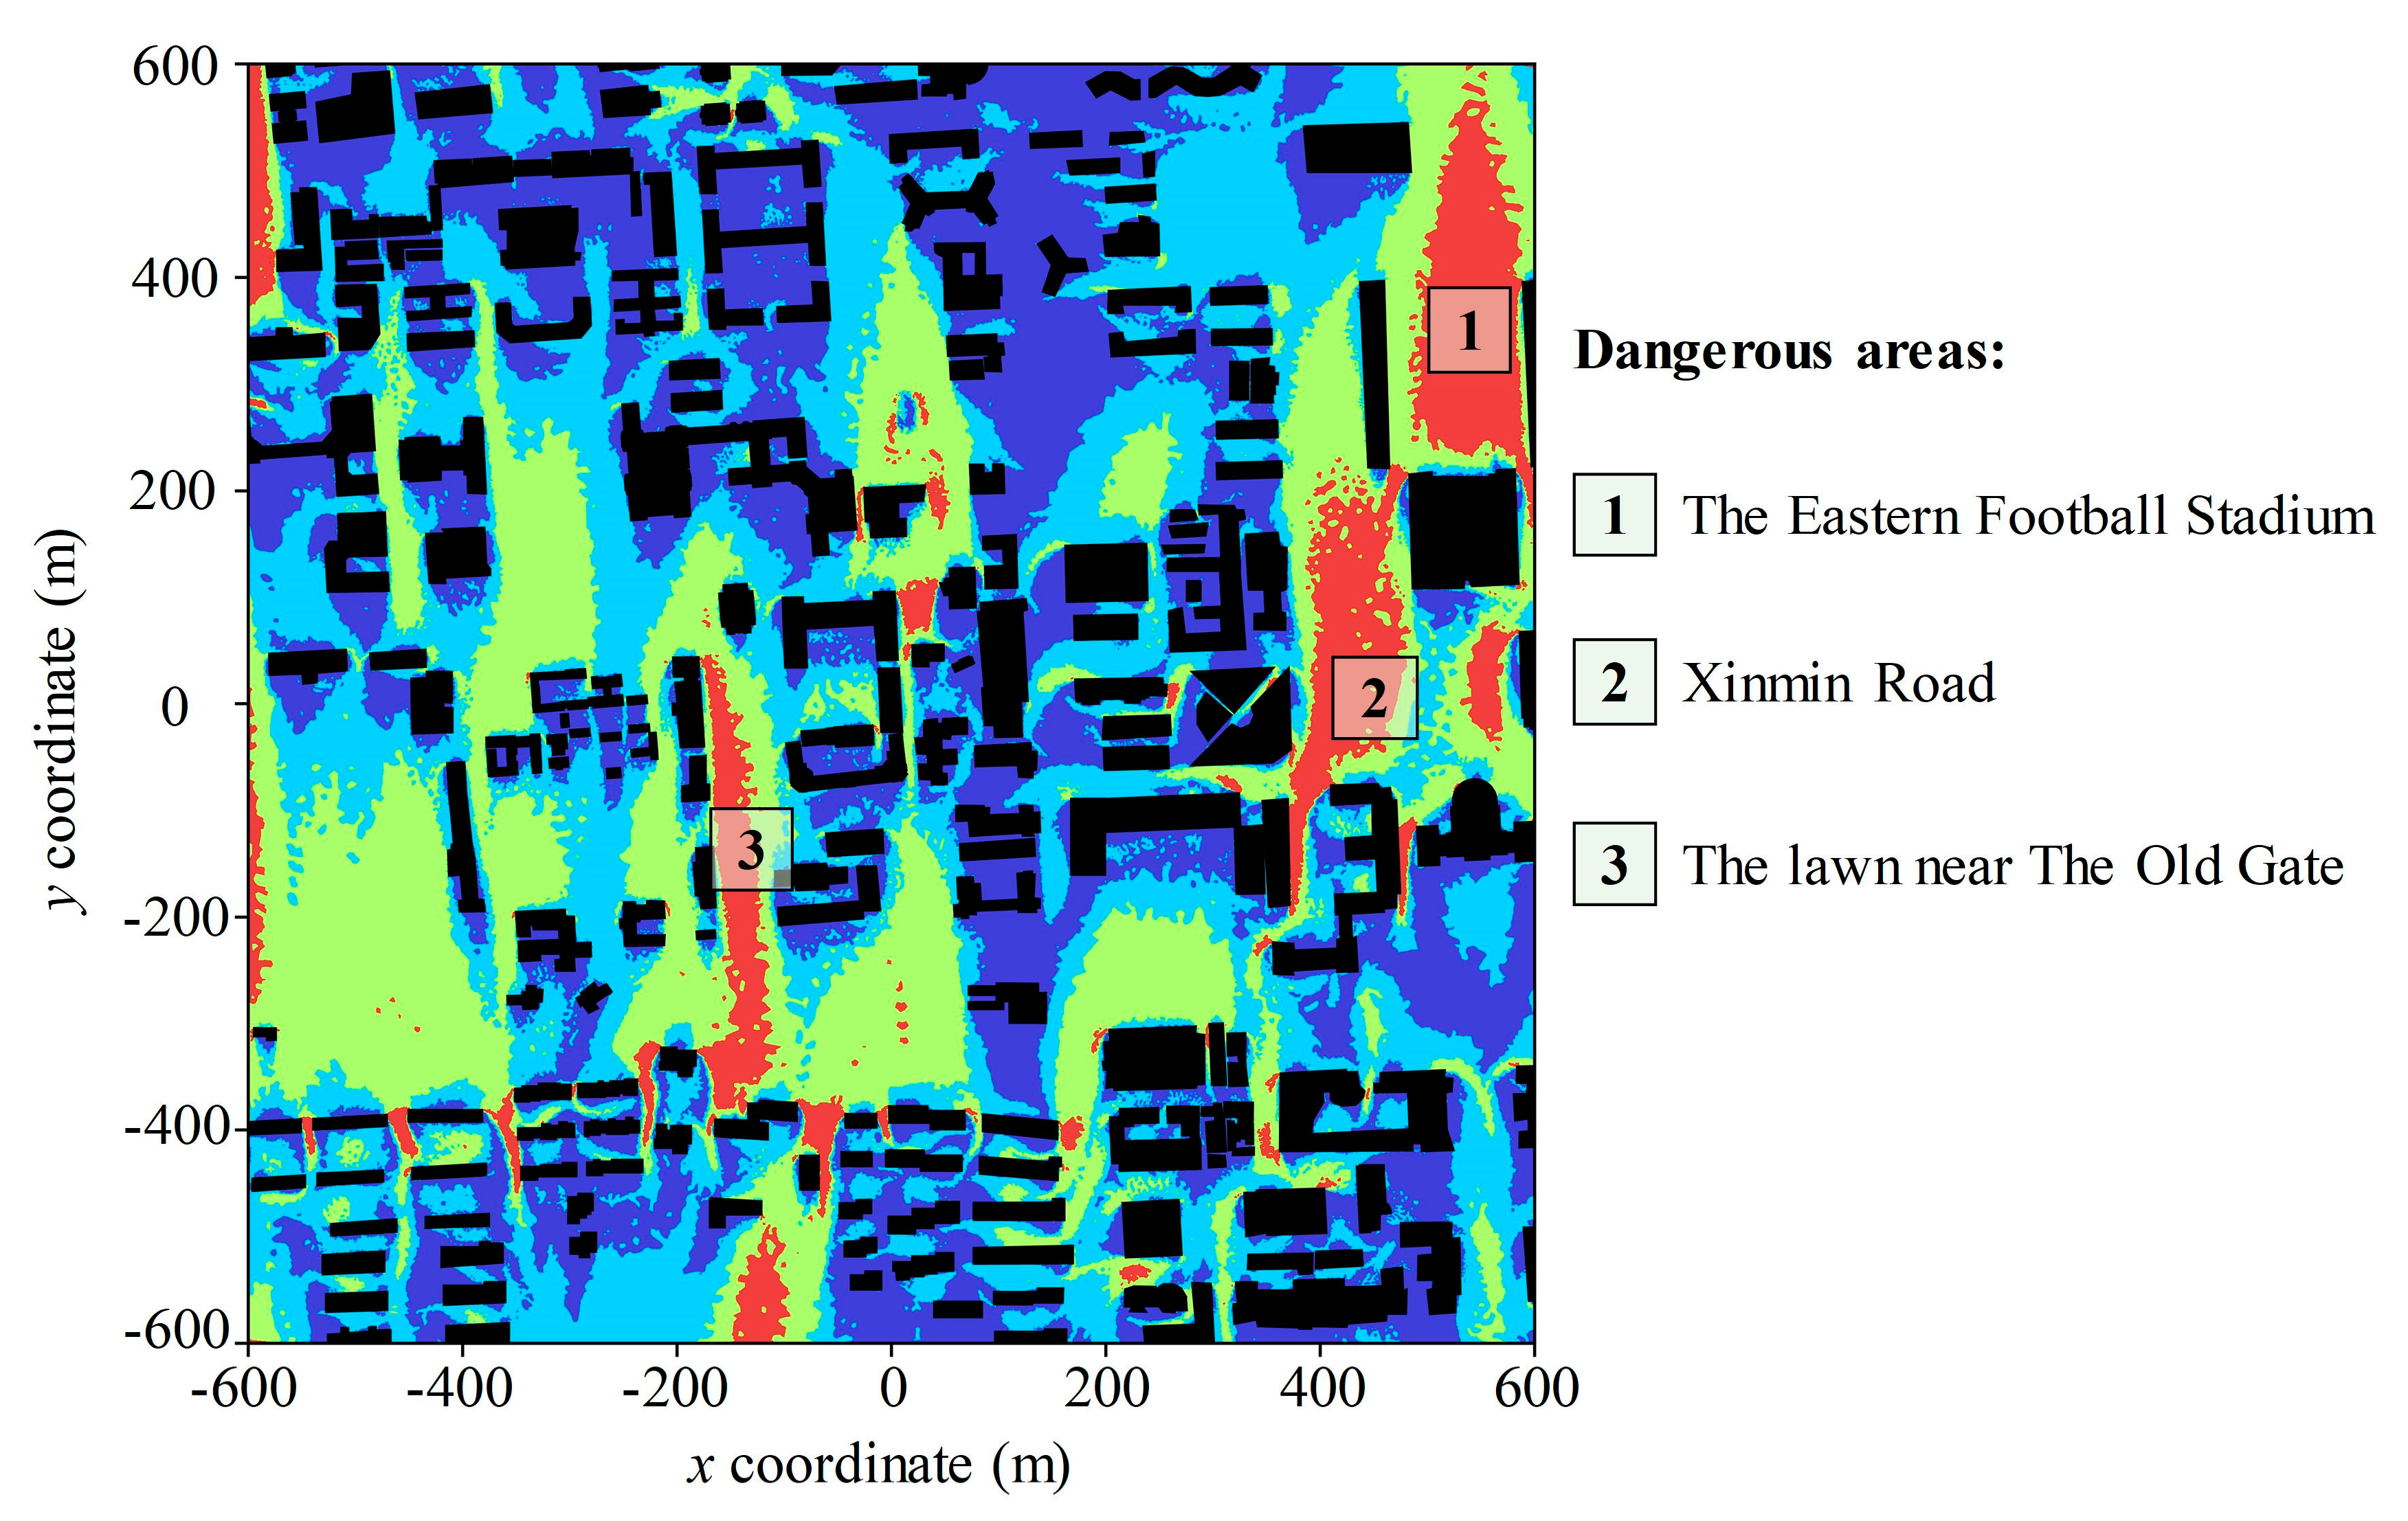
4.2.3. Wind Simulation
4.3. Multi-Hazard Simulation of the Office Building
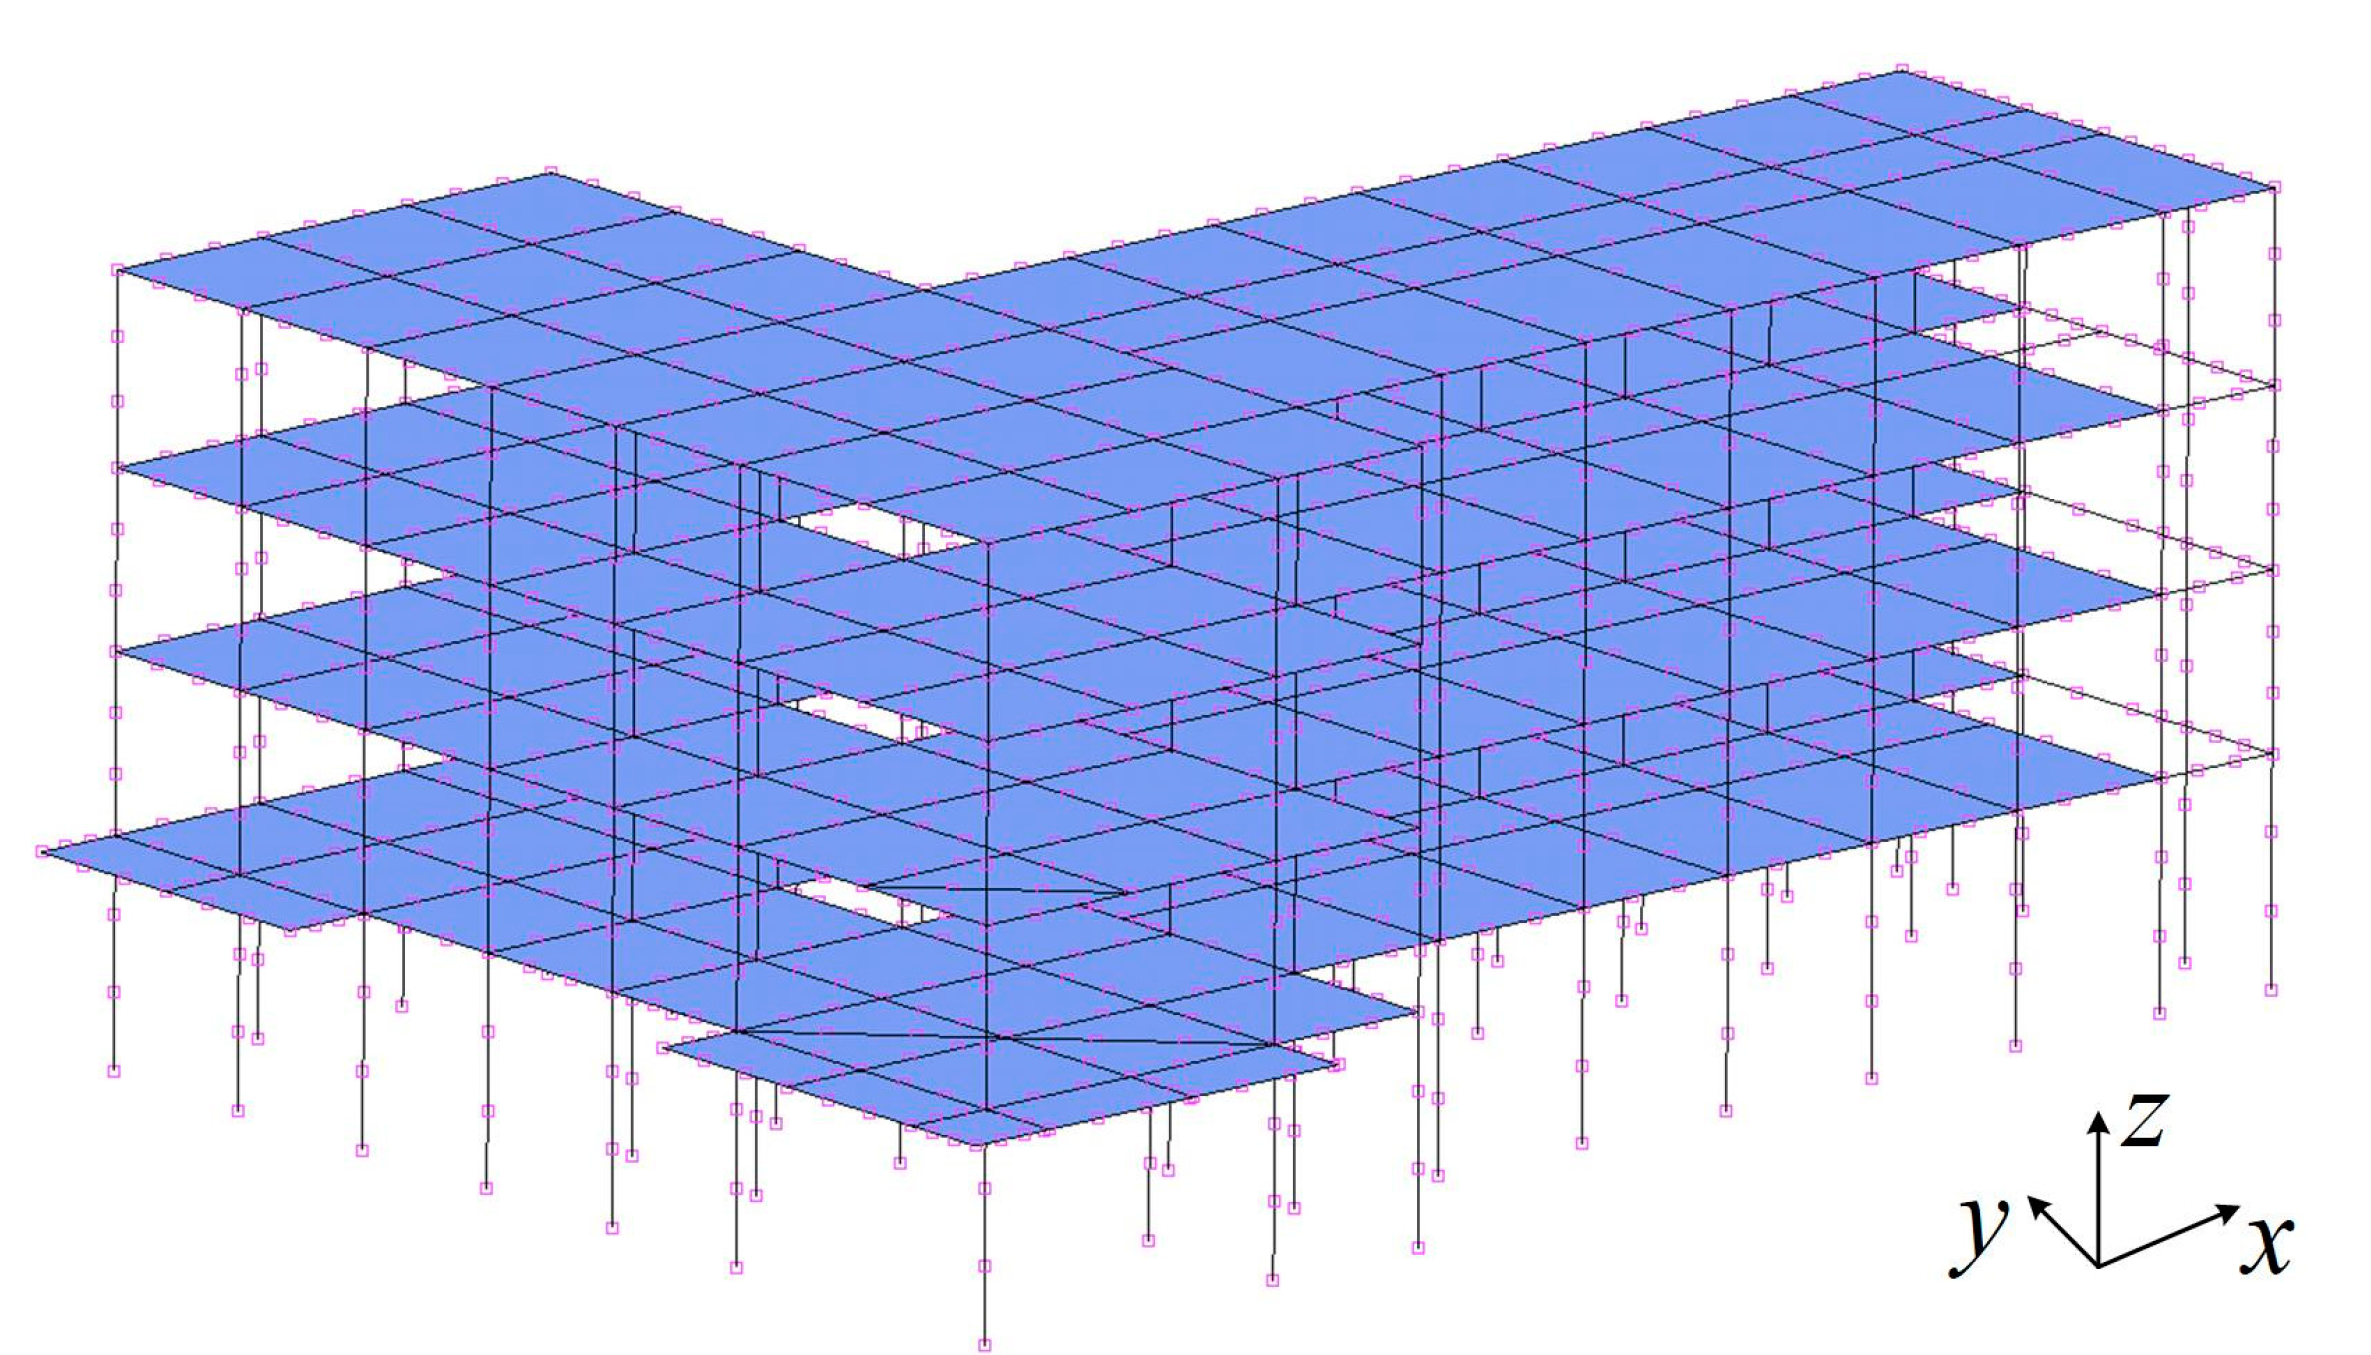
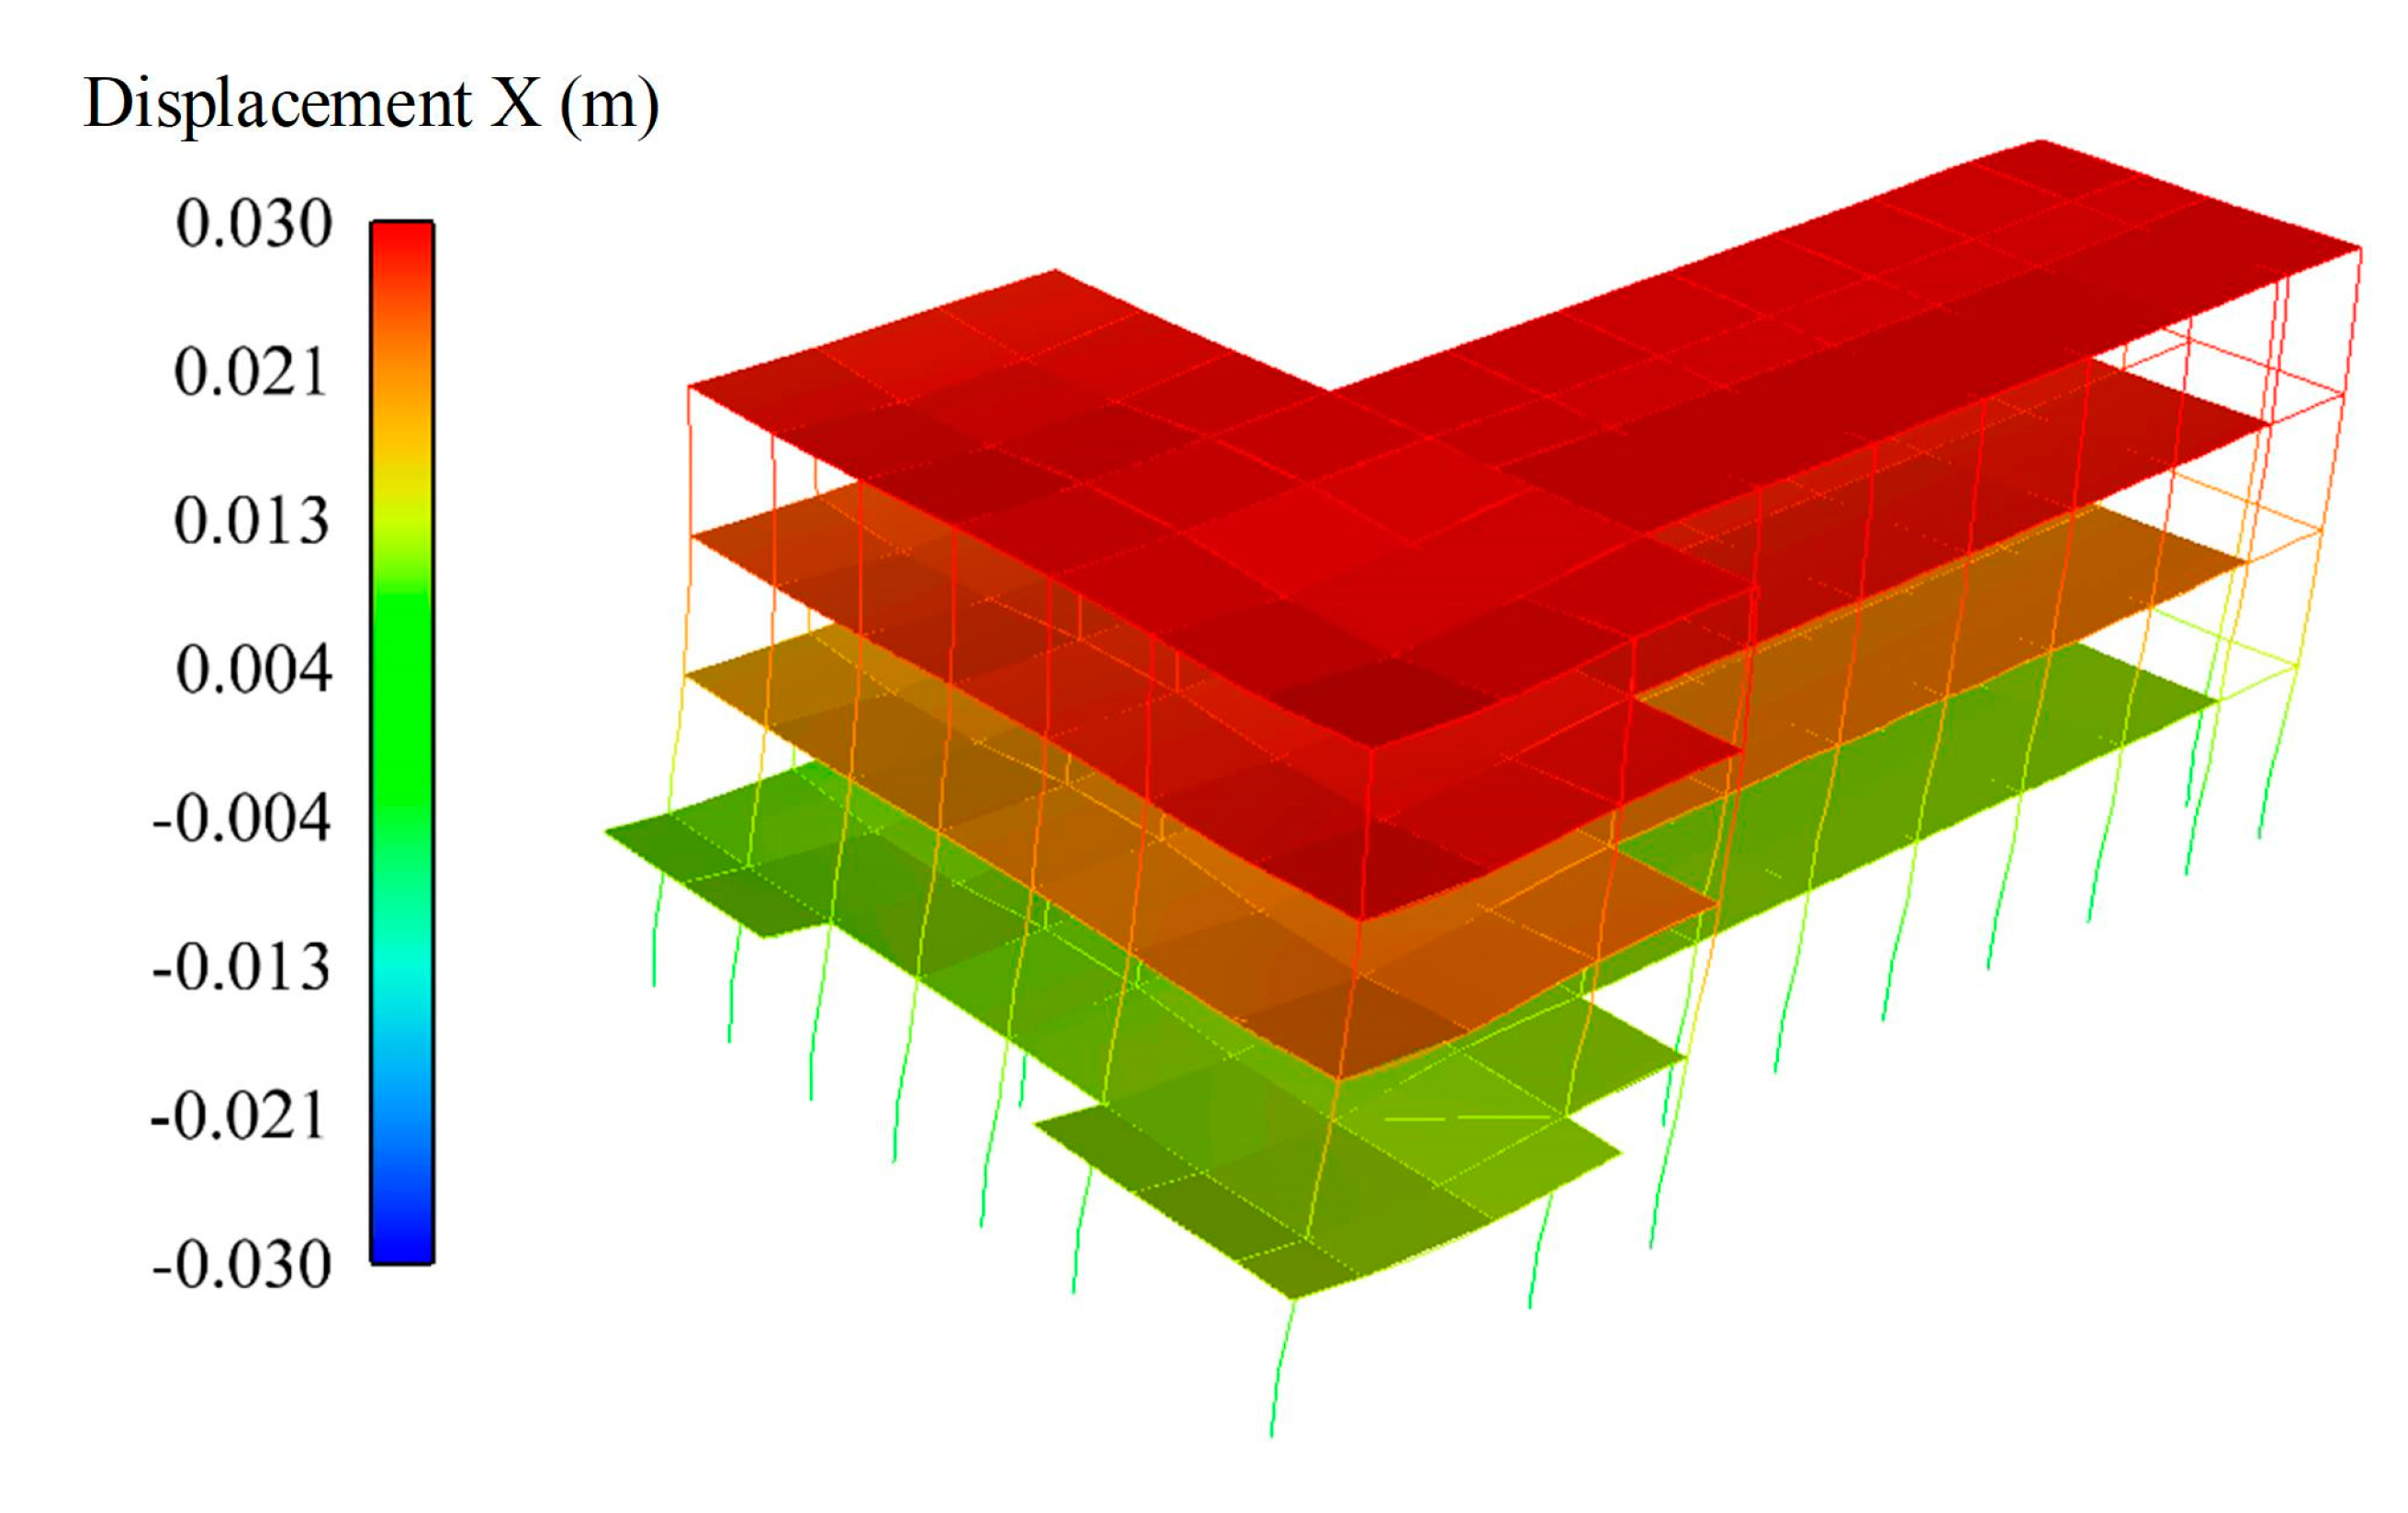
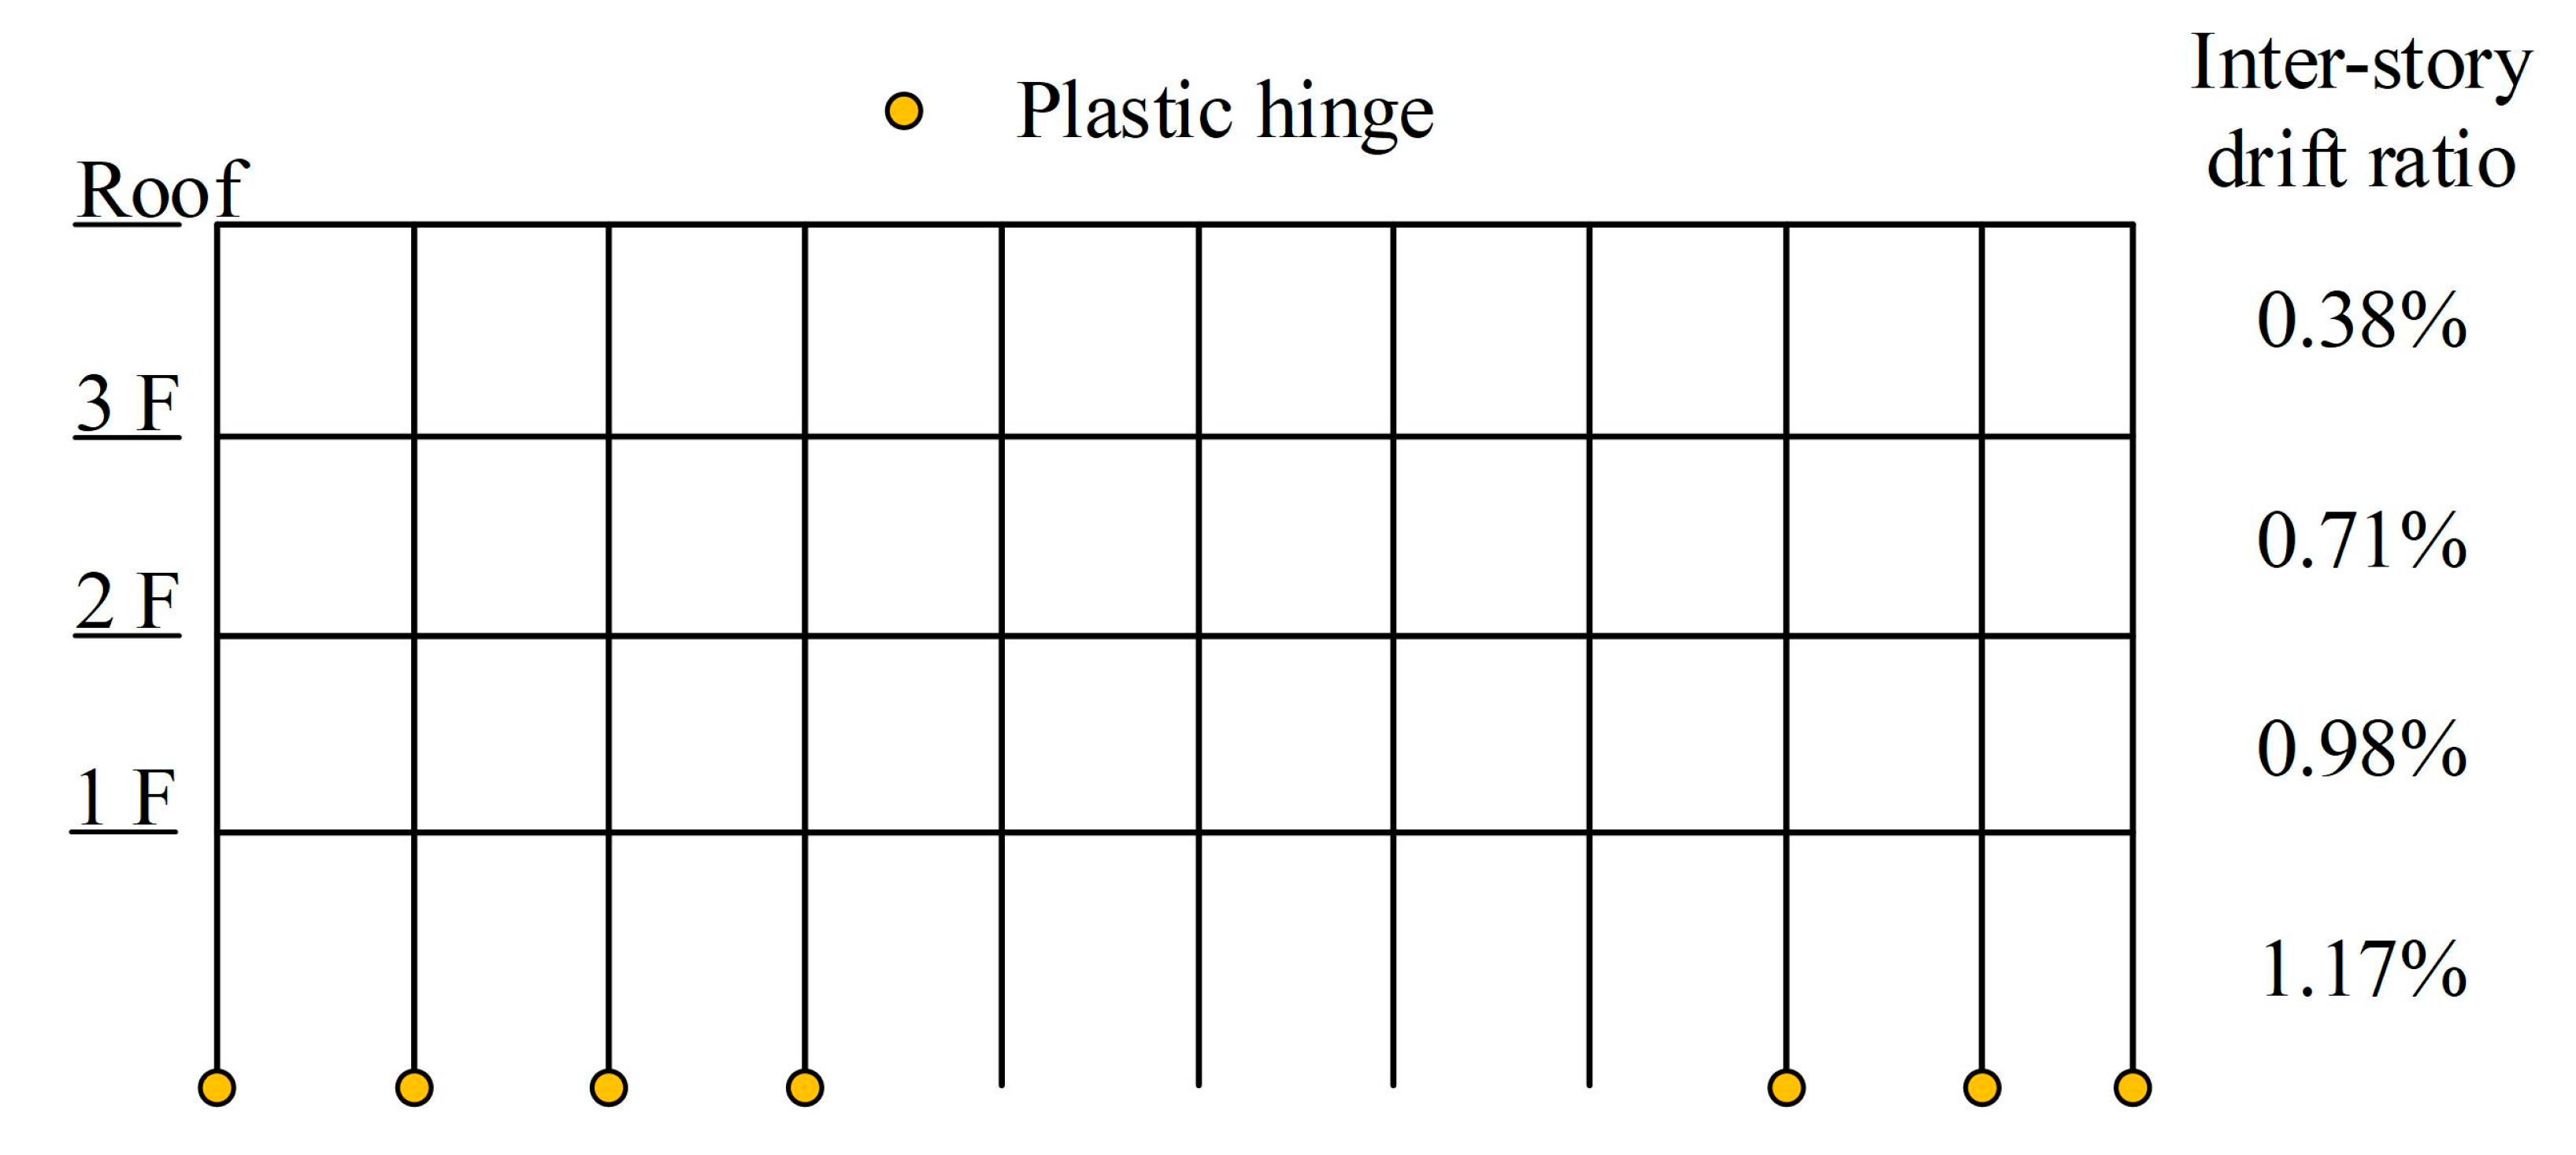
4.3.1. Earthquake Simulation
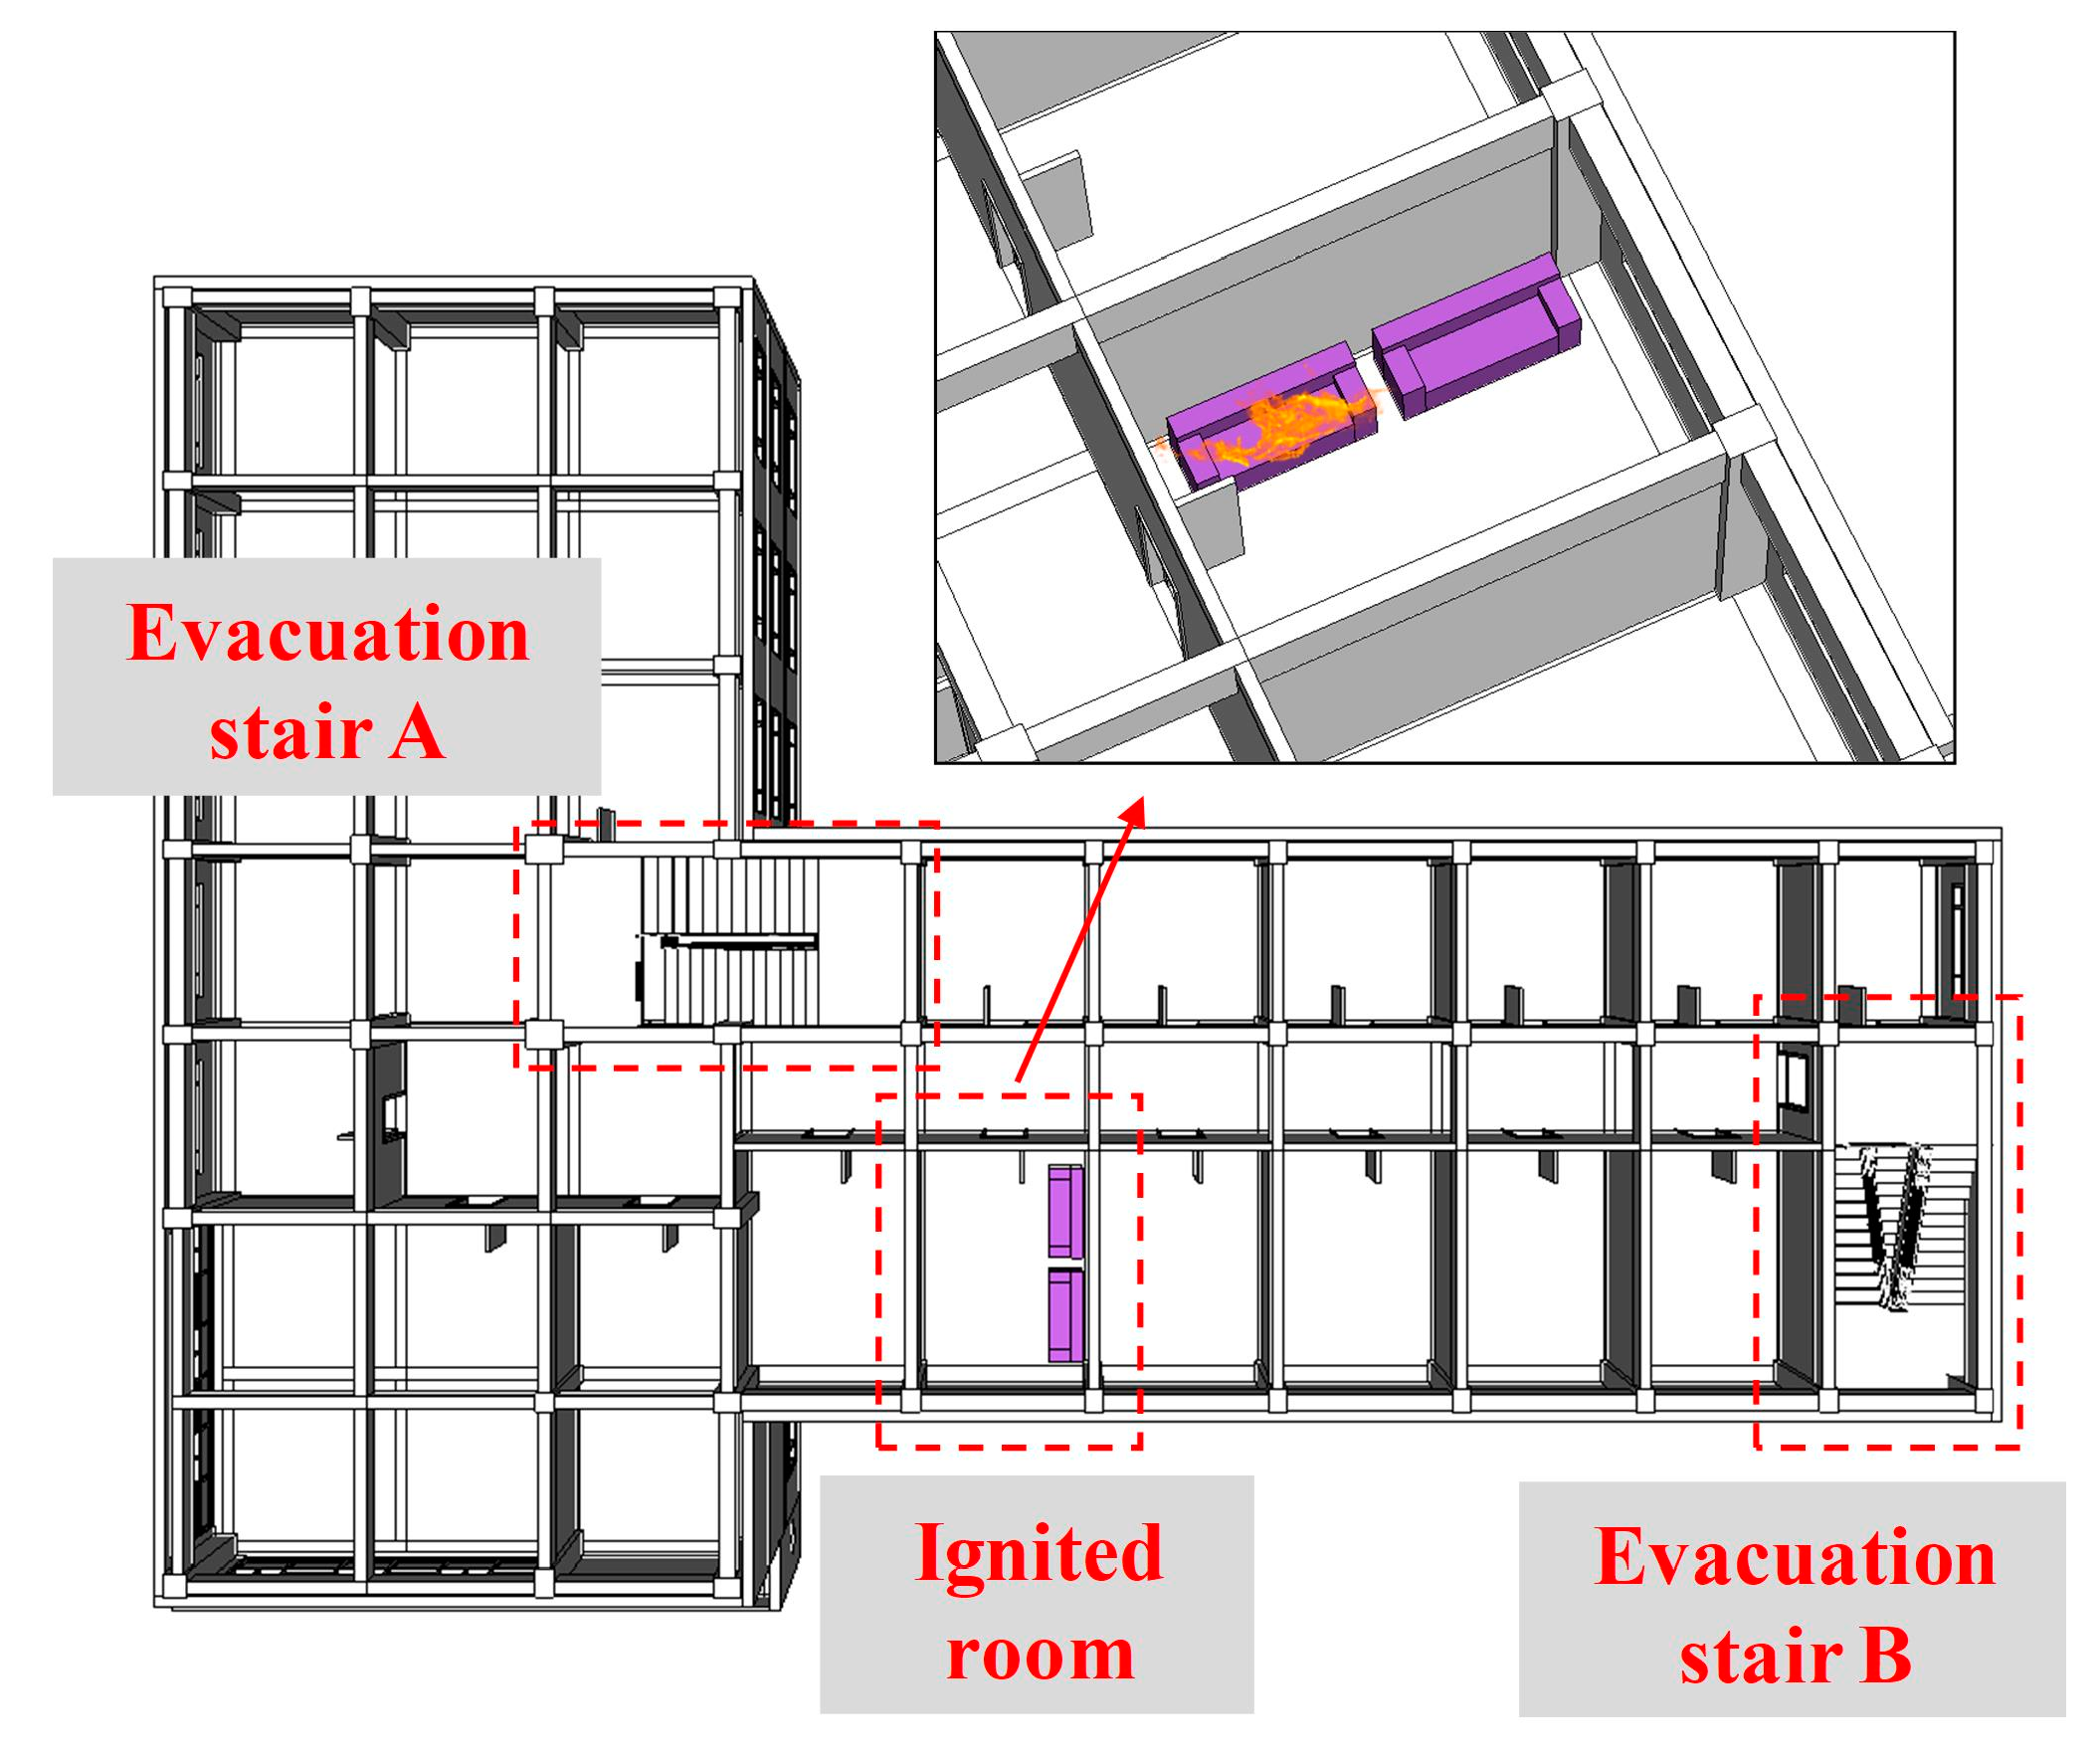
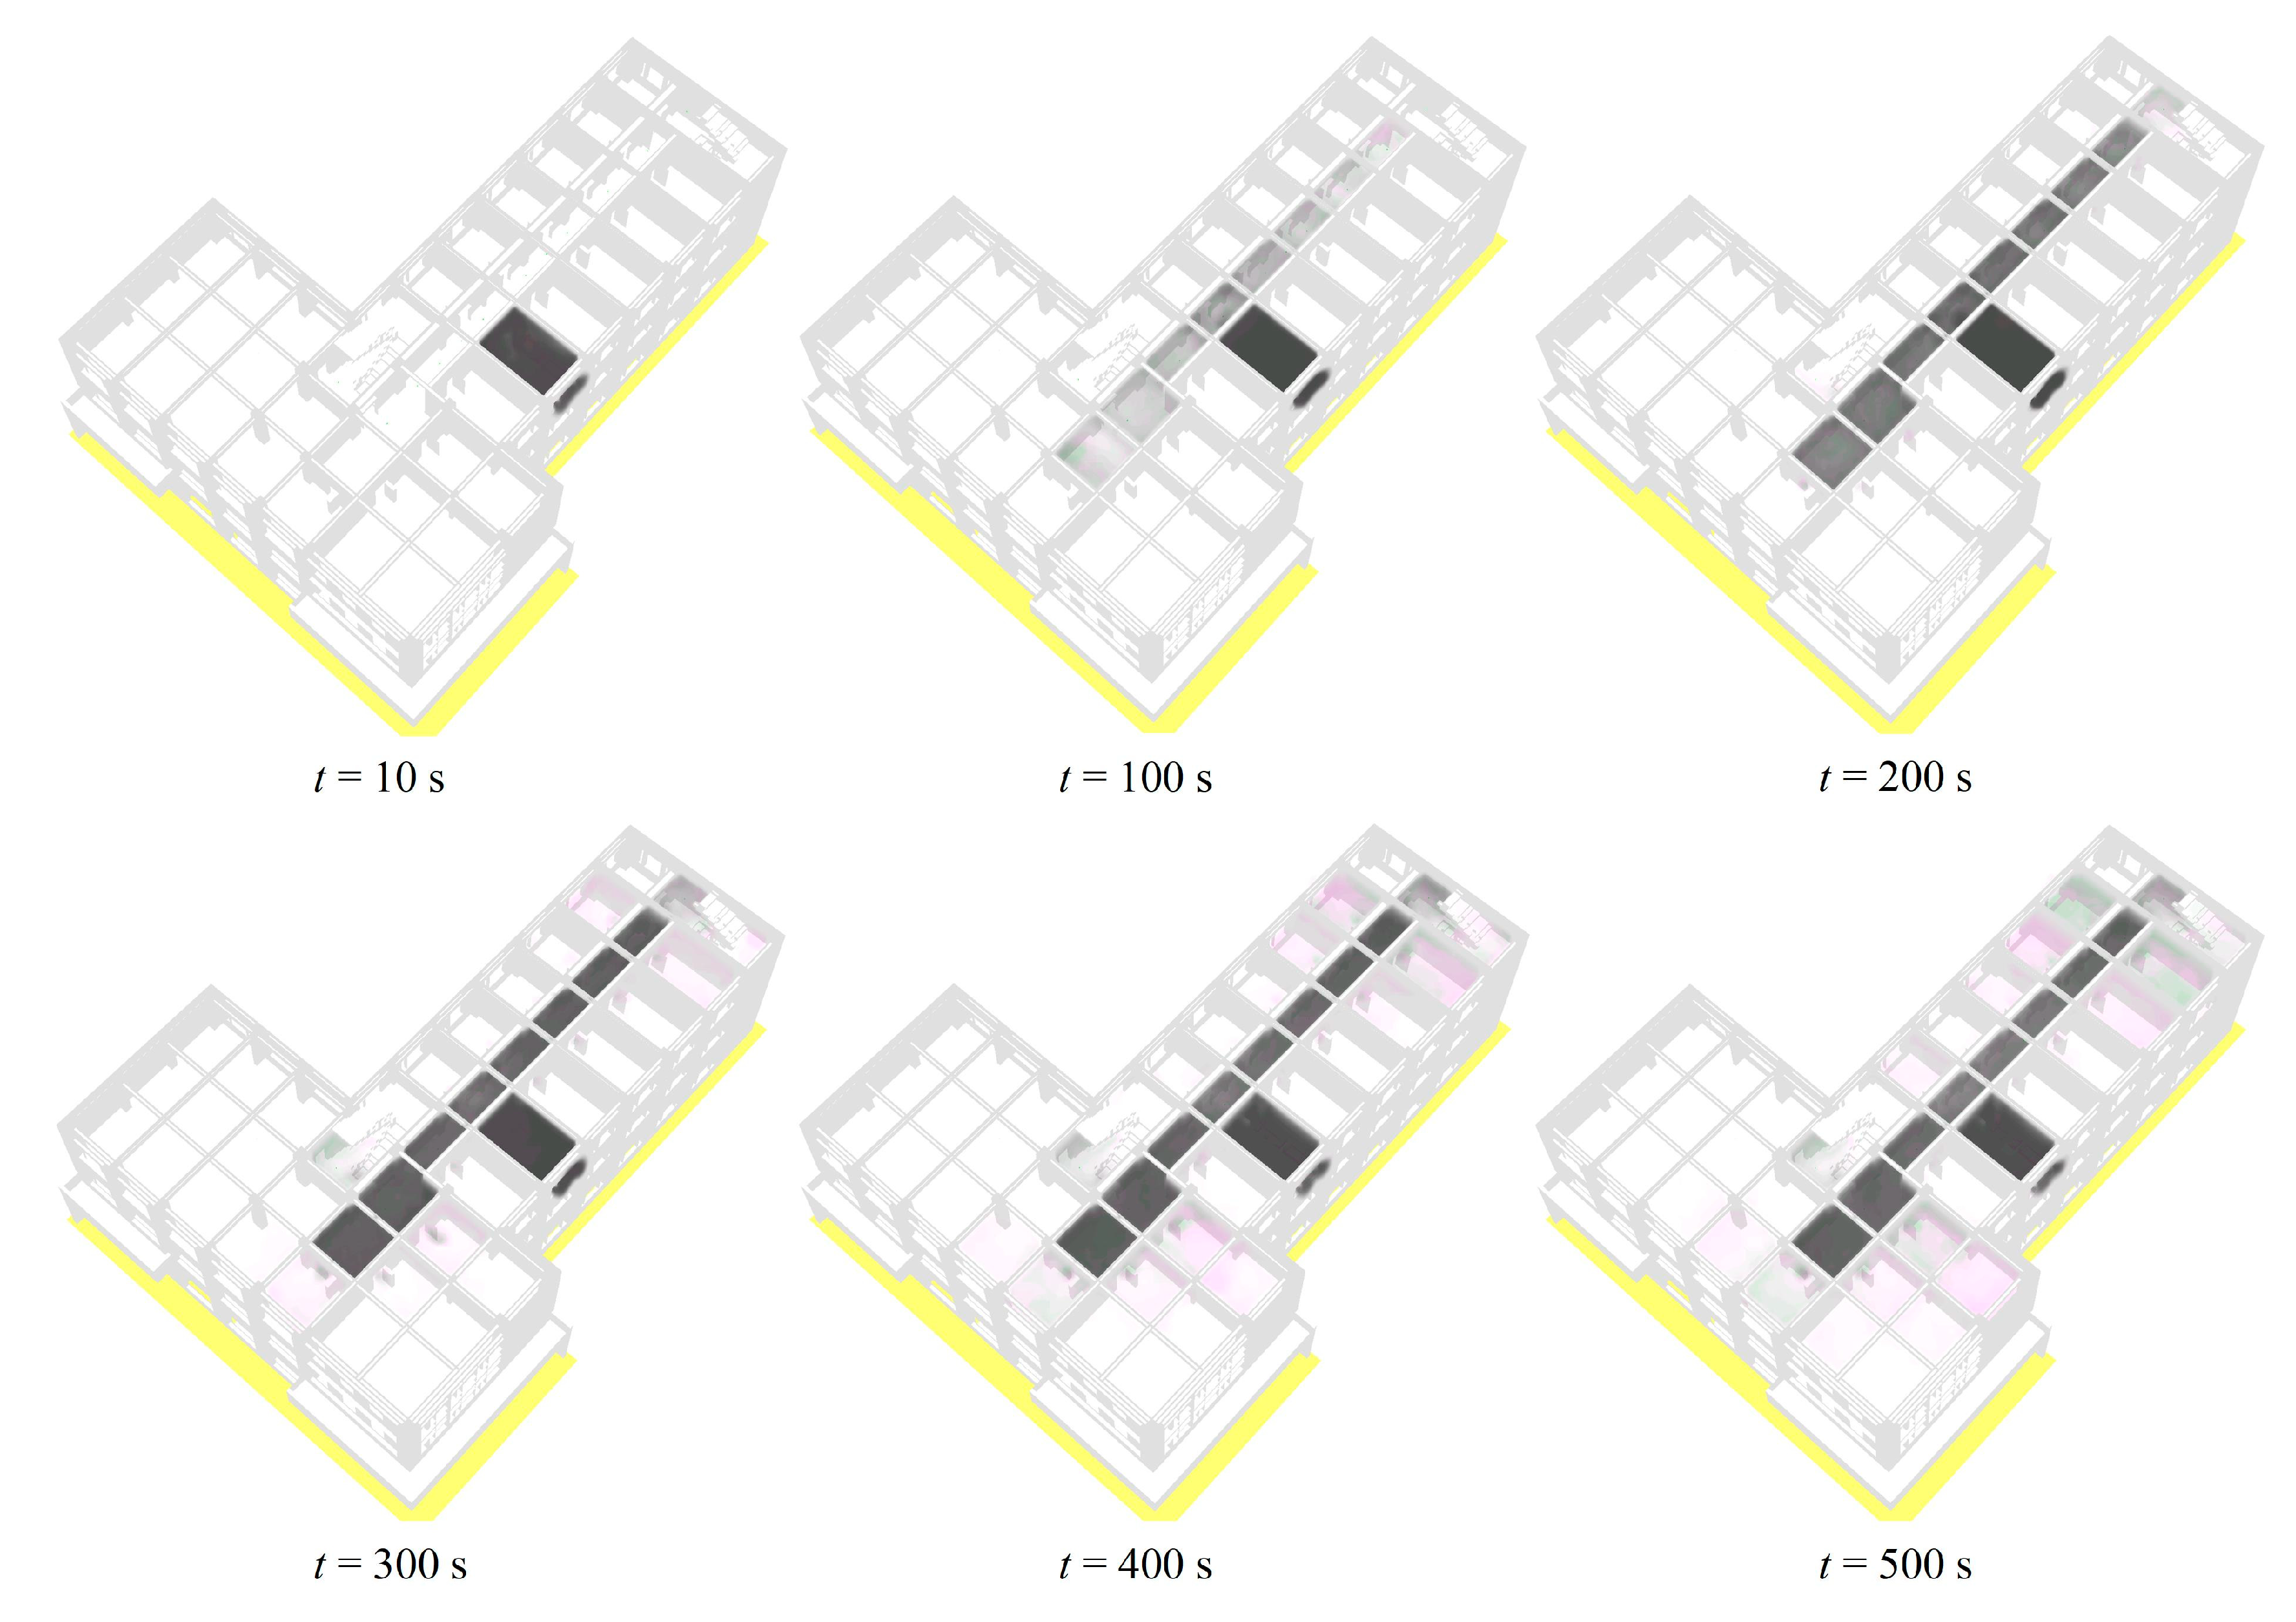
4.3.2. Fire Simulation
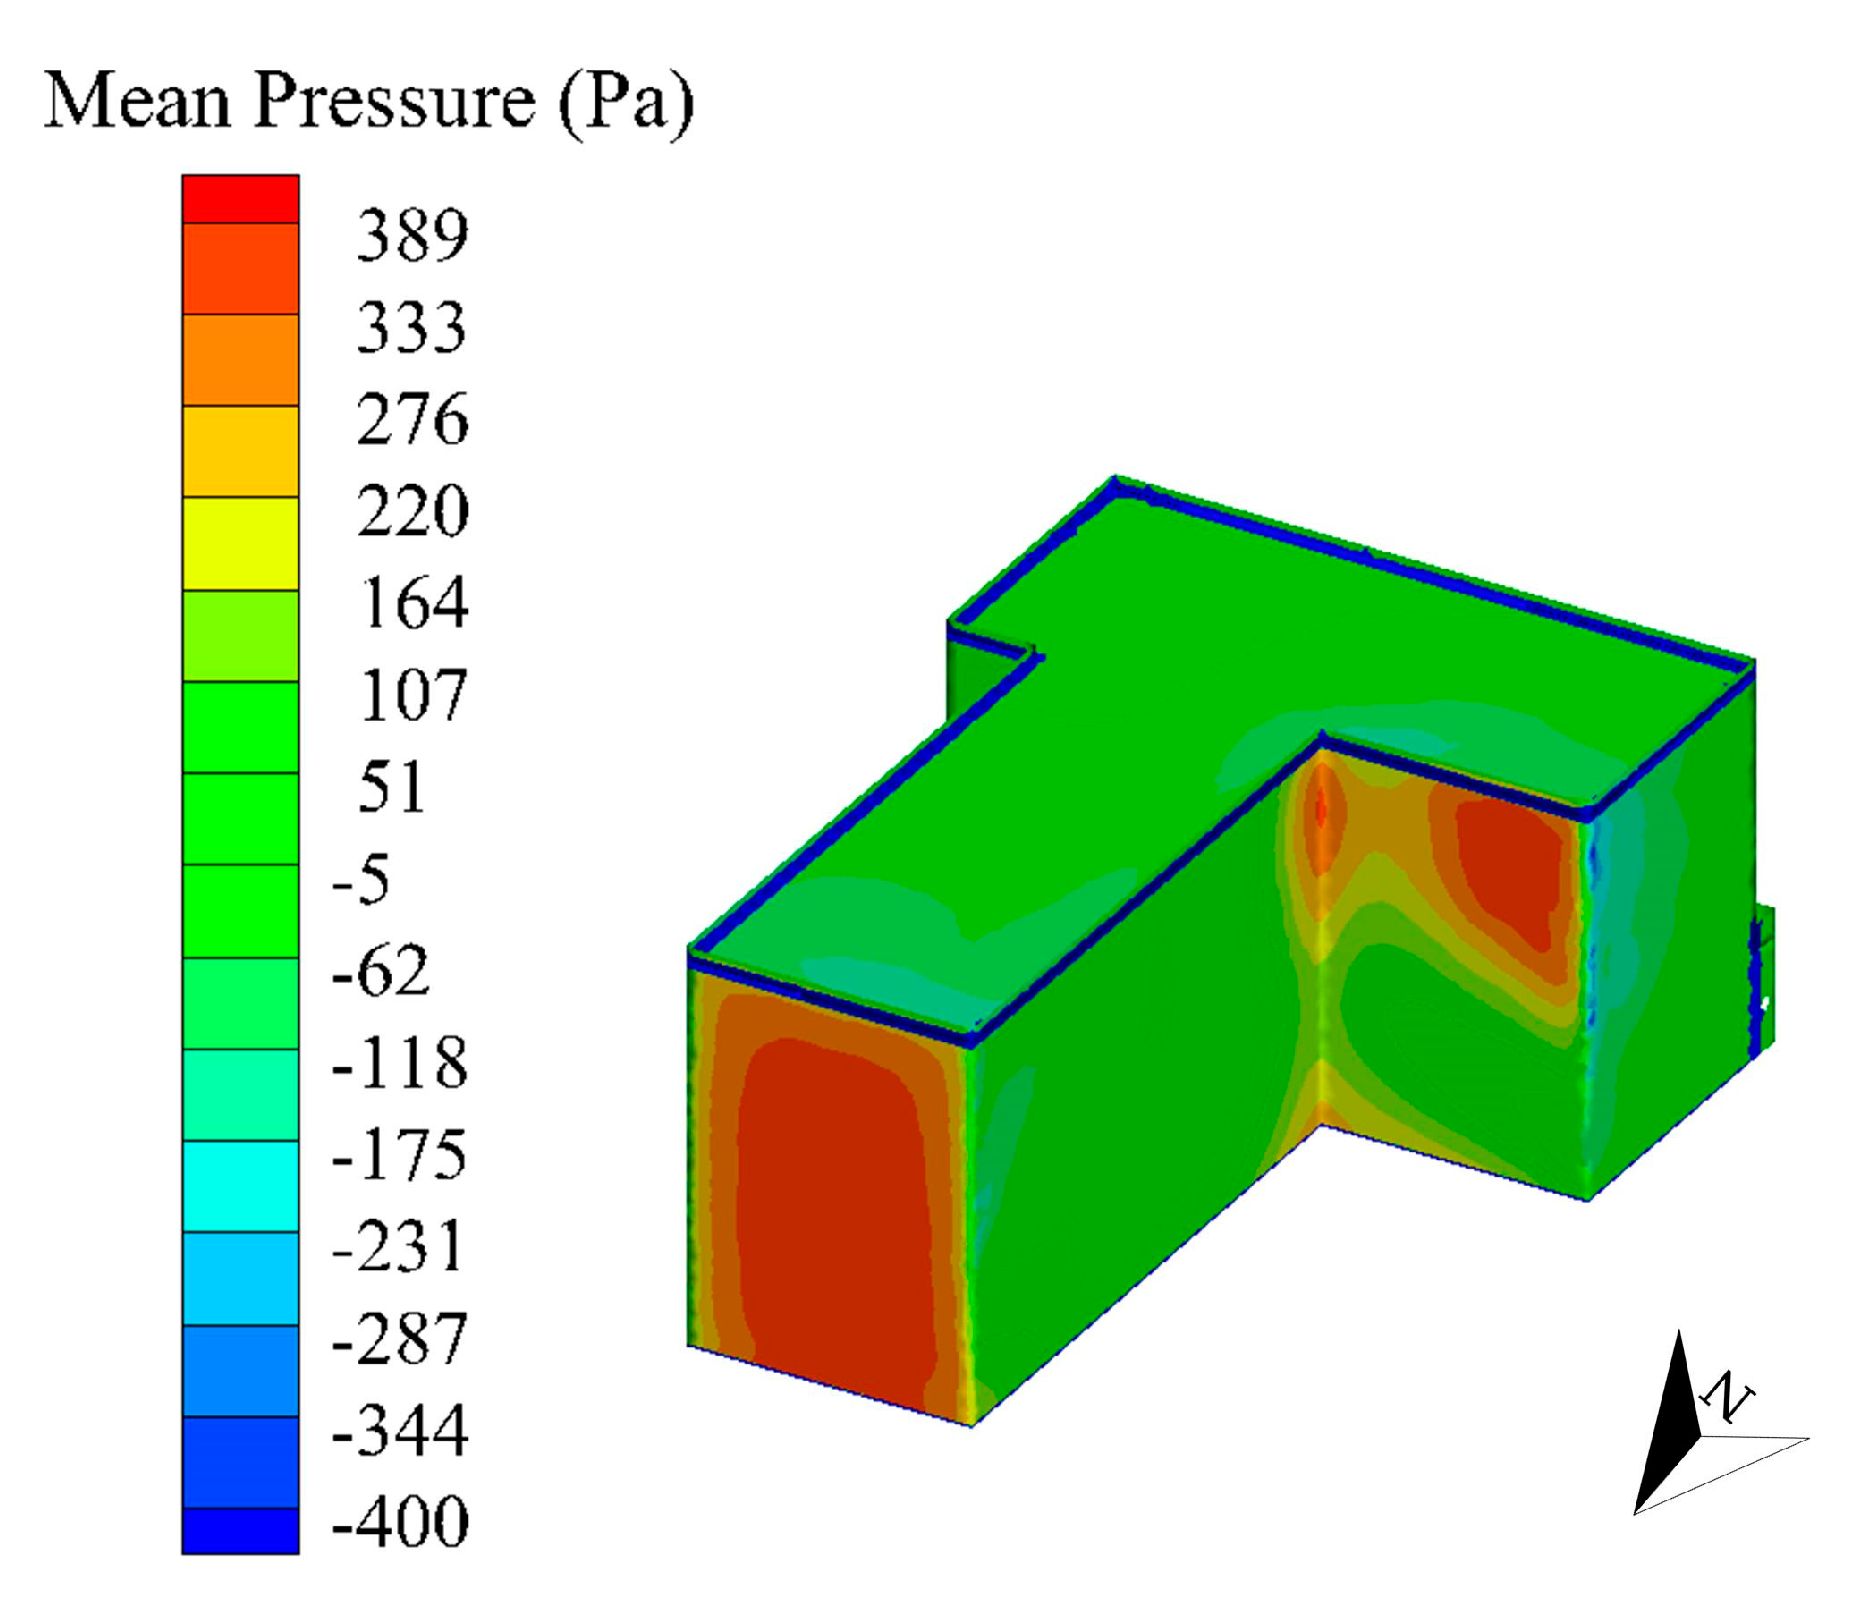
4.3.3. Wind Simulation
4.4. Brief Discussion
5. Conclusions
- (1)
- The database of the framework is a multi-scale model with CIM conception, which is capable of meeting the various demands of stakeholders. In addition, the unified data format can facilitate dynamic updates of building information in a built environment and promote the efficiency of multi-hazard simulations.
- (2)
- Hazard analyses in the proposed framework are all based on physics-based models, which lead to highly rational and accurate simulations. Compared with the empirical or semi-empirical models, there is more room for improving the accuracy of physics-based models due to continuously increasing computing power.
- (3)
- The proposed framework includes high-fidelity visualization of the results of the hazard analysis. Such visualization will help non-professional users in better understanding the hazard scenario, so that they can make their own contributions to hazard prevention and mitigation and thus encourage the use of multi-hazard simulation technology.
Author Contributions
Funding
Acknowledgments
Conflicts of Interest
References
- Chen, X.S.; Liu, C.C.; Wu, I.C. A BIM-based visualization and warning system for fire rescue. Adv. Eng. Inf. 2018, 37, 42–53. [Google Scholar] [CrossRef]
- Lu, X.; Lu, X.Z.; Zhang, W.K.; Ye, L.P. Collapse simulation of a super high-rise building subjected to extremely strong earthquakes. Sci. China-Technol. Sci. 2011, 54, 2549–2560. [Google Scholar]
- Zheng, C.R.; Li, Y.S.; Wu, Y. Pedestrian-level wind environment on outdoor platforms of a thousand-meter-scale mega-tall building: Sub-configuration experiment and wind comfort assessment. Build. Environ. 2016, 106, 313–326. [Google Scholar] [CrossRef]
- Furukawa, A.; Ohta, Y. Failure process of masonry buildings during earthquake and associated casualty risk evaluation. Nat. Hazards 2009, 49, 25–51. [Google Scholar] [CrossRef]
- McKenna, F. OpenSees: A framework for earthquake engineering simulation. Comput. Sci. Eng. 2011, 13, 58–66. [Google Scholar] [CrossRef]
- Rehm, R.G.; Pitts, W.M.; Baum, H.R.; Evans, D.D.; Prasad, K.; McGrattan, K.B.; Forney, G.P. Initial model for fires in the World Trade Centre Towers. Fire Saf. Sci. Proc. Int. Symp. 2003, 7, 25–40. [Google Scholar] [CrossRef] [Green Version]
- Tominaga, Y.; Mochida, A.; Shirasawa, T.; Yoshie, R.; Kataoka, H.; Harimoto, K.; Nozu, T. Cross comparisons of CFD results of wind environment at pedestrian level around a high-rise building and within a building complex. J. Asian Arch. Build. Eng. 2004, 3, 63–70. [Google Scholar] [CrossRef]
- Xu, Z.; Zhang, Z.C.; Lu, X.Z.; Zeng, X.; Guan, H. Post-earthquake fire simulation considering overall seismic damage of sprinkler systems based on BIM and FEMA P-58. Autom. Constr. 2018, 90, 9–22. [Google Scholar] [CrossRef]
- HAZUS. Available online: https://www.fema.gov/HAZUS (accessed on 28 April 2019).
- Federal Emergency Management Agency (FEMA). Multi-Hazard Loss Estimation Methodology-Earthquake Model, Hazus-MH2.1 Technical Manual; FEMA: Washington, DC, USA, 2012.
- Hori, M. Introduction to Computational Earthquake Engineering; Imperial College Press: London, UK, 2006. [Google Scholar]
- Lu, X.Z.; Guan, H. Earthquake Disaster Simulation of Civil Infrastructures: From Tall Buildings to Urban Areas; Springer: Berlin/Heidelberg, Germany, 2017. [Google Scholar]
- Hamada, M. Architectural Fire Resistant Themes; Shokokusha: Tokyo, Japan, 1975. [Google Scholar]
- Himoto, K.; Tanaka, T. Development and validation of a physics-based urban fire spread model. Fire Saf. J. 2008, 43, 477–494. [Google Scholar] [CrossRef] [Green Version]
- Li, S.Z.; Davidson, R.A. Application of an urban fire simulation model. Earthq. Spectra 2013, 29, 1369–1389. [Google Scholar] [CrossRef]
- Rui, X.; Hui, S.; Yu, X.; Zhang, G.; Wu, B. Forest fire spread simulation algorithm based on cellular automata. Nat. Hazards 2018, 91, 309–319. [Google Scholar] [CrossRef]
- Zhao, S.J. GisFFE-an integrated software system for the dynamic simulation of fires following an earthquake based on GIS. Fire Saf. J. 2010, 45, 83–97. [Google Scholar] [CrossRef]
- Federal Emergency Management Agency (FEMA). Multi-Hazard Loss Estimation Methodology-Hurricane Model, Hazus-MH2.1 Technical Manual; FEMA: Washington, DC, USA, 2012.
- Chung, T.J. Computational Fluid Dynamics; Cambridge University Press: Cambridge, UK, 2010. [Google Scholar]
- Blocken, B.; Persoon, J. Pedestrian wind comfort around a large football stadium in an urban environment: CFD simulation, validation and application of the new Dutch wind nuisance standard. J. Wind Eng. Ind. Aerodyn. 2009, 97, 255–270. [Google Scholar] [CrossRef]
- Blocken, B.; Roels, S.; Carmeliet, J. Modification of pedestrian wind comfort in the Silvertop tower passages by an automatic control system. J. Wind Eng. Ind. Aerodyn. 2004, 92, 849–873. [Google Scholar] [CrossRef]
- Kang, G.; Kim, J.J.; Kim, D.J.; Choi, W.; Park, S.J. Development of a computational fluid dynamics model with tree drag parameterizations: Application to pedestrian wind comfort in an urban area. Build. Environ. 2017, 124, 209–218. [Google Scholar] [CrossRef]
- Leo, L.S.; Buccolieri, R.; Di Sabatino, S. Scale-adaptive morphometric analysis for urban air quality and ventilation applications. Build. Res. Inf. 2018, 46, 931–951. [Google Scholar] [CrossRef] [Green Version]
- Ng, E.; Yuan, C.; Chen, L.; Ren, C.; Fung, J.C. Improving the wind environment in high-density cities by understanding urban morphology and surface roughness: A study in Hong Kong. Landsc. Urban Plan. 2011, 101, 59–74. [Google Scholar] [CrossRef]
- Song, J.; Fan, S.; Lin, W.; Mottet, L.; Woodward, H.; Davies Wykes, M.; Arcucci, R.; Xiao, D.; Debay, J.; ApSimon, H.; et al. Natural ventilation in cities: The implications of fluid mechanics. Build. Res. Inf. 2018, 46, 809–828. [Google Scholar] [CrossRef]
- Vernay, D.G.; Raphael, B.; Smith, I.F. Augmenting simulations of airflow around buildings using field measurements. Adv. Eng. Inf. 2014, 28, 412–424. [Google Scholar] [CrossRef] [Green Version]
- IN-CORE (Interdependent Networked Community Resilience Modelling Environment). Available online: http://resilience.colostate.edu/in_core.shtml (accessed on 24 April 2019).
- Burrough, P.A.; McDonnell, R.A.; Lloyd, C.D. Principles of Geographical Information Systems; Oxford University Press: New York, USA, 2015. [Google Scholar]
- Ding, L.Y.; Zhou, Y.; Akinci, B. Building Information Modelling (BIM) application framework: The process of expanding from 3D to computable nD. Autom. Constr. 2014, 46, 82–93. [Google Scholar] [CrossRef]
- Xu, X.; Ding, L.Y.; Luo, H.B.; Ma, L. From building information modelling to city information modelling. J. Inf. Technol. Constr. 2014, 19, 292–307. [Google Scholar]
- Schiefelbein, J.; Javadi, A.; Lauster, M.; Remmen, P.; Streblow, R.; Müller, D. Development of a city information model to support data management and analysis of building energy systems within complex city districts. In Proceedings of the International Conference CISBAT 2015 Future Buildings and Districts Sustainability from Nano to Urban Scale, Lausanne, Switzerland, 9–11 September 2015. [Google Scholar]
- Padsala, R.; Coors, V. Conceptualizing, managing and developing: A web based 3D city information model for urban energy demand simulation. In Proceedings of the Eurographics Workshop on Urban Data Modelling and Visualisation, Delft, The Netherlands, 23 November 2015. [Google Scholar]
- Monteiro, C.S.; Costa, C.; Pina, A.; Santos, M.Y.; Ferrão, P. An urban building database (UBD) supporting a smart city information system. Energy Build. 2018, 158, 244–260. [Google Scholar] [CrossRef]
- Wang, H. Sensing information modelling for smart city. In Proceedings of the 2015 IEEE International Conference on Smart City/SocialCom/SustainCom (SmartCity), Chengdu, China, 15–17 December 2015. [Google Scholar]
- Almeida, A.; Gonçalves, L.; Falcão, A.; Ildefonso, S. 3D-GIS heritage city model: Case study of the historical city of Leiria. In Proceedings of the 19th AGILE International Conference on Geographic Information Science, Helsinki, Finland, 14–17 June 2016. [Google Scholar]
- Amirebrahimi, S.; Rajabifard, A.; Mendis, P.; Ngo, T. A framework for a microscale flood damage assessment and visualization for a building using BIM-GIS integration. Int. J. Digit. Earth 2016, 9, 363–386. [Google Scholar] [CrossRef]
- Deng, Y.C.; Cheng, J.C.P.; Anumba, C. A framework for 3D traffic noise mapping using data from BIM and GIS integration. Struct. Infrastruct. Eng. 2016, 12, 1267–1280. [Google Scholar] [CrossRef]
- De Laat, R.; Van Berlo, L. Integration of BIM and GIS: The development of the CityGML GeoBIM extension. In 3D Geo-Information Sciences; Springer: Berlin/Heidelberg, Germany, 2011; pp. 211–225. [Google Scholar]
- El-Mekawy, M.; Östman, A.; Shahzad, K. Towards interoperating CityGML and IFC building models: A unified model based approach. In 3D Geo-Information Sciences; Springer: Berlin/Heidelberg, Germany, 2011; pp. 73–93. [Google Scholar]
- Isikdag, U.; Underwood, J.; Aouad, G. An investigation into the applicability of building information models in geospatial environment in support of site selection and fire response management processes. Adv. Eng. Inf. 2008, 22, 504–519. [Google Scholar] [CrossRef]
- Isikdag, U.; Zlatanova, S. Towards defining a framework for automatic generation of buildings in CityGML using building information models. In 3D Geo-Information Sciences; Springer: Berlin/Heidelberg, Germany, 2009; pp. 79–96. [Google Scholar]
- Niu, S.; Pan, W.; Zhao, Y. A BIM-GIS integrated web-based visualization system for low energy building design. Procedia Eng. 2015, 121, 2184–2192. [Google Scholar] [CrossRef] [Green Version]
- Van Berlo, L. CityGML extension for building information modelling (BIM) and IFC. In Proceedings of the Free and Open Source Software for Geospatial (FOSS4G), Sydney, Australia, 1 July 2009. [Google Scholar]
- Revit: Built for BIM. Available online: http://www.autodesk.com/products/revit/overview (accessed on 28 April 2019).
- SuperMap GIS 9D (2019). Available online: https://www.supermap.com/cn/2017/SuperMap-GIS-9D.asp (accessed on 28 April 2019).
- Lu, X.Z.; Zeng, X.; Xu, Z.; Guan, H. Physics-based simulation and high-fidelity visualization of fire following earthquake considering building seismic damage. J. Earthqu. Eng. 2019, 23, 1173–1193. [Google Scholar] [CrossRef]
- Blocken, B.; Janssen, W.D.; Hooff, T. CFD simulation for pedestrian wind comfort and wind safety in urban areas: General decision framework and case study for the Eindhoven University campus. Environ. Model. Softw. 2012, 30, 15–34. [Google Scholar] [CrossRef]
- Jacob, J.; Sagaut, P. Wind comfort assessment by means of large eddy simulation with lattice Boltzmann method in full scale city area. Build. Environ. 2018, 139, 110–124. [Google Scholar] [CrossRef] [Green Version]
- Shi, X.; Zhu, Y.Y.; Duan, J.; Shao, R.Q.; Wang, J.G. Assessment of pedestrian wind environment in urban planning design. Landsc. Urban Plan. 2015, 140, 17–28. [Google Scholar] [CrossRef]
- Hu, Z.Z.; Zhang, X.Y.; Wang, H.W.; Kassem, M. Improving interoperability between architectural and structural design models: An industry foundation classes-based approach with web-based tools. Autom. Constr. 2016, 66, 29–42. [Google Scholar] [CrossRef] [Green Version]
- Oti, A.H.; Tizani, W.; Abanda, F.H.; Jaly-Zada, A.; Tah, J.H.M. Structural sustainability appraisal in BIM. Autom. Constr. 2016, 69, 44–58. [Google Scholar] [CrossRef]
- Ramaji, I.J.; Memari, A.M. Interpretation of structural analytical models from the coordination view in building information models. Autom. Constr. 2018, 90, 117–133. [Google Scholar] [CrossRef]
- Shin, T.S. Building information modelling (BIM) collaboration from the structural engineering perspective. Int. J. Steel Struct. 2017, 17, 205–214. [Google Scholar] [CrossRef]
- Marc: Advanced Nonlinear Simulation Solution. Available online: http://www.mscsoftware.com/product/marc (accessed on 28 April 2019).
- Zeng, X.; Lu, X.Z.; Xu, Z. Modelling technology for building aseismic elasto-plastic analysis based on BIM data. Comput. Aided Eng. 2014, 23, 5–11. (In Chinese) [Google Scholar]
- Xu, Z.; Zhang, H.Z.; Lu, X.Z.; Xu, Y.J.; Zhang, Z.C.; Li, Y. A prediction method of building seismic loss based on BIM and FEMA P-58. Autom. Constr. 2019, 90, 245–257. [Google Scholar] [CrossRef]
- Fire Dynamic Simulator (FDS) and Smokeview (SMV). Available online: https://pages.nist.gov/fds-smv (accessed on 28 April 2019).
- Pyrosim. Available online: https://www.thunderheadeng.com/pyrosim (accessed on 28 April 2019).
- Xu, Z.; Lu, X.Z.; Guan, H.; Chen, C.; Ren, A.Z. A virtual reality based fire training simulator with smoke hazard assessment capacity. Adv. Eng. Softw. 2014, 68, 1–8. [Google Scholar] [CrossRef] [Green Version]
- Fluent. Available online: https://www.ansys.com/products/fluids/ansys-fluent (accessed on 28 April 2019).
- Dynamo BIM. Available online: http://dynamobim.org (accessed on 28 April 2019).
- Franke, J.; Hellsten, A.; Schlünzen, H.; Carissimo, B. Best Practice Guideline for the CFD Simulation of Flows in the Urban Environment, Cost Action 732: Quality Assurance and Improvement of Microscale Meteorological Models; COST Office: Brussels, Belgium, 2007. [Google Scholar]
- Tominaga, Y.; Mochida, A.; Yoshie, R.; Kataoka, H.; Nozu, T.; Yoshikawa, M.; Shirasawa, T. AIJ guidelines for practical applications of CFD to pedestrian wind environment around buildings. J. Wind Eng. Ind. Aerodyn. 2008, 96, 1749–1761. [Google Scholar] [CrossRef]
- Tecplot 360. Available online: https://www.tecplot.com/products/tecplot-360 (accessed on 28 April 2019).
- OpenSceneGraph. Available online: http://www.openscenegraph.org (accessed on 28 April 2019).
- Xiong, C.; Lu, X.Z.; Hori, M.; Guan, H.; Xu, Z. Building seismic response and visualization using 3D urban polygonal modelling. Autom. Constr. 2015, 55, 25–34. [Google Scholar] [CrossRef] [Green Version]
- Xiong, C.; Lu, X.Z.; Huang, J.; Guan, H. Multi-LOD seismic-damage simulation of urban buildings and case study in Beijing CBD. Bull. Earthq. Eng. 2019, 17, 2037–2057. [Google Scholar] [CrossRef]
- Zeng, X.; Lu, X.Z.; Yang, T.; Xu, Z. Application of the FEMA-P58 methodology for regional earthquake loss prediction. Nat. Hazards 2016, 83, 177–192. [Google Scholar] [CrossRef]
- Mechanical Pro. Available online: https://www.ansys.com/products/structures/ansys-mechanical-pro (accessed on 28 April 2019).
- Iqbal, Q.M.Z.; Chan, A.L.S. Pedestrian level wind environment assessment around group of high-rise cross-shaped buildings: Effect of building shape, separation and orientation. Build. Environ. 2016, 101, 45–63. [Google Scholar] [CrossRef] [PubMed]
- Ministry of Housing and Urban-Rural Development of the People’s Republic of China (MOHURD). Code for Seismic Design of Buildings, GB50011-2010; China Architecture Industry Press: Beijing, China, 2010. (In Chinese) [Google Scholar]
- Xiong, C.; Lu, X.Z.; Lin, X.C.; Xu, Z.; Ye, L.P. Parameter determination and damage assessment for THA-based regional seismic damage prediction of multi-story buildings. J. Earthqu. Eng. 2017, 21, 461–485. [Google Scholar] [CrossRef]
- Ministry of Housing and Urban-Rural Development of the People’s Republic of China (MOHURD). Load Code for the Design of Building Structures, GB50009-2012; China Architecture Industry Press: Beijing, China, 2012. (In Chinese) [Google Scholar]
- Murakami, S.; Deguchi, K. New criteria for wind effects on pedestrians. J. Wind Eng. Ind. Aerodyn. 1981, 7, 289–309. [Google Scholar] [CrossRef]
- McGrattan, K.; Hostikka, S.; McDermott, R.; Floyd, J.; Weinschenk, C.; Overholt, K. Fire Dynamics Simulator User’s Guide, 6th ed.; U.S. Department of Commerce, National Institute of Standards and Technology (NIST): Gaithersburg, MD, USA, 2017.


| Previous Research | Present Study | |
|---|---|---|
| Multi-hazard simulation framework covering both individual buildings and urban areas | Studies related to this topic are rarely found in previous research. | To propose such a framework based on a unified data format containing the building information of both individual buildings and urban areas. |
| Multi-hazard simulation for individual buildings | Different hazard analyses demand different building data formats, resulting in a user having to spend much time and labor on building several models for different hazard analyses [1,2,3,4,5,6,7]. | To realize multi-hazard simulation for individual buildings based on a unified database. |
| Multi-hazard simulation for urban areas | (1) The existing platforms adopt empirical or semi-empirical models for several hazards, which lack adaptability given their dependence on historical disaster data [9,10,18,27]. (2) The visualization of outcomes from the existing platforms needs to be improved [9,27]. | To propose a physics-based simulation framework with high-fidelity visualization of analysis results. |
| Class | Wind Effects on Pedestrians | |
|---|---|---|
| A | <5 m/s | No effect on people. |
| B | <10 m/s | Some effects on people. |
| C | <15 m/s | Serious effects on people. |
| D | ≥15 m/s | Very serious effects on people. |
© 2020 by the authors. Licensee MDPI, Basel, Switzerland. This article is an open access article distributed under the terms and conditions of the Creative Commons Attribution (CC BY) license (http://creativecommons.org/licenses/by/4.0/).
Share and Cite
Lu, X.; Gu, D.; Xu, Z.; Xiong, C.; Tian, Y. CIM-Powered Multi-Hazard Simulation Framework Covering both Individual Buildings and Urban Areas. Sustainability 2020, 12, 5059. https://doi.org/10.3390/su12125059
Lu X, Gu D, Xu Z, Xiong C, Tian Y. CIM-Powered Multi-Hazard Simulation Framework Covering both Individual Buildings and Urban Areas. Sustainability. 2020; 12(12):5059. https://doi.org/10.3390/su12125059
Chicago/Turabian StyleLu, Xinzheng, Donglian Gu, Zhen Xu, Chen Xiong, and Yuan Tian. 2020. "CIM-Powered Multi-Hazard Simulation Framework Covering both Individual Buildings and Urban Areas" Sustainability 12, no. 12: 5059. https://doi.org/10.3390/su12125059
APA StyleLu, X., Gu, D., Xu, Z., Xiong, C., & Tian, Y. (2020). CIM-Powered Multi-Hazard Simulation Framework Covering both Individual Buildings and Urban Areas. Sustainability, 12(12), 5059. https://doi.org/10.3390/su12125059