1. Introduction
Reducing greenhouse gas emissions is a prevalent public policy goal in many countries around the world. Many logistics operators encourage more economical driving (‘eco-driving’) in their fleets, which can significantly contribute to the goal of reducing consumption and increasing energy efficiency. However, there is a lack of scientific studies on the effects of particular monetary and non-monetary incentives for eco-driving, especially in organizational conditions and in terms of demonstrating causality, or more precisely, a lack of experiments in controlled conditions. This paper analyses this problem in the transport sector and introduces monetary and non-monetary parameters for the operational life cycle of light commercial vehicles. The results obtained were compared with their hybrid electrical equivalents in the GREET software tool. In order to determine the life cycle cost, an economic model of the vehicle’s life cycle was used, and it was necessary to collect as many input parameters as possible related to energy consumption, and technical and technological specifications. Based on the input and output parameters, the life cycle of each vehicle can be economically analysed. For better fleet monitoring and management, different energy efficiency models were developed, and a simplified model was analysed using the example of a real fleet from a transport company in the Republic of Croatia. The main purpose of this experimental research is to find solutions in the field of fuel consumption and its environmental effects, in order to make savings in fleet ownership costs. Results were obtained through three simulation tools, as each has certain enhanced characteristics (GREET, emissions; AFLEET, TCO and fleet management; FASTSim, vehicle specifications). The results also show additional space for savings when replacing vehicles with alternative propulsion vehicles, due to the reduced cost of ownership, fuel consumption and exhaust emissions in the life cycle of the vehicle.
2. Literature Review
Energy efficiency in Europe has improved by a total of 60% in the last 30 years, and Ruzzenenti and Basosi [
1] analysed the cause of this jump in three segments: (1) the technological advancement of fuel production (increasing fuel economy), (2) the need for stronger propulsion vehicles and (3) the switch transport to heavier commercial vehicles. The change in efficiency was initially aimed at optimizing fuel economy, and later on improving vehicle performance. Further on, optimizations in logistics can be simulated through various models. The features of the emission reduction model framework [
2] present a reduction in the distance the delivery vehicle must travel with a full load on a particular route by sequencing customer visits. The simulations are based on directing the actual delivery vehicle, and suggest that this approach can generate up to 6.9% fuel savings over existing methods. Leonardi and Baumgartner [
3] demonstrate that a large number of decisions in the logistics processes affect energy efficiency, but the impact of CO
2 emissions has not been sufficiently researched. The results of the introduction of IT planning systems show potential improvements in fuel consumption and loading capacity, scarcer use of lighter delivery vehicles, poor choice of vehicle and empty runs.
Electric vehicles have great potential to reduce transport-related fossil fuel consumption as well as pollutant and greenhouse gas (GHG) emissions, due to their use of renewable electricity as the sole energy source. Therefore, the wide-spread deployment of electric vehicles is regarded as an attractive means to mitigate the environmental problems (e.g., air pollution and climate change) resulting from transport activities. Government agencies are trying to promote electric vehicle deployment by allocating considerable funding, as well as promulgating supportive policies. However, the mass adoption of electric vehicles is still impeded by limited charging infrastructure and all-electric-range. All these lead to a critical research topic [
4] of the analysis and estimation of electric vehicles’ energy consumption under real-world traffic conditions. The model’s performance was evaluated by comparing it with the performances of a baseline model adapted from existing models. The results show that the proposed electric vehicle link-level energy consumption estimation model outperforms the existing models in terms of accuracy, implying that it is quite promising in various on-board electric vehicle applications.
Energy consumption in electric vehicles [
5] is variable and dependent on a number of external factors, such as road topology, traffic, driving style, ambient temperature, etc. The goal of this research is to detect and quantify correlations between the kinematic parameters of the vehicle and its energy consumption. Based on the vehicle dynamics equation as the underlying physical model, multiple linear regression was used to construct different models. Models have dissimilar fit but similar accuracy. This means that great potential exists for the future improvement of those models.
Investigating autonomous vehicles’ role in road mobility, Zsombók and Zöldy [
6] focus on plug-in-hybrid vehicles that marge the most relevant propulsion systems: the electric drivetrain and the internal combustion engine. The mileage and refuelling of autonomous vehicles are a rarely investigated area, but its role in the successful implementation of autonomous vehicles is inevitable. In this research, the aim is to set up a model that describes the main influences on vehicle energy balance, and to optimize its refuelling according to drivers’ preferences. To test and simulate the model, the simulation of the environment is a must.
In contrast to previous research results, Ke W. et al. [
7] indicate a reduction of Well-to-Wheels (WTW) CO
2 emissions by 32% compared to conventional vehicles. By 2030, emission reductions in electric vehicles should reach 100 g/km, and although WTW NO emissions are currently up to 66%, NO
x reductions are expected to be 41%. The results of this research indicate the significance of fine-grained and real-world features when assessing the WTW energy and environmental effects of electric vehicles. An environmental life-cycle assessment based on real conditions and emissions through fuel refinery data was analysed in a study by Hooftman N. et al. [
8]. The analysis results target policy makers, with the intention that regulations and policies would be developed in the future and target the characterization of non-exhaust emissions from vehicles. These results indicate that electric vehicles offer a valid solution for addressing the urban air quality issue.
Regarding to substantial impacts of transport on the environment, society and the economy, Mitropoulos and Prevedouros [
9] strongly urge the incorporation of sustainability into transport planning. Major developments that enhance transport sustainability include alternative fuels, electric drives and other novel technologies for vehicle propulsion. The authors present a sustainability framework that enables the assessment of transport vehicle characteristics. The identified indicators are grouped into five sustainability dimensions: (1) environment, (2) technology, (3) energy, (4) economy and (5) users. The sustainability performance of some new technologies currently suffers from limitations in engine and battery performance, comfort and convenience, and the availability of charging stations.
Thermal waste in the production of lithium-ion batteries still remains a major problem. Wang Q. et al. [
10] discuss ways of producing energy, with the aim of the accurate thermal analysis of batteries. Maximum profits can be achieved by monitoring systems [
11] and managing resources for optimal utilization. Energy efficiency models have proven to play an important role in reducing transport costs and negative environmental impact. Due to this negative environmental impact, the main finding of Notter et al.’s study [
12] is that the impact of a Li-ion battery used in BEVs for transport service is relatively small. The Li-ion battery plays a minor role in the assessment of the environmental burden of electric mobility. Thus, a Li-ion battery in a BEV does not lead to an overcompensation of the potential benefits of the higher efficiency of BEV compared to an ICEV. On the other hand, the production phase of the battery highlights critical issues, as global warming impacts are dominated by energy use in manufacturing (>50%), electronics (30%) and the cathode (10%). The transport of raw materials and components has little (3%) impact [
13].
Most fleets are heterogeneous and have a large number of vehicles of different ages, which makes it even more difficult for management to take appropriate action [
14]. Because of those facts, the proposed information system will track all crucial information for efficient sustainable energy consumption. The results of the case study show, in the transport company, positive results regarding the energy efficiency (around 8%) and greenhouse gas emissions (around 5%), which is a confirmation that implementing the method supported by the featured information system, especially in developing countries, with minor investments, might reap prominent positive effects.
During the route to full automation, vehicles take over more and more driving functions from the driver [
15]. This research aims to build the fuel economy and refuelling predictions of these vehicles. The model incorporates all external and internal parameters (a mixture of data from the vehicle and refuelling station decisions) that could have a measurable and predictive effect on fuel consumption and the refuelling of the vehicle.
Alternative propulsion vehicles have become the focus in an increasing number of studies. Lozanovski A. et al. [
16] investigated Hydrogen fuel cell (H2FC) buses operating in every day public transport services around Europe. They assessed H2FC for their sustainability against (1) environmental, (2) economic and (3) social criteria. As part of this assessment, buses are evaluated against diesel buses both in terms of sustainability and meeting real world requirements with respect to operational performance. The study concludes that H2FC buses meet operability and performance criteria when ‘green’ hydrogen is used. In terms of affordability, buses will achieve parity with their fossil fuel equivalents by 2030 when the indirect costs to human health and climate change are included.
Several studies have been carried out by local government across the world on the use of sustainable and 100% zero-emission public transport, following increased public awareness [
17]. Increasing greenhouse gas emissions (GHG) due to transport systems in the world make it necessary to establish so called zero-emission sustainable transport systems. A dynamic model based on the Total Cost of Ownership (TCO) from well to wheel has been proposed for the three groups of transport, namely diesel, CNG (compressed natural gas) and electric buses. The data used in the proposed approach is created by performing actual field performance tests for diesel, CNG and electric buses under real Istanbul road, time and trip conditions. Also, the authors made an economic analysis of their model using Net Present Value (NPV), Internal Rate of Return (IRR) and Payback Period (PB) methods considering TCO values and updated unit prices, which are carried out for the investment versus profitability analysis to compare the different public bus concepts. The results show that the electric bus concept with a charging station depot achieves sustainable and zero-emission goals.
The learning from the literature review indicates that transport companies are actively seeking optimal ways to implement electric vehicles in their fleet. The most common way is to implement a different information system. This information system uses different parameters for optimizing the fleet. The most important parameters are: (1) cost of ownership, (2) fuel consumption, (3) greenhouse gas emissions and (4) energy savings.
4. Achieving Eco-Efficiency through Life Cycle Assessment
Eco-efficiency stimulates the development of innovative systems and products. There are many examples of direct application in logistics and in new market approaches (eco-friendly tool design, LCA, vehicle functionality).
To minimize the negative environmental impact, companies should monitor resource consumption for each unit, as well as the amount of materials disposed. This can easily be achieved by monitoring it through the LCA (Life Cycle Assessment), as it serves as a management tool for determining the company′s eco-efficiency level. The current LCA methodology should be adapted to the different needs of the entities to be more effective. The problem of using LCA energy efficiency analysis is stated in [
18]:
Other obstacles include complexity, arbitrariness and problems in interpreting the results obtained. The LCA can serve as an additional support for decision making in order to achieve high eco-efficiency. Although partial LCA is the focus of criticism, a simplified methodology is essential for wider application.
The following are examples of currently developed simplified LCA models used in studies [
22]:
Limiting or removing some phases;
Simpler calculations focused only on some categories (GHG emissions without their health impacts and loss of resources, as these are not easily measurable parameters);
Component restriction (components that have less than 5% of the total mass of the product under observation);
Software and commercial databases.
The strategic lines used by several Member States of the European Union address the issue of reducing emissions and energy consumption in the transport sector, all from an environmental performance perspective, which can be classified as follows [
22]:
4.1. Vehicle Operation Energy
There are two types of base fuels for vehicles in the GREET model: (1) gasoline (spark-ignition engine) and (2) diesel (compression-ignition engine). For the gasoline and diesel vehicles, there are given FE (fuel economy) and emission factors as model inputs. For vehicles using non-base fuels, the FE is given as a scaling factor to the gasoline vehicle FE, and emission factors are given as a scaling factor for the gasoline or diesel vehicle, depending on the engine ignition type. Thus, if a calculation is performed for a non-baseline vehicle, the FE and emission factors need to be scaled. Once the FE and emission factors are calculated, the energy and emission factors associated with the vehicle usage can be calculated [
23]. The general formula for calculating vehicle operation energy per unit of distance travelled is (1):
where
F represents fuels in the blend and
s(
f) is volumetric fuel share.
The formula assumes that the vehicle fuel is a blend, and no electricity is used to propel the engine. When electricity is used to propel the engine, there are two operational modes (1) charge depleting (CD) and (2) charge sustaining (CS). Below are the formulas used in the GREET model to calculate the energy use associated with each of the modes.
4.1.1. Energy Use in Charge Depletion Mode (CD)
Electric energy use in CD mode per unit of distance travelled is given by (2):
where
B represents Electricity Consumption
, and
is charger efficiency (currently, the default value for all of the vehicles is 85%).
Total energy is given by (3):
where
stands for fuel energy use.
4.1.2. Energy Use in Charge Sustaining Mode (CS)
Electric energy use in CS mode per unit of distance travelled is the same formula as
given by (1). To combine CD and CS modes, we need to calculate the Utility Factor (UF). The UF is the ratio of kilometres travelled in CD mode to total kilometers travelled (in CD and CS modes combined). When we combine CD and CS energy use for HEV, the calculation is as it follows (4):
4.2. Renewing Vehicle Fleet
Vehicle manufacturers and administrative bodies take important measures to improve vehicle performance. The increase in the number of vehicles in use and the mileage also increases energy consumption. For this reason, it is important for fleet-owned logistics operators to take fuel consumption into account when replacing them. When viewed in this way, it is important to evaluate all vehicle development processes from production to disposal [
15].
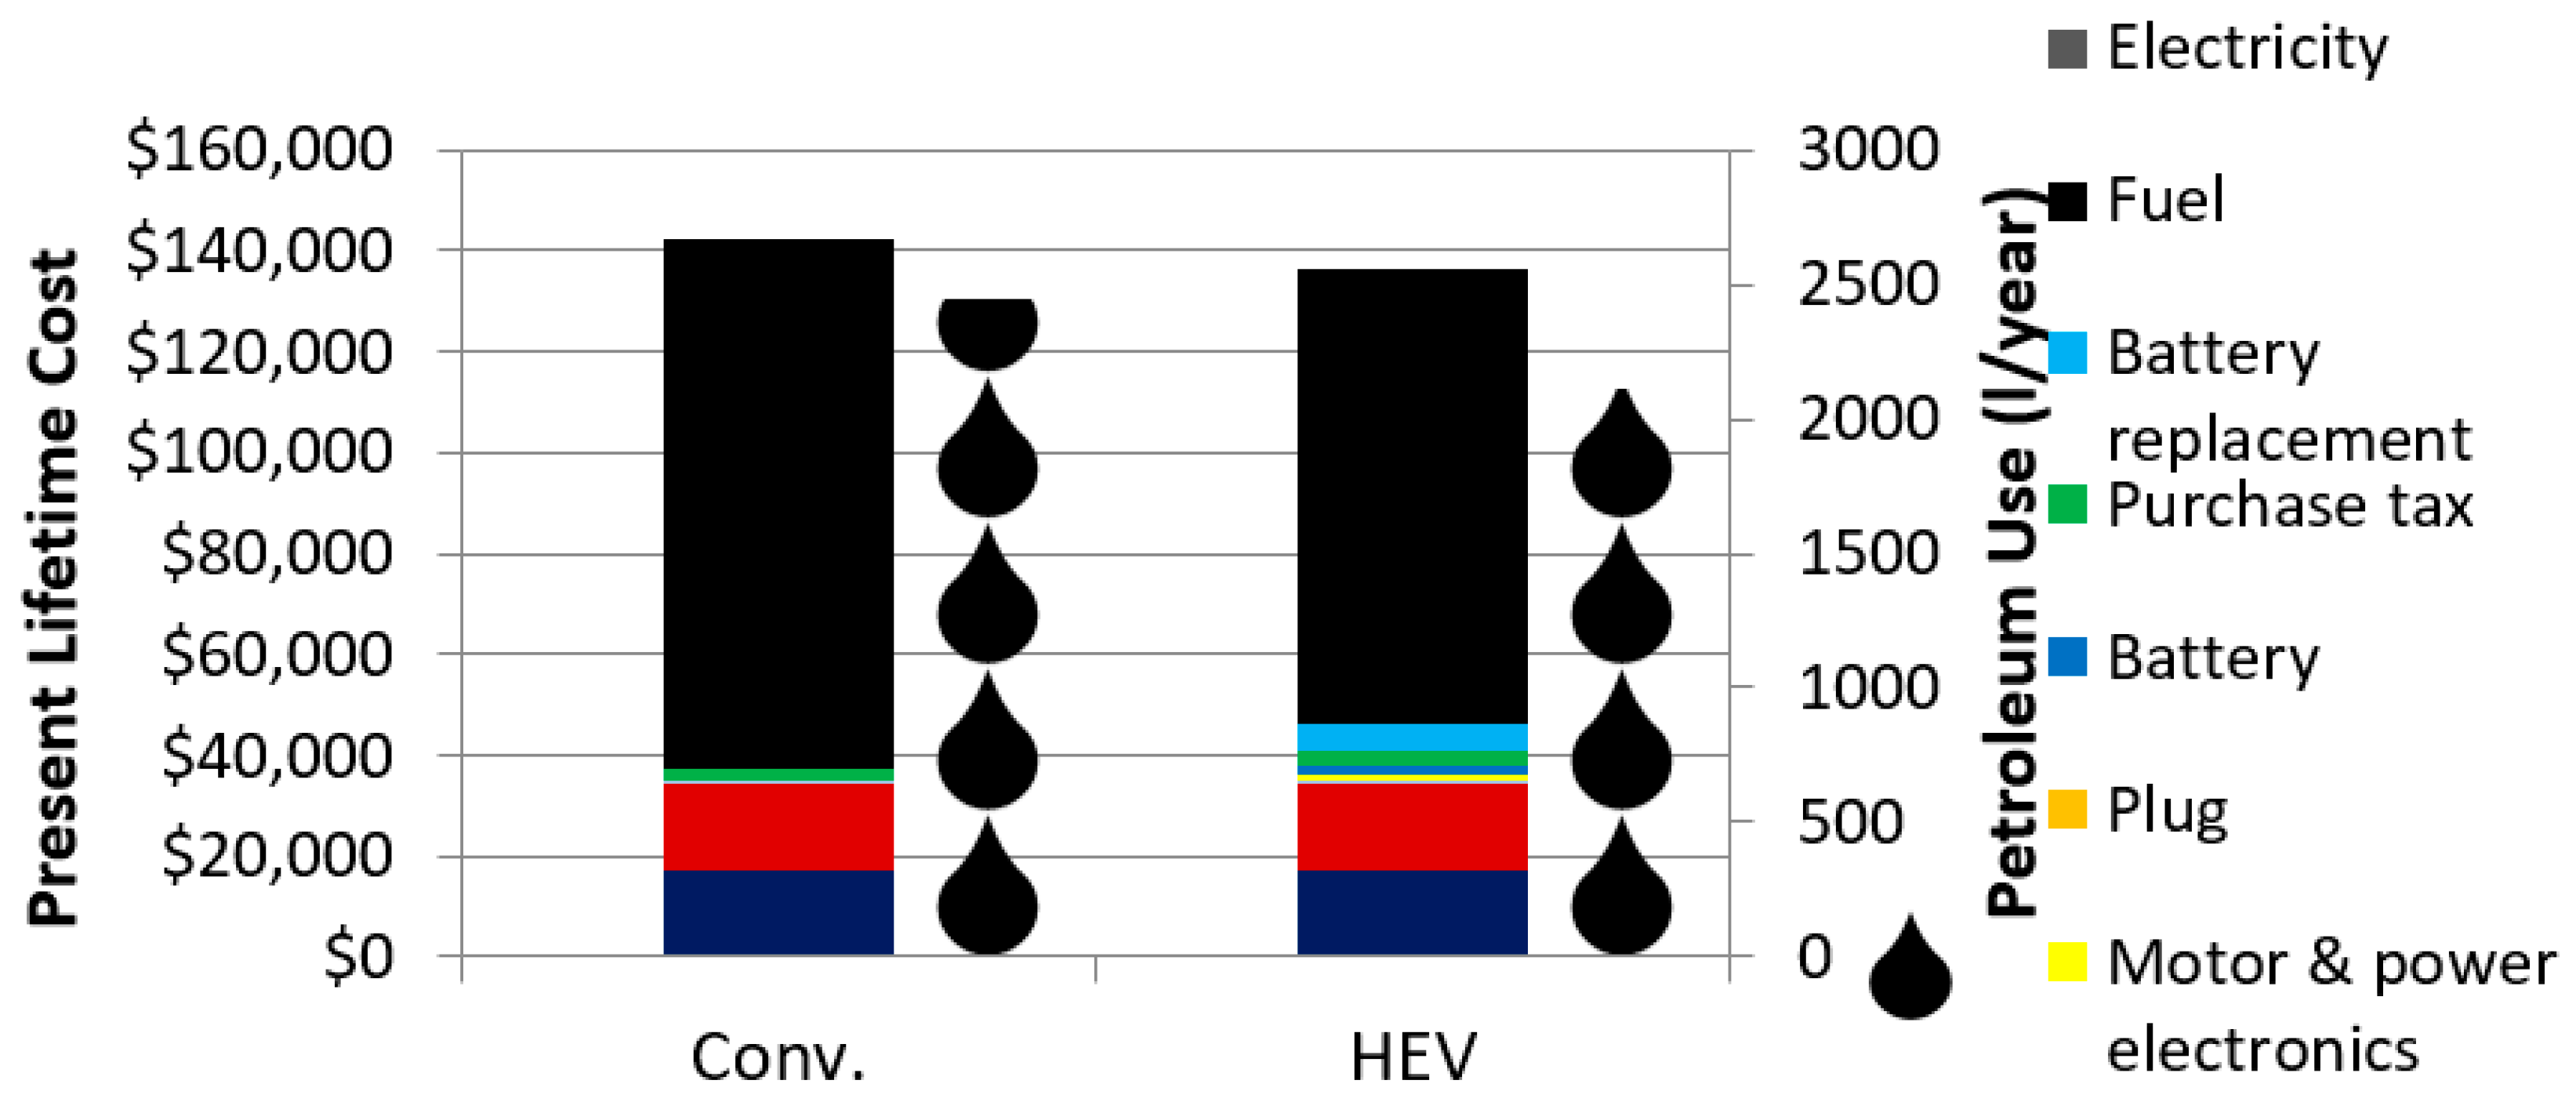
In the following views, a comparison of the entire life cycle cost of the vehicle through the software tool FASTSim can be seen. Therefore,
Figure 2 shows a comparison of the lifecycle cost for a light delivery vehicle, namely a comparison of the diesel and hybrid variants of the same vehicle. It can be seen that a conventional vehicle has lower costs of production, maintenance and purchase, but the difference in fuel consumption is greater than the consumption of the hybrid equivalent, which makes it less cost-effective in the total life-cycle cost. Within FASTSim, the unit parameters for the two vehicle types (conventional diesel and hybrid-electric) were determined, and the results were applied to the vehicle fleet later. Those input parameters are named VehicleIO, which consists of several categories [
21]:
Based on the presented life cycle costs of the vehicle fleet, the replacement of the vehicle is the most cost-effective when replacing with a hybrid electric vehicle, due to significant subsidies offered in the procurement of alternative propulsion vehicles. However, the problem of carrying capacity and disposal (recycling of the battery) in such vehicles has not yet been resolved, and represents a further research task.
There are many studies evaluating various components of vehicles from an LCA perspective to enhance their design and thus minimize their negative environmental impact. Other studies evaluate the level of environmental impact for different materials in component production [
24,
25].
4.3. Emissions and Consumption Rate
According to the European Automobile Manufacturers (ACEA), the tendency towards lower levels of atmospheric emissions in the production of new vehicles is the result of road congestion from 1995 to 2004. After estimating fuel consumption, it is possible to convert fuel consumption to powertrain: 1 L of diesel fuel per 100 km emits 26.6 gCO
2/km; 1 L of gasoline per 100 km emits 23.7 gCO
2/km [
22]. Fuel consumption tends to decline progressively over time, reducing consumption by 1.14% annually for gasoline and 1.47% for diesel fuel. Through this downward trend, the fuel savings when replacing a vehicle are determined by the age of the replaced vehicle and the associated consumption rate [
14].
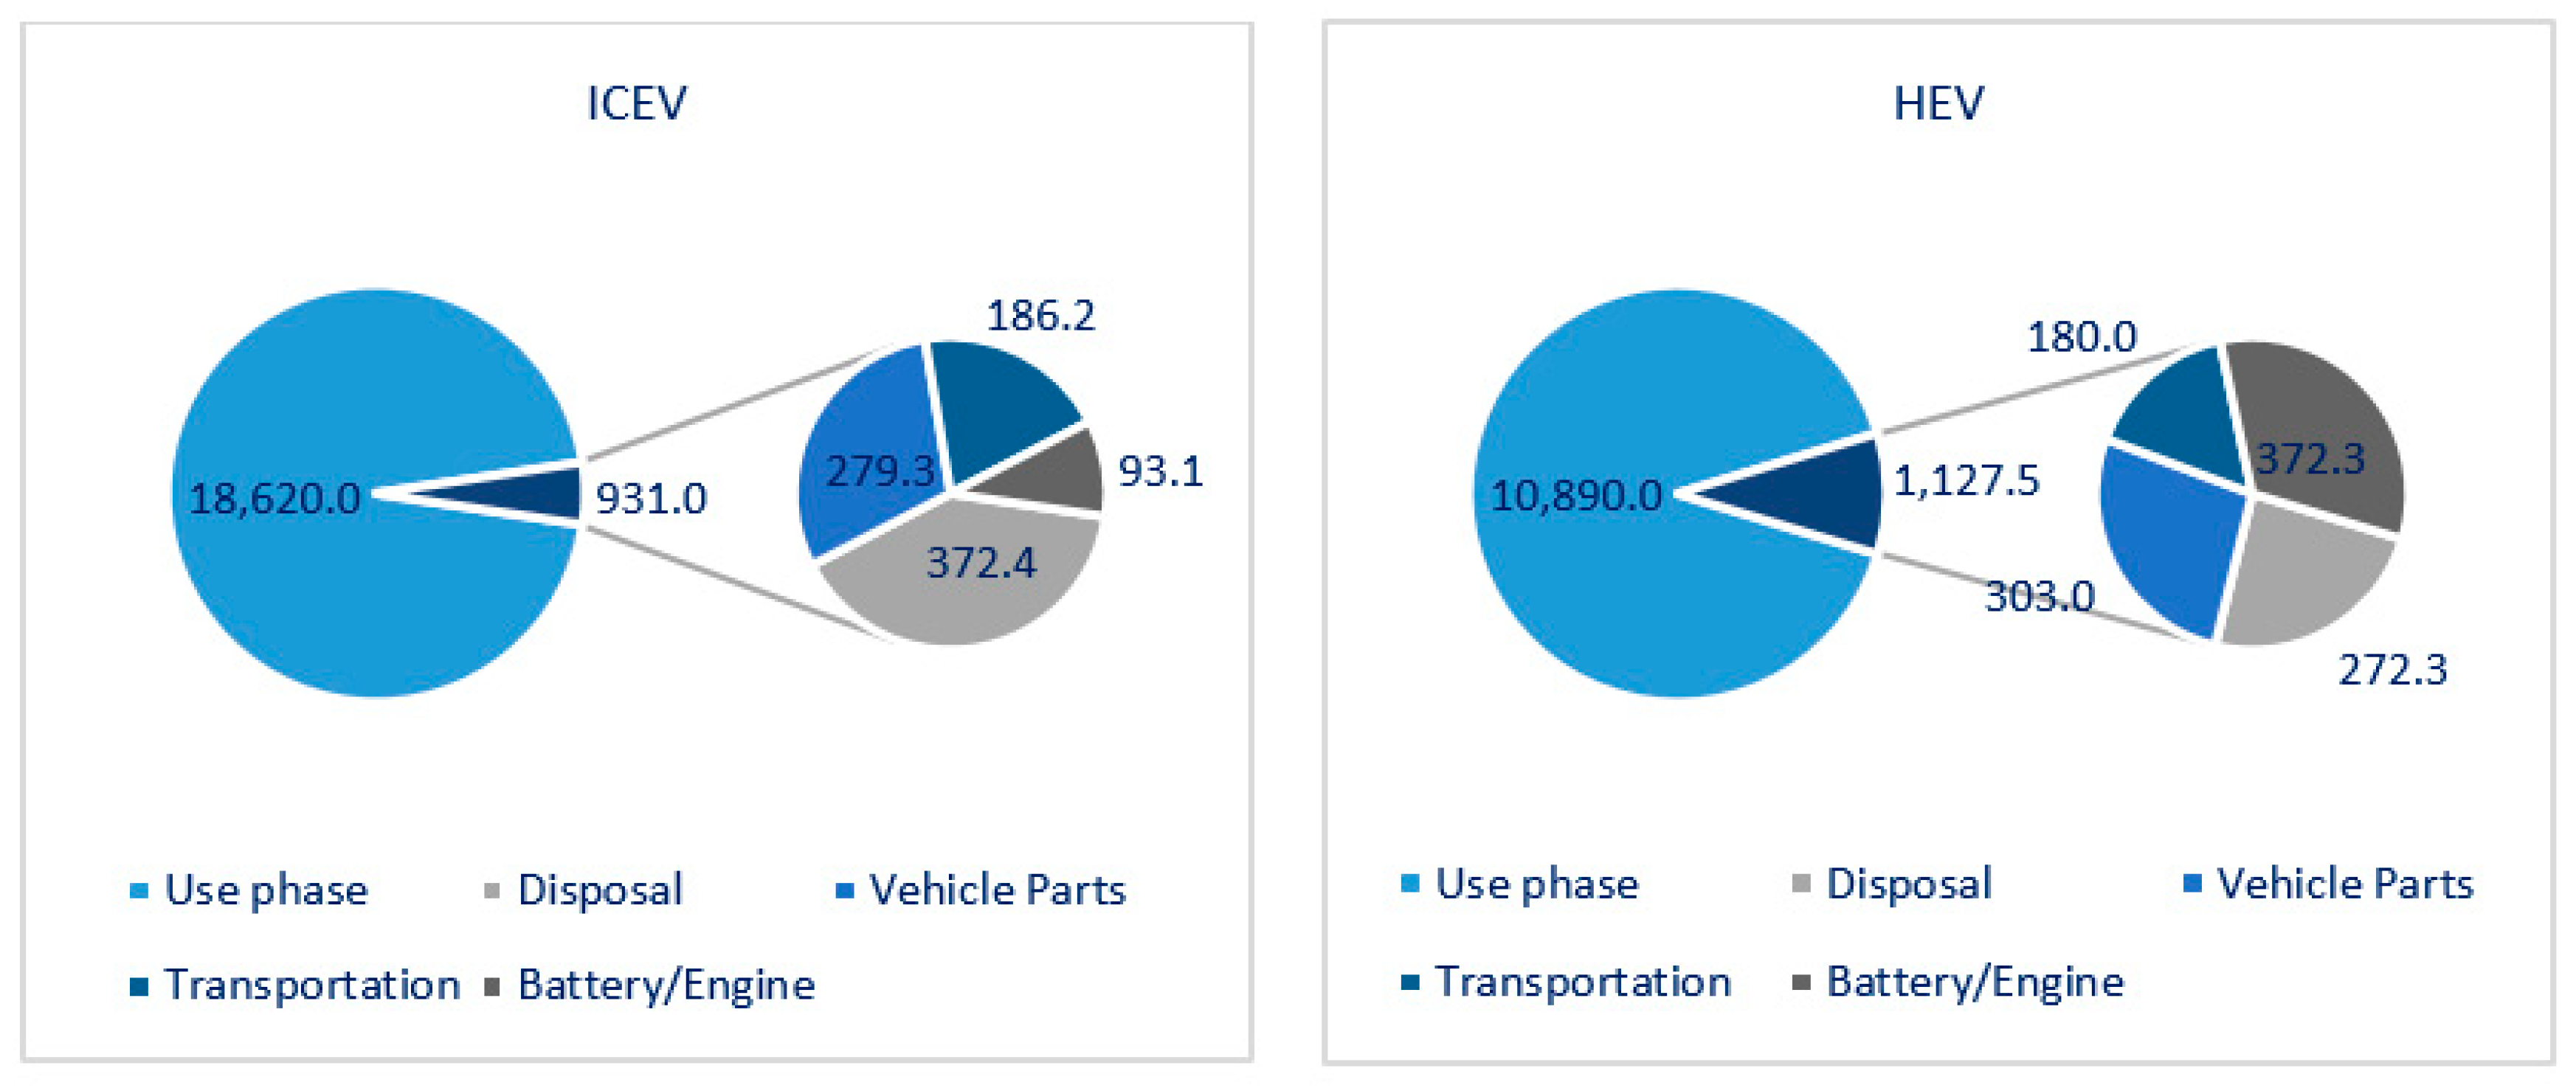
Based on the observed vehicle fleet data inserted into the GREET model, an estimate of CO
2 equivalent emissions for diesel and hybrid electric light commercial vehicles was made (
Figure 3). Emissions are, most of the time, emitted because of combustion technologies, but non combustion emissions can also be defined in the processes. Emissions have physical properties that are important for emission calculations: (1) carbon ratio, (2) sulphur ratio, and (3) global warming potential (GHG emissions). Vehicle emissions are frequently used in technologies expressed in mass per amount of energy combusted, and they are arranged by lifecycle phases. Vehicles are used in the GREET model to calculate the WTW (well to wheels) analysis, and are defined by: (1) energy efficiency (l/100 km), (2) fuel used and their upstream by volumetric shares, and (3) combustion and non-combustion emissions. The results can then be observed in the WTW tab of the software, where all vehicles are categorized by fuel used. Emissions also follow the trend of the lifelong cost of vehicles, as the conventional vehicles in the phase of operation emit the highest percentage of CO
2 (96%). For hybrid electric vehicles, this percentage is 91%, but battery manufacturing is responsible for 3% of emissions. For this reason, replacing conventional vehicles with hybrid electrical equivalents is more cost-effective for an existing fleet [
23].
4.4. Freight Transport and Fuel Economy Relationship
Fuel economy is the ratio of fuel consumed and distance travelled, generally expressed in litres of fuel consumed per 100 km. Although it is a heterogeneous indicator as energy intensity, it mimics the efficiency of physical labour (work/energy) each time it is properly calculated. For this reason, the distance travelled must be measured by the speed and mass of the vehicle (i.e., the vehicle, goods and passengers). There are some other factors affecting fuel economy, which are divided into endogenous (engine size and power) and exogenous factors (average driving speed, road grade, road conditions, driver behaviour). The most important exogenous factor is the percentage of cargo space occupancy out of the total, called load factor [
15].
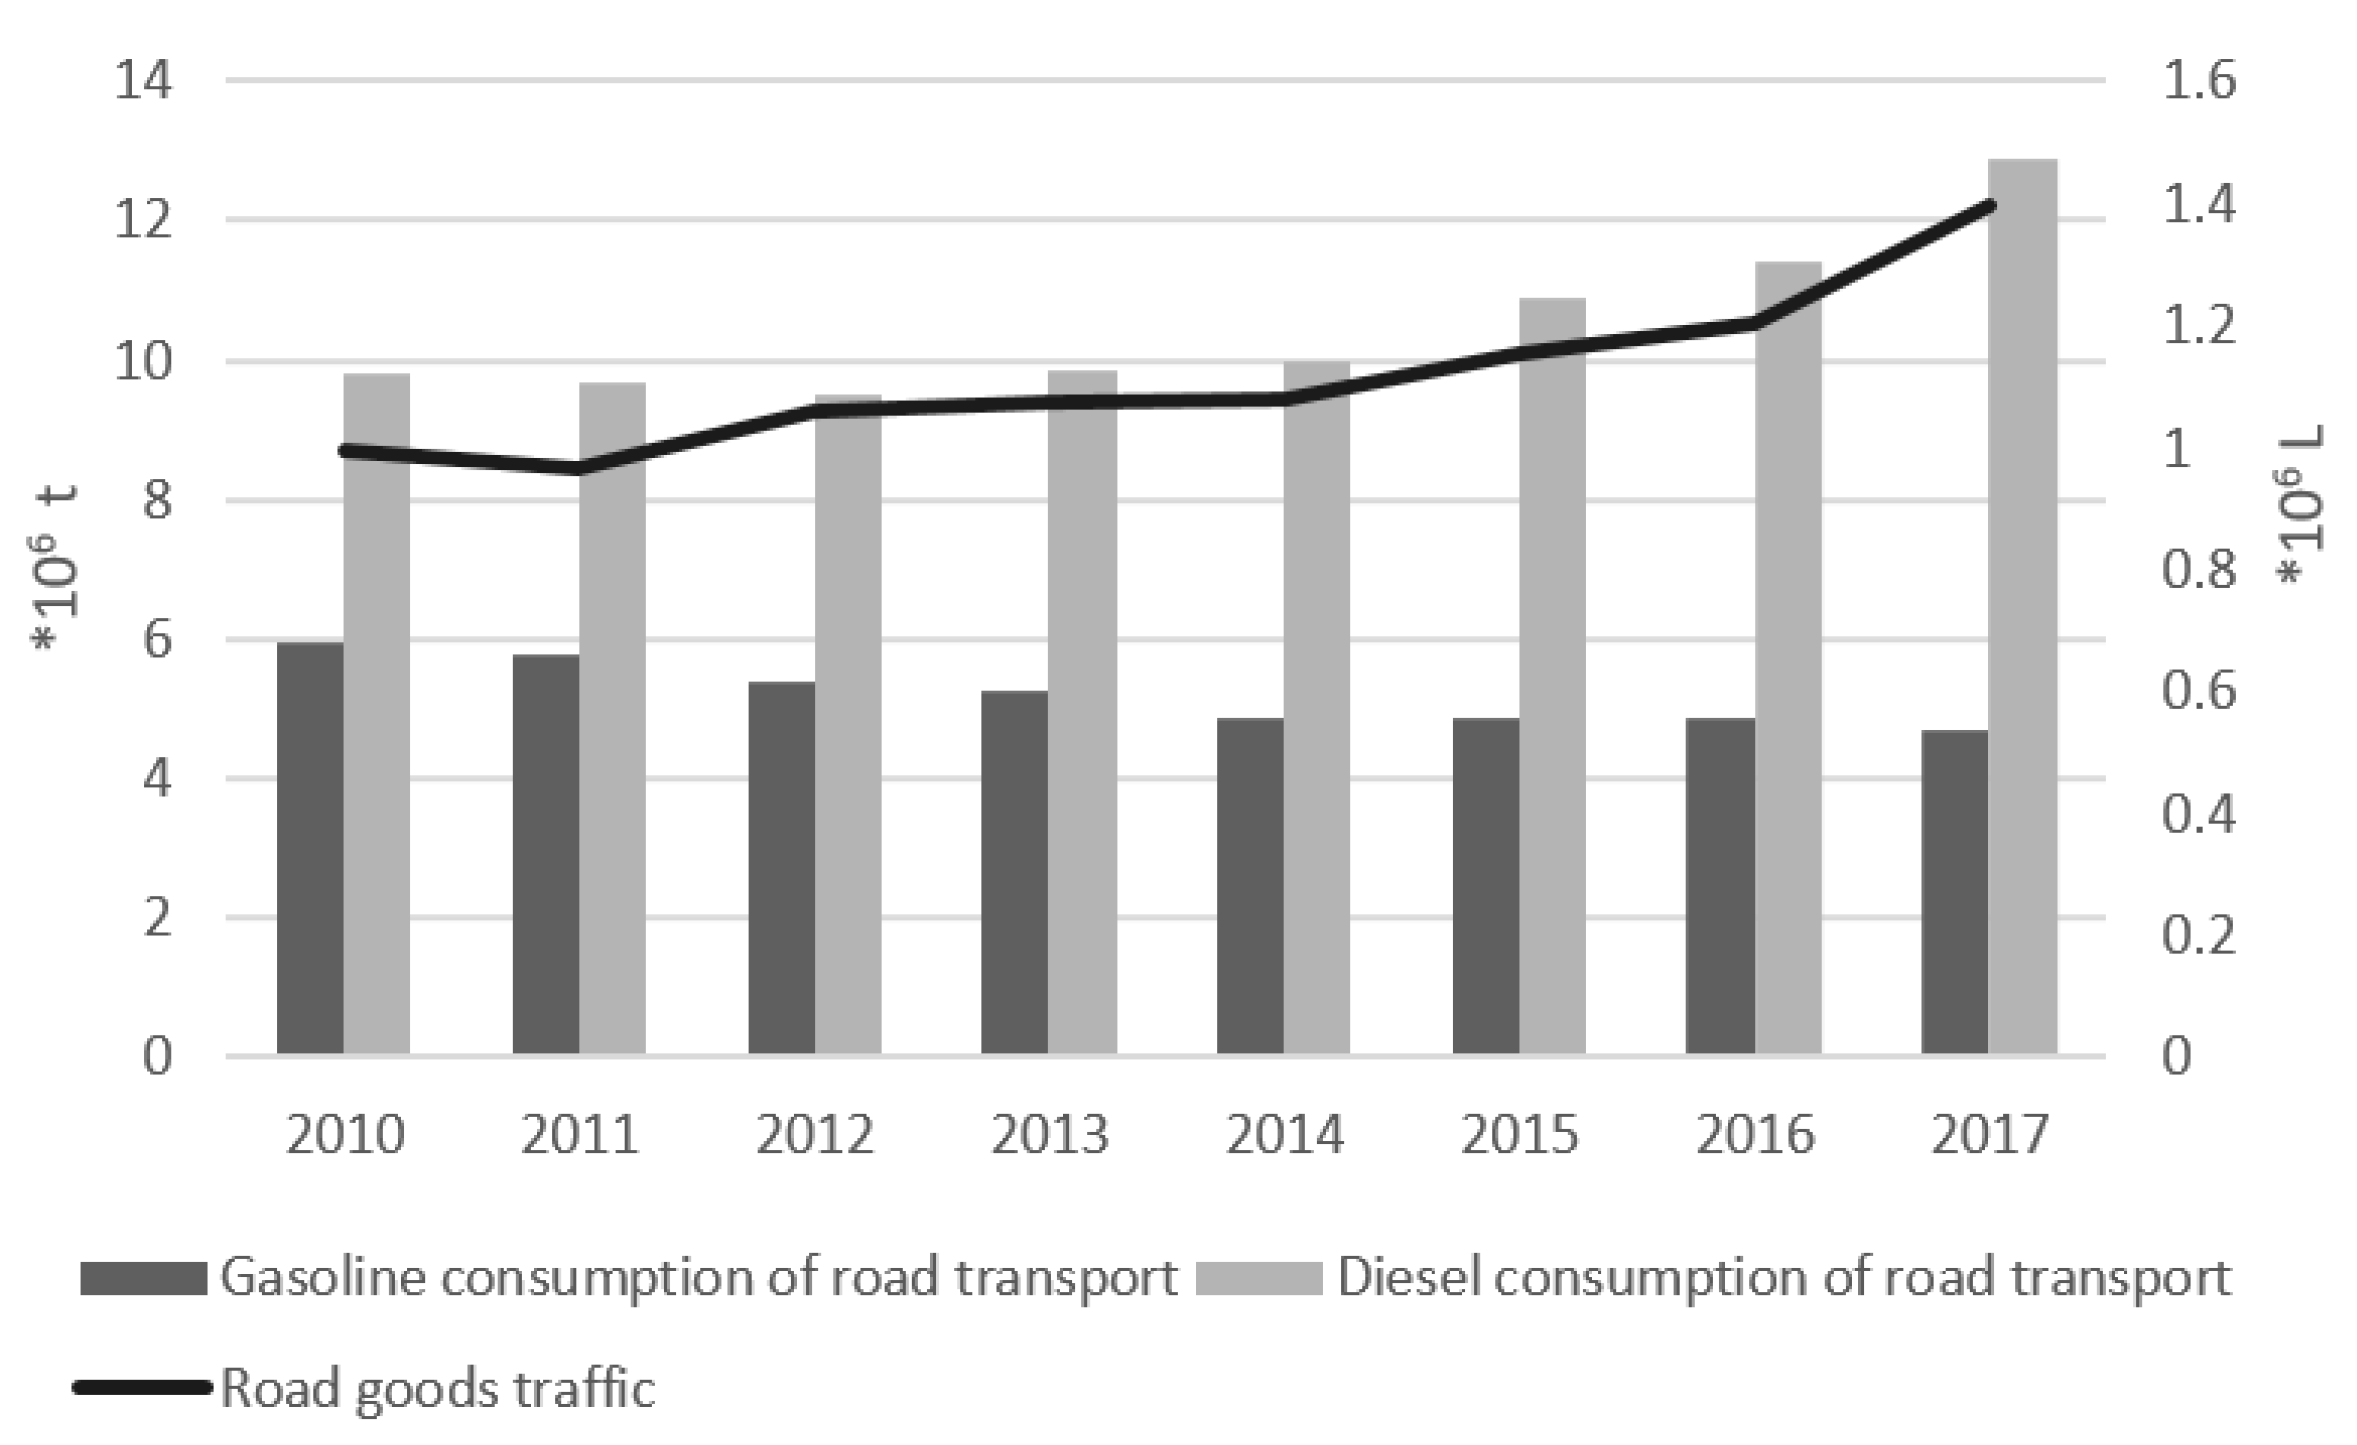
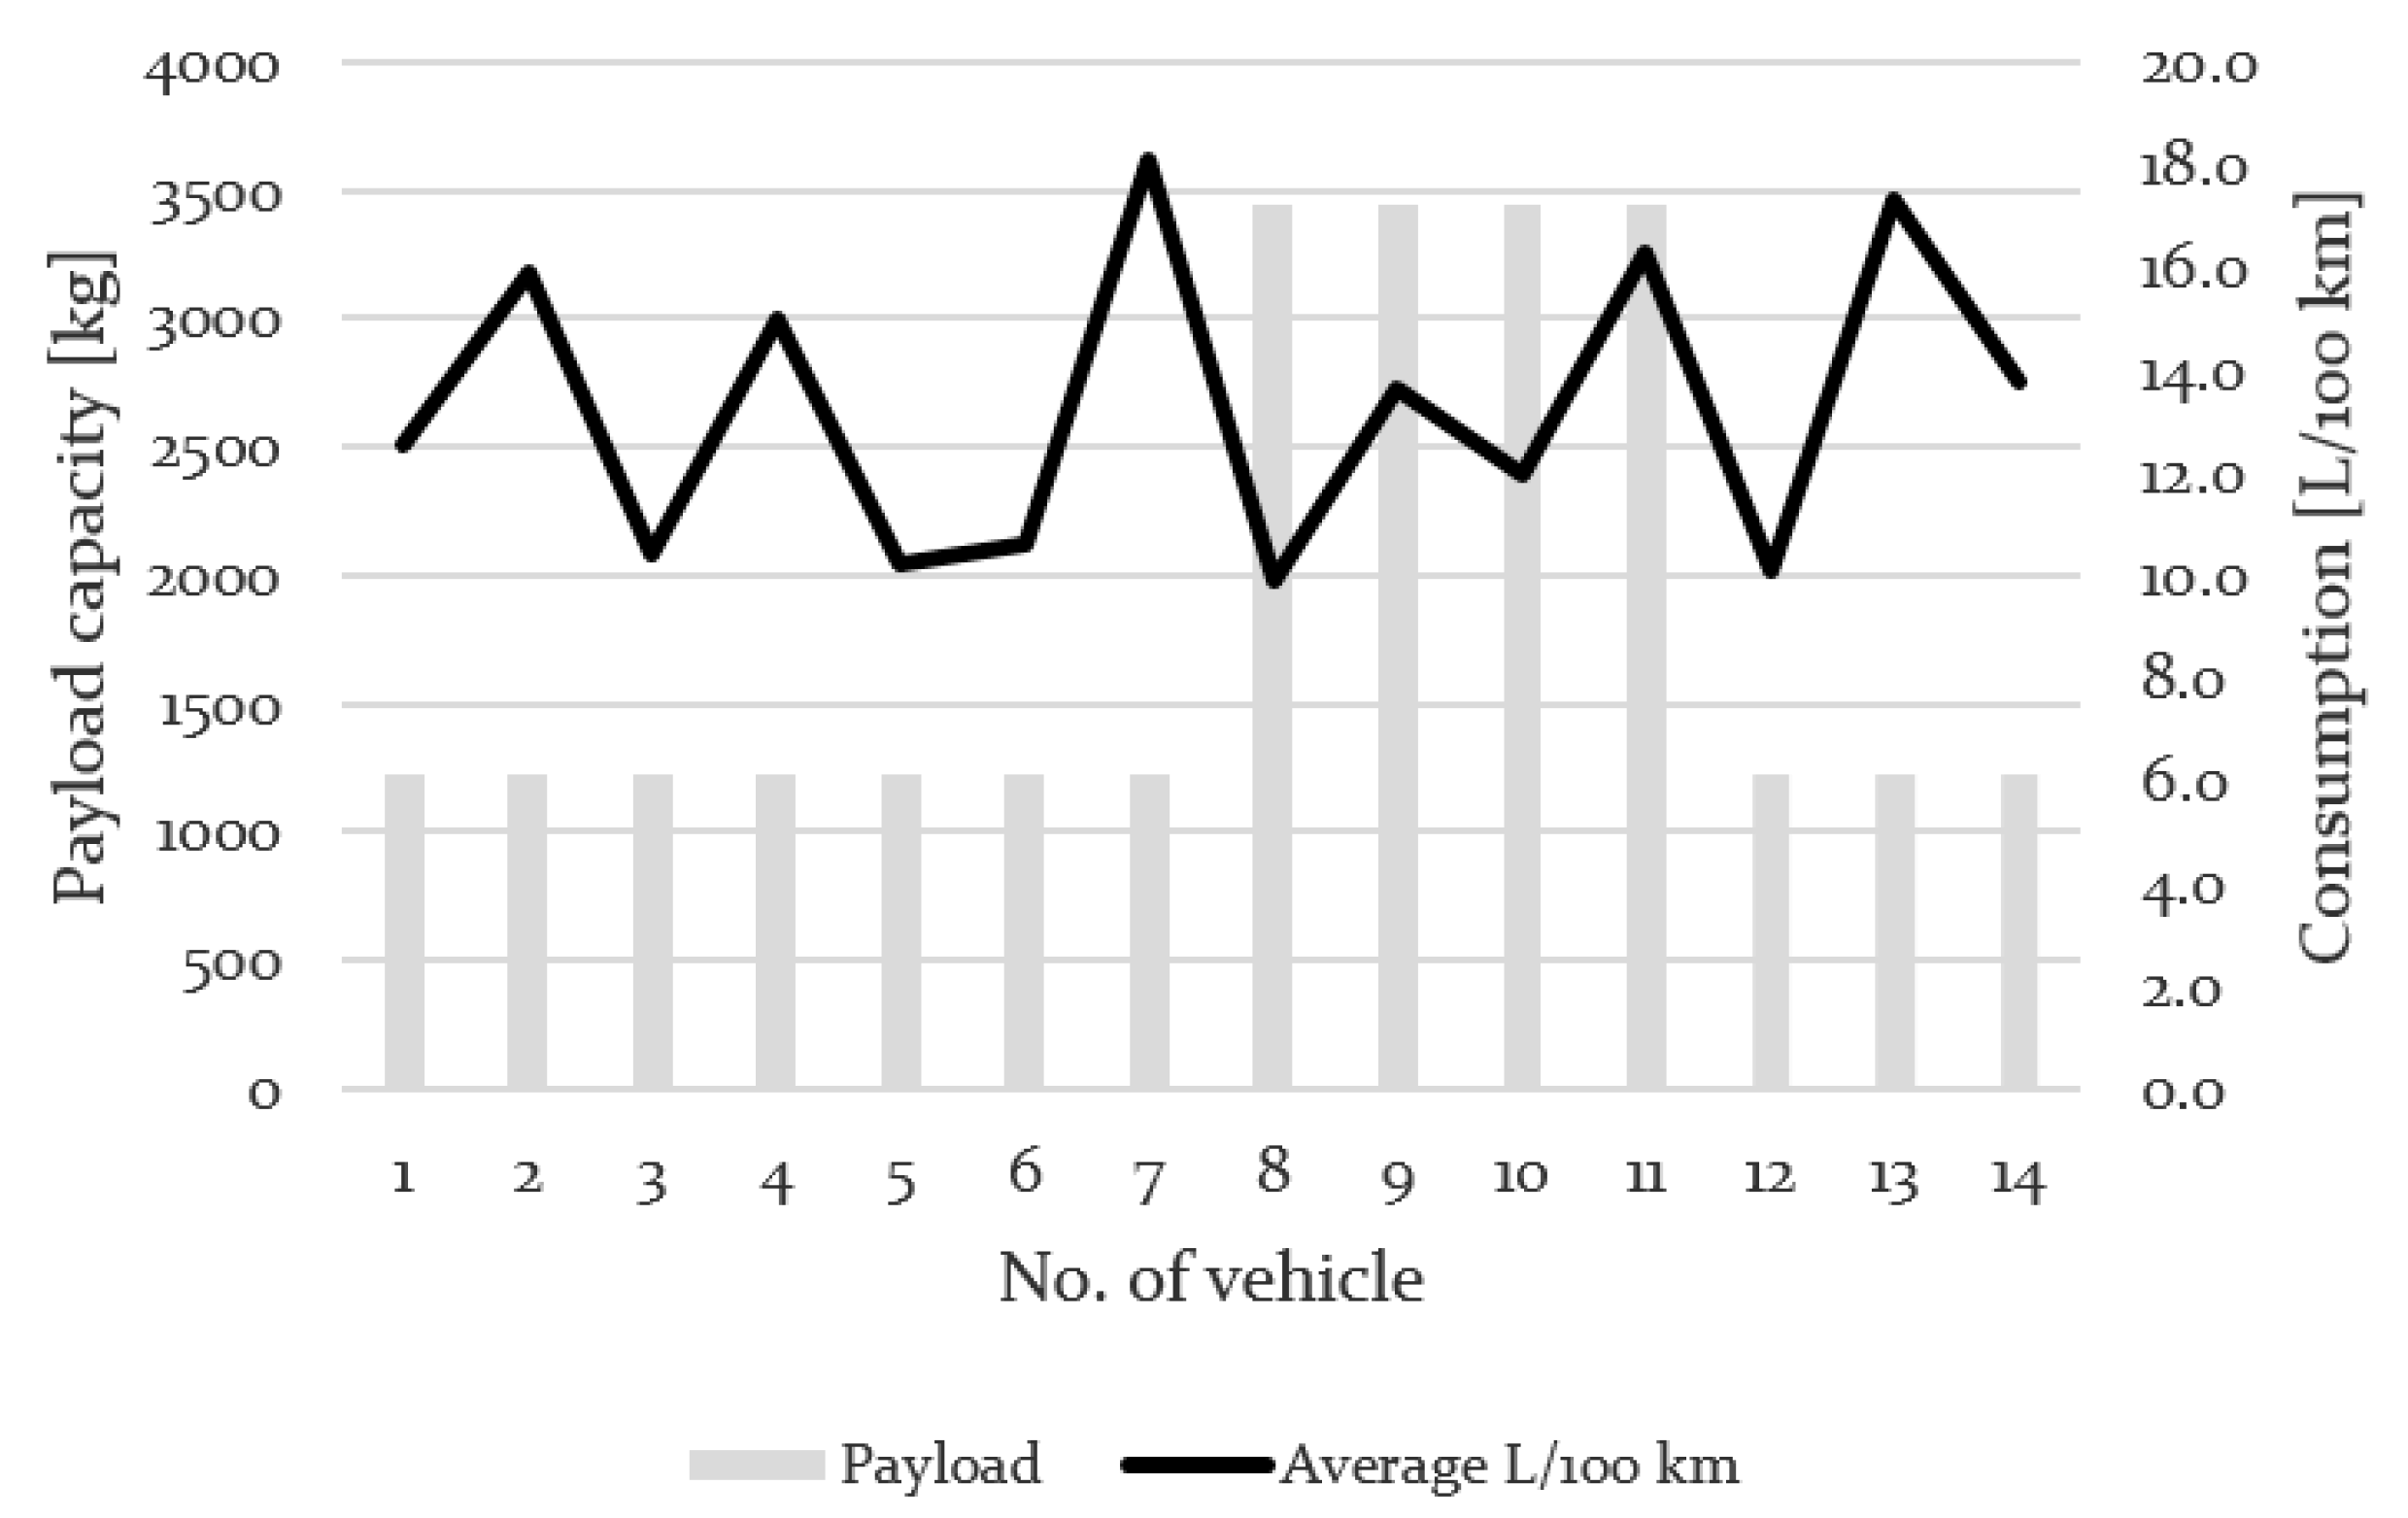
On the basis of a simplified model of the calculation of fuel economy, which analyses the relationship of average fuel consumption per 100 km travelled and the payload capacity of the vehicle, the following presentation can interpret the situation in the Republic of Croatia (
Figure 4). The significant annual increase in goods traffic in Croatia does not affect the increase in fuel consumption (and the number of medium duty vehicles in national fleet); therefore, it can ultimately be concluded that energy efficiency is increasing. According to ACEA [
26], the annual increase in the number of new light commercial vehicles is around 1.1%.
For further assessments, it is necessary to determine the difference between the technical and operative life of the vehicle. From an environmental point of view, the solution is to replace a worn-out vehicle with a more technologically advanced one, with the aim of prolonging the operative life and reducing the amount of energy expended in the materials used for production [
14].
4.5. Improving Fuel Economy by Connecting Vehicles
Consumption tracking can also be improved with sensors and communication between vehicle and operator; this technology is known as CAV (Connected and Autonomous vehicles). Currently available components of such a system include the camera, radio range detection (RaDAR), light range detection (LiDAR), global positioning systems (GPS) and driving cycle bases. In the testing phase, and in the near future in application, there are more advanced global satellite positioning systems (GNSS), vehicle-to-vehicle (V2V) communication, vehicle-to-infrastructure (V2I), and vehicle-to-environment (V2X) communications. Each of these sensors and signals tend to improve the energy savings of alternative vehicles.
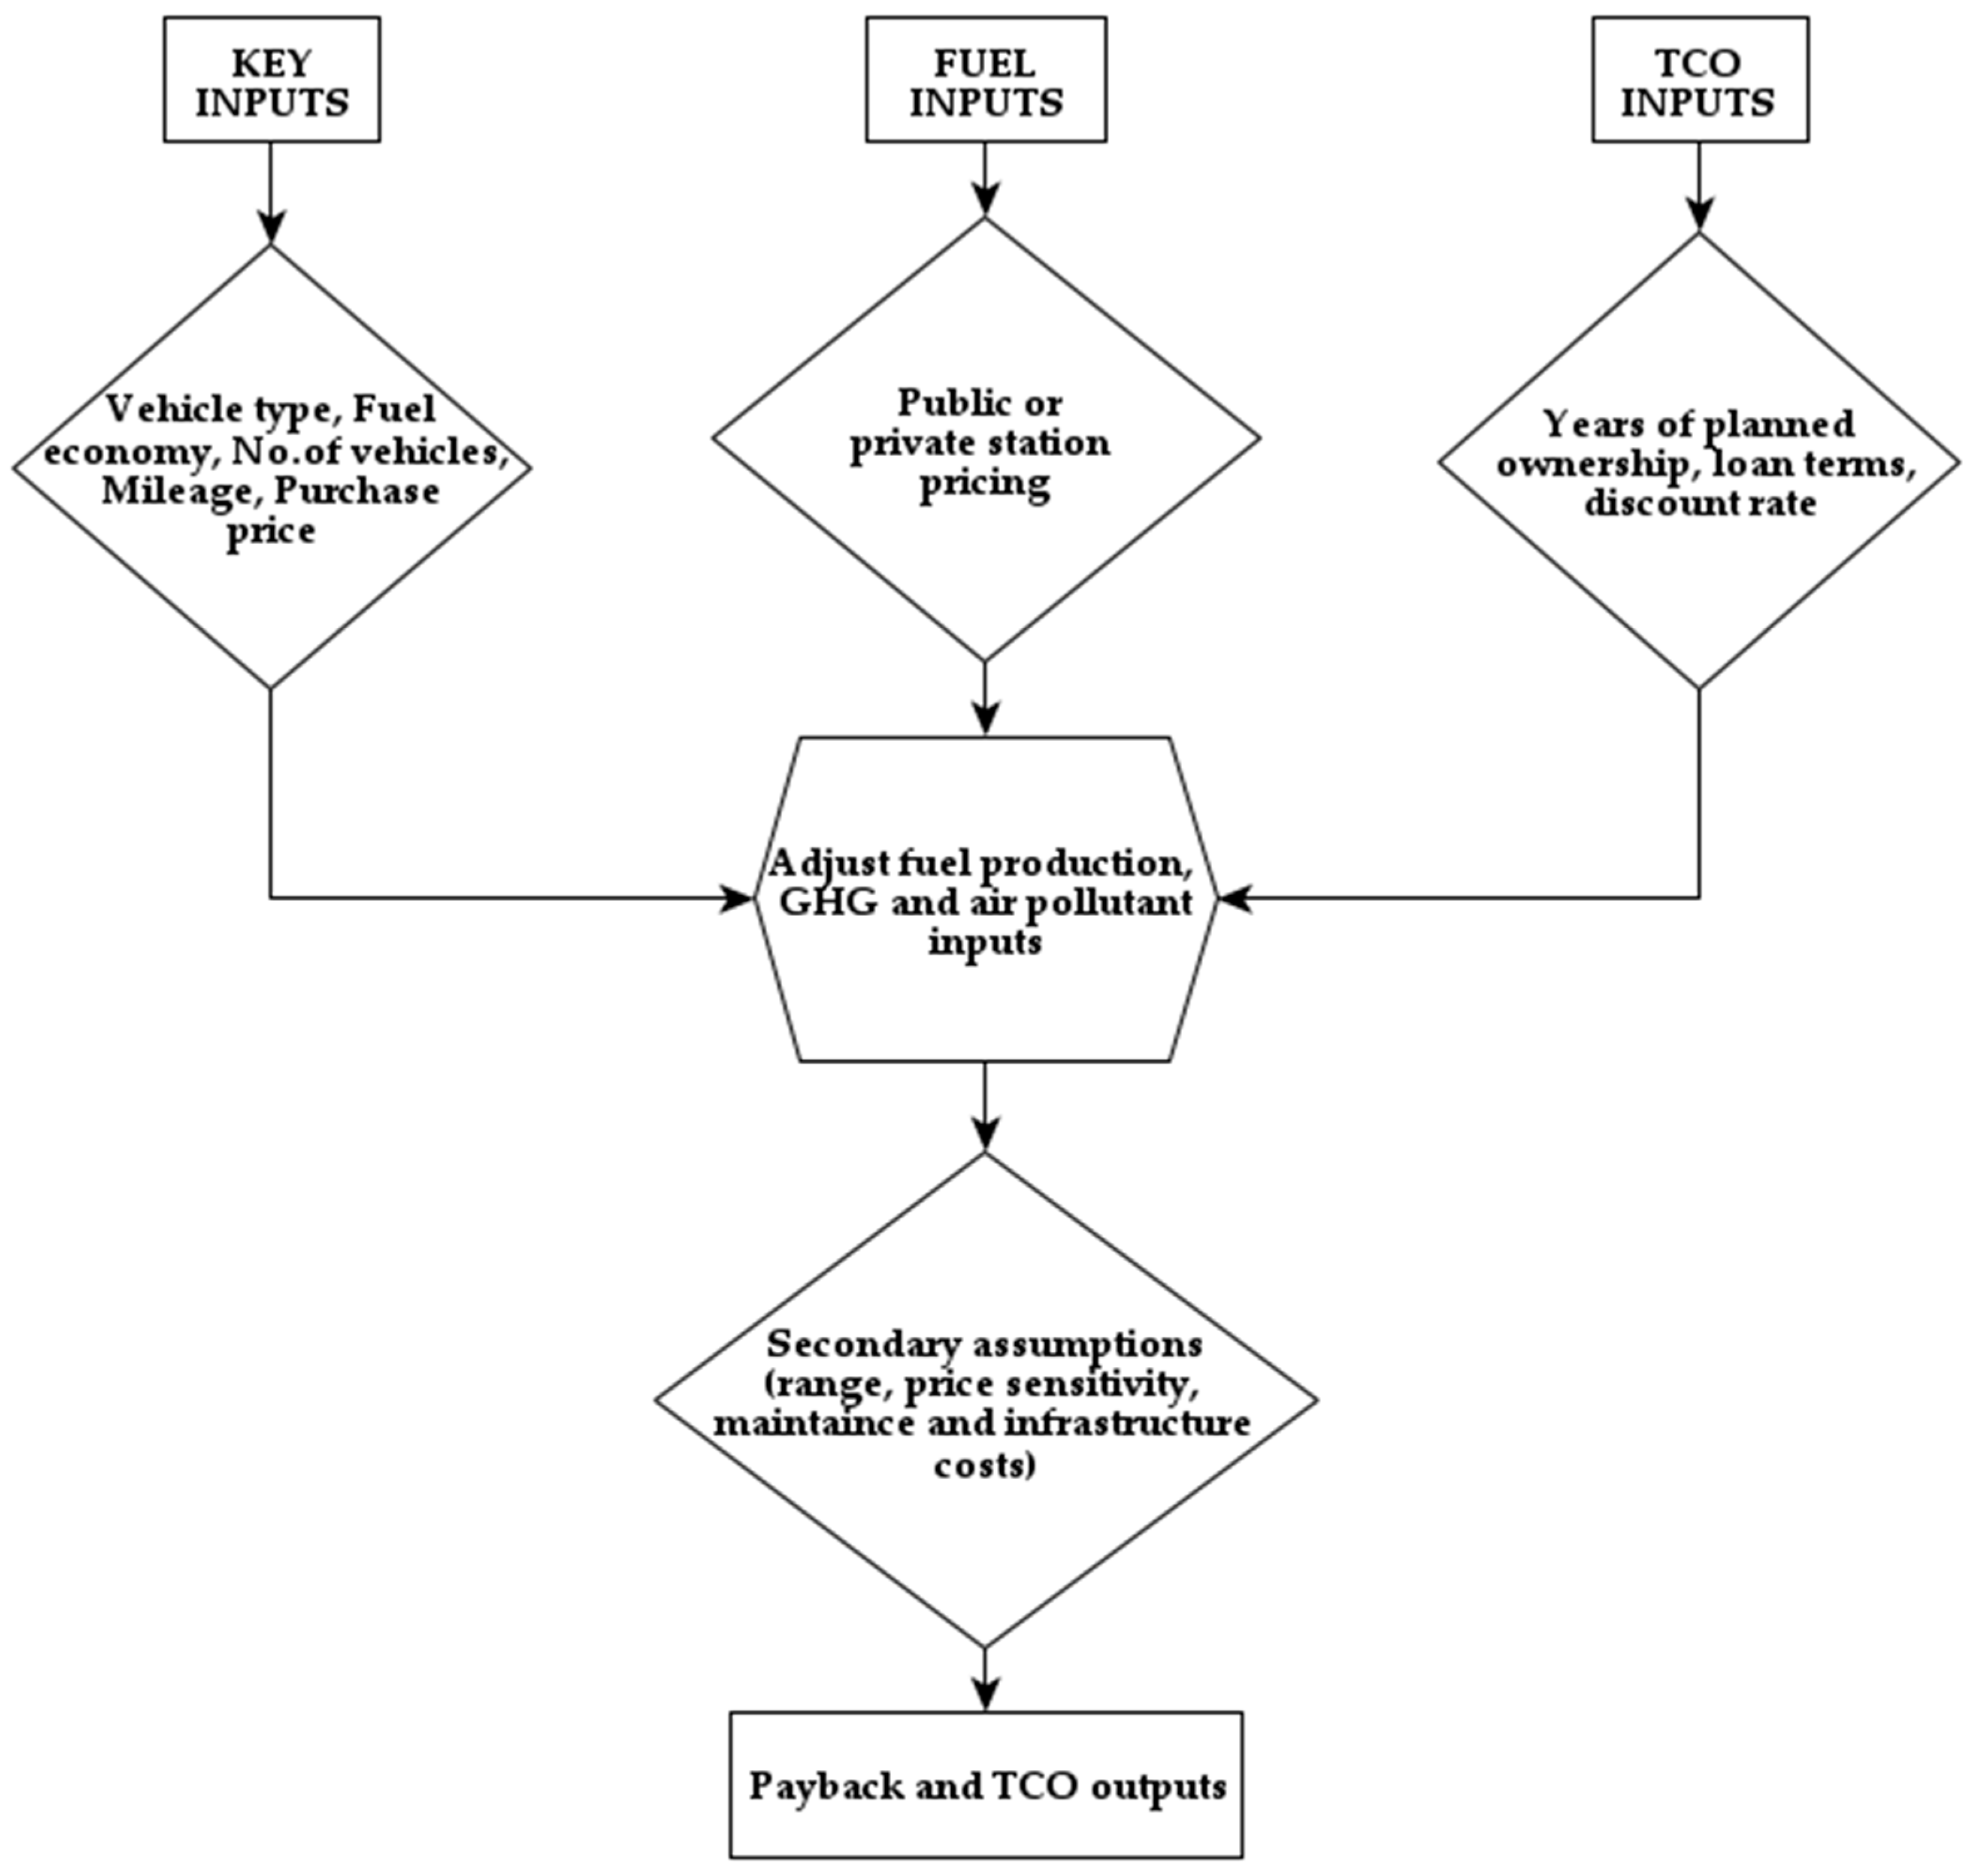
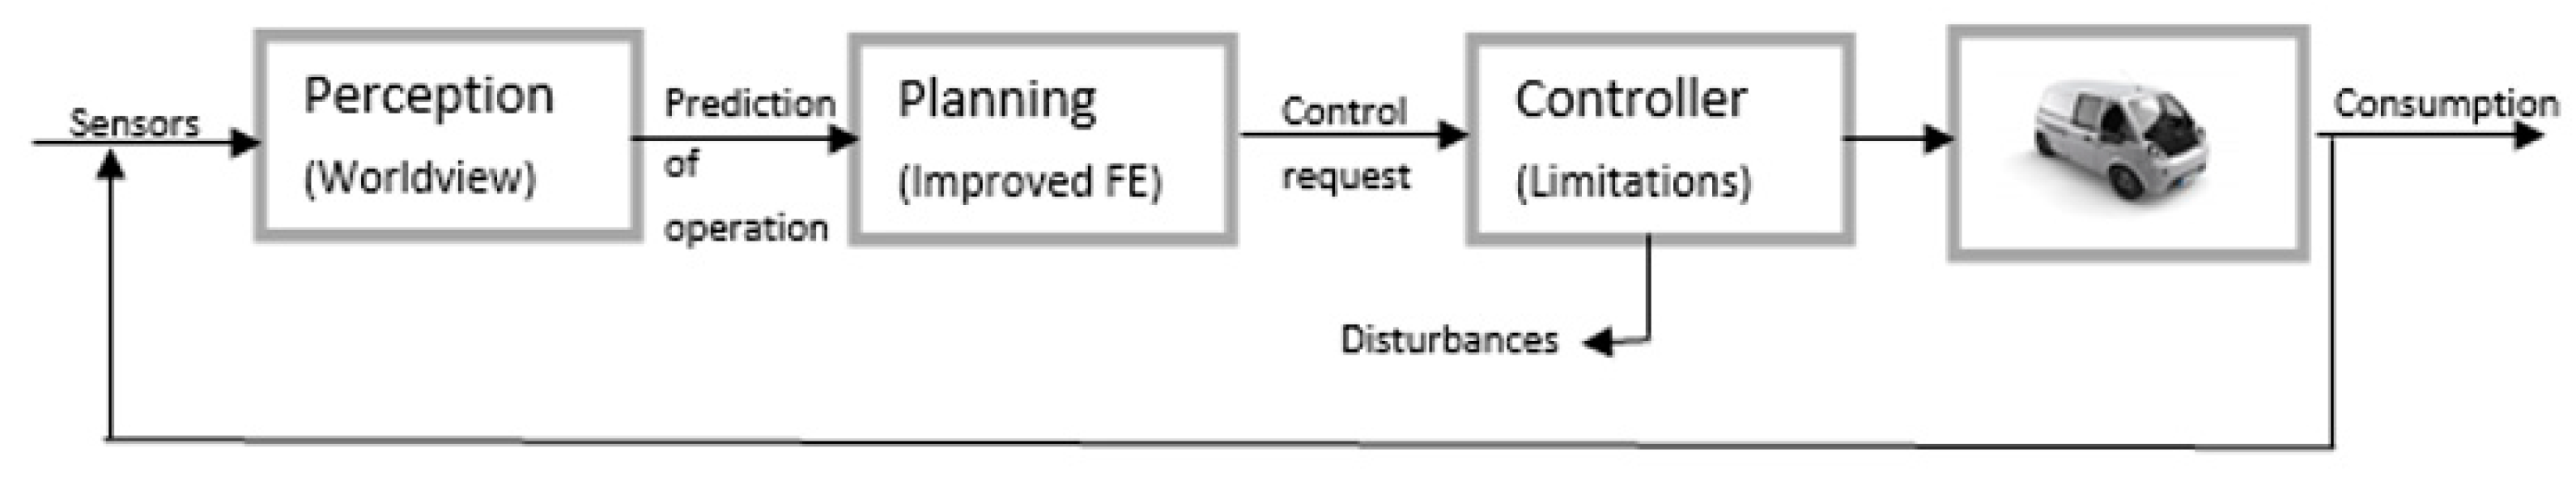
In combination with an electric battery, improved control strategies are available. CAV technology enables the vehicle to perceive the environment and, consequently, the future operational stage of the vehicle. Predicting the operational stage of a vehicle can be achieved by a consumption planning algorithm. The control strategy is presented as a query addressed to the vehicle by implementing the request, but without violating the operating restrictions of the vehicle. In this way, vehicle consumption can also be monitored remotely, which benefits the fleet operators. The flowchart of the system is shown in
Figure 5 [
10].
5. Case Study
Based on data for a logistics company engaged in the transport of goods in the city of Zagreb and its suburban area, the annual average fuel consumption of 14 vehicles was observed (
Figure 6). The fleet is mostly homogeneous, as it consists of 14 vehicles from the same manufacturer (Iveco), aged 7 or 8 years. Of the 14 vehicles, 10 have a payload of up to 1300 kg, and four vehicles have a higher payload of up to 3500 kg. The company also introduced driver education for eco-driving based on developed strategies, which achieved certain fuel economy savings, reduced greenhouse gas emissions and increased energy efficiency. The average annual consumption for each vehicle differs significantly due to the different stages of operation and idling [
28].
5.1. Data
The input data used for this research were obtained from the fleet manager of a real logistics company for water distribution (18.9 L), and the equipment needed for water consumption, heating and cooling. Data input parameters for GREET and TCO models include annual mileage, monthly leasing costs, insurance, maintenance and damage costs for each diesel powertrain delivery vehicle (for year 2016).
From
Figure 6, it can be seen that the average fuel consumption for each vehicle varies greatly. The reason is in the monthly and seasonal rotations when certain vehicles are in maximum use, while others are in service or at rest due to approaching the maximum percentage of mileage from previous periods. One vehicle travels an average of 141 km per day, and the annual amount is 109,791 km. Each vehicle starts at full load capacity on a working day, and during distribution, full bottles are replaced with empty ones, and the corresponding defective equipment is also replaced. Full load capacity data were used in the research because it is not possible to determine the exact fuel consumption after unloading at several delivery destinations.
The cost-effectiveness of the replacement can be commented on for part of the fleet, because the company does not have enough resources to replace the entire fleet with technologically advanced vehicles. For that reason, four higher-capacity vehicles (3.5 t) were replaced with hybrid electrical delivery vehicles because of the significant difference in fuel consumption for vehicles with higher payloads compared to vehicles with lower payloads. Also, there is a bigger number of these vehicles and they are younger, which makes replacement more expensive.
5.2. Fuel Consumption in Transport Company
The focus on improving energy efficiency in road freight transport has, until recently, been based on engine performance and vehicle design. Renewing a vehicle fleet with hybrid electric equivalents has resulted in a reduction in the share of fuel consumption in the distance travelled, but this is only one share that affects the overall consumption in the transport sector. Also important is the period of exploitation (mileage/tonne-kilometres) and the intensity of transport (tonne-kilometre/demand). Fuel economy savings are the result of improved vehicle manufacturing technology, and can be offset by logistics companies by reducing the load factor or increasing the average distance travelled per unit of load.
The implementation of the fleet management system and properly presented results (the fluctuation of critical values) have a direct positive effect; stabilizing fuel consumption at lower levels [
11].
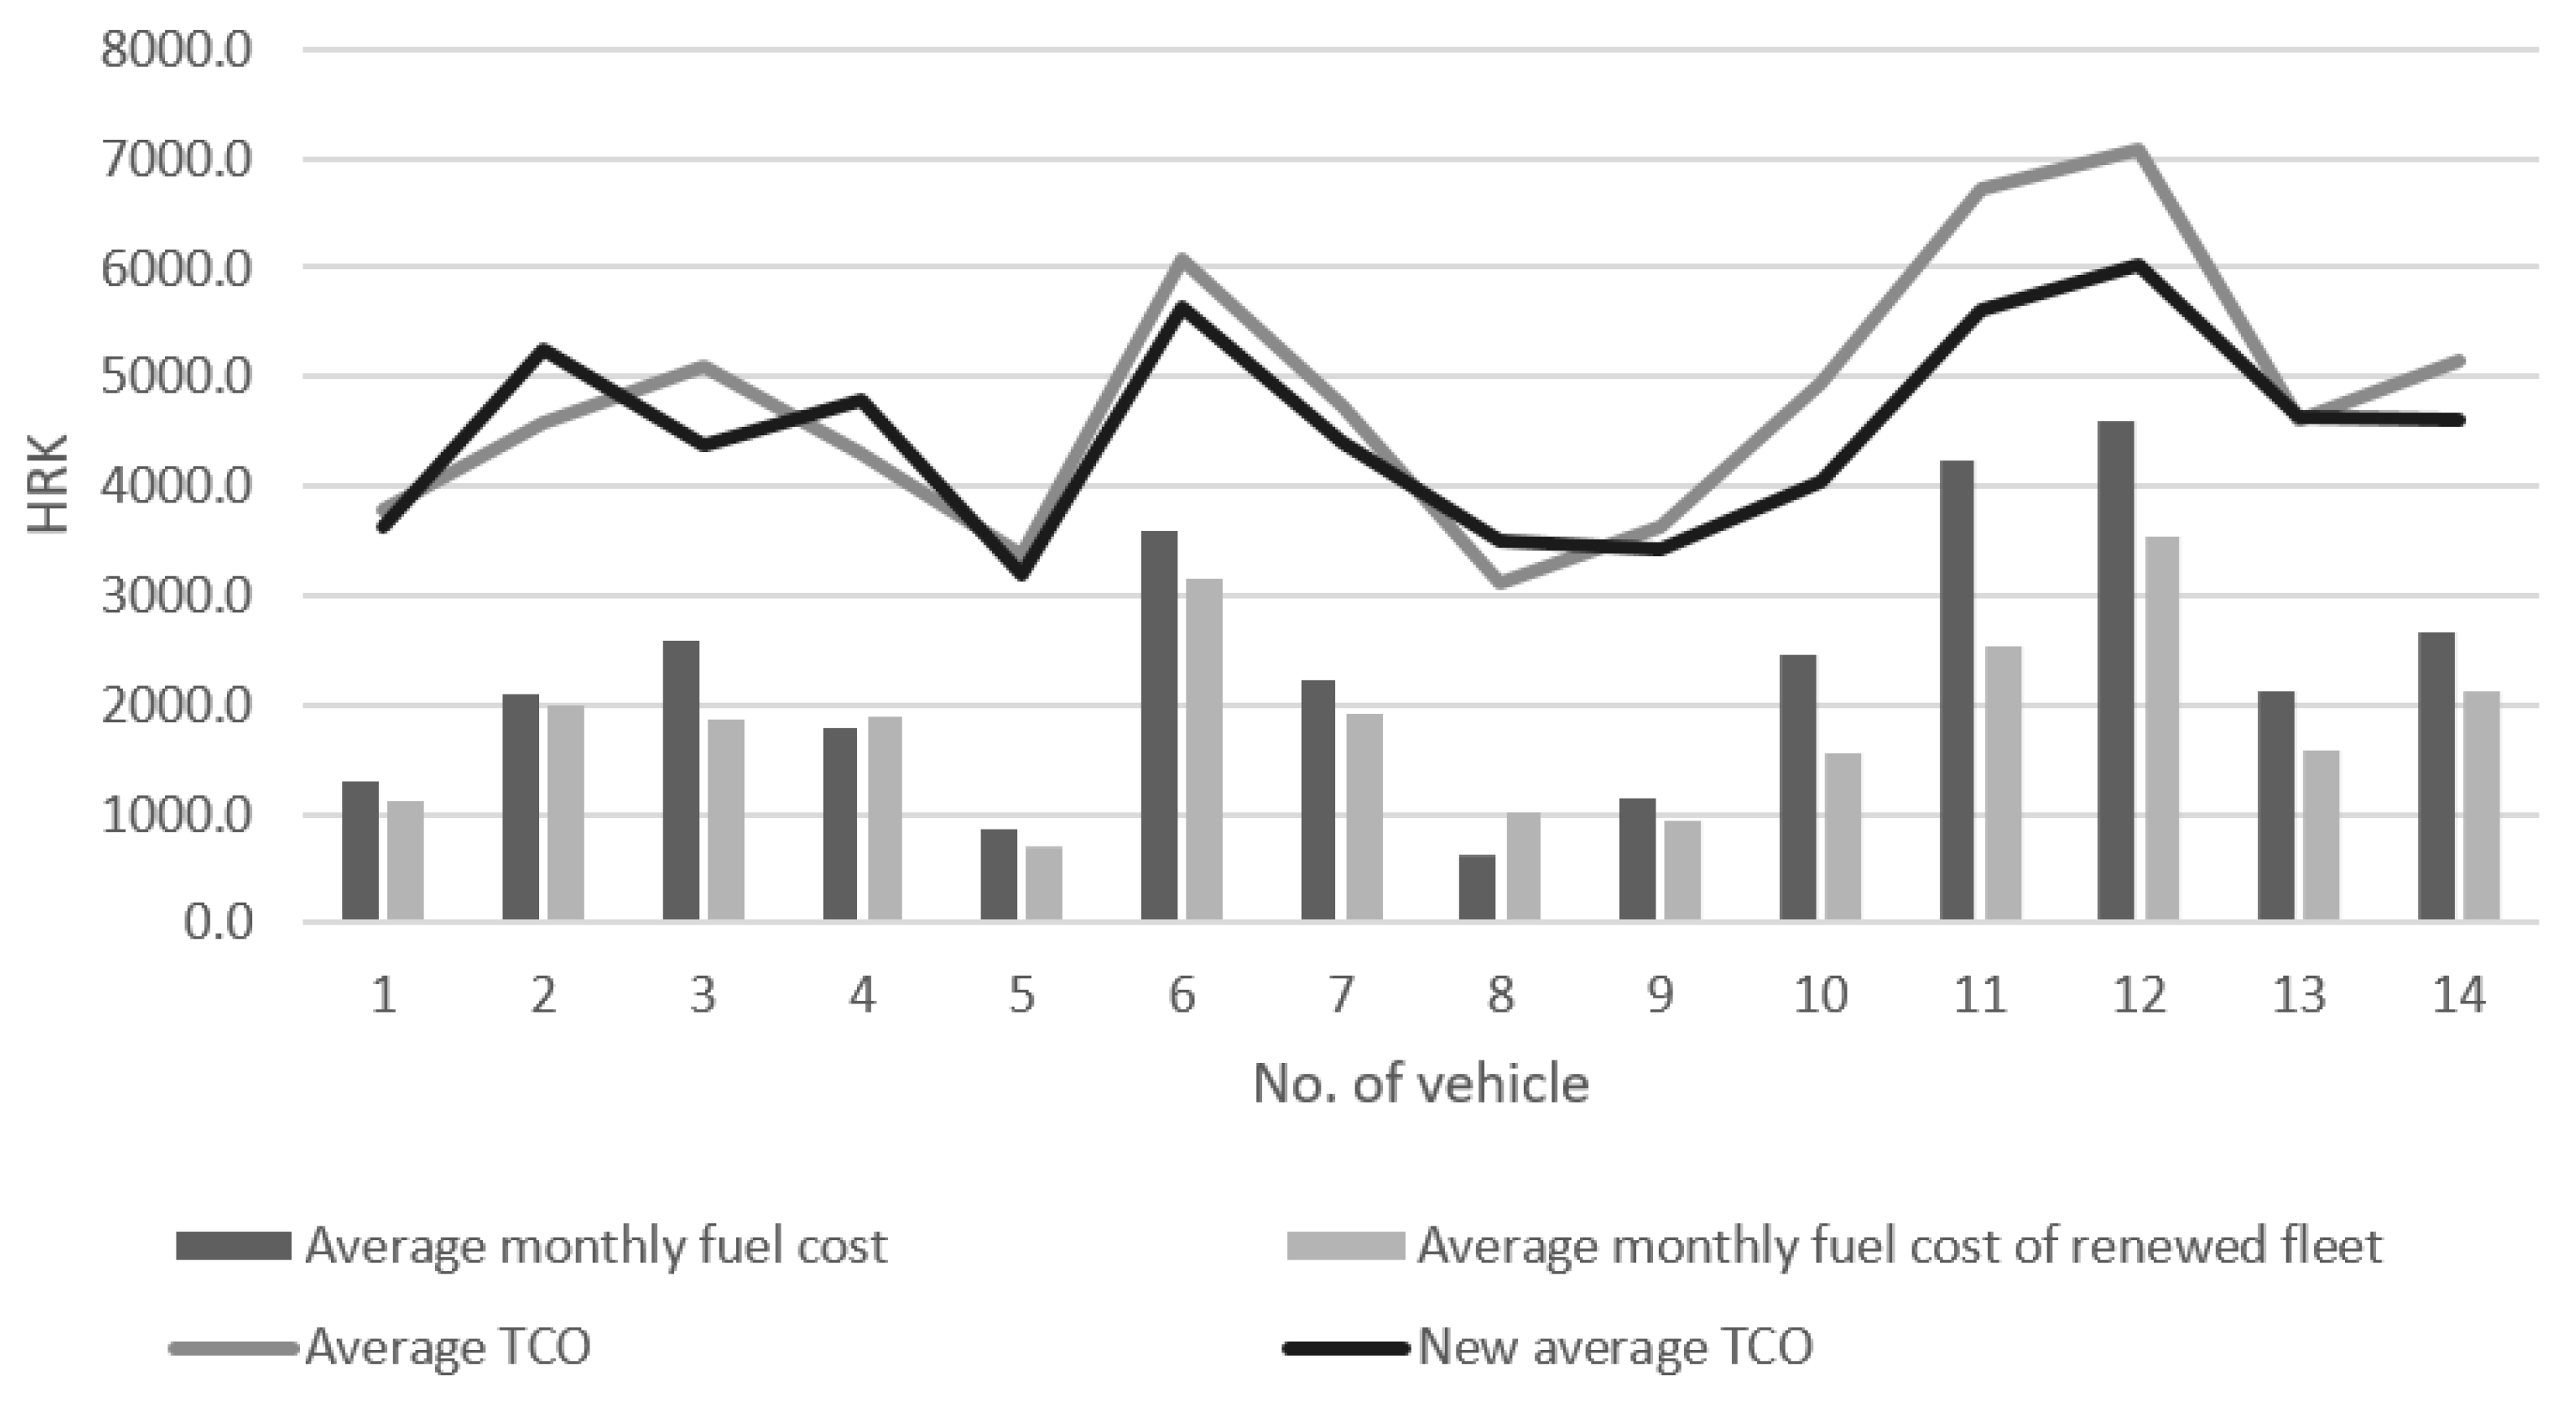
The analysis of the average monthly costs of fuel consumption and TCO (total cost of ownership) are shown in
Figure 7, compared with the new data of the four replaced vehicles. The experimental research with simulation tools was performed on real data compared to new results regarding the most ‘inefficient’ vehicles in the fleet for that period. Vehicles with higher fuel consumption (6, 11 and 12), which almost exceeded the critical leasing percentage value, are rotated and arranged so that a smaller volume of daily usage is intended for them. New consumption monitoring has been implemented, which has positive effects in increasing FE and reducing greenhouse gas emissions. Their consumption and ownership costs are decreasing in the forthcoming period due to previous operational data.
After comparing the obtained results for the replacement of four higher load capacity vehicles of the existing vehicle fleet with hybrid electric equivalents, the following savings are achieved:
- (a)
Financial savings of 6% are achieved using standard deviation when the average TCO is compared with the new average TCO after vehicle replacement, as obtained in the AFLEET model (shown by lines in
Figure 7).
- (b)
The fuel cost of the renewed fleet compared to the average monthly fuel cost, calculated in AFLEET, reduced total fuel consumption costs by 20% (shown by columns in
Figure 7) [
29].
- (c)
Annual greenhouse gas emissions were reduced by 4–5%; the reduction of CO
2 emissions by 352.8 gCO
2/km is especially important, the results of which were obtained in the GREET WTW model for year 2016 [
27,
30].
- (d)
The GREET WTW model also achieved energy savings in the use phase [
28,
30] (operational mode) of approximately 594 MJ per replaced vehicle in 2016.
6. Discussion
The measures taken to reduce the amount of emissions in the transport sector in Croatia so far have not been too reliable, because the energy savings achieved are less than the increase in fuel consumption (the replacement of vehicles is cost-effective after an average of 20 years). For this reason, it can be said that the situation is not achieving a sufficient degree of sustainability according to the guidelines of the White Paper published by the European Commission. Although the volume of freight transport in the world is growing rapidly, the global situation tends to change the logistical concepts we are familiar with so far. Even the global situation in Croatia is not so promising, and logistics companies have already maximized the reduction of transport costs, achieved cost savings and reduced energy consumption on the example of a transport company by replacing only four higher capacity vehicles, from which management can still achieve additional savings. Such results show that, in order to achieve an environmentally friendly and profitable business, one should focus on the proper and rational management of company-owned resources. The benefits of vehicle lease manifest in lower monthly payments than purchasing the vehicle, the selection of more valuable vehicles available, better warranty protection and avoiding resale processes. The company should have a stable and predictable source of income, but the main disadvantage in leasing a vehicle is mileage allowance, which can be expensive if the driver exceeds it. Therefore, the observation of energy costs and consumption throughout the life cycle of the vehicle is important for the specific phase of use and assignment of jobs to vehicles within the fleet (vehicle rotation, if the mileage is a higher percentage of the duration of the lease).
The current epidemiological situation in the world, associated with the impact of CoVID-19, influences the growth of freight transport; therefore, considering all aspects of savings in the transport sector is essential. Considering the situation, it is essential to increase awareness of cost reduction, as well as to promote the consumption of local products (reduced mileage and the use of lighter and more flexible delivery vehicles).
7. Conclusions
The environmental and energy efficiency of a vehicle fleet are important indicators in achieving high levels of sustainability in the transport sector. The company has introduced an eco-driving course for all employees, not just drivers, to improve and better understand the importance of fuel economy. Any measure that contributes to the sustainability of transport should include external factors, such as infrastructure, security and pollution, in quantified costs. The ecological future of transport processes lies in promoting a policy of reducing freight flows and mileage, and with this the transition from road transport to other modes of transport, or renewing fleets with technologically advanced vehicles. Transport management and the optimization of logistics processes can find their foundation in monitoring the efficiency of energy consumed in the life cycle of vehicles and transport capacities (maximum utilization of vehicle capacity). In our case study regarding simulation parameters, the following savings were achieved: (1) financial savings of 6% in TCO and total fuel consumption costs of 20%, and (2) reduced annual greenhouse gas by 4–5% and CO2 emissions by 352.8 gCO2/km, causing energy savings of 594 MJ per vehicle. The majority of those savings are in seasonal months (from April until September) when vehicles are at maximum operating mode. Although the results of this paper are based on the transport company fleet data for 2016, the same methodology can be applied in all periods. When transporting goods, reducing the distance travelled and increasing transport speed ultimately results in a significant decrease in energy efficiency. In order to optimize energy efficiency, fuel economy, the sustainability of transport companies and their business image in the future, the results indicate that the introduction of alternative propulsion vehicles is the most cost-effective solution, but the technology is underdeveloped, because there is no proper way to dispose and recycle lithium-ion batteries from electric vehicles. There are ways to replace degraded batteries at the end of use, but the energy consumed when producing components raises the price of the vehicle itself. For this reason, hybrid electric vehicles represent a convenient replacement for a logistics company where charging infrastructure is not as accessible as in more developed countries. The proposal to maintain sustainability is to invest in the development of technology and battery manufacturers, not in subsidizing vehicle purchases, which is currently the practice in most countries.


