Article

The Effect of Mechanical Actions Occurring during Transport on Physicochemical Changes in Agaricus bisporus Mushrooms

by
Dorota Walkowiak-Tomczak
1,
Natalia Idaszewska
2,*,
Krzysztof Bieńczak
2 and
Wiktoria Kómoch
1
1
Institute of Food Technology of Plant Origin, Poznan University of Life Sciences, ul. Wojska Polskiego 28, 60–637 Poznań, Poland
2
Institute of Machines and Motor Vehicles Poznan University of Technology, ul. Piotrowo 3, 60–965 Poznań, Poland
*
Author to whom correspondence should be addressed.
Sustainability 2020, 12(12), 4993; https://doi.org/10.3390/su12124993
Submission received: 3 May 2020 / Revised: 3 June 2020 / Accepted: 14 June 2020 / Published: 18 June 2020

Abstract

:
In this study, physicochemical changes occurring in the fruiting bodies of Agaricus bisporus champignons, subjected to mechanical vibrations under model conditions and a 4-day storage (shelf-life), were analysed. The experiment was conducted in two versions (applying vibrations for 3 and 6 h, at the frequencies of 46 Hz and 28 Hz). As part of physicochemical analyses, such parameters as pH, extract, dry mass, colour parameters and colour difference ∆E, polyphenol content and antioxidant activity were determined. The values of the examined physicochemical parameters changed depending on the applied frequencies and vibration time during transport under model conditions, as well as a result of short-term storage (shelf-life). The greatest total colour difference ΔE occurred in the sample subjected to vibrations for 6 h, followed by a 4-day storage. The changes in pH value, dry matter content and refractometric extract were relatively more significant in the samples subjected to 46 Hz vibrations than to those subjected to 28 Hz. The content of polyphenols and the antioxidative activity of mushrooms subjected to vibrations was higher than in the sample stored but not subjected to vibrations.

1. Introduction

In raw foodstuffs, which are living tissues, life processes that affect changes in their physical and biochemical properties are constantly taking place. These changes can have a positive impact, which may include, for example, reaching an appropriate degree of ripeness and developing the desired taste and smell characteristics of fruit and vegetables. Inappropriate storage and transport conditions, however, can have a negative impact on their quality, and thus reduce their consumer value. The quality of the foodstuffs after harvesting is affected by temperature, air humidity and the composition of the gas atmosphere at the place of storage. Moreover, vibrations that occur during transport may cause mechanical damage to tissues, and thus contribute to the deterioration of food quality through microbiological and physico-chemical changes [1,2,3,4,5].
The business of mushroom cultivation is marked by a high growth rate; in 1990, world production of edible mushrooms amounted to 2 million tons, and within a dozen or so years it has increased fivefold. In 2014, world production of edible mushrooms amounted to over 10 million tons, of which 75% came from China, 610,000 tons from Italy, 432,100 tons from the USA and about 320,000 tons from Poland. According to the data of the Institute of Agricultural and Food Economics, over the last 10 years the domestic production of mushrooms has increased by about 60%, and amounted to 330 thousand tons in 2018. Despite the growing production, the Poles still consume much fewer farmed mushrooms, 2.5 kg/year/person, compared to other EU countries (e.g., 4 kg/year/person in Germany). Therefore, in view of the increasing production of mushrooms in Poland, an important factor in the further development of this industry is exporting them. Poland is the leader in the export of mushrooms in the EU, mainly to Germany and Great Britain [6]. The produce is delivered by means of road transport.
Only five species account for 85% of the mushrooms produced. These include: Agaricus bisporus, pearl oyster mushroom, Pleurotus ostreatus, shiitake-Lentinula edodes, Auricularia auricula-judae, and the enoke-Flammulina velutipes. As much as 90% of the cultivated mushrooms are consumed in Asia, especially the shiitake mushrooms. Consumers from other continents mainly choose champignons and pearl oyster mushrooms [7]. Agaricus bisporus mushroom is one of the most frequently grown and consumed edible mushrooms [8,9].
Mushrooms are valued for their sensory qualities, taste and aroma, valuable dietary properties, and at the same time they are low in calories, as they contain about 90% water [10]. Their high nutritional value is related to the content of saccharides and valuable dietary fibre (including chitin, chitosan, hemicellulose and glucans), polyunsaturated fatty acids, proteins and amino acids (including alanine, arginine, leucine and proline), minerals (potassium, magnesium, phosphorus, zinc) and vitamins (group B, including folic acid and cobalamin, as well as biotin, ergosterol and ascorbic acid). In addition, mushrooms are a source of numerous other bioactive and beneficial substances, such as lectins and tyrosinase with anticancer properties, polyphenols with antioxidant, anticancer, anti-inflammatory properties, and others [10,11,12,13,14]. Due to their unique organoleptic properties, taste, texture and nutritional value, edible mushrooms are popular all over the world [15,16,17,18,19]. The breathing rate of these fungi is relatively high, which is due to their thin and porous skin structure [18]. As a result, the mushrooms spoil quite quickly after just one day of storage [20].
The aim of the study was to evaluate the physicochemical changes of Agaricus bisporus of the white variety, as a result of the mechanical effects of road transport under model conditions and after storage (their shelf life).

2. Materials and Methods

2.1. Research Material

The research material consisted of white mushrooms, Agaricus bisporus, obtained from the Paweł Walkowiak Production Plant in Włoszakowice. The mushrooms were fresh, just after harvesting. They all had a similar size, about 3–5 cm in diameter. The mushrooms were packed in bulk in plastic boxes of 3 kg each and subjected to mechanical actions on a test stand, and subsequently they underwent storage (shelf life). Mushrooms were stored for 4 days at 6 ± 1 °C, which was to correspond with the store conditions.

2.2. Test Stand

The test stand shown in Figure 1 consisted of a vibration simulator located in the car body. The vibration simulator consisted of two elements: a vibration inducing installation—an inverter-controlled engine, elements of flexible suspension, vibration isolation as well as a control system [21].

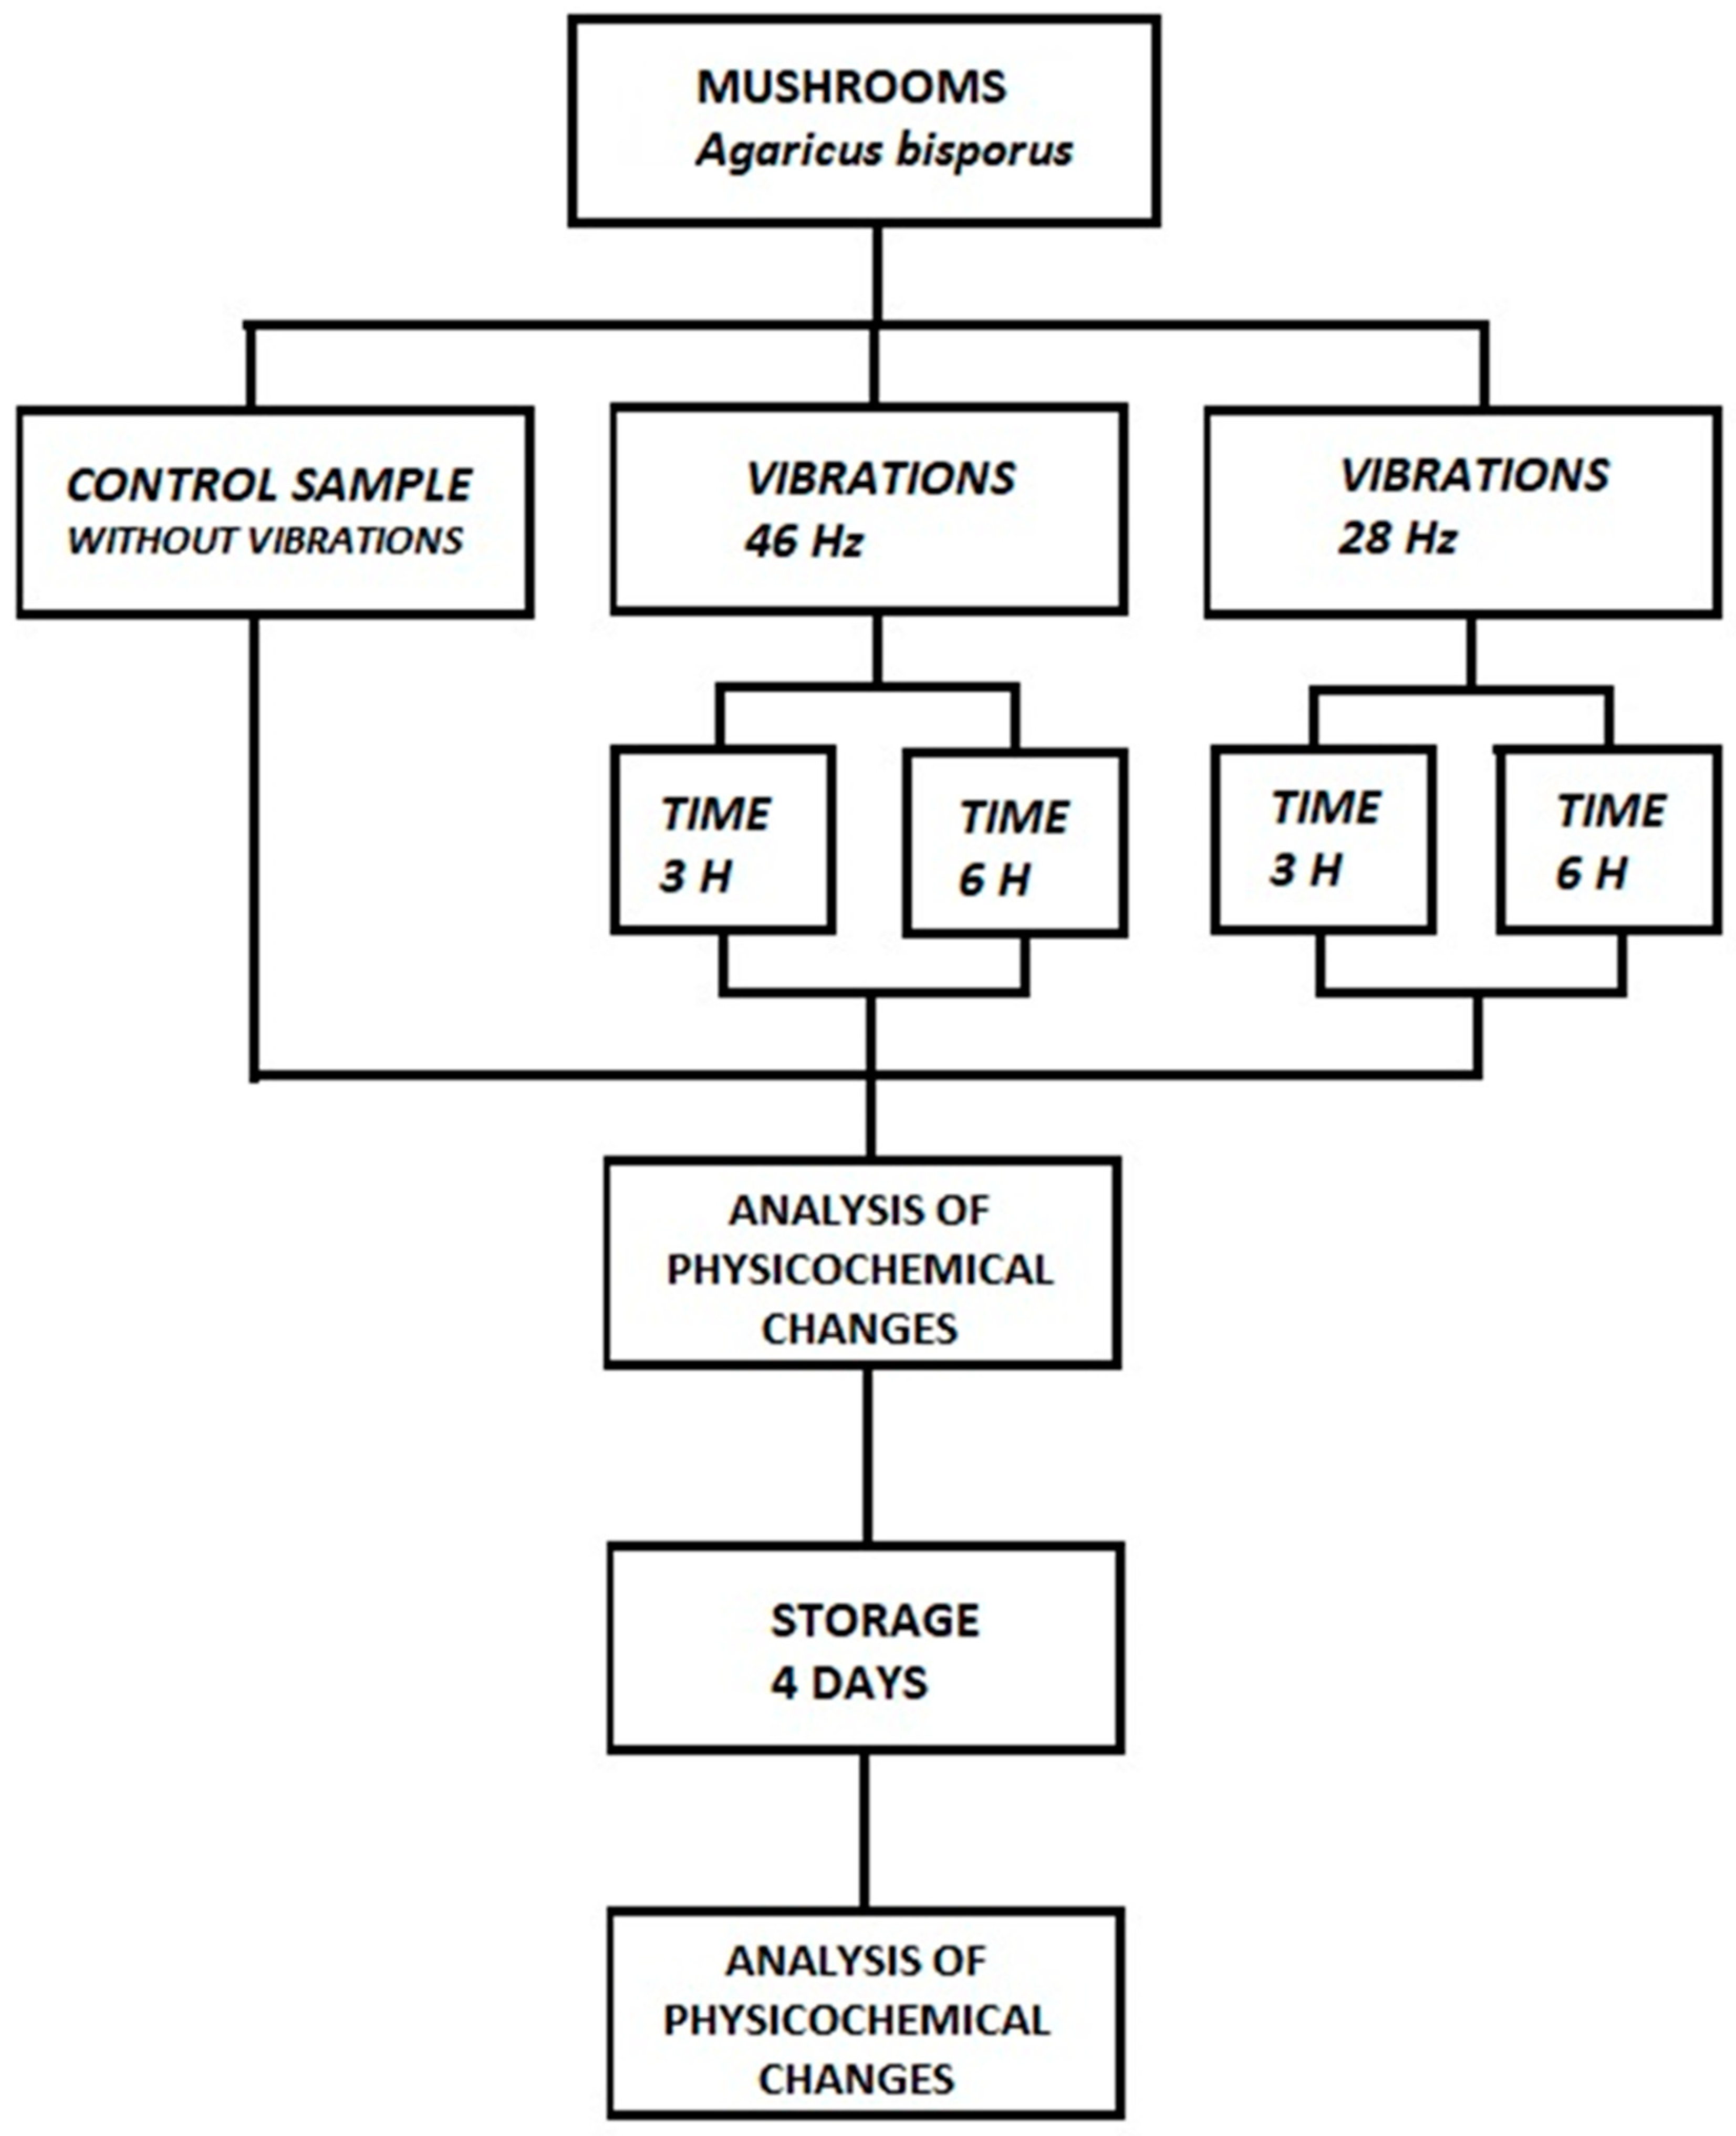
2.3. The System of Experiments

The experiment layout has been shown in Figure 2. During the experiment, a constant temperature of 6 °C was maintained. The experiment was carried out in two variants. The first experiment used a vibration frequency of 46 Hz, and the second experiment used 28 Hz. The choice of frequency is related to the fact that these are extreme frequencies occurring during transport in real conditions [22]. Impact time was 3 and 6 h, in each variant. The analysis of physicochemical changes in mushrooms was carried out:
  • directly after harvesting (control sample)
  • immediately after being subjected to the vibrations
  • and after four days of refrigerated storage at 6 ±1 °C, after both the control samples and the samples that had been subjected to vibrations

2.4. Analytical Methods

From each experimental variant three samples of several mushrooms were taken, in which the colour parameters were determined, and after their homogenization the pH value, refractometric extract and dry matter content were determined. Methanol extracts were prepared (5 g of the sample and 50 g of 80% methanol solution were shaken for 2 h, then the supernatant used for analyses was centrifuged and poured) to determine the polyphenol content and the level of antioxidant activity.

2.4.1. Determination of Colour

In fresh mushrooms and the mushrooms subjected to mechanical vibrations and storage (shelf-life), the colour was instrumentally measured in the CIE L*a*b* system (CIE 1978) using the Konica Minolta CR-400 colorimeter (Konica Minolta, Tokyo, Japan), with the Color Spectra Magic software, in reflection, using a D65 light source and an observation angle of 2°. The parameters describing the colour in the system [23] form a three-dimensional spatial system in which L* means colour lightness and takes values from 0 for black to 100 for white, the parameter a* indicates the proportion of red (positive values) and green (negative values), the parameter b* indicates the proportion of yellow (positive values) and blue (negative values). The parameter C* indicates the saturation and purity of the colour, and its value increases from the centre of the external coordinate system outwards, and the parameter h* indicates the tone (angle) of the colour and is expressed in degrees, whose values correspond to the following: 0°—red-violet tone, 90°—yellow tone, 180°—blue-green tone, 270°—blue tone; 360° coincides with 0° [24,25]. The presented values of colour parameters represent the average of 25 measurements (5 fruiting bodies with 5 measurements each). The colour was measured on the surface of the caps.
To compare the level of colour changes due to mechanical vibrations during transport and after storage, the total colour difference factor ΔE {ΔE = [(ΔL*)2] + [(Δa*)2] + [(Δb*)2]1/2} was calculated [24]. The colour parameters of the control sample were taken as reference values, i.e., fresh mushrooms that have not undergone vibration and storage.

2.4.2. Determination of Active Acidity

Active acidity pH was determined with the Hanna HI 221 pH-meter according to the PN-90/A-75101/06 standard [26]. The results are presented as an average of three repetitions.

2.4.3. Determination of the Refractometric Total Extract Content

The total extract content was measured with the ATAGO PAL-1 refractometer (USA, Inc.) in accordance with the PN-90/A-75101/02 standard [27]. The results were presented as an average of three repetitions and expressed as a percentage value.

2.4.4. Determination of Dry Matter Content

Determination of dry matter content was performed by weight method according to the PN-90/A-75101/03 01/02 standard [28]. The samples of about 5 g were dried to solid mass at 105 °C. The results were presented as an average of three repetitions and expressed in %.

2.4.5. Determination of Antioxidant Activity

The antioxidant activity was determined in methanol extracts by spectrophotometric method using cationic radical ABTS+ [2,2′-azinobis-(3-ethylbenzothiazoline-6-sulfonic acid)] [29]. In order to achieve this, the following solutions were used: 7 mM ABTS, phosphate buffer PBS pH 7.4, 2.45 mM K2S2O8, 2.5 mM Trolox (6-hydroxy-2.5.7.8-tetramethylchromate-2-carboxylic acid). ABTS cationic radical was generated by mixing with K2S2O8 solution at a ratio of 1:0.5. The absorbance was measured at 734 nm, for 6 min incubated samples at 30 °C, against PBS buffer as a reference. The determination of antioxidant activity is based on the calculation of the percentage reduction of absorbance value of the ABTS cationic radical solution by the test sample, in comparison with Trolox. The spectrophotometer Helios Alpha (Thermo Electron Corporation USA), equipped with a kit for sample thermostatisation, was used for the measurement. The results were presented as an average of three repetitions and expressed in μmol Trolox/g d.m.

2.4.6. Determination of Total Polyphenols

The content of polyphenolic compounds was determined in methanol extracts by spectrophotometric method with Folin–Ciocalteu reagent [30]. The determination was performed in solutions containing 0.7 mL of the sample (methanol extract), 0.3 mL of water, 5 mL of 0.2 N Folin–Ciocalteu reagent, 4 mL of sodium carbonate solution (75 g/L) and incubated in the dark for two hours. The measurements were taken using the Helios Epsilon spectrophotometer (Thermo Fisher Scientific Waltham, Massachusetts, USA) at 765 nm with reference to the reagent blank. The results were presented as an average of three measurements in each sample and expressed in mg/100 g d.m. as gallic acid equivalents.

2.5. Statistical Analysis

Statistical analysis was carried out in Statistica ver.13.3 (StatSoft) based on a single-factor analysis of variance and the Fisher NIR test.

3. Results

3.1. pH, Total Extract and Dry Matter

Table 1 shows pH values, total extract and dry matter content of mushrooms, depending on the frequencies used, the vibration time and the storage time.
The pH value of mushrooms not subjected to vibration slightly decreased due to their storage for 4 days. The pH value of mushrooms subjected to the vibration of 46 Hz slightly decreased in comparison with mushrooms not subjected to the vibration. Vibrations, regardless of their duration and storage time, resulted in mushrooms achieving a similar pH value (6.42–6.43), except for the mushrooms that were exposed to vibration for 3 h and stored for 4 days. On the other hand, vibrations of 28 Hz, regardless of their duration and storage time, resulted in mushrooms reaching a similar pH value (6.34–6.39).
The measured pH values in the tested mushrooms are in accordance with data from the literature [31,32,33]. The slight decrease in pH value observed during the experiment is probably related to an increase in dry matter and refractometric total extract during transport and storage. Another probable reason for the decrease in pH value is the progressive microbial spoilage of the tested mushrooms.
The measured total extract content in fresh mushrooms is in accordance with the data from the literature [32]. The content of the total extract of mushrooms not subjected to vibrations increased during storage for 4 days. The total extract content in mushrooms subjected to the vibration at the frequency of 46 Hz increased significantly in comparison with those not subjected to any vibration. It was different for mushrooms stored for 4 days, as the total extract content decreased in comparison with those not treated with vibration. When both frequencies were used, the vibrations did not cause significant changes in the total extract content of mushrooms, regardless of their duration.
The dry matter content of the mushrooms not subjected to vibration increased during their storage for 4 days. The dry matter content of mushrooms subjected to the 46 Hz frequency increased slightly in comparison with those not subjected to any vibration. After 4 days of storage, no significant changes in dry matter values, which ranged from 8.24% to 9.24%, were observed. Further, at the frequency of 28 Hz no significant changes in the dry matter content of mushrooms were observed, regardless of the duration of vibrations.
The recorded levels of dry matter content of mushrooms are in accordance with the data from the literature, which, according to various authors, depending on the variety and yield pattern, range from 7.9% to 8.5% [34], 11.1% to 12.7% [35] and 6.8% to 9.1% [36].

3.2. Antioxidant Activity

Table 2 shows the antioxidant activity of mushrooms subjected to vibrations, depending on the frequencies used, the vibration time and the storage time.
In the first experiment, using the 46 Hz frequency, the antioxidant activity of 127.2 μmol Trolox/g d.m. was recorded in the control sample of mushrooms. As a result of mechanical vibrations, a significant (p ≤ 0.05) increase in this parameter was observed after 3 h, to 230.7 μmol Trolox/g d.m., while after 6 h the increase was insignificant, to 130.7 μmol Trolox/g d.m. After 4 days of storage, an increase in antioxidant activity was observed in all samples, ranging from 33 to 73 units, but these changes were not statistically significant.
In the second experiment, using a frequency of vibrations of 28 Hz in the initial sample of mushrooms (post-harvest control sample), the antioxidant activity was 66.3 μmol Trolox/g d.m. As a result of the application of mechanical vibrations, an increase of this parameter, to 81.29 μmol Trolox/g d.m., was observed over 3 h, while over 6 h of vibrations there was a decrease to 58.9 μmol Trolox/g d.m., however these changes were not statistically significant (p ≤ 0.05). After 4 days of storage, an increase in antioxidant activity of 2–89 units was observed in all samples, which was an increase from 3% to over 100%. The highest, statistically significant increase in antioxidant activity after storage was found in the sample of mushrooms previously subjected to vibrations for 3 h.
Due to the origin of the raw material from two different collective batches, the levels of antioxidant activity in the first and second experiments (vibration frequency 48 and 28 Hz, respectively) differed significantly, but the observed changes in the values of this parameter showed similar trends. In the mushrooms subjected to mechanical vibrations for 3 h, the highest increase in antioxidant activity was observed both in fresh samples and after 4 days of storage. The greater impact of mechanical vibrations lasting 6 h caused an insignificant increase or even decrease in antioxidant activity, which may be associated with progressive mechanical damage to tissues, as a result of which the activity of native oxidoreductive enzymes increases, which leads to the oxidation of bioactive compounds, including polyphenols responsible for antioxidant activity. Moreover, in all experimental variants, the mushrooms after 4 days of storage were characterised by a higher antioxidant activity than those samples tested on the first day of the experiment.
The values of antioxidant activity determined in the mushrooms tested are comparable with those described in the literature. In the study by Skąpska and colleagues [33], the antioxidant activity of fresh champignons was found to be about 60 μmol Trolox/g d.m., which was almost twice as high as that of oyster mushroom. An increase in antioxidant activity in fresh and sliced champignons during storage (shelf-life) was also observed in the study by Oms-Oliu et al. [37].

3.3. Polyphenol Content

Table 3 shows the content of polyphenols converted into gallic acid in the mushrooms subjected to vibrations, depending on the frequencies used, the vibration time and the storage time.
In the first experiment conducted with the application of 46 Hz frequency, the initial content of polyphenolic compounds in fresh mushrooms amounted to 796 mg/100 g d.m. As a result of applying 3 h of vibrations, the level of polyphenols increased to 817 mg/100 g d.m., whereas in the variant where the vibrations lasted 6 h, the increase of this parameter was smaller, reaching the level of 791 mg/100 g d.m. The changes of polyphenols content on the first day of the study, directly after applying vibrations, were not significant (p ≤ 0.05). After 4-day storage of the mushrooms, in all samples an increase in polyphenols content by 2–71 units was observed. The highest statistically significant increase in polyphenols content after storage was recorded in the sample previously subjected to vibrations for 6 h, where it reached 864 mg/100 g d.m.
A similar direction of changes in polyphenols content was observed in the second experiment, with the application of vibrations of 28 Hz frequency. The initial level of polyphenols content in fresh mushrooms was 441 mg/100 g d.m., and after the application of vibrations an increase in polyphenols content to the level of 500 and 459 mg/100 g d.m. was observed, after 3 and 6 h of vibrations, respectively. In all experimental variants, as a result of 4-day storage of the mushrooms, increases in polyphenols content to the levels of 607, 555 and 640 mg/100 g d.m. were observed, in the control sample of mushrooms as well as in those which were affected by 3 and 6 h of vibration, respectively. All changes in the value of the analysed parameter were statistically significant (p ≤ 0.05), which was confirmed by ANOVA variance analysis and Fisher’s post-hoc NIR test.
The polyphenol contents determined in the mushrooms tested are consistent with the reference literature’s data. According to various authors, the content of these compounds, expressed in gallic acid equivalents, is on average 575 mg/100 g according to Barros et al. [38], 618 mg/100 g d.m. [39], 800–1065 mg/g d.m. [40] and 855 mg/100 g d.m. [41]. In the study by Skąpska et al. [33], in commercial mushrooms the polyphenols content was found to be 12,335 mg/kg d.m. (123.35 mg/100 g d.m.), i.e., significantly less than in the above literature, which may result from the fact that commercially purchased mushrooms were of lower quality than those tested in this study, coming directly from the producer. There are also reports of an increase in the polyphenol content in mushrooms (1.6-fold, on average) during 5-day cold storage of the fruiting bodies [42]. In the study by Eissa [32], the changes in the polyphenols content during 15-day cold storage (4 °C) of mushrooms were described. The highest increase in the content of these compounds after 3 days, and then a decrease to a value close to the initial state in fresh produce, was observed. The changes in polyphenols content, and thus in antioxidant activity, may be related to the physiological reaction of the produce to the harvest and to the change in the activity of oxidative enzymes, under the influence of damage during picking and exposure to oxygen [32].

3.4. Colour Measurement

Table 4 shows the changes in colour parameters of mushrooms subjected to mechanical vibrations of the frequency of 46 Hz, followed by storage.
The lightness parameter (L) was 72.7–86.4. The lowest value was recorded on the first day for mushrooms that had been subjected to vibration for six hours, and the highest for fresh mushrooms, which means that they had the lightest colour. Parameter a* (change of colour in the range from green to red) assumed values from 1.2 (fresh produce, day 1) to 5.1 (vibration time 6 h, day 1), which means that changes occurred in the range of the red colour. Parameter b* (change in colour in the range from blue to yellow) assumed values in the range from 13.3 (fresh material, day 1) to 20.9 (vibration time 6 h, day 4), which means that the changes occurred in the yellow range. The colour difference (ΔE) calculated relative to the control sample (fresh raw material, day 1) for each of the samples was very significant (ΔE > 3), which means that the colour difference would be noticeable to any observer.
Table 5 shows the changes in colour parameters of mushrooms subjected to mechanical vibrations of 28 Hz, followed by storage.
In experiment II, using vibrations of 28 Hz, the lightness parameter (L) assumed values 76.7–87.4. The lowest value was recorded on the fourth day, for mushrooms that had been subjected to vibrations for six hours, and the highest for fresh mushrooms, on the first day, which means that they were characterised by the brightest colour. Parameter a* (change of colour in the range from green to red) assumed values from 0.4 (fresh raw material, day 1) to 4.8 (time of vibrations of 6 h, day 1), which means that the changes occurred in the range of red colour. Parameter b* (change of colour in the range from blue to yellow) assumed values in the range from 11.4 (fresh raw material, day 1) to 20.4 (vibration time 6 h, day 4), which means that the changes occurred in the yellow range. The colour difference (ΔE) calculated relative to the control sample (fresh raw material, day 1) was significant for the mushrooms subjected to vibration for three hours on day 1, amounting to 2.2. For the other samples, ΔE was > 3, which indicates a very significant colour difference.
The analysis of the measured values of colour parameters (Table 4 and Table 5) revealed that in both experiments colour changes occurred in an analogous way, and on the basis of the analysis of variance, it was found that the influence of the applied vibration, as well as storage conditions and times, was statistically significant (p ≤ 0.05). The values of parameters a*, b* and C* increased, while the values of parameters L* and h* decreased with the increase in the application time of mechanical vibrations, as well as as a result of storage. Decreasing values of L* means darkening of the sample, decreasing the proportion of white colour. This was confirmed by the changes in parameters a* and b*, whose increase in value means an increase in the proportion of red and yellow, which reflects the processes of browning of the fruiting bodies during vibration and storage. The saturation of colour C* became more intense, and the tone angle of colour h* shifted from yellowish (h* about 90°) towards reddish brown. The brightness L* in the range of 86–87 for fresh mushrooms was consistent with the data published in the literature. In the sample of fresh mushrooms, the L* lightness ranged from 83 to 87, and did not change after washing in an aqueous solution containing 5% H2O2, 4.5% sodium isoascorbate, 0.2% cysteine hydrochloride and 0.1% EDTA, and after storage for 5 days (2 days at 1 °C and then 3 days at 13 °C) [43]. However, the application of pre-treatment, involving washing in aqueous solution of sodium pyrosulphite (1000 mg/L) followed by blanching in water, resulted in a decrease in the value of L* to 73–74. The application of washing in aqueous solution of sodium pyrosulphite (1000 mg/L), vacuum soaking with water and then blanching resulted in further darkening of the mushrooms, to L* 68–71. The pre-treatment procedures with the use of antioxidant solutions enabled us to maintain the light colour of the mushrooms during storage in the processing. Fresh mushrooms may be stored at 0–1 °C for up to 7–9 days. In order to maintain the good quality of the mushrooms (shelf-life), a balanced temperature should be maintained during transport and storage, to prevent condensation on the fruiting bodies and packaging [10].
In order to assess the level of colour change during the experiments, the coefficient ΔE, i.e., the total colour difference, was calculated in relation to the reference sample for which the original material was taken, i.e., fresh mushrooms not subjected to vibration or storage. The calculated values of ΔE were between 3.3 and 15.1, and 2.2 and 14.7, in the first and second experiments, respectively (Table 4 and Table 5). This means that all the experimental samples differed significantly from the initial sample, because values ΔE > 2 corresponded to the colour differences perceived by the average observer, and at values ΔE > 5 the observer has the impression of two different colours. The smallest colour differences from the control sample were found in mushrooms subjected to vibrations for 3 h (ΔE from 2.2 to 3.3), while prolonged vibration and storage resulted in noticeable browning of the fruit. The highest coefficient, ΔE = 15.13, was determined for mushrooms after 6 h of shaking at 46 Hz vibration frequency and 4 days of storage.
Table 6 shows the percentage differences in parameter values between initial sample and vibrated mushrooms.
The largest percentage differences in the values of tested parameters between initial samples and vibrated mushrooms occurred in the case of total extract and dry matter content, for mushrooms subjected to vibrations at a frequency of 46 Hz for 6 h, not stored. In the case of antioxidant activity, the largest diffference was in mushrooms vibrated at 28 Hz for 3 h, not stored, and in the case of polyphenol content, the largest difference was in mushrooms vibrated at 28 Hz for 3 h, stored for 4 days.

4. Conclusions

On the basis of the presented results, it was found that the values of the examined parameters changed depending on the frequency and time of mechanical vibrations during transport under model conditions, and as a result of short storage (shelf-life). As a result of mechanical vibrations, the colour of mushrooms deteriorated, and these changes deepened during storage. The greatest total colour difference ΔE reached 15.1, in the sample subjected to vibrations for 6 h and then 4 days of storage. The vibrations resulted in a decrease in pH value, regardless of their frequency and duration. The total extract content was affected only by 46 Hz vibrations, whereas the dry matter content of mushrooms was not affected by the vibrations. The changes of pH value and refractometric total extract were minor, and probably related mainly to water loss as a result of water transpiration from the mushrooms subjected to vibrations and storage. The content of polyphenols and the antioxidative activity of mushrooms subjected to model transport increased within 3 h, while after 6 h of vibrations the values of these parameters were close to the initial state in fresh mushrooms. After 4 days of storage, both in non-vibrated and vibrated control samples of mushrooms, an increase in polyphenols and antioxidant activity was observed in comparison with fresh mushrooms. Analysing the changes in the examined parameters during the application of mechanical vibrations and storage, in order to reflect the actual transport of the mushrooms in Europe and their subsequent storage in a shop or at home (shelf life), it was found that, despite the deterioration of the visual quality of the mushrooms (darkening and browning of the fruiting bodies), the chemical parameters were relatively stable, and an increase in the content of polyphenols and antioxidant activity was observed. However, from the point of view of the consumer making a purchasing decision in the store, the most important is the attractive appearance of the products; in this case, the white colour of the mushrooms of this most popular variety. The change in colour of these fruiting bodies causes the consumer to associate a lack of freshness with the raw material, and discourages purchase. In conclusion, it is beyond doubt that the changing colour of the mushrooms during transport and short-term storage, the darkening of the fruiting bodies caused by enzyme activity, and oxidative processes, do not cause deterioration of their nutritional value or bioactive properties. However, the most important thing is to make every effort to transport mushrooms in the most favourable conditions, in packaging that reduce the effects of mechanical vibrations.

Author Contributions

Data curation, N.I., D.W.-T. and W.K.; Methodology, N.I. and D.W.-M.; Validation, K.B.; Writing—original draft, N.I. and D.W.-T.; Writing—review and editing, K.B. All authors have read and agreed to the published version of the manuscript.

Funding

This research was funded by Ministry of Science and Higher Education 05/51/DSPP/3552.

Acknowledgments

In this section you can acknowledge any support given which is not covered by the author contribution or funding sections. This may include administrative and technical support, or donations in kind (e.g., materials used for experiments).

Conflicts of Interest

The authors declare no conflict of interest.

References

  1. Wu, G.; Wang, C. Investigating the effects of simulated transport vibration on tomato tissue damage based on vis/NIR spectroscopy. Postharvest Biol. Technol. 2014, 98, 41–47. [Google Scholar] [CrossRef]
  2. Fahmy, K.; Nakano, K. Effective Transport and Storage Condition for Preserving The Quality of ‘Jiro’ Persimmon in Export Market. Agric. Agric. Sci. Procedia 2016, 9, 279–290. [Google Scholar] [CrossRef] [Green Version]
  3. Jung, H.M.; Lee, S.; Lee, W.-H.; Cho, B.-K.; Lee, S.H. Effect of vibration stress on quality of packaged grapes during transportation. Eng. Agric. Environ. Food 2018, 11, 79–83. [Google Scholar] [CrossRef]
  4. Wang, W.; Lu, H.; Zhang, S.; Yang, Z. Damage caused by multiple impacts of litchi fruits during vibration harvesting. Comput. Electron. Agric. 2019, 162, 732–738. [Google Scholar] [CrossRef]
  5. Wei, X.; Xie, D.; Mao, L.; Xu, C.; Luo, Z.; Xia, M.; Zhao, X.; Han, X.; Lu, W. Excess water loss induced by simulated transport vibration in postharvest kiwifruit. Sci. Hortic. 2019, 250, 113–120. [Google Scholar] [CrossRef]
  6. Hryszko, K. Rynek Rolny, Anlizy, Tendencje, Oceny; Wydawnictwo IERiGŻ: Warszawa, Poland, 2019. [Google Scholar]
  7. Zmarlicki, K.; Brzozowski, P. Preferencje konsumentów Skierniewic przy zakupie pieczarek. Roczniki (Annals) 2018, 2018, 237–241. [Google Scholar] [CrossRef]
  8. Chang, S.-T. World Production of Cultivated Edible and Medicinal Mushrooms in 1997 with Emphasis on Lentinus edodes (Berk.) Sing, in China. Int. J. Med. Mushrooms 1999, 1, 291–300. [Google Scholar] [CrossRef]
  9. Kumar, P.; Sharma, A.K.; Singh, B.; Sharma, H.K. Physico-chemical changes in white button mushroom (Agaricus biosporus) at different drying temperature. Mushroom Res. 1999, 8, 27–29. [Google Scholar]
  10. Siwulski, M.; Sokół, S.; Sobieralski, K.; Reguła, J.; Walkowiak-Tomczak, D.; Sas-Golak, I.; Szczepka, M.; Sztoch, R.; Sztoch, P.; Czuderna, J.G.R. Pieczarka Agaricus Gatunki, uprawa, Właściwości Prozdrowotne (Agaricus Species, Cultivation, Health Promoting Properties); Wydawnictwo Uniwersytetu Przyrodniczego: Poznań, Poland, 2014; ISBN 978-83-7160-740-0. [Google Scholar]
  11. Mattila, P.; Suonpää, K.; Piironen, V. Functional properties of edible mushrooms. Nutrition 2009, 16, 694–696. [Google Scholar] [CrossRef]
  12. Muszyńska, B.; Kała, K.; Rojowski, J.; Grzywacz, A.; Opoka, W. Composition and Biological Properties of Agaricus bisporus Fruiting Bodies A Review. Pol. J. Food Nutr. Sci. 2017, 67, 173–181. [Google Scholar] [CrossRef] [Green Version]
  13. Feng, T.; Wu, Y.; Zhang, Z.; Song, S.; Zhuang, H.; Xu, Z.; Yao, L.; Sun, M. Purification, Identification, and Sensory Evaluation of Kokumi Peptides from Agaricus bisporus Mushroom. Foods 2019, 8, 43. [Google Scholar] [CrossRef] [Green Version]
  14. Tritean, N.; Bărbieru, O.-G.; Constantinescu-Aruxandei, D.; Oancea, F. Extraction and Plastein Reaction of Bioactive Peptides from Agaricus Bisporus Mushrooms. Proceedings 2019, 29, 106. [Google Scholar] [CrossRef] [Green Version]
  15. Brodziak, L.; Majchrzak, R. Nutritive value of the mushroom Lentinus edodes (Berk.) Sing. (shiitake) compared with that of other edible mushrooms. Rocz. Państwowego Zakładu Hig. 1984, 35, 59–62. [Google Scholar]
  16. Vetter, J. Chemical composition of fresh conserved Agaricus bisporus mushroom. Eur. Food Res. Technol. 2003, 217, 10–12. [Google Scholar] [CrossRef]
  17. Chang, S.-T. The World Mushroom Industry: Trends and Technological Development. Int. J. Med. Mushrooms 2006, 8, 297–314. [Google Scholar] [CrossRef]
  18. Kim, K.M.; Ko, J.; Lee, J.-S.; Park, H.; Hanna, M. Effect of modified atmosphere packaging on the shelf life of coated whole and sliced mushroom. LWT Food Sci. Technol. 2006, 39, 365–372. [Google Scholar] [CrossRef]
  19. Kalac, P. A review of chemical composition and nutritional value of wild-growing and cultivated mushrooms. J. Sci. Food Agric. 2013, 93. [Google Scholar] [CrossRef]
  20. Antmann, G.; Ares, G.; Lema, P.; Lareo, C. Influence of modified atmosphere packaging on sensory quality of shiitake mushrooms. Postharvest Biol. Technol. 2008, 49, 164–170. [Google Scholar] [CrossRef]
  21. Idaszewska, N.; Bieńczak, K.; Szymański, G.; Janeba-Bartoszewicz, E. Wpływ drgań generowanych podczas transportu na cechy fizykochemiczne pomidorów. Inżynieria I Apar. Chem. 2017, 56, 198–199. [Google Scholar]
  22. Idaszewska, N.; Szymański, G. Identyfikacja charakterystycznych parametrów sygnału drgań podczas transportu owoców i warzyw. In Proceedings of the Konferencja Naukowa VibDiag, Poznań, Poland, 17 October 2019; p. 26. [Google Scholar]
  23. CIE Recommendations on Uniform Color Spaces, Color-Difference Equations, and Metric Color Terms. Color Res. Appl. 1977, 2, 5–6. [CrossRef]
  24. Mieszkalska, A.; Piotrowski, D. Wykorzystanie modeli barwy do oceny suszonych surowców roślinnych. Postępy Tech. Przetwórstwa Spożywczego 2014, 2, 105–111. [Google Scholar]
  25. Wang, Y.; Zhao, H.; Deng, H.; Song, X.; Zhang, W.; Wu, S.; Wang, J. Influence of pretreatments on microwave vacuum drying kinetics, physicochemical properties and sensory quality of apple slices. Pol. J. Food Nutr. Sci. 2019, 69, 297–306. [Google Scholar] [CrossRef]
  26. PN-90/A-75101/06. Przetwory Owocowe i Warzywne Przygotowanie Próbek i Metody Badań Fizykochemicznych Oznaczanie pH Metodą Potencjometryczną; Polski Komitet Normalizacyjny: Warszawa, Polska, 1990. [Google Scholar]
  27. PN-90/A-75101/02 eqv ISO 2172- 1987 (E) i 2173 - 1978 (E). Przetwory Owocowe i Warzywne. Przygotowanie Próbek i Metody Badań Fizykochemicznych. Oznaczanie Ekstraktu Ogólnego; Polski Komitet Normalizacyjny: Warszawa, Polska, 1990. [Google Scholar]
  28. PN-90/A-75101/03. Przetwory Owocowe i Warzywne Przygotowanie Próbek i Metody Badań Fizykochemicznych Oznaczanie Zawartości Suchej Masy Metodą Wagową; Polski Komitet Normalizacyjny: Warszawa, Polska, 1990. [Google Scholar]
  29. Re, R.; Pellegrini, N.; Proteggente, A.; Pannala, A.; Yang, M.; Rice-Evans, C. Antioxidant activity applying an improved ABTS radical cation decolorization assay. Free Radic. Biol. Med. 1999, 26, 1231–1237. [Google Scholar] [CrossRef]
  30. Fang, Z.; Zhang, M.; Sun, Y.; Sun, J. How to Improve Bayberry (Myrica rubra Sieb. et Zucc.) Juice Color Quality:  Effect of Juice Processing on Bayberry Anthocyanins and Polyphenolics. J. Agric. Food Chem. 2006, 54, 99–106. [Google Scholar] [CrossRef]
  31. US Food and Drug Administration. Approximate pH of Foods and Food Products. Available online: http://www.cfsan.fda.gov/-comm/lacf-phs.html (accessed on 17 June 2020).
  32. Eissa, H.A.A. Effect of chitosan coating on shelf life and quality of fresh-cut mushroom. J. Food Qual. 2007, 30, 623–645. [Google Scholar] [CrossRef]
  33. Skąpska, S.; Owczarek, L.; Jasińska, U.; Hałasińska, A.; Danielczuk, J.; Sokolowska, B. Zmiany pojemności przeciwutleniającej grzybów jadalnych w procesie kiszenia. Żywność Nauk. Technol. Jakość 2008, 4, 243–250. [Google Scholar]
  34. Cherno, N.; Osolina, S.; Nikitina, A. Chemical Composition of Agaricus Bisporus and Pleurotus. Food Environ. Saf. J. Fac. Food Eng. 2013, XII, 291–299. [Google Scholar]
  35. Rózsa, S.; Gocan, T.M.; Lazăr, V.; Andreica, I.; Rózsa, M.; Măniuţiu, D.N.; Sima, R. The effect of processing on chemical constituents of Agaricus spp. mushrooms. Not. Bot. Horti. Agrobot. Cluj-Napoca 2017, 45, 507–516. [Google Scholar] [CrossRef] [Green Version]
  36. Kałużewicz, A.; Sobieralski, K.; Frąszczak, B.; Golak-Siwulska, I.; Miran, D. The influence of the strain, flush and size of carpophores on the yield and dry matter content of button mushroom (Agaricus bisporus (Lange) Imbach) carpophores. Nauk. Przyr. Technol. 2016, 10, 2–10. [Google Scholar] [CrossRef] [Green Version]
  37. Oms-Oliu, G.; Aguiló-Aguayo, I.; Martín-Belloso, O.; Soliva-Fortuny, R. Effects of pulsed light treatments on quality and antioxidant properties of fresh-cut mushrooms (Agaricus bisporus). Postharvest Biol. Technol. 2010, 56, 216–222. [Google Scholar] [CrossRef]
  38. Barros, L.; Cruz, T.; Baptista, P.; Estevinho, L.M.; Ferreira, I.C.F.R. Wild and commercial mushrooms as source of nutrients and nutraceuticals. Food Chem. Toxicol. 2008, 46, 2742–2747. [Google Scholar] [CrossRef] [PubMed]
  39. Liu, J.; Jia, L.; Kan, J.; Jin, C. In vitro and in vivo antioxidant activity of ethanolic extract of white button mushroom (Agaricus bisporus). Food Chem. Toxicol. 2013, 51, 310–316. [Google Scholar] [CrossRef] [PubMed]
  40. Dubost, N.; Ou, B.; Beelman, R. Quantification of polyphenols and ergothioneine in cultured mushrooms and correlation to total antioxidant capacity. Food Chem. 2007, 105, 727–735. [Google Scholar] [CrossRef]
  41. Giannenas, I.; Tsalie, E.; Chronis, E.; Mavridis, S.; Tontis, D.; Kyriazakis, I. Consumption of Agaricus bisporus mushroom affects the performance, intestinal microbiota composition and morphology, and antioxidant status of turkey poults. Anim. Feed Sci. Technol. 2011, 165, 218–229. [Google Scholar] [CrossRef]
  42. Czapski, J. Antioxidant activity and phenolic content in some strains of mushrooms (Agaricus bisporus). Veg. Crop. Res. Bull. 2005, 62, 165–173. [Google Scholar]
  43. Bernaś, E.; Jaworska, G.K.W. Storage and processing of edible mushrooms. Acta Sci. Pol. Technol. Aliment. 2006, 5, 5–23. [Google Scholar]
Figure 1. Diagram of test stand for vibration simulation: 1—stationary body with adjustable temperature, 2—container or box for the mushrooms, 3—motor 0.09 kW; 2800 rpm; 230/400 V; 0.58/0.33 A; IMB3, 4—suspension and vibration isolation elements, 5—Omron MX2-AB 002-E (SJ200–002NFEF2), 6—computer with software [21].
Sustainability 12 04993 g001
Figure 2. Diagram of the experiment.
Sustainability 12 04993 g002
Table 1. pH values, total extract and dry matter content of mushrooms, depending on the frequencies used, the vibration time and the storage time.
Frequency [Hz]Storage Time [days]Fresh ProduceTime of Vibrations [h]
36
pH4606.5 ± 0.01 b6.42 ± 0.02 a6.43 ± 0.01 a
46.46 ± 0.04 a,b6.38 ± 0.00 c6.43 ± 0.02 a
2806.40 ± 0.02 b6.39 ± 0.03 b6.35 ± 0.02 a
46.30 ± 0.01 c6.34 ± 0.01 a6.35 ± 0.01 a
Total Extract4607.0 ± 0.1 b7.6 ± 0.21 a8.0 ± 0.22 a
48.6 ± 0.0 c8.2 ± 0.18 a8.2 ± 0.18 a
2807.6 ± 0.19 a7.5 ± 0.19 a7.7 ± 0.21 a
48.8 ± 0.22 b8.4 ± 0.22 b8.6 ± 0.23 b
Dry Matter4607.8 ± 0.33 b8.24 ± 0.39 a,b8.94 ±0.28 a
49.3 ± 1.02 a9.23 ± 0.51 a9.24 ± 0.24 a
2809.3 ± 0.6 a9.5 ± 0.78 a,b9.4 ± 0.36 a
410.6 ± 0.06 b9.8 ± 0.71 a,b9.8 ± 0.25 a,b
Explanation: Mean values marked with the same letter do not differ statistically significantly with p = 0.05 within a single frequency.
Table 2. Antioxidant activity of mushrooms subjected to vibrations, depending on the frequencies used, the vibration time and the storage time.
Frequency [Hz]Storage Time [days]Fresh ProduceTime of Vibration [h]
36
460127.2 ± 27.8 b230.7 ± 89.0 a130.7 ± 28.0 b
4196.4 ± 31.0 a,b263.8 ± 66.7 a203.0 ± 58.0 a,b
28066.3 ± 3.8 b81.3 ± 15.8 b58.9 ± 6.8 b
468.8 ± 20.1 b170.4 ± 48.9 a119.8 ± 69.4 a,b
Explanation: Mean values marked with the same letter do not differ statistically significantly at p = 0.05 within a single frequency.
Table 3. Polyphenol content in terms of gallic acid in mushrooms subjected to vibrations, depending on the frequency used, the vibration time and the storage time.
Frequency [Hz]Storage Time [days]Fresh ProduceTime of Vibration [h]
36
460766 ± 28 c817 ± 51 a,b,c791 ± 16 b,c
4789 ± 83 b,c818 ± 45 a,b864 ± 73 a
280441 ± 4 e500 ± 30 d459 ± 31 e
4607 ± 12 b555 ± 47 c640 ± 12 a
Explanation: Mean values marked with the same letter do not differ statistically significantly at p = 0.05 within a single frequency.
Table 4. Changes in colour parameters of mushrooms subjected to mechanical vibrations (46 Hz) and storage.
Time of Vibration [h]Time of Storage [days]L *(D65)a *(D65)b *(D65)C *(D65)h(D65)ΔE
Fresh Mushrooms086.4 ± 2.5 a1.2 ± 0.9 d13.3 ± 2.8 d13.4 ± 2.9 d85.3 ± 3.1 a
482.9 ± 3.1 a,d2.1 ± 1.2 c,d17.2 ± 3.8 b,c17.3 ± 3.9 b,c83.4 ± 2.7 a,b5.3
3083.7 ± 3.2 a2.1 ± 1.0 c,d15.0 ± 3.2 c,d15.2 ± 3.3 c,d82.3 ± 2.3 b,c3.3
479.2 ± 4.4 c,d2.9 ± 1.5 b,c18.4 ± 3.1 a,b18.7 ± 3.3 a,b81.3 ± 3.3 b,c9.0
6076.7 ± 4.6 b,c3.9 ± 2.9 a,b20.9 ± 3.0 a21.3 ± 3.2 a79.6 ± 2.6 c12.6
472.7 ± 3.4 b5.1 ± 1.4 a18.5 ± 2.5 a,b19.3 ± 3.0 a,b75.3 ± 3.4 d15.1
Explanation: Mean values marked with the same letter do not differ statistically significantly at p = 0.05 within a single frequency.
Table 5. Changes in colour parameters of mushrooms subjected to mechanical vibrations (28 Hz) and storage.
Time of Vibration [h]Time of Storage [days]L *(D65)a *(D65)b *(D65)C *(D65)h(D65)ΔE
Fresh Mushrooms087.4 ± 1.7 a0.5 ± 0.6 a11.4 ± 1.4 a11.4 ± 1.4 a87.6 ± 2.3 a
484.4 ± 2.7 b,c1.8 ± 1.2 b15.7 ± 2.2 c,d15.8 ± 2.3 c,d83.8 ± 3.8 b5.4
3086.0 ± 2.7 a,b1.5 ± 1.0 a,b12.7 ± 1.8 a,b12.3 ± 1.9 a,b83.6 ± 3.1 b2.2
482.7 ± 3.4 c2.2 ± 0.4 b16.8 ± 3,0 d16.9 ± 3.1 d83.0 ± 3.4 b7.4
6085.0 ± 2.8 a,b,c1.3 ± 0.8 a,b13.8 ± 2.3 b,c13.9 ± 2.4 b,c85.2 ± 2.7 a,b3.5
476.7 ± 3.9 d4.8 ± 0.6 c20.4 ± 3.6 e21.0 ± 4.0 e77.6 ± 4.5 c14.7
Explanation: Mean values marked with the same letter do not differ statistically significantly at p = 0.05 within a single frequency.
Table 6. Summary of the results of pH values, total extract, dry matter content, antioxidant activity and polyphenol content of mushrooms, depending on the frequencies used, the vibration time and the storage time—percentage differences between initial sample and vibrated mushrooms.
Frequency [Hz]Storage Time [days]Time of Vibrations [h]
36
[%]
pH460−1−1
4−10
2800−1
411
Total Extract460914
4−5−5
280−11
4−5−2
Dry Matter460615
4−1−1
28021
4−8−8
Antioxidant Activity460823
4354
28023−11
414674
Polyphenol Content46073
4410
280134
4−95

