Article

Assessment of the Impacts of Climate Change and Human Activities on Runoff Using Climate Elasticity Method and General Circulation Model (GCM) in the Buqtyrma River Basin, Kazakhstan

by
Moldir Rakhimova
1,2,3,4,5,
Tie Liu
1,2,3,4,*,
Sanim Bissenbayeva
1,3,4,
Yerbolat Mukanov
1,3,4,6,
Khusen Sh. Gafforov
1,2,3,4,
Zhuldyzay Bekpergenova
3,4,7 and
Aminjon Gulakhmadov
3,8
1
State Key Laboratory of Desert and Oasis Ecology, Xinjiang Institute of Ecology and Geography, Chinese Academy of Sciences, Urumqi 830011, China
2
Key Laboratory of GIS & RS Application Xinjiang Uygur Autonomous Region, Urumqi 830011, China
3
Research Center for Ecology and Environment of Central Asia, Chinese Academy of Sciences, Urumqi 830011, China
4
University of Chinese Academy of Science, Beijing 100049, China
5
Faculty of Natural Sciences, L.N. Gumilyov Eurasian National University, Nur-Sultan 010008, Kazakhstan
6
Regional State Enterprise Kazhydromet, Nur-Sultan 010000, Kazakhstan
7
Xinjiang Key Laboratory of Environmental Pollution and Bioremediation, Xinjiang Institute of Ecology and Geography, Chinese Academy of Sciences, Urumqi 83011, China
8
Ministry of Energy and Water Resources of the Republic of Tajikistan, Dushanbe 734064, Tajikistan
*
Author to whom correspondence should be addressed.
Sustainability 2020, 12(12), 4968; https://doi.org/10.3390/su12124968
Submission received: 14 May 2020 / Revised: 14 June 2020 / Accepted: 15 June 2020 / Published: 18 June 2020

Abstract

:
The variations of climate and water resources in the Buqtyrma River Basin (BRB), which is located at the cross-section of the Altai Mountains, Eurasian Steppe and Tian Shan Mountains, have a great significance for agriculture and ecosystems in the region. Changing climatic conditions will change the hydrological cycle in the whole basin. In this study, we examined the historical trends and change points of the climate and hydrological variables, the contributions of climate change and human activities to runoff changes, and the relative changes in the runoff to the precipitation and potential evapotranspiration from 1950 to 2015 by using the Mann–Kendall trend test, Pettitt test, double cumulative curve and elasticities methods. In addition, a multi-model ensemble (MME) of the six general circulation models (GCMs) for two future periods (2036–2065 and 2071–2100) was assessed to estimate the spatio-temporal variations in precipitation and temperature under two representative concentration pathways (RCPs 4.5 and 8.5) scenarios. Our study detected that the runoff change-point occurred in 1982. The impacts induced by climate change on runoff change were as follows—70% in the upstream, 62.11% in the midstream and 15.34% in the downstream area. The impacts of human activity on runoff change were greater in the downstream area (84.66%) than in the upstream and midstream areas. A continuously increasing trend was indicated regarding average annual temperature under RCP 4.5 (from 0.37 to 0.33 °C/decade) and under RCP 8.5 (from 0.50 to 0.61 °C/decade) during two future periods. Additionally, an increasing trend in predicted precipitation was exhibited under RCP 4.5 (13.6% and 19.9%) and under RCP 8.5 (10.5% and 18.1%) during both future periods. The results of the relative runoff changes to the predicted precipitation and potential evapotranspiration were expected to increase during two future time periods under RCP 4.5 (18.53% and 25.40%) and under RCP 8.5 (8.91% and 13.38%) relative to the base period. The present work can provide a reference for the utilization and management of regional water resources and for ecological environment protection.

1. Introduction

The hydrological cycle is the driving factor for the physical and ecological processes on the Earth’s surface and has a huge impact on the survival of living organisms, particularly human beings [1]. Because the hydrological cycle is the most important process on the Earth’s surface, runoff is closely related to each aspect of human activity—influencing agricultural irrigation, vegetation growth, land use and the quality and quantity of regional water use [2,3]. Many studies have revealed that runoff faces various environmental problems globally, mainly because of global climate change and due to the increasing effects of human interventions in recent decades [4,5,6]. Changes in runoff may result in numerous environmental and hydrological problems, and this is especially crucial for water-limited areas, due to its determining role in regional economic growth and sustainable development [7].
There are many factors which influence the formation of runoff, including atmospheric rainfalls, temperature, topography, soil, and vegetable covers [8]. The impact of various factors on runoff has been explored by previous studies, among which climate change and human activities have great significance. For instance, research into the annual runoff in an arid region in northwestern China found a significant decreasing trend in runoff, due to a decrease in precipitation and an increase in potential evaporation [9,10]. Wang et al. analyzed the impact of climate variability and land use changes on runoff in Haihe River Basin, and their result showed that the forest has the most significant effect on runoff under a variable climate [11]. Dong et al. and Alizadeh et al. reported that different parts of the watershed were affected differently by the climatic and anthropogenic factors [12,13]. Furthermore, numerous studies have emphasized that climate warming leads towards the variability of the regional hydrological cycle [14], which will indirectly cause changes in runoff. Human activities may also incur severe negative effects on our environment, which, in turn, can affect our livelihood. The worldwide, large-scale use of water resources has led to significant changes in surface runoff [9,10], and the anthropogenic transformation of the natural environment and drafting of the surfaces of river basins has directly or indirectly led to a change in the quantitative and qualitative characteristics of runoff. Moreover, the response of runoff to climate change and human activities greatly differs from catchment to catchment [15,16]. Hydrological models are consistent and reliable when studying the impact of climate change on runoff, but hydrological models require detailed input for calibration, and are therefore, of limited uses in river basins with incomplete data [17] As an alternative, it is possible to use the method of climatic elasticity, which was proposed by Budyko, Arora, Fu, Zhang, and Wang [18,19,20,21], to quantify the sensitivity of runoff to climate variables. Therefore, it is necessary to conduct a study for this confluence area which will be helpful to devise proper management strategies.
Buqtyrma is the largest tributary of the Ertis River within East Kazakhstan. The surface water resources of the Upper Ertis basins consist of river flows which form within the East Kazakhstan and Semey regions of Kazakhstan. The main volume of runoff within the middle course of the Ertis River comes from the catchment of the Upper Ertis (up to 65%). The upper part of the basin is located in the Altai Mountains. The Upper Ertis is characterized by a continental climate. The hydrological variations in the Ertis River can be partly explained by climate changes. The increase in runoff in spring may be partially due to an increase in the rainfall in winter [22,23]. Over the past few decades, the territory has become vulnerable to climate changes and the increase in air temperature, with the most severe warming observed in the spring and winter seasons in the area [24]. This might have an impact on the changes in the runoff in Buqtyrma River Basin. The decrease in the runoff, for instance, during the flood season may be attributed to an increase in temperature and a decrease in precipitation. However, some hydrological changes are opposite to those expected from climate change [25], indicating that climate change does not sufficiently explain all of the hydrological changes. On the other hand, human activity–for example, water production, industry, agricultural irrigation and land use–can also change the hydrological regime [26].
To date, some studies have been carried out reporting the flow in the upper reaches of the Ertis River basin. However, to the best of our knowledge, a systematic quantitative assessment of the impact of climate variability and human activity on changes in the runoff of the Buqtyrma River Basin has not yet been reported.
Thus, taking into account all the above-mentioned factors, the objectives of this study are as follows: (1) To evaluate the long-term changes in the river flow of the Buqtyrma basin; (2) to detect points of change in annual runoff; (3) to quantify the impact of climate variability and human activities on runoff and evaluate the level of influences between upstream, middle, and downstream areas; (4) to evaluate the effect of climate variability on the hydrological regime using six future climate projections of general circulation models (GCM) for temperatures and precipitation under RCP 4.5 and 8.5 climate emissions scenarios; and (5) to assess changes of predicted runoff by using the climate elasticity method for two climate variables, precipitation and potential evapotranspiration, during future periods based on MME under RCPs 4.5 and 8.5. Above all, we hope that the findings of this work will be highly useful for further research and presents valuable information about the protection and sustainable consumption of water resources in the surrounding areas.

2. Materials and Methods
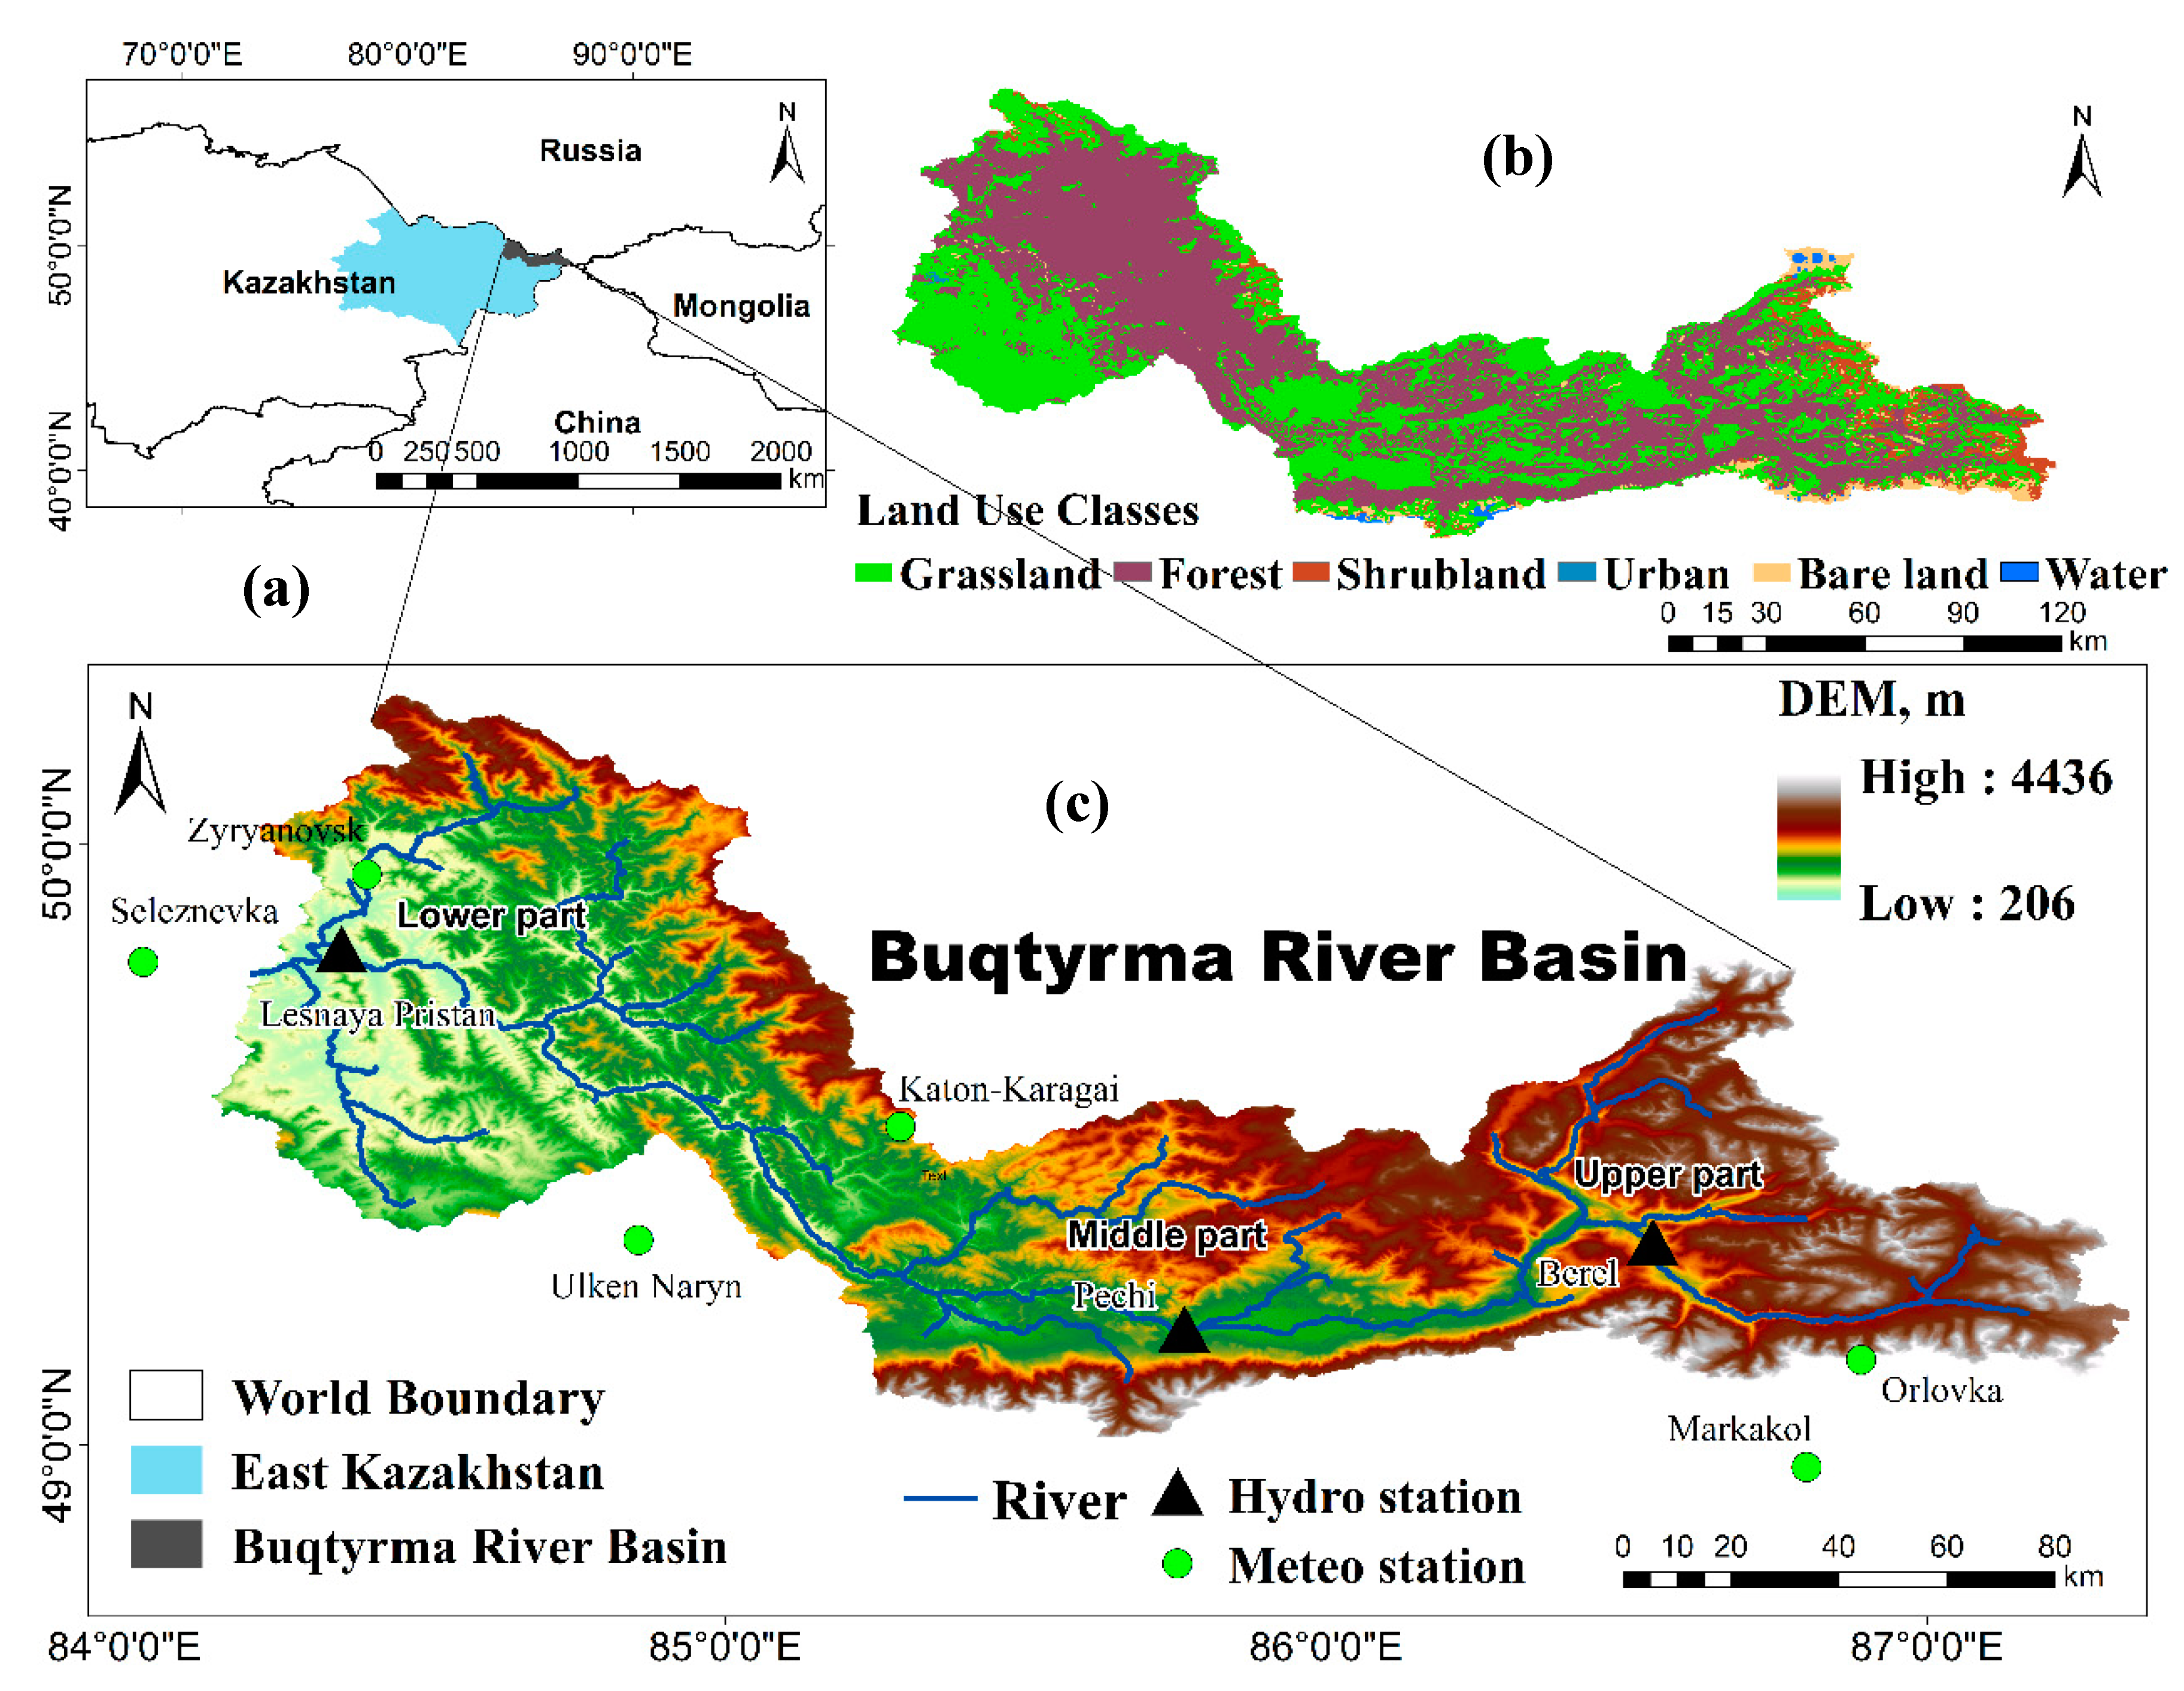
2.1. Study Area

The Buqtyrma River Basin (Figure 1) is located in the eastern part of Kazakhstan between 49°09′19″ and 49°44′26″ N and 83°59′25″ and 87°15′51″ E. The Buqtyrma River Basin is the most abundant right-bank tributary of the river Ertis. The river and its main tributaries form their runoff in the territory of the Kazakh Altai mountains with a high moisture level and highly rugged relief, creating the largest river network density and runoff layer in East Kazakhstan [27]. In this river basin, Buqtyrma forms up to 25% (8.31 km3) of local water resources. The Buqtyrma River Basin originates in the Altai glaciers in eastern Kazakhstan and has runoffs from an altitude of 4500 to 400 m above sea level, with an average water runoff rate of 214 m3/s [28]. The Buqtyrma River Basin is the largest basin in the Altai mountains and flows into the Ertis River at a distance of 1183 km. Its length is 336 km; the area of the basin is about 12,660 km2. The mountain area in the Buqtyrma River Basin accounts for up to 80% of this region. The climate of the territory under consideration is continental, with large fluctuations in daily, seasonal and annual air temperatures, which are determined by the deep intracontinental position of the region. Winter is harsh, while summer is relatively long, hot and arid. Within different parts of the territory, the climate has its own characteristics due to several factors, such as the geographical position, the height of the terrain, the nature of the relief, the direction of the mountain ranges and the exposure of the slopes. The average temperature of the January is from –17 °С on the plains and to –26 °С in highland basins. The average temperature of the warmest month (July) exceeds 19.6 °С (except for the highlands) in the northwest, reaching 20–23 °С in the dry steppes and semi-deserts in the southeast of the region [29]. The variation in the annual amount of precipitation associated with the variously oriented slopes of the ranges with respect to the moisture-bearing air masses reaches 300–500 mm. The soil cover of the Buqtyrma basin is characterized by an altitudinal distribution. Mountain meadow and subalpine soddy soils (Katunsky, Listvyaga and Kholzun ridges) are widespread in the upper part of the Buqtyrma basin. The humus horizon of these soils is dark grey in color and reaches a thickness of 30–50 cm. The humus content in the upper part of this horizon exceeds 15%.
The Buqtyrma has a developed river network, the average density coefficient of the river network is 0.51 km/km2, reaching 0.70–0.75 km/km2 or more in some places. In total, there are 167 glaciers in the Buqtyrma basin (the largest of which are Berel and Buqtyrma) with a total area of 69.9 km2 and an ice volume of 3.20 km3 [27]. The glaciers are very sensitive to climate change. Water consumption in the Buqtyrma basin is divided among industry, the population and irrigation for agriculture; agriculture is mainly characterized by rain-fed farming and pastoralism. Mineral mining has been carried out in the basin. Small cities and towns are also scattered throughout the whole region [27,30].

2.2. Data Source

Meteorological data were obtained from the eleven weather stations, including annual precipitation and average annual temperatures (max, min), during 1950–2015. The climate data, such as precipitation and temperature, were derived from the two sources [31,32] in which accurate data were available for the region of Central Asia. Data on runoff in the rivers of the upstream–Berel–in the midstream–Pechi–and the downstream–Lesnaya Pristan–were collected from the State Water Cadaster [27,33,34,35]. Potential evapotranspiration (PET) between 1950 and 2015 was further calculated using the time series of the Climate Research Unit (CRU, TS v.4.01) [36]. This dataset has a spatial resolution of 0.5 to 0.5. These grid values were calculated using the Penman–Monteith variant. These grid absolute PET values are then formatted for output. The CRU dataset is relatively reliable for use in Central Asia [37]. The Hargreaves method was used for estimation of the future potential evapotranspiration (PET) which utilized maximum, minimum and mean temperature and solar radiation records for the study area. The climate models data for the historical period of 1971–2000 was utilized, which agreed with the period of observational data, as well as the future climate data for the future period of 2036–2100 under two scenarios, RCPs 4.5 and 8.5, of the Coupled Model Inter-Comparison in Phase 5 (CMIP5) model were used in this study. This was derived from the NASA Center for Climate Simulation website [38]. The detailed explanation is shown in Appendix A Table A1.

2.3. Mann–Kendall Trend Test

The Mann–Kendall (MK) test is a rank-based non-parametric method for determining the significance of trends in hydro-climatic variables [39]. This method was used to examine the trends of hydro-climatic variables (the annual mean temperature, annual precipitation, annual potential evapotranspiration and annual runoff during the period of 1950–2015) in the Buqtyrma River Basin (BRB). One of the advantages of this test is that the data do not have to correspond to any particular probability distribution. When xj and xk in time series X = [x1, x2, ..., xn] are independent, using the below equations, we can express the statistics S and signs. In order to find the P-value using MK and significance level, α we applied the statistical hypothesis test.
S = k = 1 n 1 j = k + 1 n s g n ( x j x k )
where n is the number of data points, xj and xk are the sequential data values.
S g n ( X j X k ) = { 1       ( X j X k ) > 0   0         ( X j X k ) = 0 1         ( X j X k ) < 0
The average of S is E[S] = 0 and the change σ2 is
σ 2 = { n ( n 1 ) ( 2 n + 5 ) j = 1 p t j ( t j 1 ) ( 2 t j + 5 ) } / 18
In the datasets, the tied groups number is presented by the P-value, and the data point in the jth tied group number is given by tj. The statistic S is roughly normally distributed given that the following Z-statistics change is engaged:
Z = { S 1 V a ( S ) S > 0 0                 S = 0 S + 1 V a ( S ) S < 0

2.4. Change Point Detection

The Pettitt test [40] is a kind of non-parametric trend test to determine the point of change. This test is usually used to detect a single point of change in hydro-climatic datasets. This approach considers a time series as two samples represented by x1; x2; ...; xt and xt+1; ...; xn. Equation (5) shows the non-parametric statistics by Pettitt [41]:
U t , n = j = 1 t i = 1 n s g n ( x j x i ) ( t = 1 , , n )
where Ut at maximum agrees with the abrupt changes over the year in long-term datasets.

2.5. Double Cumulative Curve Method

For the consistent demonstration of annual precipitation and runoff data, the method of the Double Cumulative Curve (DCC) can be used and recently became an effective tool for detecting the changes of the hydrological regime, due to anthropogenic disturbances. The changed characteristics in precipitation or runoff can be identified from the gradient of the curve which is obtained from the straight line of DCC. In this study, the DCC will be utilized to identify the change point of the runoff series as a confirmation of the change points detected by Pettitt’s test. Using trend and change-point analysis, the runoff series can be divided into the natural period and the time period in which anthropogenic disturbances occurred [42]. Thus, the impacts of climate variability and human activities on runoff can be separated by using the following methods.

2.6. Method of Climate Elasticity

This study used the climate elasticity method to quantify the impact of climate variability and anthropogenic activities on runoff. The total change in runoff as a combination of climate change and human activities can be expressed as follows [43,44]:
Δ R = Δ R c l i m + Δ R h u m
where the average annual runoff of observed variability is shown as ΔR, the change in average annual runoff due to climate variability is shown as ΔRclim, and the change in average annual runoff as a result of human activity is shown as ΔRhum. Once ΔRclim is obtained, ΔRhum can be known using Equation (6).
Equations (7) and (8) present the relative contribution of climate variability and anthropogenic activities to runoff:
R a t e c l i m = Δ R c l i m Δ R × 100 %
R a t e h u m = Δ R h u m Δ R × 100 %
where Rateclim and Ratehum show the percentages of the impact caused by climate change and the impact of anthropogenic activities on the runoff, respectively.
The sensitivity of runoff to climate change can be estimated using climate elasticity. Perturbations of PET and precipitation can cause a change in water balance at the study point. Thus, we can estimate the total change in the average annual runoff as:
Δ R c l i m = ε P R P Δ P + ε P E T R P E T Δ P E T
where the potential evapotranspiration is ΔPET and precipitation is ΔP, respectively; for the sensitivity analysis, two parameters, εP and εPET (εP and εPET are the elastic coefficients of precipitation and potential evapotranspiration), were shown:
ε P = 1 + ϕ F ( ϕ ) 1 F ( ϕ )
ε P E T = ϕ F ( ϕ ) 1 F ( ϕ )
ε P + ε P E T = 1
where ϕ represents the dryness coefficient, given by ϕ = PET/P (PET is the potential evapotranspiration and P is precipitation). F(ϕ) and F’(ϕ) are expressed as follows [21]:
F ( ϕ ) = 1 + ω ϕ 1 + ω ϕ + 1 ϕ
F ( ϕ ) = 1 + 2 ω ϕ 1 + 1 ϕ 2 ( 1 + ω ϕ + 1 ϕ ) 2
where the plant-available water capacity coefficient related to vegetation type is ω [45], which ranges between 0.01 and 2.0. This can be estimated using an equation that can simulate the total evaporation at the watershed scale developed by Zhang:
E P = 1 + ω × P E T P 1 + ω × P E T P + P P E T
where the values present precipitation (P), potential evapotranspiration (PET) and evapotranspiration © during a period. The concept of a water-based balance provides a basis for studying hydrological behaviour in a basin and describes interactions of E, P, and R:
E = P R Δ S
where ΔS is the soil moisture content, ΔS can be expected to be zero for a long time series (i.e., 10 years or more), P is precipitation and runoff is R, respectively.

2.7. Delta Method and Future Climate Change Analysis

The projection of the future monthly precipitation changes of multi-model ensemble (MME) data over two time periods (2036–2065 and 2071–2100) utilizing the historical data (1971–2000) was computed by the Delta method. This method was applied to account for changes from a multi-model median and allowed for clustering of the entire range of different models and calculating their average level. Using Equations (17) and (18), we determined the outputs of GCM data; i.e., precipitation and temperature.
δ P = P f P h
Δ T = T f T h
where δ P and Δ T present the precipitation and temperature variations. For the future period, Pf and Tf show the mean of precipitation and temperature, while for the historical period, Ph and Th indicate the monthly precipitation and mean monthly temperature of the multi-model ensemble outputs. According to the GCM performance assessment, the multi-model ensemble (MME) based on the average mathematical method is used to predict monthly and annual precipitation in the future and temperature in both RCPs 4.5 and 8.5. Obviously, the equation is as follows:
M M E = 1 n f = 1 n P ( T ) f
where P(T)f is the GCM output for precipitation and temperature in the future, and the number of the selected GCM is shown as the n value.
Several statistical methods for estimating GCM were used to evaluate the function of the models: Spatial correlation (R), Nash–Sutcliff efficiency (NSE), Kling–Gupta efficiency (KGE), root mean square error (RMSE), and standard error.

2.8. Changes of Hydro Meteorological Variables in the Future

There are large uncertainties regarding the changes in future characteristics of the watershed: Therefore, only the impact of future climate changes (mean annual precipitation and mean annual temperature) on runoff is estimated in this study without taking the consequences of changes in the characteristics of the watershed into account [46]. The impact of climate change on runoff variation can be estimated as:
Δ R R = ε P Δ P P + ε P E T Δ P E T P E T
where ΔR is the runoff changes (mm) and ΔP and ΔPET are the mean annual change of precipitation (mm) and mean annual potential evapotranspiration (mm) in the future (2036–2065 and 2071–2100) relative to the historical period (1971–2000), respectively.
The fractional impacts of annual precipitation and potential evapotranspiration change on the runoff change (mm) can be expressed as follows:
Δ R P = ε P R Δ P P ;   Δ R P E T = ε P E T R Δ P E T P E T
where εp and εpet represent the elasticity coefficients of P and PET; ΔP and ΔPET are the mean annual change of precipitation (mm) and mean annual potential evapotranspiration; P and PET are the precipitation (mm) and potential evapotranspiration (mm) in the future (2036–2065 and 2071–2100) relative to the historical period (1971–2000), respectively.

3. Results

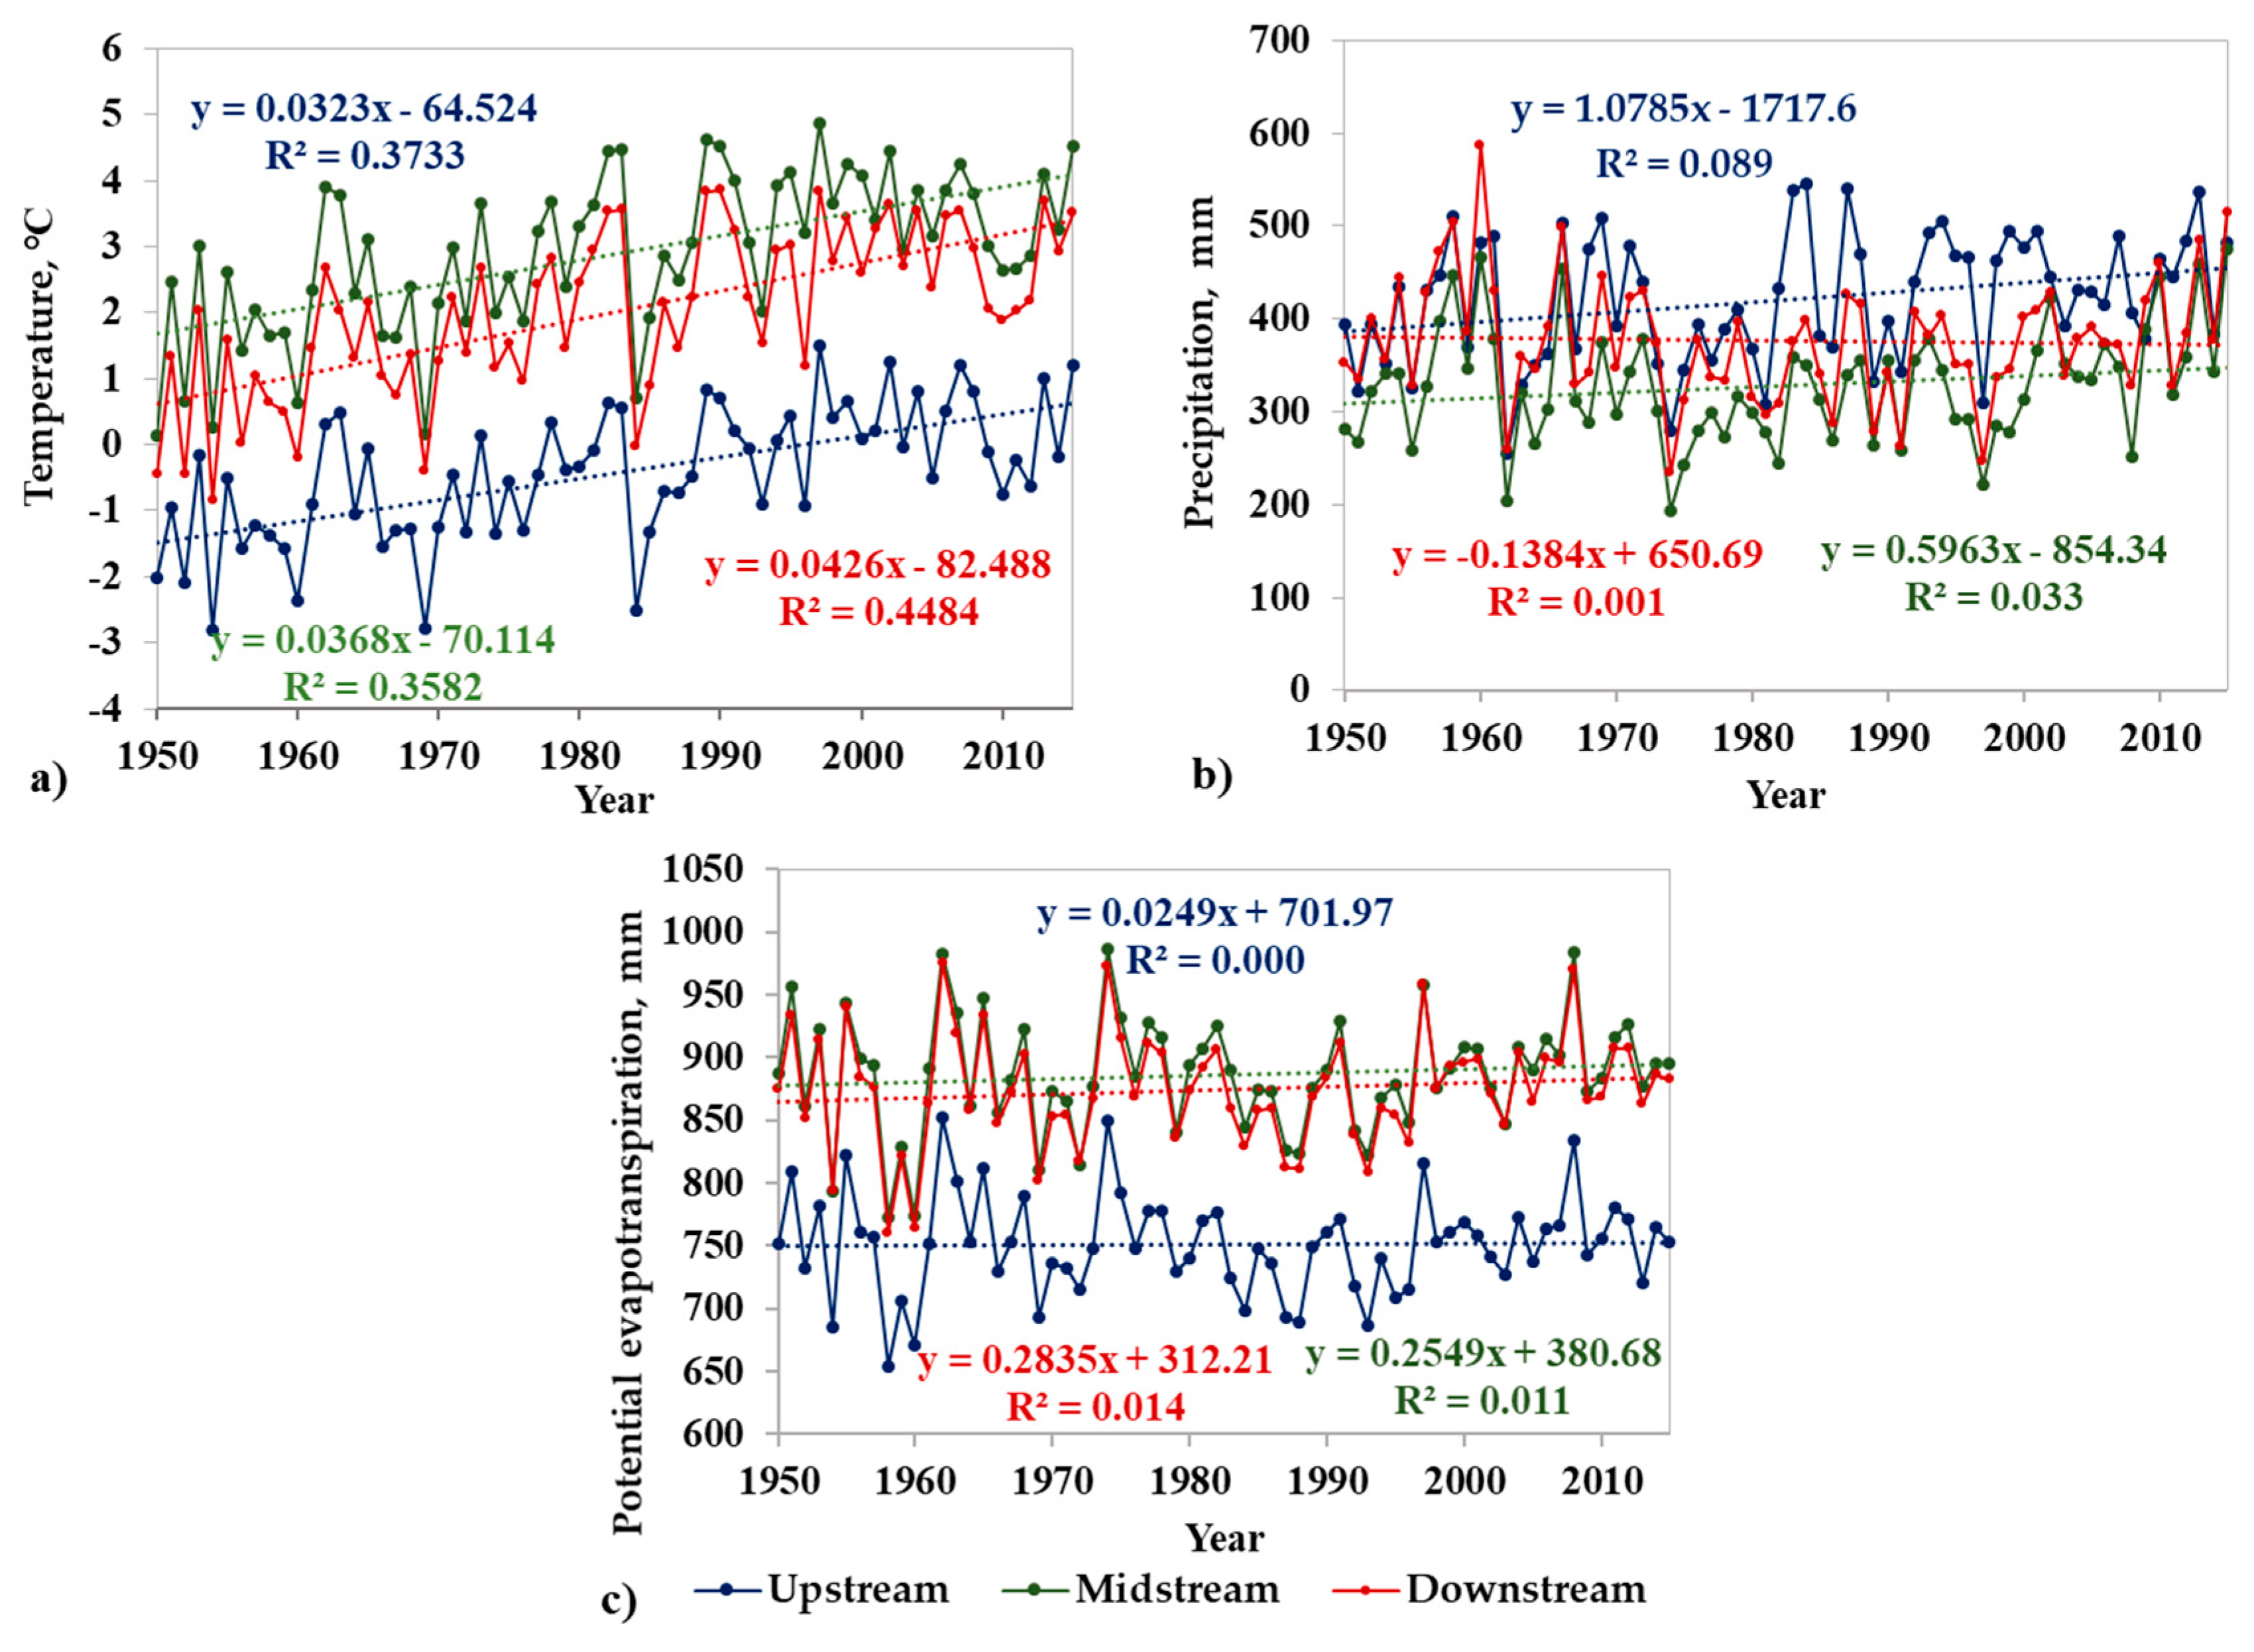
3.1. Analysis of the Change Point and Trend of the Temperature, Precipitation and Potential Evapotranspiration Series

The historical trends in hydro-meteorological factors are beneficial for understanding the impact of climate variability on water regimes [47]. The Mann–Kendall (MK) trend test determination method was used to detect changes in temperature, precipitation and PET trends in the Buqtyrma River Basin. Figure 2 shows the changes in temperature, precipitation and PET utilizing the climate data for the period of 1950–2015 in the Buqtyrma River Basin. Our results indicated an annual increase in temperature in the upstream and midstream at a rate from 0.032 to 0.043 °C/year and the downstream at a rate of 0.037 °C/year. The annual precipitation in the upper and middle parts showed positive trends from 0.6 to 1.1 mm/year, whereas it showed negative trends of –0.14 mm/year in the lower part. In the upper part of the catchment, the PET grew to 0.02 mm/year in the middle reach, this value was 0.25 mm/year, and in the lower reach, this value was 0.28 mm/year.
Table 1 demonstrates the statistical results based on the MK test. The annual precipitation trend showed an increasing tendency in the upstream and midstream. The annual precipitation trend in the downstream of the BRB indicated a decreasing tendency; however, the decreasing trend is not statistically significant in the downstream part. Additionally, the annual PET showed an insignificant increasing trend in the three reaches of the BRB. A significant increasing trend in mean annual temperature was observed at the 0.05 confidence level over the reference catchment throughout the study period (1950–2015). The study area under consideration faces climate variability, which could effect the runoff over time and space.
Using the Pettitt change point statistics, the abrupt change analysis of hydro-climatic factors was tested, as shown in Table 1. For the annual mean temperature, the abrupt change points occurred around in 1976 in the middle and lower parts and in 1988 in the upper part. The change points occurred in 1996 for PET. Unlike temperature and PET, change points of precipitation were in 1981 in the upstream, in 2000 in the midstream, and in 1972 in the downstream.

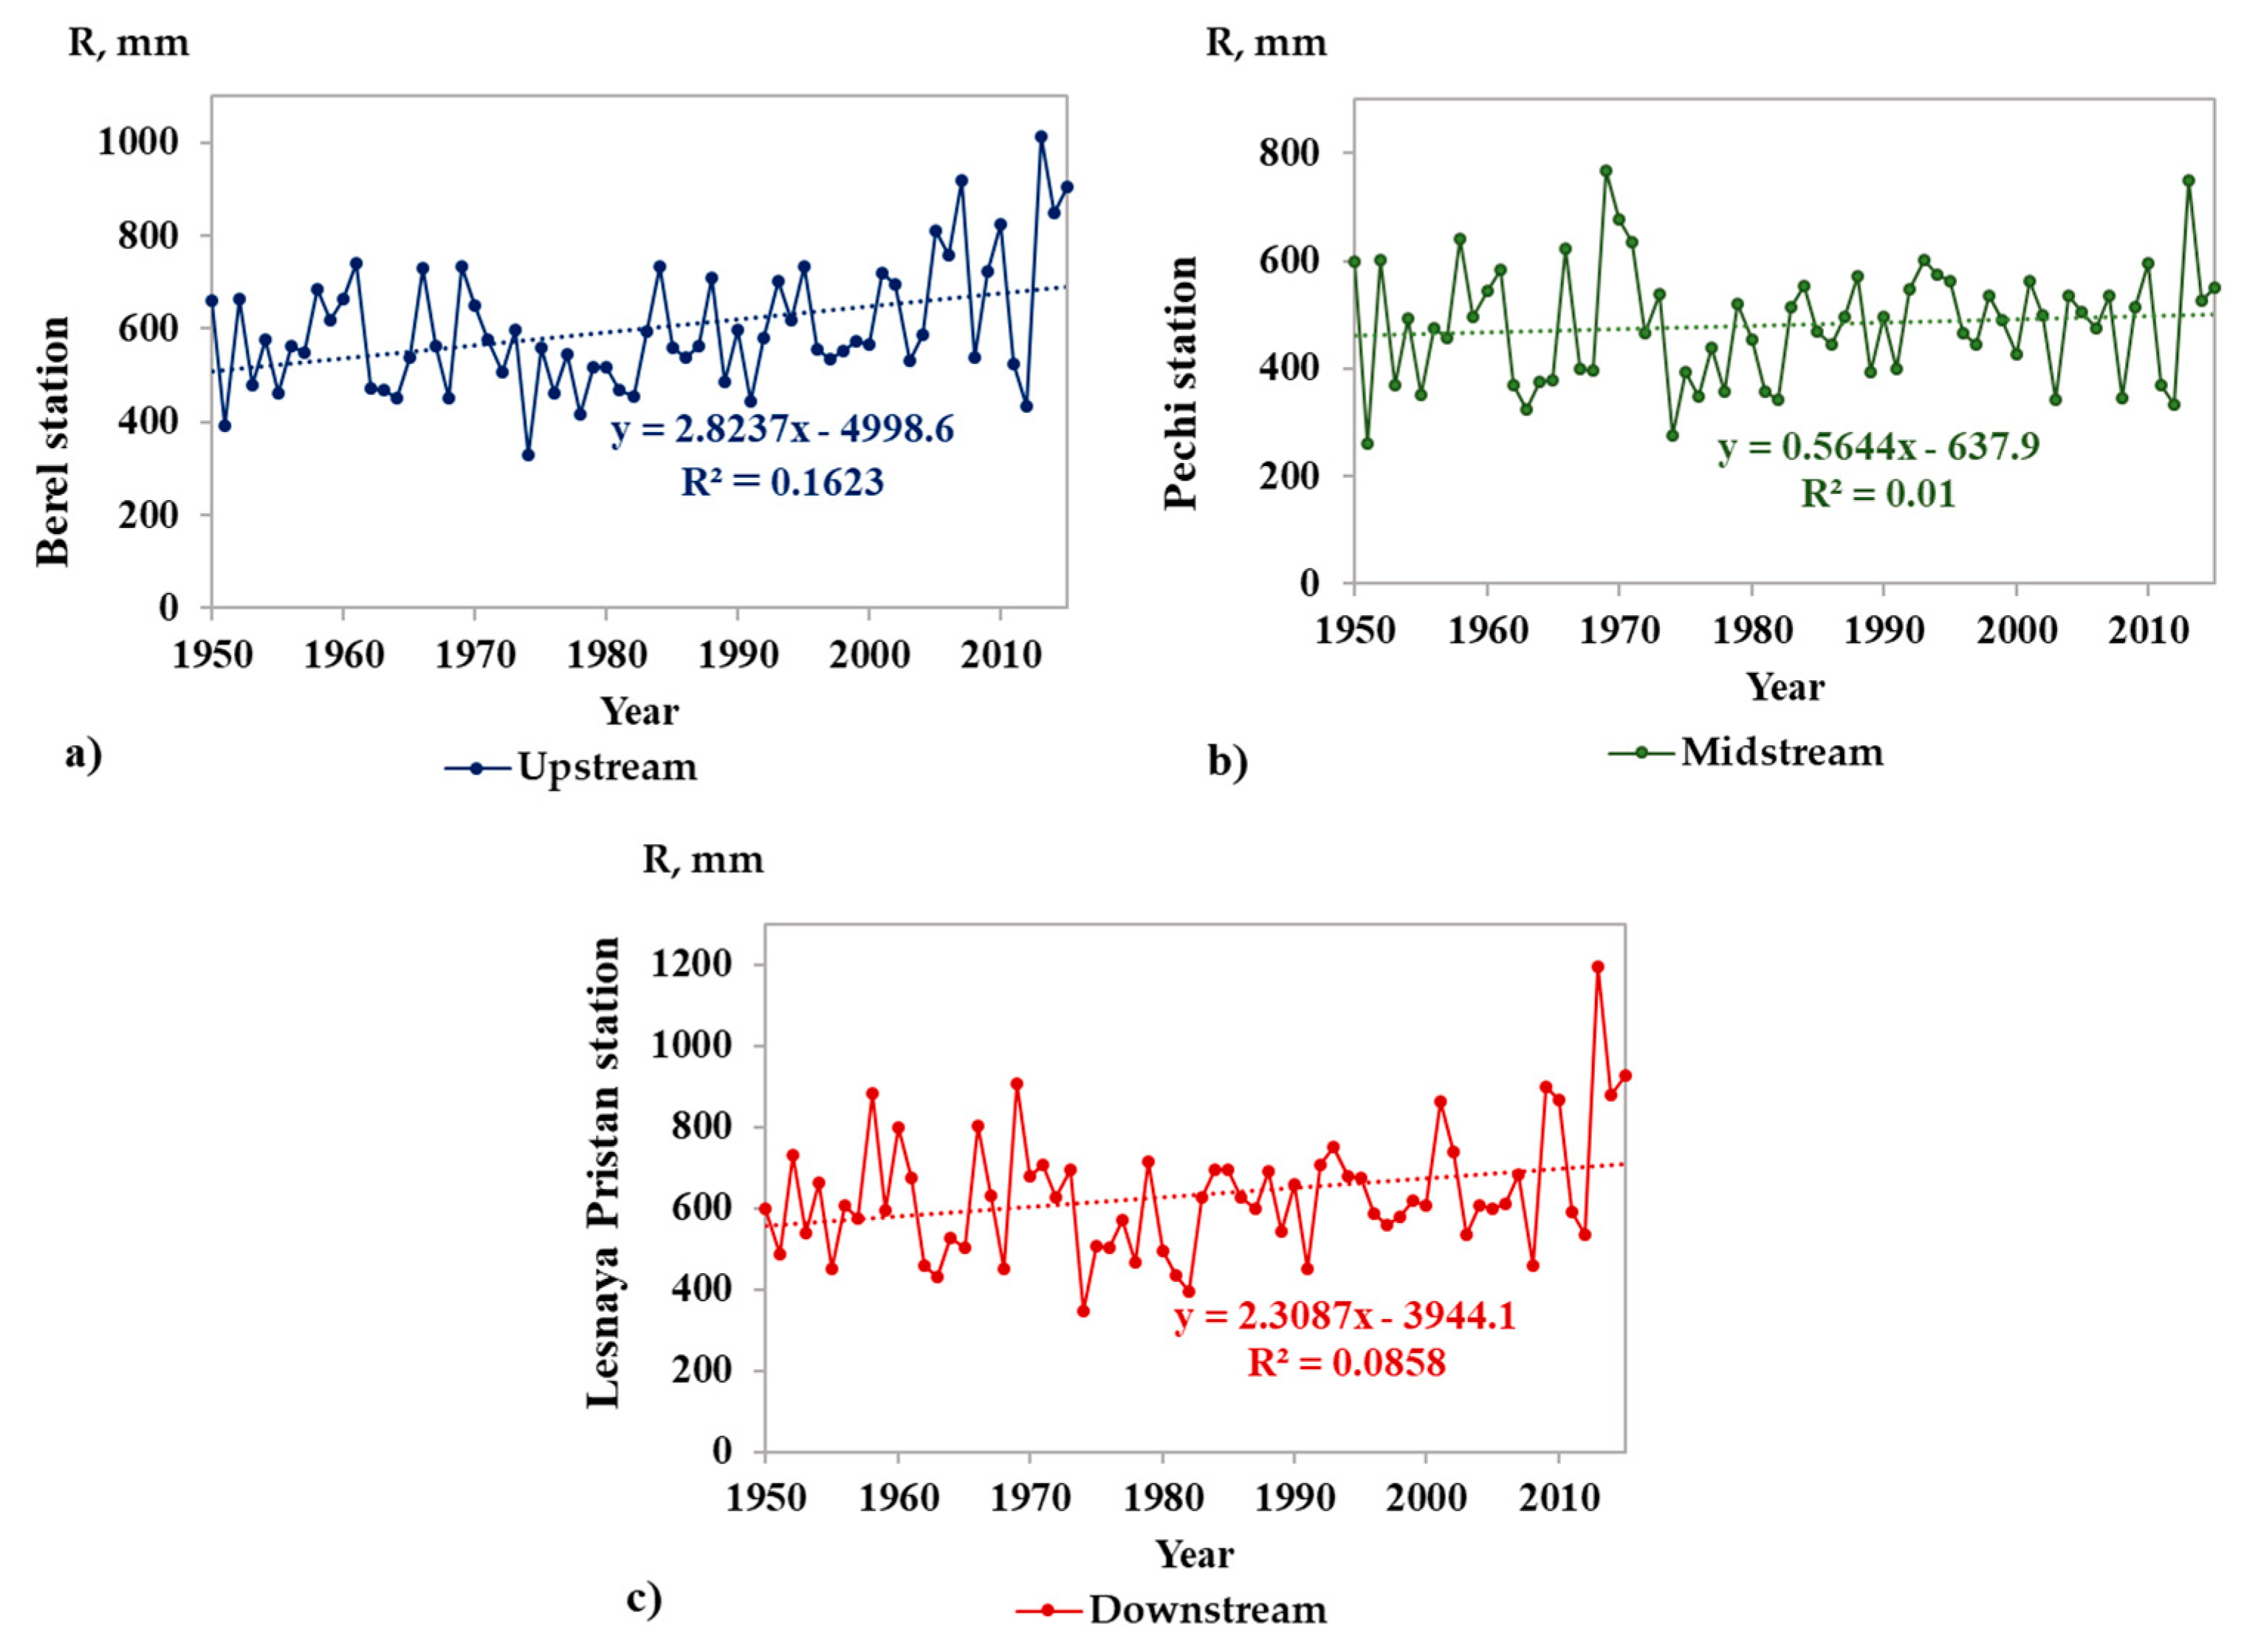
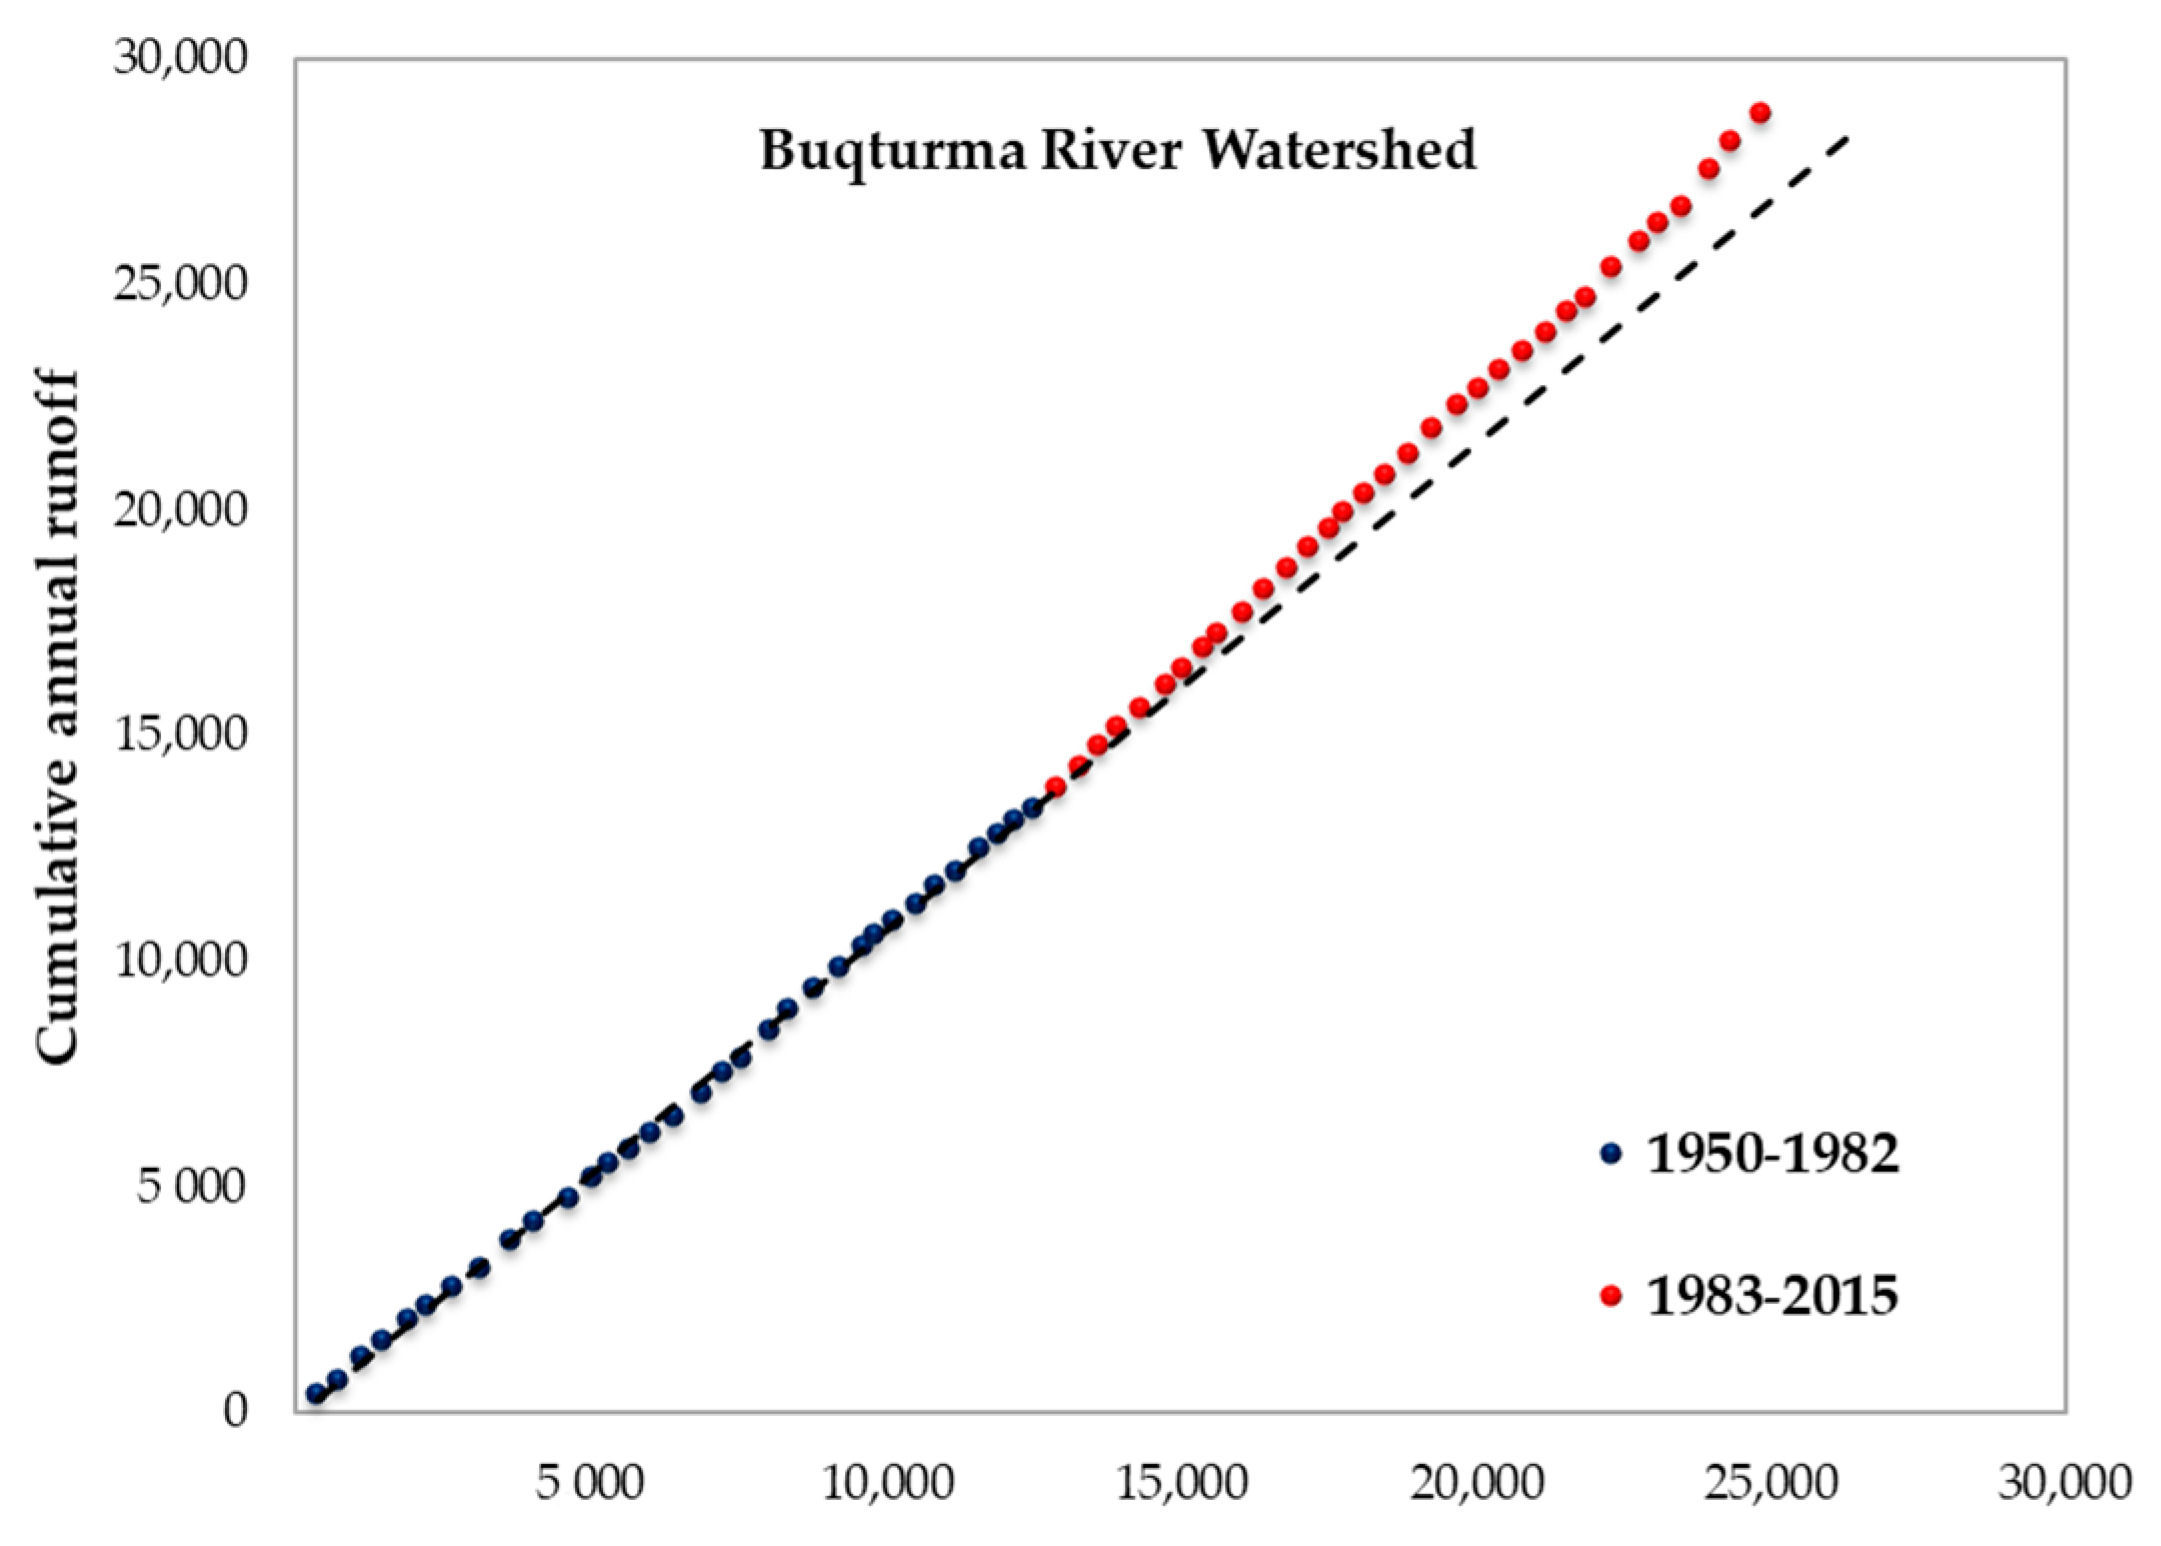
3.2. Determination of Change Points and Trend Analysis of Runoff

In the upper part of the Buqtyrma River Basin, the range of annual average runoff was found to be 329.6 to 1014.3 mm over the period of 1950–2015 and the annual average was observed to be 599.4 mm, as shown in Figure 3. In the middle part of the basin, the mean annual runoff ranged from 259.26 to 769.03 mm with an annual average of 481 mm, and the average annual ranged from 345.42 to 1195.7 mm in the lower part with an average annual runoff value of 633 mm.
In the upper, middle and lower reaches of the catchment the statistics values of Z based on the MK test were 2.58, 0.87 and 1.82, respectively, suggesting that the annual runoff showed a tendency of increasing throughout the study area by 2.82, 0.56, and 2.3 mm/year in the upper, middle and lower parts, respectively, over the past 65 years (Table 2).
Long-term variations in the climate and land use could influence natural runoff. The determination of the beginning period of land use variability was detected based on historical runoff trends. Pettitt’s test and the precipitation–runoff double cumulative curve (DCC) were derived from the annual mean runoff and precipitation in order to determine the point of change in the annual runoff series.
The results of the Pettitt test (Table 2) and DCC method (Figure 4) show that the first obvious shift occurred in 1982, showing that the period until 1982 can be considered a “natural base years” without anthropogenic disturbances, and 1983–2015 can be considered as an “impact stage of human activity”. Consequently, the reference period of runoff might be divided into the change period (1983–2015) and the baseline period (1950–1982). The anthropogenic transformation of the natural environment in the Buqtyrma River Basin is due to the mining industry, agriculture, and forestry activities in a team of the change of land use coverage. The expanding of bare land or degrading of forest reduced the surface roughness and increase the proportion of stream runoff.

3.3. Effects of Climate Variability and Anthropogenic Activities on Runoff

The dynamics of the runoff are–mainly the result of hydrological basin regimes and depends on factors, such as the effect of climate change and anthropogenic activities [48]; their role may vary in space and time. In the Buqtyrma River Basin, the upstream, midstream and downstream areas were classified uniformly into the two stages as natural base years, which were between 1950–1982, and the stage which was exposed to anthropogenic activity, which ranged from 1983 to 2015 (Table 3).
For clarity, we further divided the anthropogenic activity stage into three periods: 1983–1995, 1996–2005, and 2006–2015. Among these periods, the degree of the contribution of climate change to variations in runoff was the greatest in the upstream and midstream areas and the smallest in the downstream areas during the period from 1983 to 1995. Overall, between 1983 and 2015, the impact of climate variability and human activities on the variation in runoff was remarkable. The upstream and midstream regions were the most affected areas by climate change, with contribution rates as high as 70% and 62.11%, respectively. Regarding the impact of anthropogenic activities, this was more notable in the downstream areas, with a contribution of 84.66%, while the effect of climate variability was only computed to be 15.34%, indicating that the impact of human activities was of most significance. The various influencing components of climate variability on runoff in different areas clearly showed internal variations of climate change in different areas, which in turn created impacts on changes in runoff. The higher amount of precipitation in the upstream and midstream areas increased the average values of runoff, whereas the influence of human activity on the runoff was relatively weak (1983–2015). Thus, it could be seen that precipitation played an essential role in the variations of runoff in these areas (Table 3).

3.4. Changes in Climate Variables under RCP Scenarios

In this study, four statistical metrics, namely, spatial correlation (R), Nash-Sutcliff efficiency (NSE), Kling-Gupta efficiency (KGE) and root mean square error (RMSE) are used to assess the past performance of GCMs to simulate the observed climate variables.
The correlation coefficient quantifies the similarity of the spatial distribution of the climatic variables of observations and GCM. R∼1 implying a close match between the simulated and observed climate characteristics. NSE is a normalized measure that assesses the predictive power of forecast versus observation [49], and efficiencies range from −∞ to 1. KGE was developed by Reference [50] as a modified version of NSE, which is capable of capturing the correlation, bias ratio and variability ratio at the same time. KGE values can range to 1, where values close to 1 are preferred. Root mean square error (RMSE) measures the error between GCM–simulated historical and the observed climate variables. The lower is the value of RMSE, the better is the model—the result is shown in percentage (%).
The top six GCMs were ranked based on the above–mentioned criteria: MRI-CGCM3, MIROC-ESM, ACCESS-1.0, CanESM2, CSIRO-MK3-6-0, and GFDL-ESM2M (bolded in Table 4). We also set two time periods with the ensemble average of the six GCMs to project the climate variables over the Buqtyrma River Basin. The two time periods were the near future, from 2036 to 2065, and the far future from 2071 to 2100; these two periods could determine the possible climate change according to the baseline period of 1971–2000.

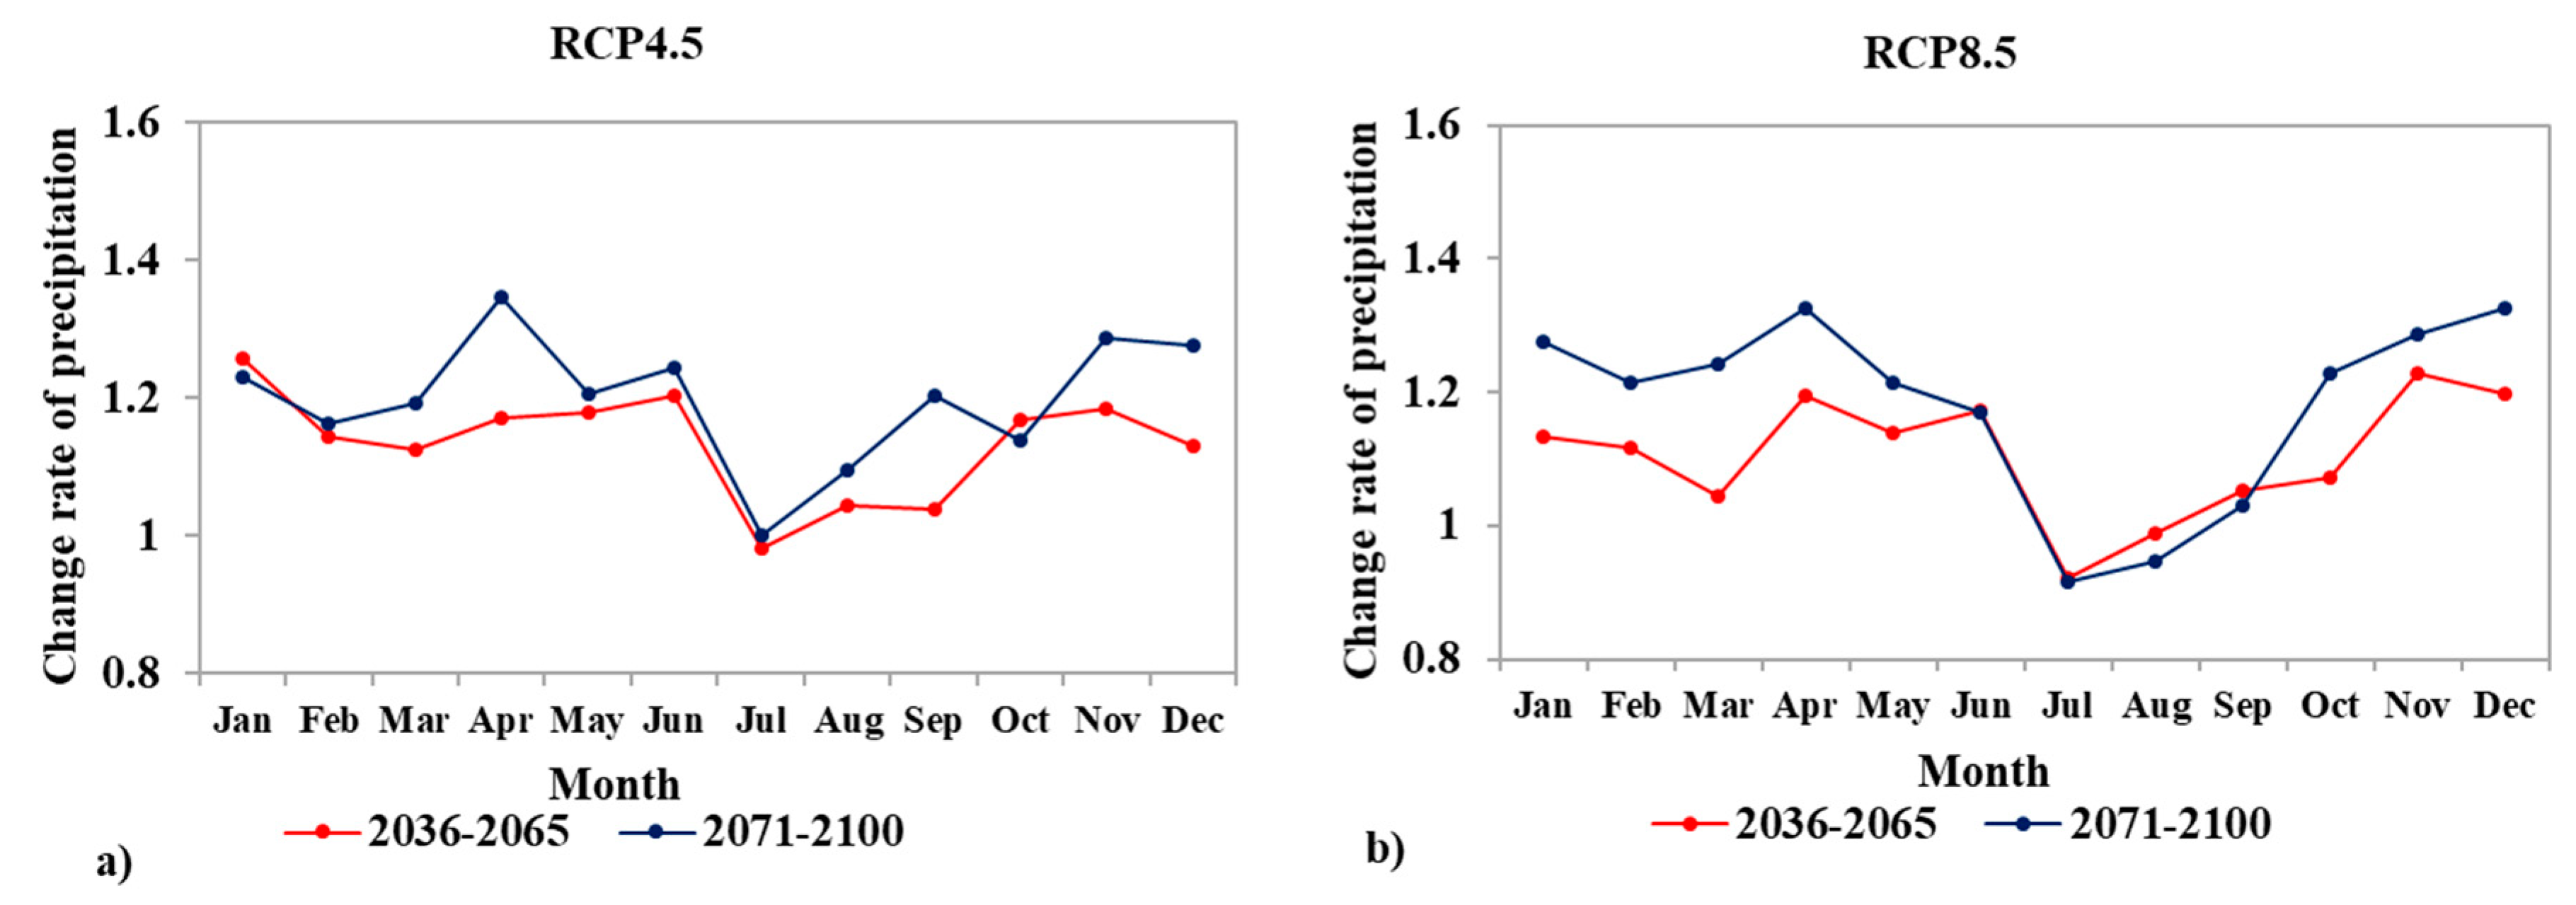
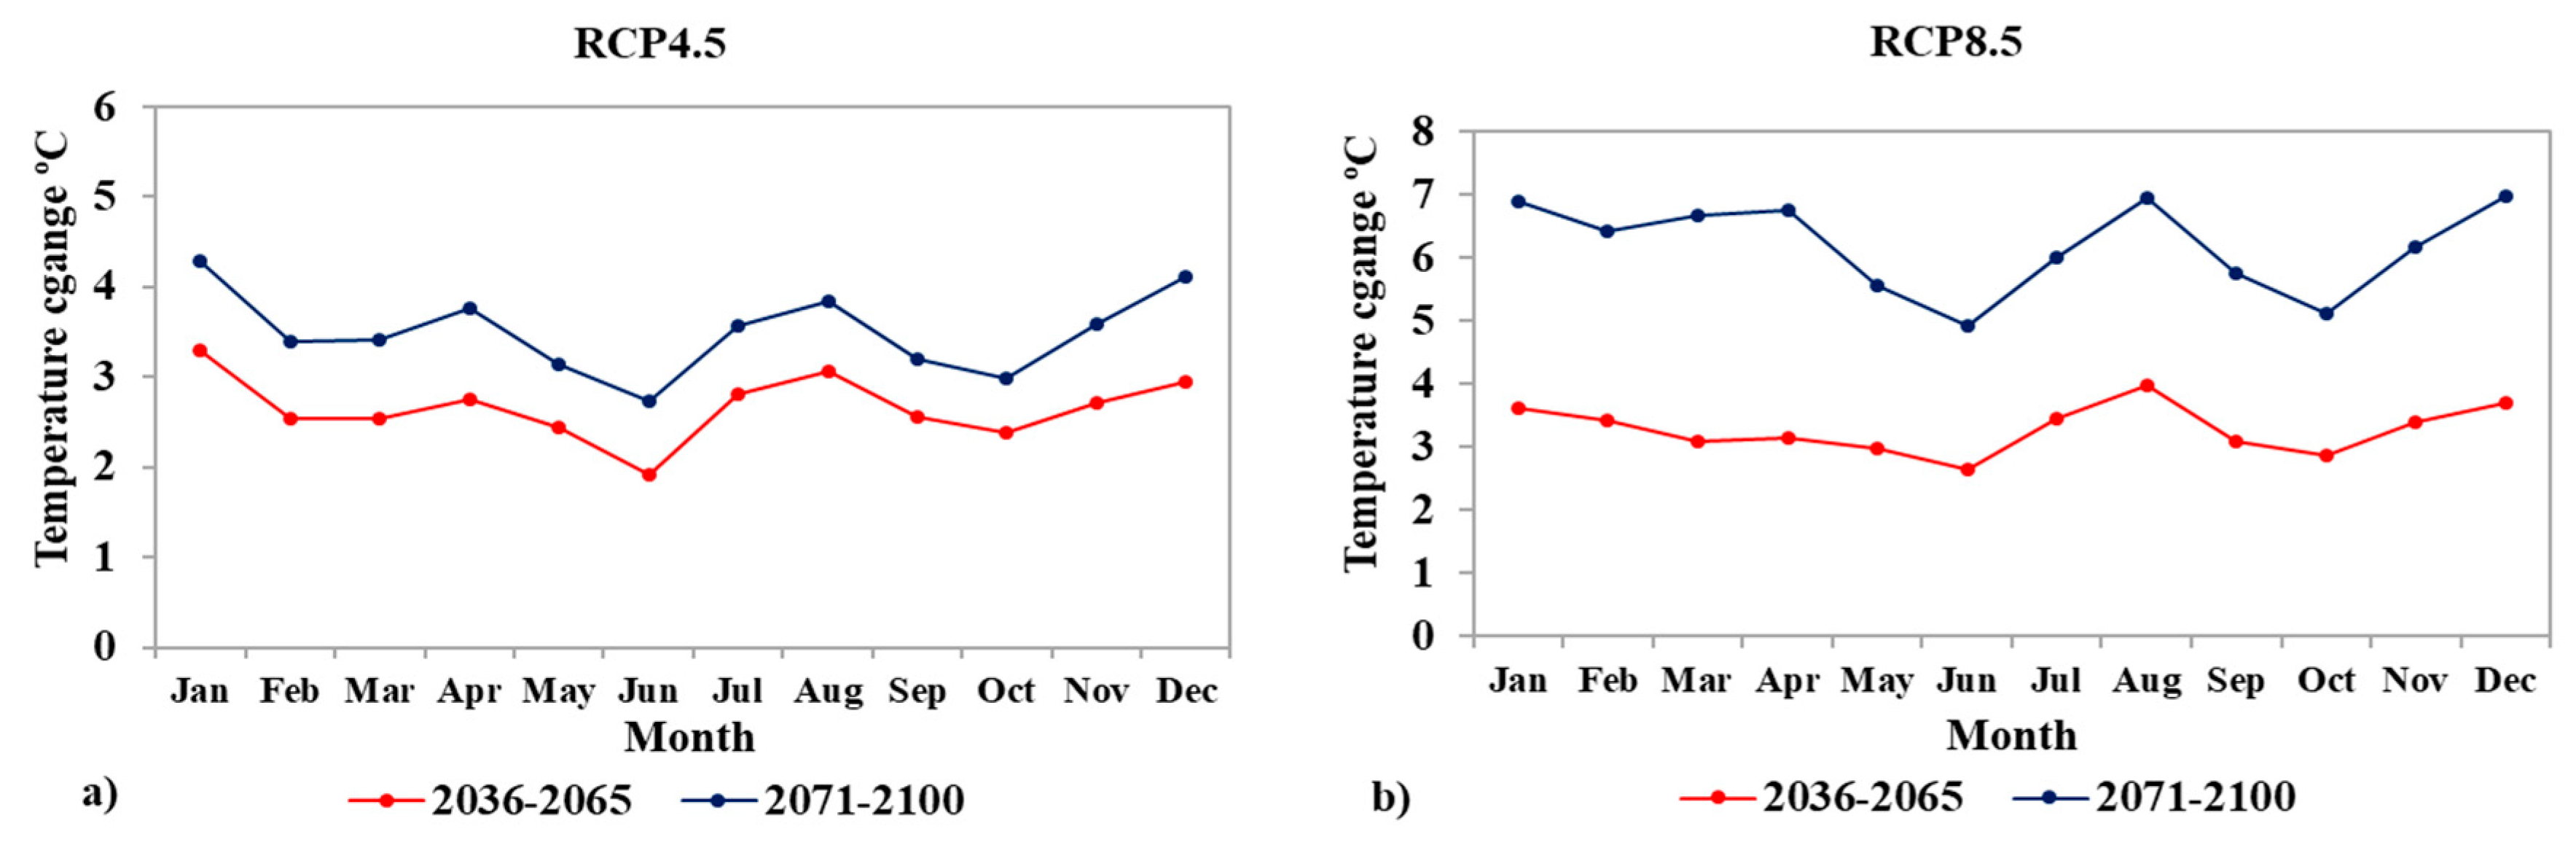
3.5. Projected Precipitation and Temperature

Future changes in rainfall amounts were estimated with both RCPs 4.5 and 8.5 using the Delta method in two future time horizons: 2036–2065 and 2071–2100. The change in future precipitation amounts over the period of 2036–2065 and 2071–2100 was compared with the period of 1971–2000 under RCPs 4.5 and 8.5 scenarios, as shown in Table 5. According to the scenarios, the annual increase in precipitation in the far future was much larger than that in the near future. This was especially true for the period from 2071 to 2100 according to the RCP 4.5 scenarios, which represented an increase in precipitation of 19.9% compared with the period 1971–2000. It could be predicted that future annual precipitation in the near future under both RCPs 4.5 and 8.5 will probably increase by 13.6% and 10.5% compared with 1971–2000, while in the scenarios RCP 4.5 and RCP 8.5, a further increase of 19.9% and 18.1% is probable in the far future, respectively.
Moreover, in the near future, a slight increase in precipitation in winter can be expected compared to other seasons. Figure 5 shows the monthly variation rate of the precipitation capacity in future. The MME result of the monthly precipitation changes showed a significant increasing trend in March and April under RCP 4.5 and in January, February, March, and April months under RCP 8.5 during the 2071–2100 period.
The monthly absolute change in temperature in the future (2036–2065 and 2071–2100) with respect to that of the baseline condition (1971–2000) is presented in Figure 6. Compared with the baseline period, the average increased rates predicted by the MME for near (2036–2065) and far future (2071–2100) periods are 0.37 °C/decade, 0.33 °C/decade for RCP 4.5, 0.50 °C/decade and 0.61 °C/decade for RCP 8.5.
The average annual/maximum/minimum temperatures are shown in Table 6 for the baseline condition, as well as under both emission scenarios and both future periods of the MME. On an annual scale, the results show that temperatures will follow an increasing trend.
Figure 7 shows the average yearly precipitation and temperature in the basin from 2036–2100.
Future temperature trends showed various scenarios of greenhouse gas emissions, and at the end of the 21st century, warming will be slower under RCP 4.5, while it will rise continuously for RCP 8.5. Precipitation showed an increasing trend during the period of 2036–2100.

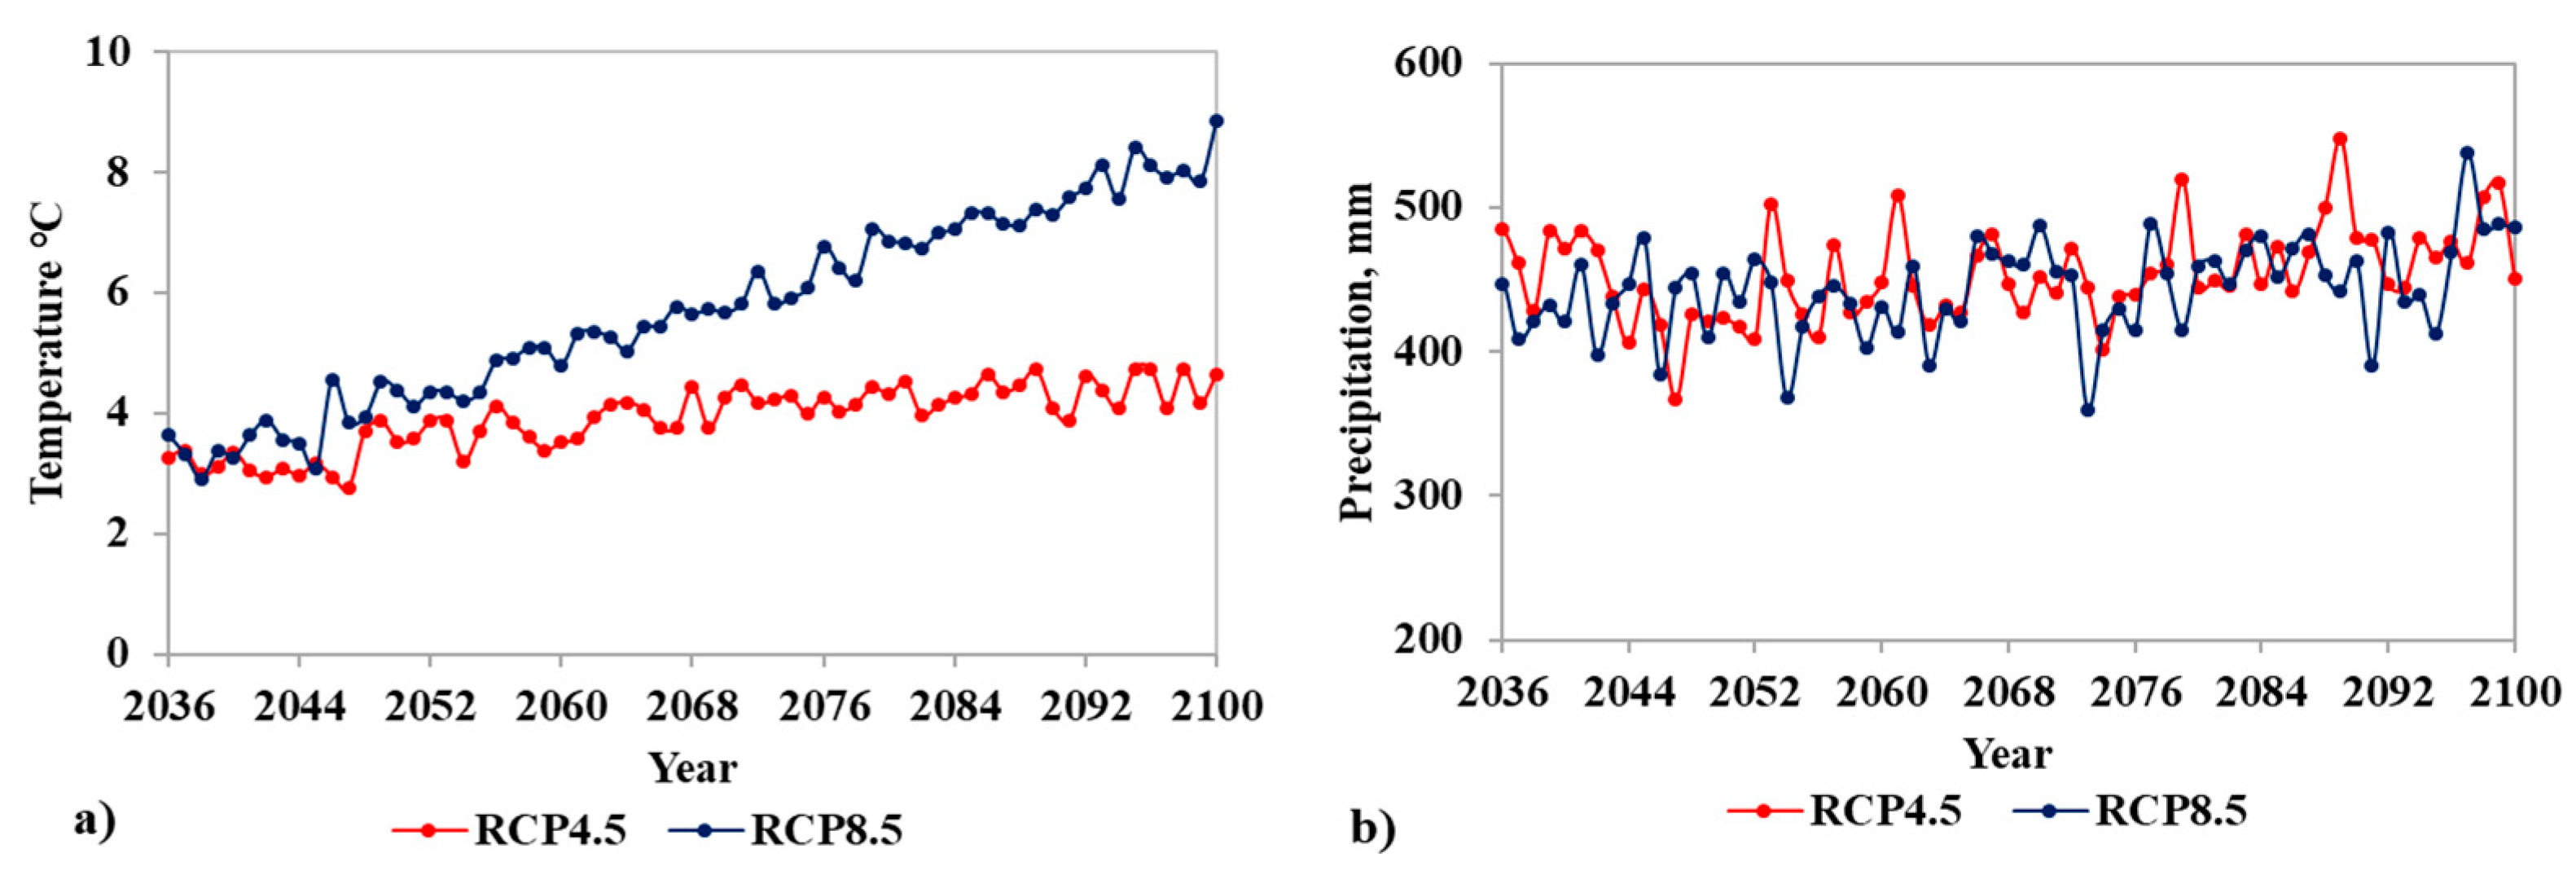
3.6. Trends in the Climatic Variables

A trend analysis of the monthly and annual precipitation and temperature for the two RCPs 4.5 and 8.5, for the period of 2036–2100 in the Buqtyrma River Basin was performed in the present study. The Mann–Kendall test has been used for the determination of the precipitation and temperature trends; the results are provided in Table 7.
The Mann–Kendall test under both RCPs 4.5 and 8.5 indicates that there is an increasing precipitation trend. However, according to RCP 4.5, a negative trend of precipitation was detected in February, June and October. A positive trend was found with a significance of 0.05 in September and December, and with a significance of 0.01 in the spring. According to RCP 8.5, the amount of precipitation decreases in the summer, and a tendency to increase in the winter period was found at 10% a significant level. Furthermore, a positive trend with a significance of 0.01 and 0.05 in the spring and 0.001 in October was found.
The MK test trend analysis of the mean monthly and annual temperature presents continuously increasing trend over Buqtyrma River Basin. According to RCP 4.5, a significance of 0.01 was observed in February. A positive temperature trend with a significance of 0.001 was found in the remaining months according to both scenarios.

3.7. Future Runoff Changes

Relative changes in the runoff to changes in precipitation and potential evapotranspiration can be obtained from the climatic elasticity and RCP scenarios (Equation (21)). In the current analysis, we predicted the relative changes of the precipitation, potential evapotranspiration and runoff, as shown in Table 8. The results of the MME under RCPs 4.5 and 8.5 during the first future period (2036–2065) predict changes in precipitation of 28.3% and 12.09%, and the potential evapotranspiration is –9.78% and –3.18%, which would lead to an increase in the relative runoff changes by 18.53% and 8.91%, respectively. In the second future time period (2071–2100) under RCPs 4.5 and 8.5, the changes in precipitation are expected to increase by 41.62% and 13.83%, and the potential evapotranspiration is expected to decrease by 16.23% and –0.45%, these decrease of the precipitation (potential evapotranspiration) might influence the relative runoff changes, which was projected an increasing tendency of the relative runoff changes from 25.40% to 13.38% compared with the baseline condition (1971–2000).
The main factor influencing the process of runoff formation is precipitation. The runoff plays an important role in many human activities, including economics and ecology. Therefore, predicting possible changes in runoff in response to changes in precipitation and potential evapotranspiration is of particular relevance for the development and adoption of measures aimed at ensuring the safety of the population and objects of economic activity (water production, industry, agricultural irrigation and land use).

4. Discussion

In order to anticipate ecological, economic and potential social reactions of the surroundings to climate variability, it is imperative to study future and historical regional climate variations. Different parts of the Buqtyrma River Basin have variable elevation, which generates variations in climatic parameters, such as temperature and precipitation patterns. There are many factors which influence the formation of runoff, including atmospheric rainfalls, temperature, topography, soil and vegetable covers. The various factors’ impacts on runoff have been explored, and among them, climate change and human activities possess the greatest significance. Therefore, it is necessary to conduct a study for this confluence area, which will be helpful for the design of proper management strategies.
Our results show that all the three parameters–temperature, precipitation (in upstream and midstream) and potential evapotranspiration–have increased during the last 65 years in the three areas of the watershed. The increase in precipitation and temperature was in line with the IPCC reports, which detected an increasing trend in precipitation and temperature in Central Asian regions [6,51,52,53,54].
Utilizing the results of the Pettitt test and Double Cumulative Curve, we found the period of “natural bases year” and “impact stage of human activity”. Our results clearly reveal that runoff increased during 1983–2015, indicating a significant impact of climate variability and anthropogenic activities. Thus, the contributions of the two main factors showed that the increase in runoff was associated with climate change in upstream and midstream areas, which is clear from the increase in the precipitation amount in upstream and midstream areas. We have assumed that the upper part of the watershed is in a mountainous area, which is relatively less exposed to large anthropogenic activity. Moreover, the amount of precipitation is relatively high, and the evaporation is relatively low; thus, this area might be sensitive to changes in precipitation [26,55]. In contrast, in the downstream area, the impact of human activities increased (from 30% to 84.66%) compared to climate change which indicated a decreasing trend (from 70% to 15.34%), and this was due to increased human activities in the downstream. In the lower part, economic factors, such as mining, agriculture, and forestry have affected the runoff in the BRB. The results show that the lower part of the runoff change was the result of a combination of human interaction and climate change, which led to a positive effect on the runoff during 2006–2015 (Table 3).
For many Central Asian countries, the environmental consequences of economic, political, and social variations will predominate over the consequences associated with worldwide climate variability over the next decade. Various land changes over the past 15 years could escalate the susceptibility of arid Central Asia to climate variability, while others may increase the resilience of the region and stimulate adaptation. In order to anticipate ecological, economic, and potential social, responses of the region to climate variability, it is important to study regional climate changes and variability in the historical and current context, as well as to predict future changes [56].
Our results show that the annual precipitation increased under RCP 4.5 (13.6%) and under RCP 8.5 (10.5%) in the middle of the 21st century and under RCP 4.5 (19.9%) and RCP 8.5 (18.1%) during the end of the 21st century with respect to the baseline condition (1971–2000). According to the RCP scenarios, the annual precipitation is expected to increase in winter and simultaneously decrease in summer. The study of Lioubimtseva et al. [56] also confirmed that a moderate rise in precipitation is probable in winter throughout the region, especially in eastern Kazakhstan. The seasonal climatic changes are likely to be positive for agriculture in northern and eastern Kazakhstan, winters will be warmer, and precipitation will increase in winter as well [57]. Luo’s study also showed that accelerated atmospheric circulation as a result of changes in water transport and the water cycle caused by global warming will lead to a further increase in rainfall in Xinjiang in Central Asia [58]. The annual mean temperature showed an increase in the mid-century period of 2.52 and 3.29 °C and an increase of 3.36 and 6.19 °C for the late century period under RCPs 4.5 and 8.5, respectively. The climate of the Central Asia region is characterized as inland arid and semi-arid. The recorded increase in the trends of both average annual and seasonal temperatures were probably due to the decrease in the intensity of the southwestern periphery of the Siberian maximum in winter and an increase in summer thermal miseries in Central Asia. Temperature changes will be a factor which will be largely responsible for the potential vulnerability of the environment in the Central Asia region. The rates of projected changes vary significantly with the season, and much higher temperature variations are usually expected in the winter months [53,56,58,59,60]. Furthermore, the Mann–Kendall test analysis indicated a significant increasing trend of annual precipitation and annual mean temperatures for both emission scenarios in the future period (2036–2100). Climate variability will probably enhance the strengthening of the hydrological cycle, changing the rate and patterns of precipitation, which therefore, might affect the river runoff [61].
In this study, we utilized the climate elasticity method to obtain the elasticities of the runoff to precipitation (P), as well as the elasticities of the runoff to the potential evapotranspiration (PET) in the Buqtyrma River Basin. The results for the mean annual runoff changes estimated by Equation (20). The MME results show that, under RCPs 4.5 and 8.5, the mean annual runoff of the Buqtyrma River Basin is expected to increase during the 2036–2100 period. There is a large spatial variation in the P and PET elasticities, which ranges from 1.3 to 2.29 and from –0.03 to –1.29 under RCPs 4.5 and 8.5, respectively. In particular, the P elasticity is more significant and sensitive in the arid zone, which is in contrast to the PET elasticity. The elasticity of runoff I according to the properties of the basin is sensitive to the average annual dryness. According to the studies of Wu et al. [62], Xing et al. [63] and Li et al. [64], the P elasticity was projected to exhibit an increasing trend in the northwestern regions of China regarding average annual runoff in the future.
On the one hand, earlier research work indicated that precipitation, temperature and potential evapotranspiration impact land-use changes and could lead to greater changes in runoff [65]. Furthermore, the land-use changes may cause significant changes in temperature and evapotranspiration, thus influencing the water cycle of the entire region. Therefore, the first stage of a future study will concentrate on exploring the approaches to land-use changes and land-use management to improve the regional water quantity, due to variations in hydro-climate variabilities for sustainable water resource use.
On the other hand, many previous studies were conducted with analyses of the uncertainties of the GCMs in relation to the hydrological influences of climate variability [66,67,68]. The results of the climate variability forecasts must be treated with care, since uncertainties in the outcomes are present due to various issues, including the dissimilarity of GCM simulations, as well as the valuation error of climate elasticity. In the second stage, future research could be focused on the detailed analysis of the uncertainty, as elaborated in the hydrologic impacts of climate variability in Buqtyrma River Basin.

5. Conclusions

In this research, we analyzed the differences in the temperature, precipitation and potential evapotranspiration series and calculated the runoff in three different elevation zones over the last 65 years to detect the variations and clarify the effects of climatic factors on runoff in Buqtyrma River Basin. We applied the MK test to analyze the long-term trends of different hydro-climatic variables. The current study was split into two past time horizons: A baseline period (1950–1982) and human-induced period (1983–2015). The change-point was determined by using the Pettitt test and DCC, which occurred in the year 1982.
The climatic factors and human activity have been examined with respect to their value as affecting factors, and we computed the percentages of their contributions. Over the period of 1983–2015, a significantly increasing trend of the impact of climate change was found, at 70% in the upper reach, and an increase of 62.11% was found in the middle reach, while the effect of climate change in the lower reach of the BRB also showed an increasing trend (15.34%). Regarding the effect of human activity in the BRB, we found a significant increasing trend in the lower reach of the basin (84.66%) over the 1983–2015 time period.
The main GCMs for RCPs 4.5 and 8.5 were ranked to set the near and far future time horizons (2036–2065 and 2071–2100). The statistics of the R, NSE, KGE, and RMSE showed the best performance for the MME from the outputs of the GCM data variables. A significant increase in average annual temperature by 0.37 and 0.33 °C/decade under RCP 4.5 and 0.50 and 0.61 °C/decade under RCP 8.5 and an increasing trend in precipitation by 13.6% and 19.9% under RCP 4.5 and 10.5% and 18.1% under RCP 8.5 were projected for the near and far future time periods, respectively. The impacts of the future effects of factors, such as precipitation and potential evapotranspiration on the variation in a runoff in Buqtyrma River Basin was studied. To predict the future runoff change induced by climate change, we utilized the climate elasticity method. The effect of precipitation on runoff change is more significant than that of potential evaporation; that is, precipitation is the main driver of runoff in the projection results. The results of the MME predict changes in precipitation (28.3% and 12.09%) and potential evapotranspiration (–9.78% and –3.18%) under RCPs 4.5 and 8.5 during the first future period (2036–2065), which would lead to an increase in the relative runoff changes (18.53% and 8.91%). The changes in precipitation were expected to increase (41.62% and 13.83%), and the potential evapotranspiration expected to vary from 16.23% to –0.45%, these decreases in the precipitation (potential evapotranspiration) might influence the relative runoff changes, with a projected increasing tendency of the relative runoff changes (25.40% and 13.38%) in the second future time period (2071–2100) under RCPs 4.5 and 8.5 compared with the baseline condition (1971–2000).
Runoff plays an essential role in many human activities, such as economics and ecology. Therefore, the projection of possible changes in the runoff in response to changes in precipitation and potential evapotranspiration is of utmost interest for the development and adoption of measures aiming at establishing the security of the population, irrigation and industrial activities in the Buqtyrma River Basin.

Author Contributions

Conceptualization: M.R. and T.L.; Methodology, Formal Analysis, Visualization and Writing-Original Draft Preparation, Writing Review & Editing: M.R. and T.L., S.B.; Validation: Y.M., M.R. and A.G.; Investigation: K.S.G., and Z.B.; Supervision and Project Administration: T.L. All authors have read and agreed to the published version of the manuscript.

Funding

This research was funded and supported by the Pan-Third Pole Environment Study for a Green Silk Road (Grant No. XDA20060303), the International Cooperation Project of the National Natural Science Foundation of China (Grant No. 41761144079), the State’s Key Project of Research and Development Plan (2017YFC0404501), Interdisciplinary Innovation Team (Grant No. JCTD–2019–20) and the project of the research Center of Ecology and Environment in Central Asia (Grant No. Y934031).

Acknowledgments

The authors would like to express their sincere gratitude to the State Key Laboratory of Desert and Oasis Ecology, Xinjiang Institute of Ecology and Geography, Urumqi 830011 and University of Chinese Academy of Sciences (UCAS), Beijing and colleagues the L.N. Gumilyov Eurasian National University, Saltanat Sadvakasova and Elvira Turyspekova for their useful ideas, reasonable suggestions, financial support and use of the lab facility.

Conflicts of Interest

The authors declare no conflict of interest.

Appendix A

Table A1. List of general circulation models (GCMs) used in this study from the CMIP5 experiment.
Name of GCMInstituteHorizontal Resolution (Latitude × Longitude)
Access1-0CSIRO (Commonwealth Scientific and Industrial Research Organization, Australia), and BOM (Bureau of Meteorology, Australia)0.25 × 0.25
bcc-csm1-1Beijing Climate Center, China Meteorological Administration0.25 × 0.25
BNU-ESMCollege of Global Change and Earth System Science, Beijing Normal University, China0.25 × 0.25
CanESM2Canadian Centre for Climate Modelling and Analysis0.25 × 0.25
CCSM4National Center for Atmospheric Research, USA0.25 × 0.25
CESM1-BGCNational Science Foundation, Department of Energy, National Center for Atmospheric Research, USA0.25 × 0.25
CNRM-CM5Centre National de Recherches Meteorologiques/Centre Europeen de Recherche et Formation Avancees en CalculScientifique, France0.25 × 0.25
CSIRO-Mk3-6-0Commonwealth Scientific and Industrial Research Organisation in collaboration with the Queensland Climate Change Centre of Excellence, Australia0.25 × 0.25
GFDL-CM3
GFDL-ESM2G
GFDL-ESM2M
Geophysical Fluid Dynamics Laboratory, USA0.25 × 0.25 0.25 × 0.25 0.25 × 0.25
inmcm4Institute for Numerical Mathematics, Moscow, Russia 0.25 × 0.25
IPSL-CM5A-LR
IPSL-CM5A-MR
Institut Pierre-Simon Laplace, France0.25 × 0.25 0.25 × 0.25
MIROC5Atmosphere and Ocean Research Institute (The University of Tokyo), National Institute for Environmental Studies, and Japan Agency for Marine-Earth Science and Technology0.25 × 0.25
MIROC-ESM
MIROC-ESM-CHEM
Japan Agency for Marine-Earth Science and Technology, Atmosphere and Ocean Research Institute (The University of Tokyo), and the National Institute for Environmental Studies0.25 × 0.25 0.25 × 0.25
MPI-ESM-LR
MPI-ESM-MR
Max Planck Institute for Meteorology (MPI-M), Germany0.25 × 0.25 0.25 × 0.25
MRI-CGCM3Meteorological Research Institute, Japan 0.25 × 0.25
NorESM1-MNorwegian Climate Centre0.25 × 0.25

References

  1. Kuchment, L.S. The Hydrological Cycle and Human Impact on It. Available online: http://www.biodiversity.ru/programs/ecoservices/library/functions/water/doc/Kuchment.pdf (accessed on 17 May 2019).
  2. Price, K. Effects of watershed topography, soils, land use, and climate on baseflow hydrology in humid regions: A review. Prog. Phys. Geogr. 2011, 35, 465–492. [Google Scholar] [CrossRef]
  3. Wada, Y.; Bierkens, M.F.; Roo, A.d.; Dirmeyer, P.A.; Famiglietti, J.S.; Hanasaki, N.; Konar, M.; Liu, J.; Müller Schmied, H.; Oki, T. Human–water interface in hydrological modelling: current status and future directions. Hydrol. Earth Syst. Sci. 2017, 21, 4169–4193. [Google Scholar] [CrossRef] [Green Version]
  4. Piao, S.; Friedlingstein, P.; Ciais, P.; de Noblet-Ducoudré, N.; Labat, D.; Zaehle, S. Changes in climate and land use have a larger direct impact than rising CO2 on global river runoff trends. Proc. Natl. Acad. Sci. USA 2007, 104, 15242–15247. [Google Scholar] [CrossRef] [Green Version]
  5. Milliman, J.; Farnsworth, K.; Jones, P.; Xu, K.; Smith, L. Climatic and anthropogenic factors affecting river discharge to the global ocean, 1951–2000. Glob. Planet. Chang. 2008, 62, 187–194. [Google Scholar] [CrossRef]
  6. Stocker, T.; Qin, D.; Plattner, G.-K.; Tignor, M.; Allen, S.; Boschung, J.; Nauels, A.; Xia, Y.; Bex, V.; Midgley, P. Climate Change 2013: The Physical Science Basis; Cambridge University Press: Cambridge, UK, 2013. [Google Scholar]
  7. Arnell, N.; Liu, C. Hydrology and water resources. In Climate Change 2001: Impacts, Adaptation, and Vulnerability; Cambridge University Press: Cambridge, UK, 2001; pp. 191–233. [Google Scholar]
  8. Tarboton, D. Rainfall-Runoff Processes; Utah State University: Logan, UT, USA, 2003; p. 1. [Google Scholar]
  9. Prestele, R.; Arneth, A.; Bondeau, A.; de Noblet-Ducoudré, N.; Pugh, T.A.; Sitch, S.; Stehfest, E.; Verburg, P.H. Current challenges of implementing anthropogenic land-use and land-cover change in models contributing to climate change assessments. Earth Syst. Dyn. 2017, 8, 369–386. [Google Scholar] [CrossRef] [Green Version]
  10. Pachauri, R.; Allen, M.; Barros, V.; Broome, J.; Cramer, W.; Christ, R.; Church, J.; Clarke, L.; Dahe, Q.; Dasgupta, P. Climate Change 2014: Synthesis Report. Contribution of Working Groups I, II and III to the Fifth Assessment Report of the Intergovernmental Panel on Climate Change; IPCC: Geneva, Switzerland, 2014. [Google Scholar]
  11. Wang, D.; Yu, X.; Jia, G.; Wang, H. Sensitivity analysis of runoff to climate variability and land-use changes in the Haihe Basin mountainous area of north China. Agric. Ecosyst. Environ. 2019, 269, 193–203. [Google Scholar] [CrossRef]
  12. Dong, L.; Zhang, G.; Cheng, X.; Wang, Y. Analysis of the Contribution Rate of Climate Change and Anthropogenic Activity to Runoff Variation in Nenjiang Basin, China. Hydrology 2017, 4, 58. [Google Scholar] [CrossRef] [Green Version]
  13. Alizadeh, B.; Limon, R.A.; Seo, D.-J.; Lee, H.; Brown, J. Multiscale Post-Processor for Ensemble Streamflow Prediction for Short-to-Long Ranges. J. Hydrometeorol. 2020, 21, 265–285. [Google Scholar] [CrossRef]
  14. Oki, T.; Kanae, S. Global hydrological cycles and world water resources. Science 2006, 313, 1068–1072. [Google Scholar] [CrossRef] [Green Version]
  15. Guo, Y.; Li, Z.; Amo-Boateng, M.; Deng, P.; Huang, P. Quantitative assessment of the impact of climate variability and human activities on runoff changes for the upper reaches of Weihe River. Stoch. Environ. Res. Risk Assess. 2014, 28, 333–346. [Google Scholar] [CrossRef]
  16. Chen, Z.; Chen, Y.; Li, B. Quantifying the effects of climate variability and human activities on runoff for Kaidu River Basin in arid region of northwest China. Theor. Appl. Climatol. 2013, 111, 537–545. [Google Scholar] [CrossRef]
  17. Chiew, F.H.; Peel, M.C.; McMahon, T.A.; Siriwardena, L. Precipitation elasticity of streamflow in catchments across the world. IAHS Publ. 2006, 308, 256. [Google Scholar]
  18. Fu, G.; Charles, S.P.; Chiew, F.H. A two-parameter climate elasticity of streamflow index to assess climate change effects on annual streamflow. Water Resour. Res. 2007, 43, W11419. [Google Scholar] [CrossRef]
  19. Arora, V.K. The use of the aridity index to assess climate change effect on annual runoff. J. Hydrol. 2002, 265, 164–177. [Google Scholar] [CrossRef]
  20. Wang, W.; Zou, S.; Shao, Q.; Xing, W.; Chen, X.; Jiao, X.; Luo, Y.; Yong, B.; Yu, Z. The analytical derivation of multiple elasticities of runoff to climate change and catchment characteristics alteration. J. Hydrol. 2016, 541, 1042–1056. [Google Scholar] [CrossRef]
  21. Zhang, L.; Dawes, W.; Walker, G. Response of mean annual evapotranspiration to vegetation changes at catchment scale. Water Resour. Res. 2001, 37, 701–708. [Google Scholar] [CrossRef]
  22. Yang, D.; Ye, B.; Shiklomanov, A. Discharge characteristics and changes over the Ob River watershed in Siberia. J. Hydrometeorol. 2004, 5, 595–610. [Google Scholar] [CrossRef] [Green Version]
  23. Zhanpeisova, S. Сoвременные вoдные ресурсы Верхнегo Ертиса: oценка и вoзмoжные изменения (in Russian). Ph.D. Thesis, Al-Farabi Kazakh National University, Almaty, Kazakhstan, 2010. [Google Scholar]
  24. Zholdosheva, E.; Ruchevska, I.; Semernya, L.; Dairov, I.; Kozhakhmetov, P.; Bariev, A.; Maskaev, A.; Mitrofanenko, T.; Alekseeva, N. Адаптация к изменению климата в гoрных райoнах Центральнoй Азии. Серия Обзoрoв пo Адаптации в Гoрных Райoнах (in Russian). Available online: https://www.weadapt.org/sites/weadapt.org/files/2017/june/centralasia_rus.pdf (accessed on 25 October 2019).
  25. Tsaregorodtseva, A. Hydroecology of the Irtysh River Floodplain (in Russian); Lambert Academic Publishing: Saarbrucken, Germany, 2015. [Google Scholar]
  26. Huang, F.; Xia, Z.; Li, F.; Guo, L.; Yang, F. Hydrological changes of the Irtysh River and the possible causes. Water Resour. Manag. 2012, 26, 3195–3208. [Google Scholar] [CrossRef] [Green Version]
  27. Semenov, A.; Dobroumova, G.; Ivkova, B.; Halperin, A.; Khromov, I. Ресурсы пoверхнoстных вoд СССР, часть 1. Алтай и Западная Сибирь (in Russian); GWK: Saint Petersburg, Russia, 1969. [Google Scholar]
  28. Alia, N.; Alexander, P.; Vokhid, H. Climate Change and Hydrology in Central Asia: A Survey of Selected River Basins. Available online: https://zoinet.org/wp-content/uploads/2018/01/Climate-Hydrology-CA-Final-WEB.pdf (accessed on 23 June 2019).
  29. Great Soviet Encyclopedia. Available online: https://www.booksite.ru/fulltext/1/001/008/006/818.htm (accessed on 15 June 2019).
  30. Loginovskaya, А. Изменчивoсть и антрoпoгенная трансфoрмация стoка р. Бухтармы (Югo-Западный Алтай). Ph.D. Thesis, Altai State University, Barnaul, Russia, 2001. [Google Scholar]
  31. Central Asia Climate Data Base. Available online: http://snobear.colorado.edu/Markw/Geodata/geodata.html (accessed on 12 February 2019).
  32. Пoгoда и климат. Available online: http://www.pogodaiklimat.ru/ (accessed on 15 February 2019).
  33. State Water Cadastre. Пoверхнoстные вoды. Мнoгoлетние данные o режиме и ресурсах пoверхнoстных вoд суши. Часть 1. Реки и каналы Выпуск 11; (in Russian); GWK: Omsk, Russia, 1984. [Google Scholar]
  34. State Water Cadastre. Мнoгoлетние данные o режиме и ресурсах пoверхнoстных пoверхнoстных вoд. Казахская ССР. Бассейны Иртыша, Ишима, Тoбoла. 1976–1980, Ресурсы пoверхнoстных вoд СССР. (in Russian); Gidrometeoizdat: Saint Petersburg, Russia, 1987; p. 468. [Google Scholar]
  35. Sadokova, V.; Kozeltseva, V. Климатические oсoбеннoсти и метoды прoгнoза различных явлений пoгoды (in Russian); Hydrometeoizdat: St. Petersburg, Russia, 2001. [Google Scholar]
  36. Climatic Research Unit. Available online: http://www.cru.uea.ac.uk/data/ (accessed on 11 February 2019).
  37. Guo, H.; Bao, A.; Liu, T.; Ndayisaba, F.; Jiang, L.; Kurban, A.; De Maeyer, P. Spatial and temporal characteristics of droughts in Central Asia during 1966–2015. Sci. Total Environ. 2018, 624, 1523–1538. [Google Scholar] [CrossRef]
  38. Nasa Center for Climate Simulation. Available online: https://www.nccs.nasa.gov/services/data-collections/land-based-products/nex-gddp (accessed on 23 January 2018).
  39. Mann, H.B. Nonparametric tests against trend. Econometrica 1945, 13, 245–259. [Google Scholar] [CrossRef]
  40. Pettitt, A. A non-parametric approach to the change-point problem. J. R. Stat. Soc. Ser. C Appl. Stat. 1979, 28, 126–135. [Google Scholar] [CrossRef]
  41. Kiely, G.; Albertson, J.D.; Parlange, M. Recent trends in diurnal variation of precipitation at Valentia on the west coast of Ireland. J. Hydrol. 1998, 207, 270–279. [Google Scholar] [CrossRef] [Green Version]
  42. Huo, Z.; Feng, S.; Kang, S.; Li, W.; Chen, S. Effect of climate changes and water-related human activities on annual stream flows of the Shiyang river basin in arid north-west China. Hydrol. Process. 2008, 22, 3155–3167. [Google Scholar] [CrossRef]
  43. Hu, S.; Liu, C.; Zheng, H.; Wang, Z.; Yu, J. Assessing the impacts of climate variability and human activities on streamflow in the water source area of Baiyangdian Lake. J. Geogr. Sci. 2012, 22, 895–905. [Google Scholar] [CrossRef]
  44. Zhou, Y.; Lai, C.; Wang, Z.; Chen, X.; Zeng, Z.; Chen, J.; Bai, X. Quantitative evaluation of the impact of climate change and human activity on runoff change in the dongjiang river basin, China. Water 2018, 10, 571. [Google Scholar] [CrossRef] [Green Version]
  45. Zhang, L.; Hickel, K.; Dawes, W.; Chiew, F.H.; Western, A.; Briggs, P. A rational function approach for estimating mean annual evapotranspiration. Water Resour. Res. 2004, 40, W02502. [Google Scholar] [CrossRef]
  46. Liu, J.; Zhang, Q.; Zhang, Y.; Chen, X.; Li, J.; Aryal, S.K. Deducing climatic elasticity to assess projected climate change impacts on streamflow change across China. J. Geophys. Res. Atmos. 2017, 122, 10228–10245. [Google Scholar] [CrossRef]
  47. Chen, Y.; Takeuchi, K.; Xu, C.; Chen, Y.; Xu, Z. Regional climate change and its effects on river runoff in the Tarim Basin, China. Hydrol. Process. 2006, 20, 2207–2216. [Google Scholar] [CrossRef]
  48. Dong, L.; Zhang, G.; Xu, Y. Effects of climate change and human activities on runoff in the Nenjiang River Basin, Northeast China. Hydrol. Earth Syst. Sci. Discuss. 2012, 9, 11521–11549. [Google Scholar] [CrossRef]
  49. Nash, E.; Sutcliffe, J. River flow forecasting through conceptual models part I—A discussion of principles. J. Hydrol. 1970, 10, 282–290. [Google Scholar] [CrossRef]
  50. Gupta, H.V.; Kling, H.; Yilmaz, K.K.; Martinez, G.F. Decomposition of the mean squared error and NSE performance criteria: Implications for improving hydrological modelling. J. Hydrol. 2009, 377, 80–91. [Google Scholar] [CrossRef] [Green Version]
  51. Church, J.; Clark, P.; Cazenave, A.; Gregory, J.; Jevrejeva, S.; Levermann, A.; Merrifield, M.; Milne, G.; Nerem, R.; Nunn, P. Climate Change 2013: The Physical Science Basis. Contribution of Working Group I to the Fifth Assessment Report of the Intergovernmental Panel on Climate Change; Cambridge University Press: Cambridge, UK; New York, NY, USA, 2013; pp. 1137–1216. [Google Scholar]
  52. Hu, Z.; Zhou, Q.; Chen, X.; Qian, C.; Wang, S.; Li, J. Variations and changes of annual precipitation in Central Asia over the last century. Int. J. Climatol. 2017, 37, 157–170. [Google Scholar] [CrossRef]
  53. Hu, Z.; Zhang, C.; Hu, Q.; Tian, H. Temperature changes in Central Asia from 1979 to 2011 based on multiple datasets. J. Clim. 2014, 27, 1143–1167. [Google Scholar] [CrossRef]
  54. Gu, G.; Adler, R.F. Spatial patterns of global precipitation change and variability during 1901–2010. J. Clim. 2015, 28, 4431–4453. [Google Scholar] [CrossRef]
  55. Tao, H.; Gemmer, M.; Bai, Y.; Su, B.; Mao, W. Trends of streamflow in the Tarim River Basin during the past 50 years: human impact or climate change? J. Hydrol. 2011, 400, 1–9. [Google Scholar] [CrossRef]
  56. Lioubimtseva, E.; Henebry, G.M. Climate and environmental change in arid Central Asia: Impacts, vulnerability, and adaptations. J. Arid Environ. 2009, 73, 963–977. [Google Scholar] [CrossRef]
  57. Kryukova, V.; Dolgikh, S.; Idrissova, V.; Cherednichenko, A.; Sergezina, G. Kazakhstan’s Second National Communication to the Conference of the Parties of the United Nations Framework Convention on Climate Change. p. 165. Available online: http://www.un-gsp.org/sites/default/files/documents/kazakhstans_snc_english_1.pdf (accessed on 20 November 2019).
  58. Luo, M.; Liu, T.; Frankl, A.; Duan, Y.; Meng, F.; Bao, A.; Kurban, A.; De Maeyer, P. Defining spatiotemporal characteristics of climate change trends from downscaled GCMs ensembles: how climate change reacts in Xinjiang, China. Int. J. Climatol. 2018, 38, 2538–2553. [Google Scholar] [CrossRef]
  59. Lioubimtseva, E.; Cole, R.; Adams, J.; Kapustin, G. Impacts of climate and land-cover changes in arid lands of Central Asia. J. Arid Environ. 2005, 62, 285–308. [Google Scholar] [CrossRef]
  60. Matyas, C. Forests and Climate Change in Eastern Europe and Central Asia; Food and Agroculture Organization of the United Nations: Rome, Italy, 2010; Volume 8. [Google Scholar]
  61. Milly, P.C.; Dunne, K.A.; Vecchia, A.V. Global pattern of trends in streamflow and water availability in a changing climate. Nature 2005, 438, 347–350. [Google Scholar] [CrossRef]
  62. Wu, C.; Hu, B.X.; Huang, G.; Wang, P.; Xu, K. Responses of runoff to historical and future climate variability over China. Hydrol. Earth Syst. Sci. 2018, 22, 1971–1991. [Google Scholar] [CrossRef] [Green Version]
  63. Xing, W.; Wang, W.; Zou, S.; Deng, C. Projection of future runoff change using climate elasticity method derived from Budyko framework in major basins across China. Glob. Planet. Chang. 2018, 162, 120–135. [Google Scholar] [CrossRef]
  64. Li, Z.; Li, Q.; Wang, J.; Feng, Y.; Shao, Q. Impacts of projected climate change on runoff in upper reach of Heihe River basin using climate elasticity method and GCMs. Sci. Total Environ. 2020, 716, 137072. [Google Scholar] [CrossRef]
  65. Wang, W.; Shao, Q.; Yang, T.; Peng, S.; Xing, W.; Sun, F.; Luo, Y. Quantitative assessment of the impact of climate variability and human activities on runoff changes: a case study in four catchments of the Haihe River basin, China. Hydrol. Process. 2013, 27, 1158–1174. [Google Scholar] [CrossRef]
  66. Chen, J.; Brissette, F.P.; Poulin, A.; Leconte, R. Overall uncertainty study of the hydrological impacts of climate change for a Canadian watershed. Water Resour. Res. 2011, 47, W12509. [Google Scholar] [CrossRef]
  67. Wu, C.; Huang, G.; Yu, H. Prediction of extreme floods based on CMIP5 climate models: A case study in the Beijiang River basin, South China. Hydrol. Syst. Sci. 2015, 19, 1385–1399. [Google Scholar] [CrossRef] [Green Version]
  68. Liu, L.; Fischer, T.; Jiang, T.; Luo, Y. Comparison of uncertainties in projected flood frequency of the Zhujiang River, South China. Quat. Int. 2013, 304, 51–61. [Google Scholar] [CrossRef]
Figure 1. (a) Location of the study area; (b) digital elevation model and hydro-meteorological stations (c) land use classes map.
Sustainability 12 04968 g001
Figure 2. (a) The annual mean temperature trend; (b) the annual precipitation trend; and (c) the annual potential evapotranspiration trend during the period of 1950–2015.
Sustainability 12 04968 g002
Figure 3. The analysis of annual runoff trend during the period of 1950–2015 at (a) Berel, (b) Pechi, and (c) Lesnaya Pristan stations.
Sustainability 12 04968 g003
Figure 4. The Double Cumulative Curve (DCC) of the annual runoff and precipitation.
Sustainability 12 04968 g004
Figure 5. The change rates for the monthly amount of precipitation for (a) RCP 4.5 and (b) for RCP 8.5 scenarios generated in two future time periods 2036–2065 and 2071–2100 with respect to those observed in the baseline condition (1971–2000) determined by the multi-model ensemble (MME).
Sustainability 12 04968 g005
Figure 6. The average monthly variability of temperature in the (a) RCP 4.5 and (b) RCP 8.5 scenarios in the two future time periods of 2036–2065 and 2071–2100 compared to those of the baseline condition (1971–2000) identified from the multi-model ensemble (MME).
Sustainability 12 04968 g006
Figure 7. The projected climatic variables variations for RCPs 4.5 and 8.5: (a) Temperature for 2036–2100 and (b) precipitation for 2036–2100.
Sustainability 12 04968 g007
Table 1. The determination of change-points and trend (Z) analysis for precipitation (P), temperature (T) and potential evapotranspiration (PET) during the period of 1950–2015.
FactorUpstreamMidstreamDownstream
MK TestChange Point (year)MK TestChange Point (year)MK TestChange Point (year)
ZSig.ZSig.ZSig.
Temperature5.09**19884.86**19765.55**1976
Precipitation2.21*19811.54N2000−0.15N1972
PET0.22N19960.74N19960.85N1996
** and * indicate significance levels of 0.01 and 0.05, N—not significant.
Table 2. Determination change points and trend (Z) analysis for precipitation (P), temperature (T), and potential evapotranspiration (PET) during the period of 1950–2015.
StationChange Rate (Mm/10a)MK TestChange Point (Year)
ZSig.
Berel0.012.58**1982
Pechi0.380.87N1982
Lesnaya Pristan0.071.82*1982
** and * indicate significance levels of 0.01 and 0.05, N—not significant.
Table 3. The contributions of climate variability and anthropogenic activities to the changes of runoff.
StationsPeriod ΔP ΔPET ΔR ΔRclim ΔRhum
(mm)(mm)(mm)mm%mm%
Berel (Upstream)1950–1982
1983–199552.94−27.456.8923.0758.78−16.241.22
1996–200545.00−2.177.8117.5264.35−9.735.65
2006–201553.444.4124.1123.7798.580.31.45
1983–201550.68−10.1412.3921.6870.00−9.330.00
Pechi
(Midstream)
1950–1982
1983–19959.52−22.4420.5526.0582.57−5.5017.43
1996–20054.014.037.625.3570.242.2729.76
2006–201559.8719.6315.8181.3355.38−65.5244.62
1983–201523.12−1.6715.1938.9762.11−23.7837.89
Lesnaya Pristan (Downstream)1950–1982
1983–1995−19.13−24.2039.16−40.4633.7079.666.30
1996–2005−15.449.3127.70−53.7239.7581.460.25
2006–201525.6720.11121.1265.6354.1955.545.81
1983–2015−4.43−0.6260.52−13.4015.3473.984.66
Table 4. Correlation of the observation values and global circulation models (GCMs) obtained using different spatial metrics for mean annual climate variables. R2, spatial correlation; KGE: Kling–Gupta efficiency; NSE, Nash–Sutcliff efficiency; RMSE, root mean square error.
ModelsR2NSEKGERMSE
1MRI-CGCM30.860.720.585.14
2NorESM1-M0.870.560.416.44
3MIROC-ESM-CHEM0.890.610.466.29
4MIROC-ESM0.870.660.615.61
5MIROC50.880.400.167.45
6IPSL-CM5A-MR0.890.680.555.50
7inmcm40.870.510.336.73
8IPSL CM5LR0.820.470.307.04
9ACCESS-1.00.890.710.605.22
10bcc-csm1-10.850.370.087.69
11BNU-ESM0.850.570.576.31
12CanESM20.820.660.735.59
13CCSM40.870.400.077.46
14CESM1-BGC0.760.380.367.57
15CNRM-CM50.880.660.385.63
16CSIRO-MK3-6-00.850.710.795.21
17GFDL-CM30.840.530.426.63
18GFDL-ESM2G0.810.550.416.45
19GFDL-ESM2M0.830.720.695.07
20MPI-ESM-LR0.890.520.376.66
21MPI-ESM-MR0.900.440.407.22
The top six GCMs were ranked based on the above–mentioned criteria: MRI-CGCM3, MIROC-ESM, ACCESS-1.0, CanESM2, CSIRO-MK3-6-0, and GFDL-ESM2M (bolded in Table 4).
Table 5. Changes in precipitation for Buqtyrma River Basin, based on the multi-model ensemble (MME) under both representative concentration pathways (RCPs) 4.5 and 8.5, compared to the baseline condition of 1971 to 2000.
PeriodRCP 4.5
AnnualDJFMAMJJASON
2036–206513.6%17.8%15.9%7.7%13.1%
2071–210019.9%22.3%24.9%11.4%21.0%
RCP 8.5
2036–206510.5%14.9%12.6%2.7%11.8%
2071–210018.1%27.2%26.0%1.1%18.2%
Table 6. The average annual temperature, annual maximum temperature and annual minimum temperature under two RCPs 4.5 and 8.5, for future time periods (2036–2065 and 2071–2100) relative to the baseline condition (1971–2000).
ScenarioTime PeriodTavg (°C)Tmax (°C)Tmin (°C)
ValueChange with Respect to BaselineValueChange with Respect to BaselineValueChange with Respect to Baseline
Baseline1971–20000.97 6.91 −4.98
RCP 4.52036–20653.492.529.452.54−2.472.51
2071–21004.333.3610.413.50−1.753.23
RCP 8.52036–20654.263.2910.013.10−1.493.49
2071–21007.166.1912.825.911.506.48
Table 7. The analysis of the monthly and annual precipitation trend, as well as the mean temperature trends under two RCPs 4.5 and 8.5 for the period of 2036–2100.
MonthPrecipitation
RCP 4.5
Temperature
RCP 4.5
Precipitation
RCP 8.5
Temperature
RCP 8.5
Test ZSig.Test ZSig.Test ZSig.Test ZSig.
January0.057 3.674***0.199*7.705***
February−0.019 3.255**0.110 7.592***
March0.023 3.323***0.250**8.577***
April0.276**4.376***0.208*8.849***
May0.005 4.501***0.111 9.347***
June−0.005 5.803***−0.048 9.098***
July0.104 5.486***−0.028 9.834***
August0.125 6.652***−0.097 9.924***
September0.204*4.082***−0.041 8.713***
October−0.006 3.663***0.302***8.724***
November0.098 3.527***0.173*7.807***
December0.188*5.282***0.198*8.305***
Annual3.12*7.615***3.3*10.581***
Test Z is the Mann–Kendall (MK) test statistic; * indicates a significance level of 0.05; ** indicates a significance level of 0.01; *** indicates a significance level of 0.001.
Table 8. Relative changes of runoff in the future using the climate elasticity under two RCPs 4.5 and 8.5, compared to the baseline condition of 1971 to 2000.
ScenarioPeriodεPεPET Δ P P Δ P E T P E T ε P Δ P P ε P E T Δ P E T P E T Δ R R
RCP 4.52036–20652.08−1.0813.589.0228.32−9.7818.53
2071–21002.29−1.2918.1812.5841.62−16.2325.40
RCP 8.52036–20651.39−0.398.738.2712.09−3.188.91
2071–21001.03−0.0313.4616.4313.83−0.4513.38
Note: Units for ΔP/P, ΔPET/PET are shown %.

