Whom Do Urban Agriculture Parks Provide Landscape Services to and How? A Case Study of Beijing, China

Abstract
:1. Introduction
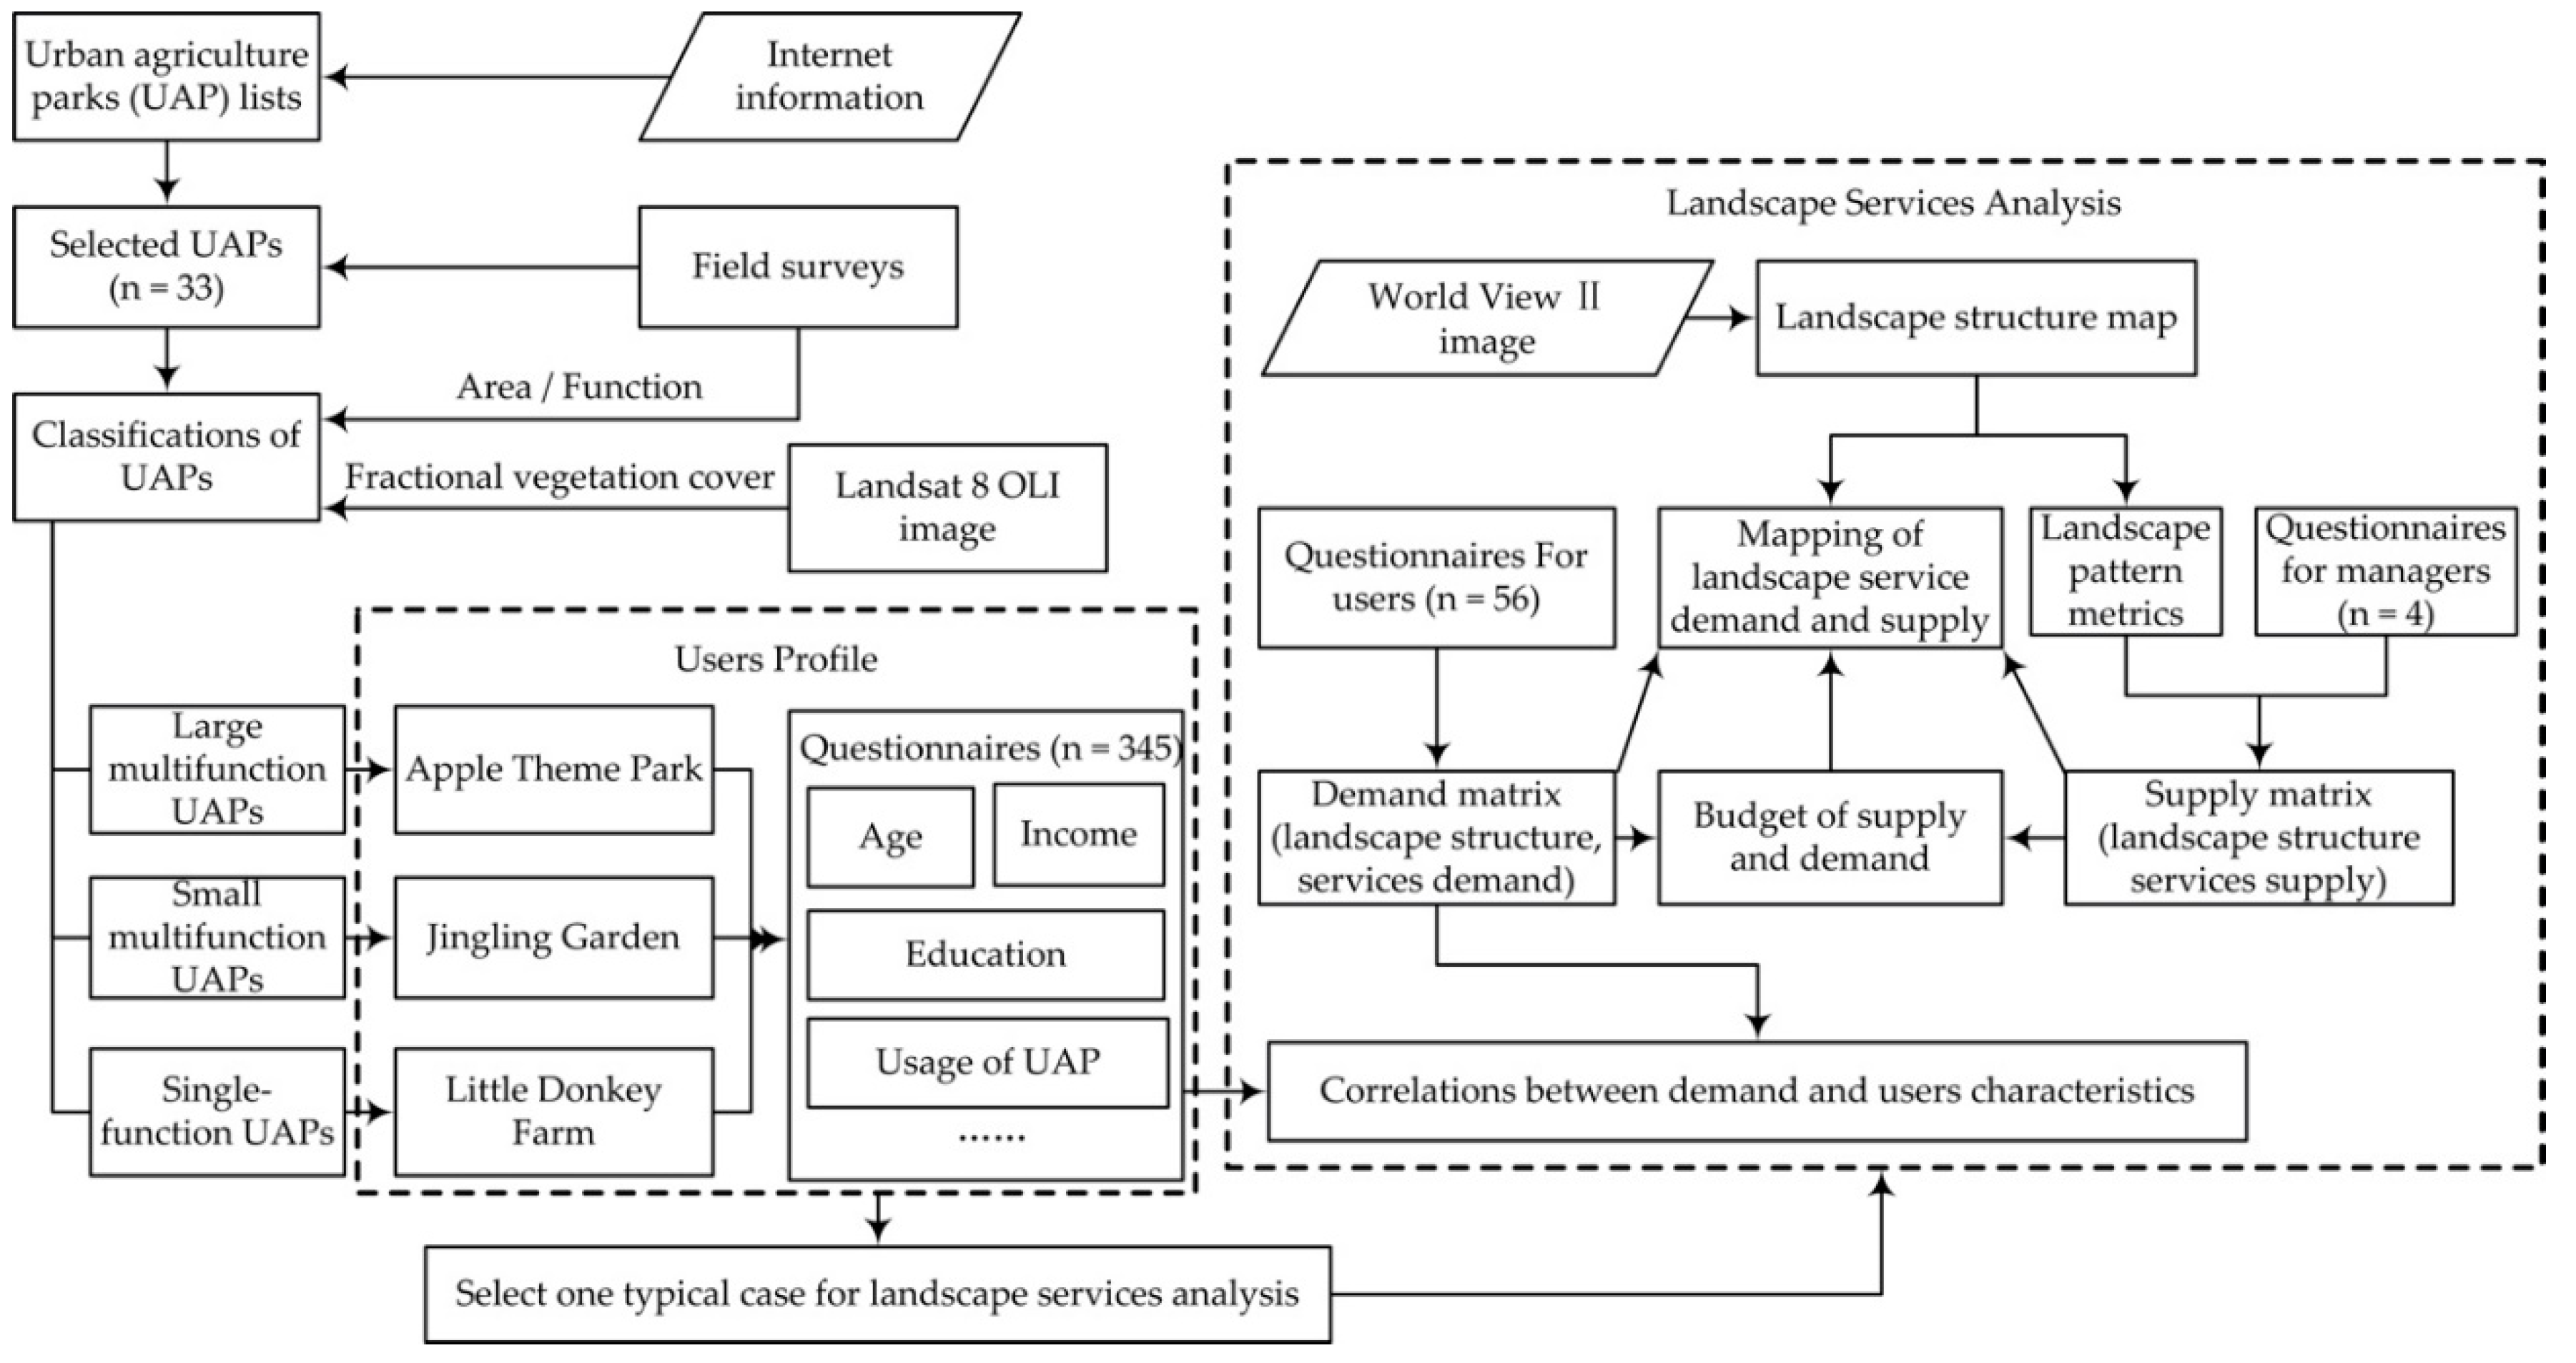
2. Methods
2.1. Study Area and Sampling
2.2. User Profiles
2.3. User Demand of Landscape Services and Preference Analysis
2.3.1. Unit of Landscape Services Assessment
2.3.2. Landscape Services Demand Assessment
2.3.3. Preference Analysis
2.4. Match Between Supply and Demand
2.4.1. Supply Assessment
2.4.2. Budgets of Supply and Demand
3. Results
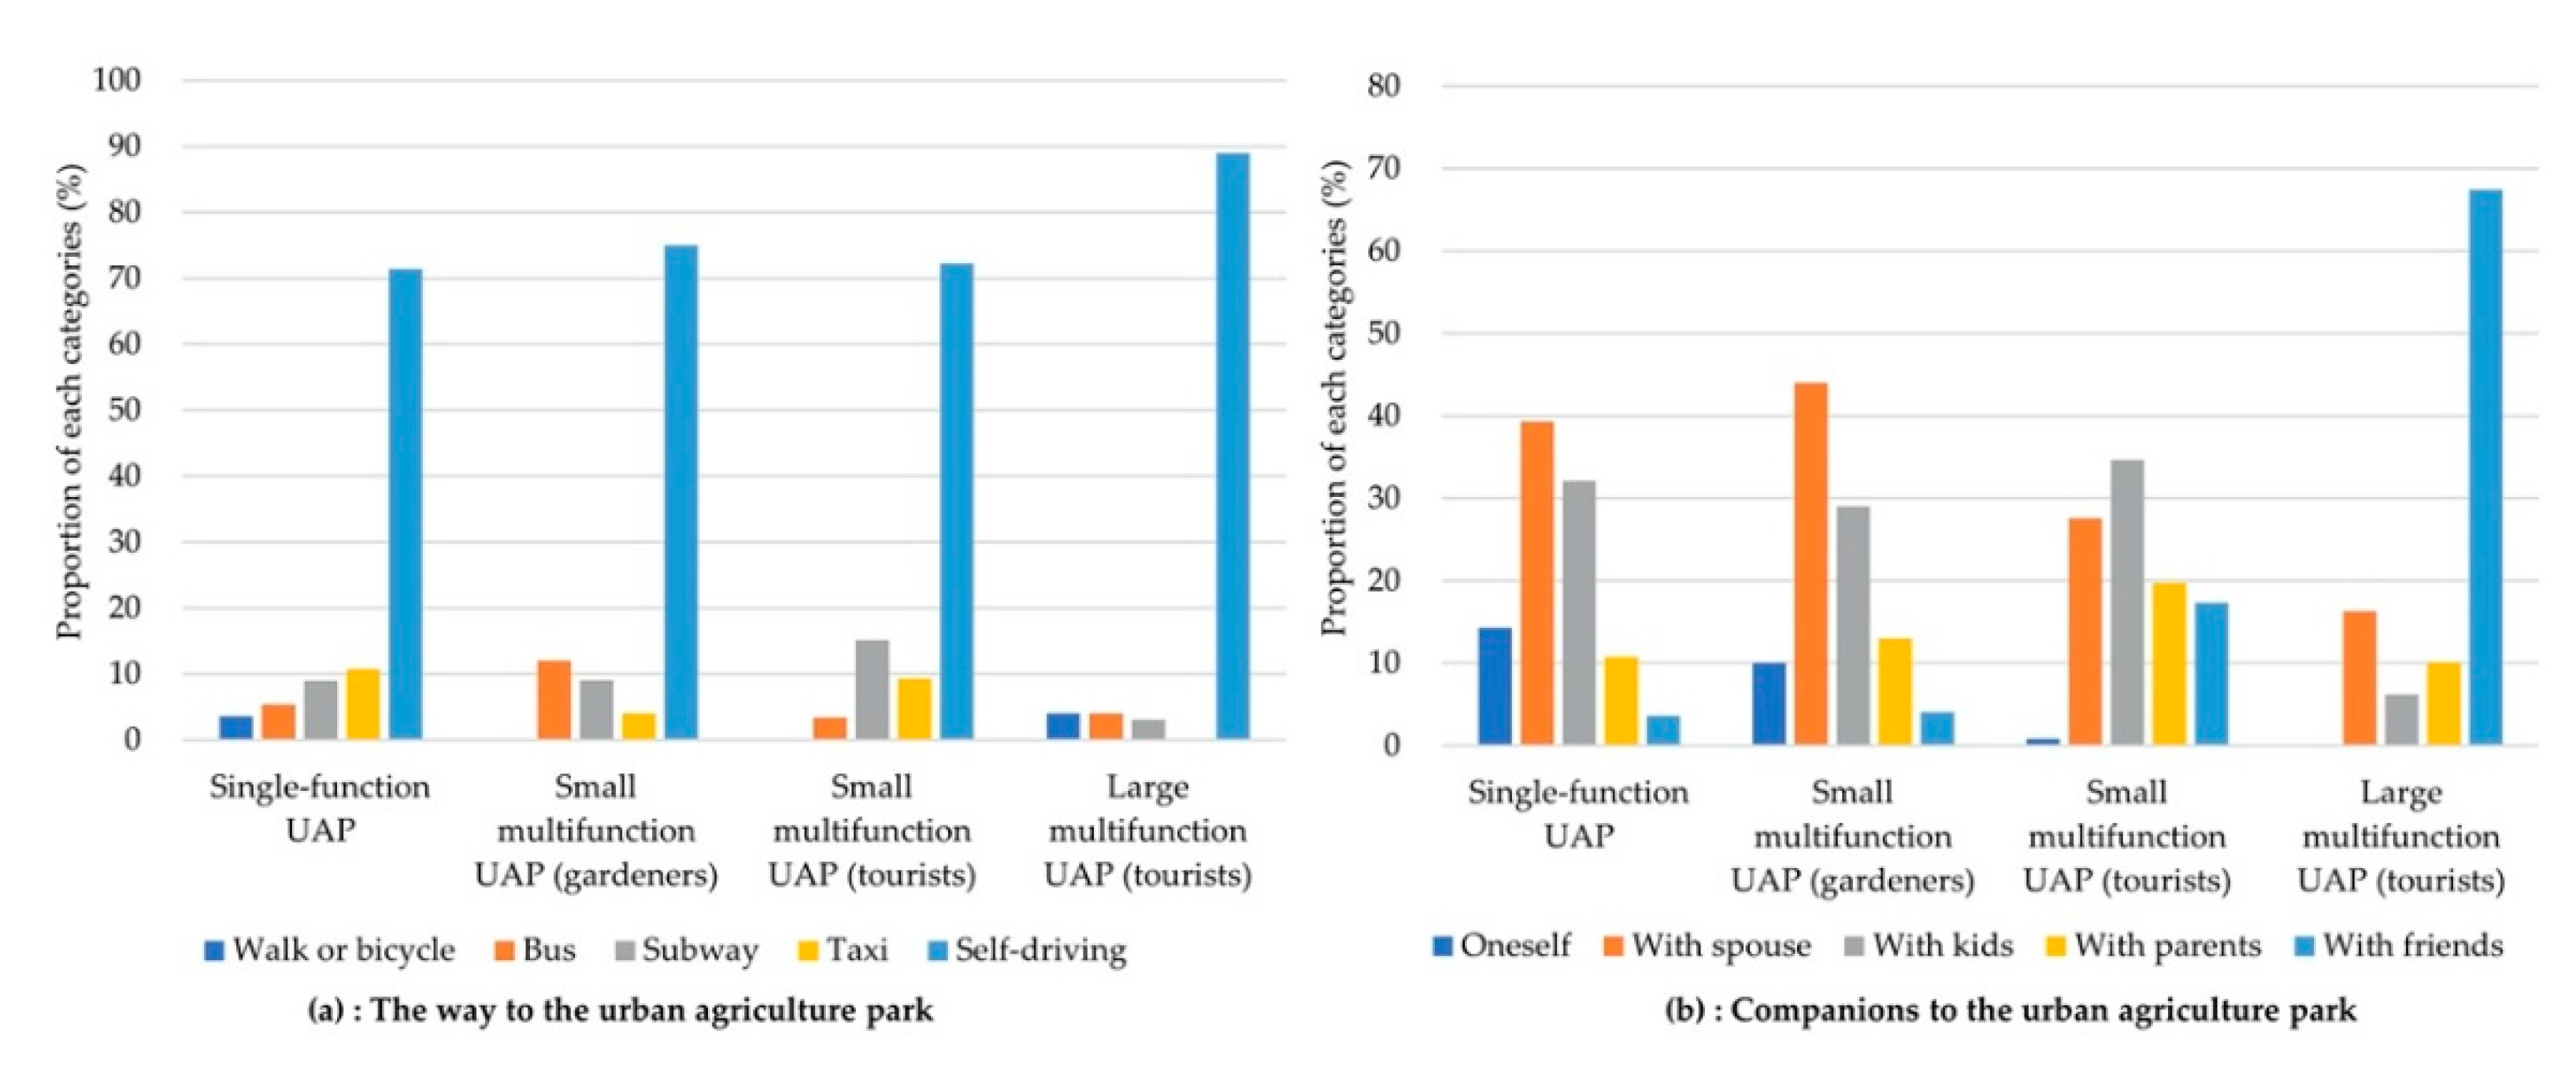
3.1. Users’ Characteristics in Various Types of UAPs
3.2. Services Demand and Preference Analysis in Little Donkey Farm
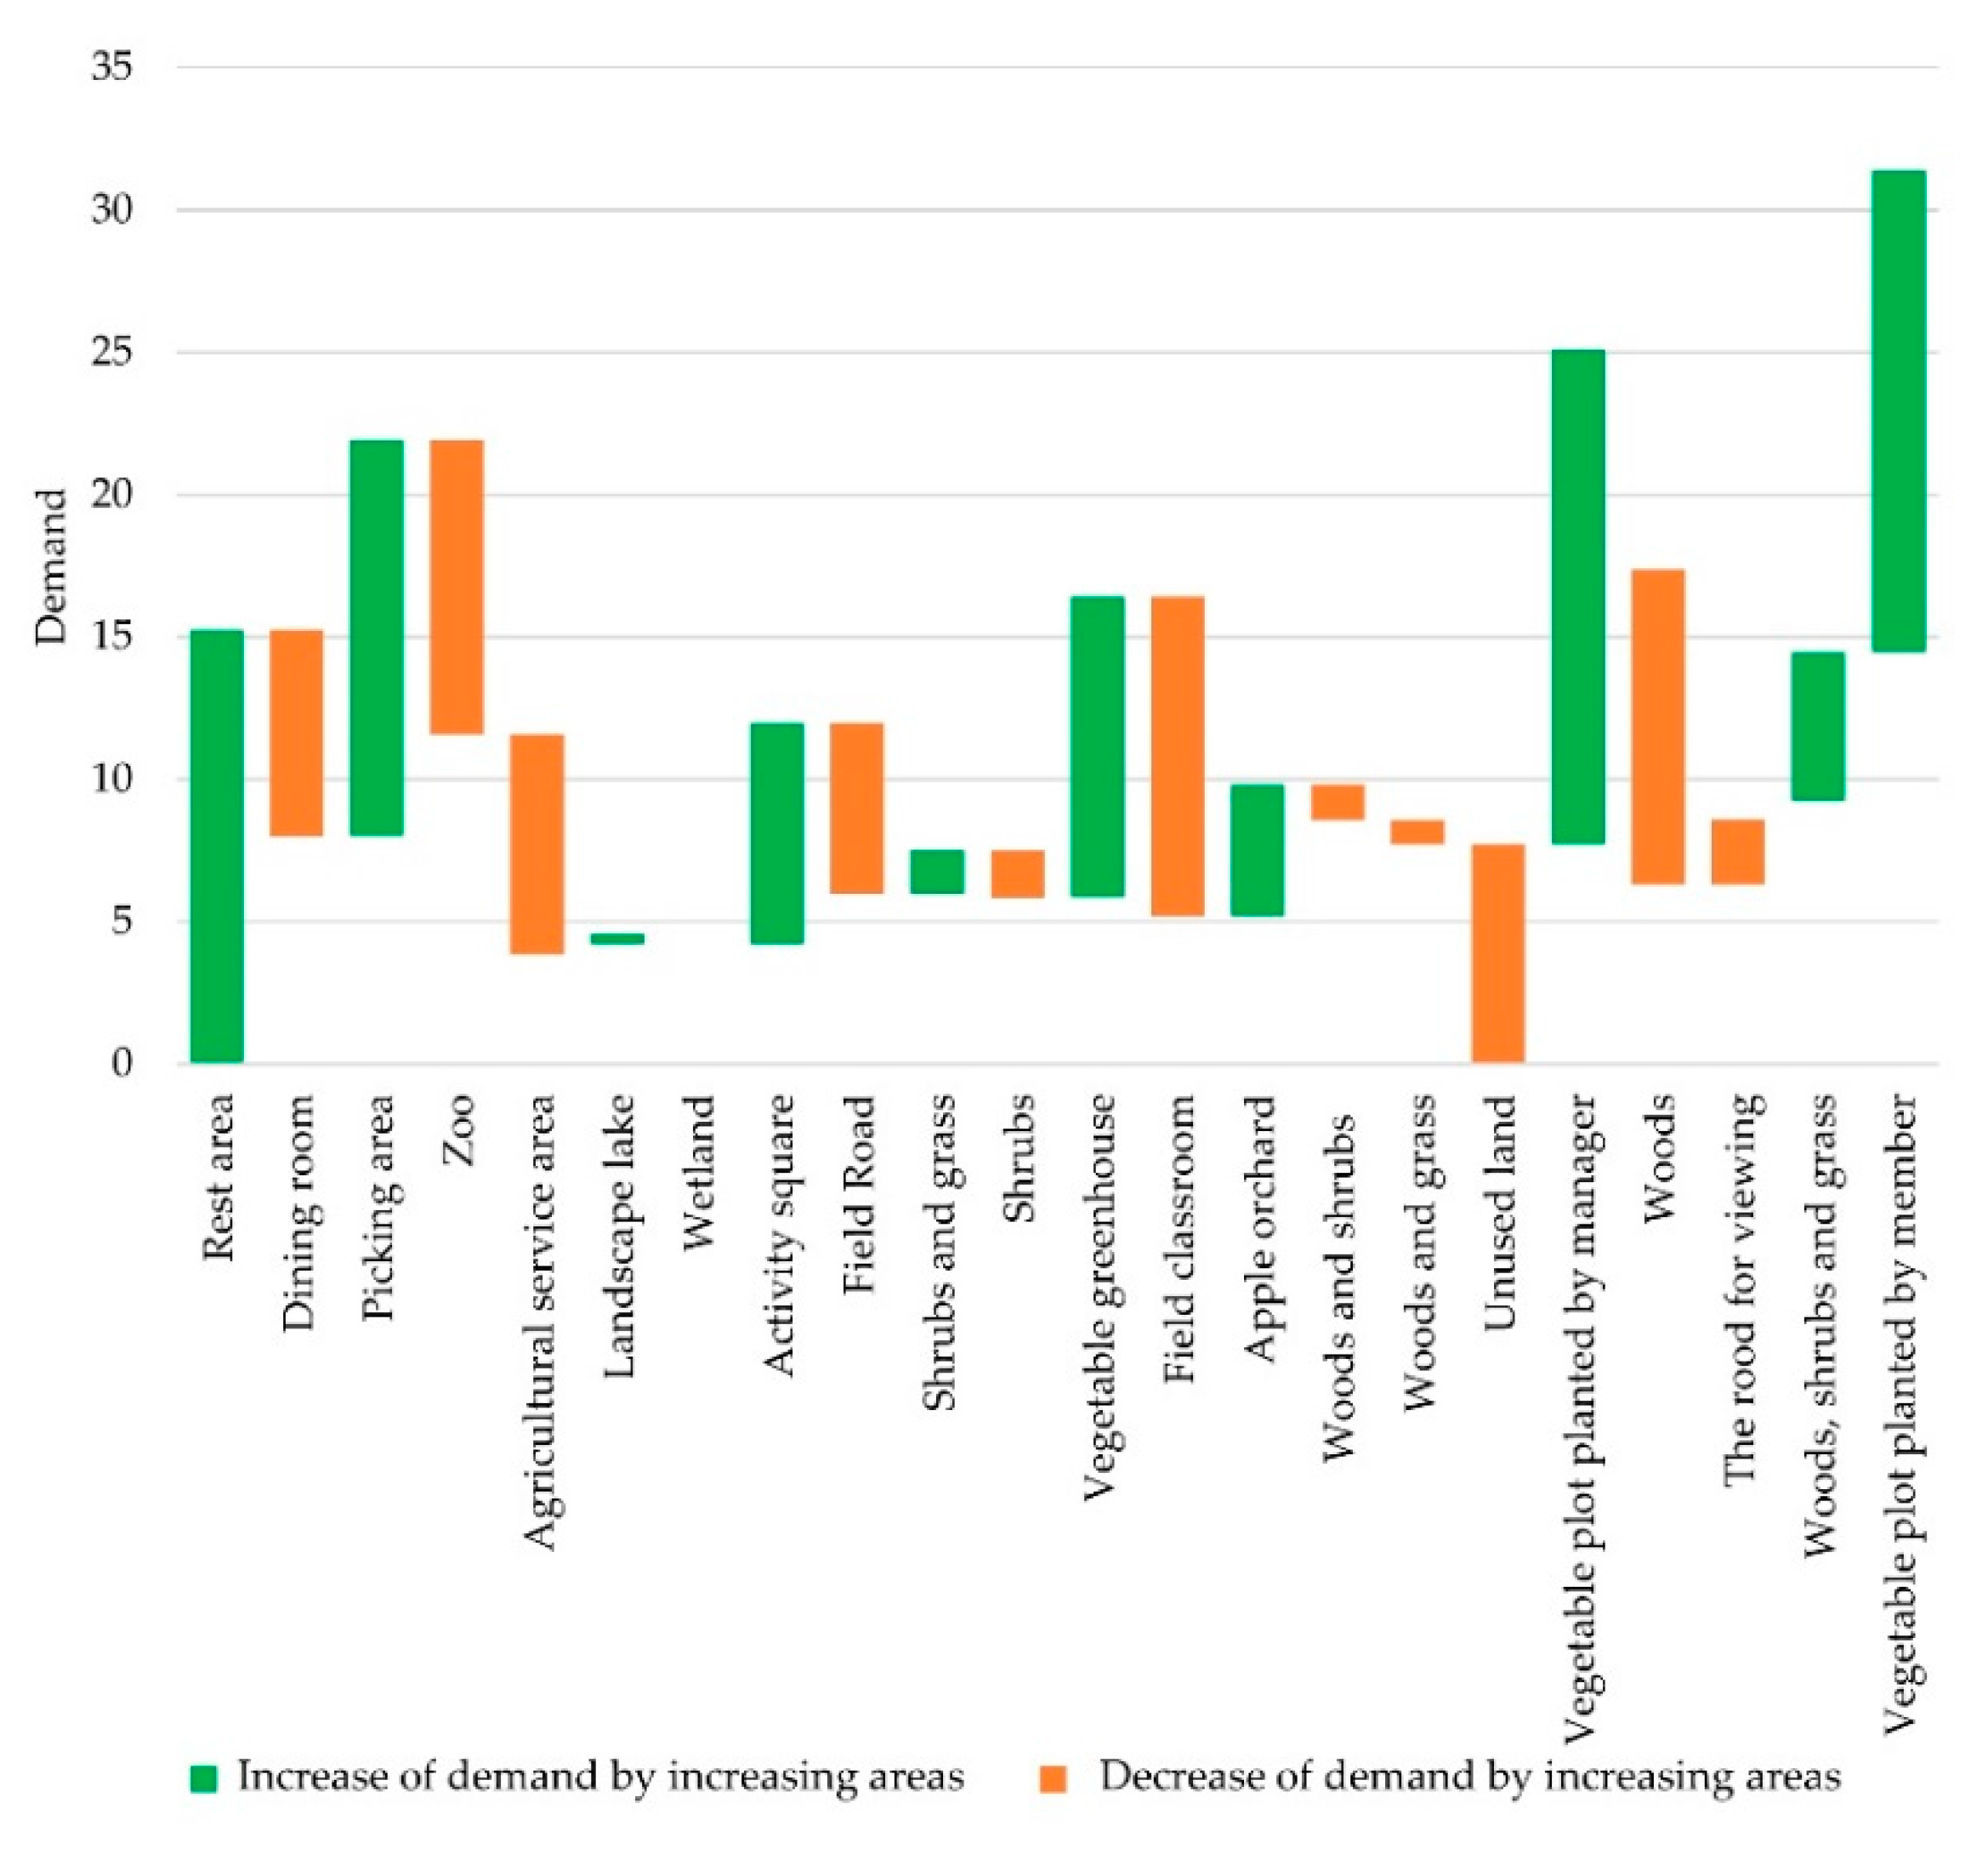
3.2.1. Landscape Structure
3.2.2. Demand of Landscape Services
3.2.3. Relationship between Users’ Characteristics and Service Demand
3.3. Budget of Supply and Demand
3.3.1. Supply of Landscape Services
3.3.2. Match Between Supply and Demand
4. Discussion
4.1. Differences of User Profiles
4.2. Implications of Landscape Services Analysis of UAPs
4.3. Limitation and Future Research
5. Conclusions
Author Contributions
Funding
Acknowledgments
Conflicts of Interest
Appendix A

| Landscape Classification | Land Cover | Function |
|---|---|---|
| Vegetable plot planted by member | Farmland | Land where members grow their own vegetables |
| Vegetable plot planted by manager | Farmland | Administrators plant fresh vegetables for members |
| Vegetable greenhouse | Farmland | A land for growing vegetables in a greenhouse |
| Apple orchard | Garden | A garden for planting apple trees |
| Woods | Forest land | A land that only grows trees |
| Woods and grass | Forest land | A land that grows trees and is covered with flowers and herbal plants |
| Shrubs | Forest land | A land that grows only shrubs |
| Shrubs and grass | Forest land | A land that grows only shrubs and is covered with flowers and herbal plants. |
| Woods and shrubs | Forest land | Land covered by trees and shrubs |
| Woods, shrubs, and grass | Forest land | A land planted with trees and shrubs and covered with flowers and plants |
| Dining room | Commercial land | The land for providing catering services to visitors |
| Site of activity | Administration and public services | Land used for activities organized by agricultural administrators or members |
| Field classroom | Administration and public services | Land used by agricultural administrators for teaching of agricultural knowledge |
| Rest area | Administration and public services | A small patch to take a break from agriculture activities |
| Service center | Administration and public services | Land used by agricultural managers for instruction, self-promotion, etc. |
| Tool house | Land for warehouses | For reserve tools and materials |
| Zoo | Administration and public services | Land used for raising various animals and for visitors’ viewing (the donkey where Little Donkey Farm’s name comes from lives there) |
| Filed road | Land for roads and transport facilities | Roads for cultivation and rest |
| The road for viewing | Land for roads and transport facilities | Roads for visitors’ viewing |
| Landscape lake | Water and water facilities’ land | The lake formed by artificial excavation to provide beautiful waterscape |
| Unused land | Other sites | Has not been used |
| Wetland | Other sites | A natural or artificial marsh near the lake |
| Beijing–Miyun diversion channel | Water and water facilities’ land | A channel used to transport water from reservoir to city |
| Kiwifruit orchard | Garden | A garden for planting kiwifruit trees |
| Other vegetable field | Farmland | Providing vegetables for sales or the dining room |
| Floodway | Water and water facilities’ land | A channel used to help increase the flood-fighting capacity by helping the main channel to disperse flood pressure |
| Compost heap | Land for warehouses | The land used for stacking cow dung and dead branches and leaves |
| Parking lot | Land for roads and transport facilities | Land for parking |
| Storage room | Land for warehouses | For reserve materials |
| Landscape Structure | Education | Exercise | Natural Experience | Social Cohesion | Recreation | Countryside life | Scenery Services |
|---|---|---|---|---|---|---|---|
| Vegetable plot planted by member | 3.21 | 4.43 | 4.29 | 3.36 | 4.20 | 4.29 | 2.39 |
| Vegetable plot planted by manager | 2.57 | 1.12 | 3.54 | 2.55 | 2.12 | 3.24 | 2.23 |
| Vegetable greenhouse | 2.23 | 2.87 | 2.89 | 2.64 | 1.39 | 2.87 | 1.54 |
| Picking area | 2.97 | 3.13 | 3.76 | 3.65 | 4.02 | 2.77 | 1.63 |
| Kiwifruit orchard | 0.00 | 0.00 | 0.00 | 0.00 | 0.00 | 0.00 | 0.00 |
| Apple orchard | 0.43 | 1.22 | 2.26 | 0.00 | 1.97 | 1.83 | 2.11 |
| Woods | 0.00 | 0.00 | 1.29 | 0.00 | 1.12 | 0.34 | 3.56 |
| Woods and grass | 0.00 | 0.00 | 1.53 | 0.00 | 1.41 | 0.75 | 4.03 |
| Shrubs | 0.00 | 0.00 | 1.31 | 0.00 | 1.15 | 0.43 | 2.96 |
| Shrubs and grass | 0.00 | 0.00 | 1.63 | 0.00 | 1.52 | 0.92 | 3.43 |
| Woods and shrubs | 0.00 | 0.00 | 1.87 | 0.00 | 1.71 | 1.24 | 3.76 |
| Woods, shrubs, and grass | 0.00 | 0.00 | 1.93 | 0.00 | 2.02 | 1.48 | 3.82 |
| Dining room | 0.00 | 0.00 | 0.96 | 4.38 | 1.42 | 1.25 | 0.00 |
| Warehouse | 0.00 | 0.00 | 0.00 | 0.00 | 0.00 | 0.00 | 0.00 |
| Compost place | 0.00 | 0.00 | 0.00 | 0.00 | 0.00 | 0.00 | 0.00 |
| Activity square | 0.83 | 0.92 | 0.15 | 3.53 | 4.31 | 0.00 | 2.25 |
| Field classroom | 0.79 | 0.00 | 1.74 | 0.93 | 1.03 | 0.00 | 0.71 |
| Rest area | 0.00 | 0.00 | 0.00 | 4.02 | 4.79 | 3.12 | 3.33 |
| Agricultural service area | 3.85 | 0.00 | 0.00 | 0.00 | 0.00 | 0.00 | 0.00 |
| Tool room | 0.00 | 0.00 | 0.00 | 0.00 | 0.00 | 0.00 | 0.00 |
| Zoo | 2.41 | 0.00 | 3.18 | 2.42 | 2.30 | 1.16 | 0.12 |
| Field Road | 0.00 | 0.00 | 3.13 | 0.00 | 0.00 | 0.00 | 2.86 |
| The rood for viewing | 0.00 | 0.00 | 1.89 | 0.00 | 0.00 | 0.00 | 2.14 |
| Parking lot | 0.00 | 0.00 | 0.00 | 0.00 | 0.00 | 0.00 | 0.00 |
| Landscape lake | 0.00 | 0.00 | 2.63 | 0.53 | 0.84 | 0.00 | 0.21 |
| Headrace channel | 0.00 | 0.00 | 0.00 | 0.00 | 0.00 | 0.00 | 0.00 |
| Flood discharge channel | 0.00 | 0.00 | 0.00 | 0.00 | 0.00 | 0.00 | 0.00 |
| Unused land | 0.00 | 0.00 | 0.00 | 0.00 | 0.00 | 0.00 | 0.00 |
| Wetland | 0.00 | 0.00 | 2.63 | 0.53 | 0.84 | 0.00 | 0.21 |
| Landscape Structure | Education | Exercise | Natural Experience | Social Cohesion | Recreation | Countryside Life | Scenery Services |
|---|---|---|---|---|---|---|---|
| Vegetable plot planted by member | 4.38 | 5.00 | 4.50 | 4.75 | 4.38 | 4.50 | 3.25 |
| Vegetable plot planted by manager | 2.50 | 4.13 | 4.13 | 4.00 | 3.00 | 3.38 | 3.00 |
| Vegetable greenhouse | 1.88 | 3.25 | 3.84 | 3.88 | 2.38 | 4.38 | 2.50 |
| Picking area | 2.00 | 3.50 | 4.50 | 5.00 | 2.38 | 4.50 | 3.13 |
| Kiwifruit orchard | 0.00 | 0.00 | 0.00 | 0.00 | 0.00 | 0.00 | 0.00 |
| Apple orchard | 0.50 | 2.50 | 3.21 | 0.00 | 1.00 | 2.63 | 3.21 |
| Woods | 0.00 | 0.00 | 3.63 | 0.00 | 4.00 | 2.75 | 4.13 |
| Woods and grass | 0.00 | 0.00 | 2.92 | 0.00 | 2.63 | 1.38 | 2.75 |
| Shrubs | 0.00 | 0.00 | 2.79 | 0.00 | 1.63 | 2.25 | 2.88 |
| Shrubs and grass | 0.00 | 0.00 | 2.42 | 0.00 | 2.00 | 2.38 | 3.29 |
| Woods and shrubs | 0.00 | 0.00 | 3.09 | 0.00 | 2.63 | 2.88 | 3.71 |
| Woods, shrubs and grass | 0.00 | 0.00 | 3.38 | 0.00 | 3.88 | 2.88 | 4.17 |
| Dining room | 0.00 | 0.00 | 0.00 | 4.88 | 2.13 | 3.50 | 0.00 |
| Warehouse | 0.00 | 0.00 | 0.00 | 0.00 | 0.00 | 0.00 | 0.00 |
| Compost place | 0.00 | 0.00 | 0.00 | 0.00 | 0.00 | 0.00 | 0.00 |
| Activity square | 2.00 | 3.88 | 3.63 | 4.50 | 2.75 | 2.38 | 1.84 |
| Field classroom | 1.38 | 0.00 | 3.04 | 3.38 | 2.00 | 0.00 | 2.46 |
| Rest area | 0.00 | 0.00 | 2.92 | 4.38 | 3.00 | 4.13 | 3.00 |
| Agricultural service area | 2.13 | 0.00 | 0.00 | 0.00 | 0.00 | 0.00 | 0.00 |
| Tool room | 0.00 | 0.00 | 0.00 | 0.00 | 0.00 | 0.00 | 0.00 |
| Zoo | 2.38 | 0.00 | 2.96 | 2.50 | 2.00 | 3.38 | 1.96 |
| Field Road | 0.00 | 0.00 | 3.88 | 0.00 | 0.00 | 0.00 | 2.13 |
| The rood for viewing | 0.00 | 0.00 | 3.88 | 0.00 | 0.00 | 0.00 | 3.71 |
| Parking lot | 0.00 | 0.00 | 0.00 | 0.00 | 0.00 | 0.00 | 0.00 |
| Landscape lake | 0.00 | 0.00 | 2.34 | 0.00 | 1.13 | 0.00 | 0.00 |
| Headrace channel | 0.00 | 0.00 | 0.00 | 0.00 | 0.00 | 0.00 | 0.00 |
| Flood discharge channel | 0.00 | 0.00 | 0.00 | 0.00 | 0.00 | 0.00 | 0.00 |
| Unused land | 0.00 | 0.00 | 1.88 | 0.00 | 0.00 | 0.00 | 0.00 |
| Wetland | 0.00 | 0.00 | 2.67 | 0.00 | 0.50 | 0.00 | 0.00 |
Appendix B
- Obtain knowledge about agriculture (education service). Score:
- Do some physical exercises (exercise service). Score:
- Natural experience (natural experience service). Score:
- Enhance the connection to friends and families (social cohesion). Score:
- Relax and recreation (recreation service). Score:
- Seeking a countryside life (countryside life service). Score:
- Enjoy the beautiful views (scenery service). Score:
References
- United Nations (UN). Transforming Our World: The 2030 Agenda for Sustainable Development. 2015. Available online: https://sustainabledevelopment.un.org/post2015/transformingourworld (accessed on 10 January 2020).
- Khumalo, N.Z.; Sibanda, M. Does urban and peri-urban agriculture contribute to household food security? An assessment of the food security status of households in tongaat, eThekwini municipality. Sustainability 2019, 11, 1082. [Google Scholar] [CrossRef] [Green Version]
- Ayambire, R.A.; Amponsah, O.; Peprah, C.; Takyi, S.A. A review of practices for sustaining urban and peri-urban agriculture: Implications for land use planning in rapidly urbanising Ghanaian cities. Land Use Policy 2019, 84, 260–277. [Google Scholar] [CrossRef]
- Gradinaru, S.R.; Triboi, R.; Ioja, C.I.; Artmann, M. Contribution of agricultural activities to urban sustainability: Insights from pastoral practices in Bucharest and its peri-urban area. Habitat Int. 2018, 82, 62–71. [Google Scholar] [CrossRef]
- Artmann, M.; Sartison, K. The role of urban agriculture as a nature-based solution: A review for developing a systemic assessment framework. Sustainability 2018, 10, 1937. [Google Scholar] [CrossRef] [Green Version]
- Li, Y.; Zhu, S. Discussion on planning of overall urban agriculture park. Agric. Sci. Technol. 2013, 14, 1521–1525. [Google Scholar]
- De Bon, H.; Parrot, L.; Moustier, P. Sustainable urban agriculture in developing countries. A review. Agron. Sustain. Dev. 2010, 30, 21–32. [Google Scholar] [CrossRef] [Green Version]
- Barthel, S.; Isendahl, C. Urban gardens, agriculture, and water management: Sources of resilience for long-term food security in cities. Ecol. Econ. 2013, 86, 224–234. [Google Scholar] [CrossRef]
- Langemeyer, J.; Camps-Calvet, M.; Calvet-Mir, L.; Barthel, S.; Gomez-Baggethun, E. Stewardship of urban ecosystem services: Understanding the value(s) of urban gardens in Barcelona. Landsc. Urban Plan. 2018, 170, 79–89. [Google Scholar] [CrossRef] [Green Version]
- Lin, B.B.; Philpott, S.M.; Jha, S. The future of urban agriculture and biodiversity-ecosystem services: Challenges and next steps. Basic Appl. Ecol. 2015, 16, 189–201. [Google Scholar] [CrossRef]
- Doherty, K. Urban Agriculture and Ecosystem Services: A Typology and Toolkit for Planners. Master’s Thesis, University of Massachusetts Amherst, Amherst, MA, USA, 2015. [Google Scholar]
- Lee, G.-G.; Lee, H.-W.; Lee, J.-H. Greenhouse gas emission reduction effect in the transportation sector by urban agriculture in Seoul, Korea. Landsc. Urban Plan. 2015, 140. [Google Scholar] [CrossRef] [Green Version]
- Waffle, A.D.; Corry, R.C.; Gillespie, T.J.; Brown, R.D. Urban heat islands as agricultural opportunities: An innovative approach. Landsc. Urban Plan. 2017, 161, 103–114. [Google Scholar] [CrossRef]
- Sorace, A. Value to wildlife of urban-agricultural parks: A case study from Rome urban area. Environ. Manag. 2001, 28, 547–560. [Google Scholar] [CrossRef]
- Da Silva, I.M.; Fernandes, C.O.; Castiglione, B.; Costa, L. Characteristics and motivations of potential users of urban allotment gardens: The case of Vila Nova de Gaia municipal network of urban allotment gardens. Urban For. Urban Green. 2016, 20, 56–64. [Google Scholar] [CrossRef]
- Bendt, P.; Barthel, S.; Colding, J. Civic greening and environmental learning in public-access community gardens in Berlin. Landsc. Urban Plan. 2013, 109, 18–30. [Google Scholar] [CrossRef]
- Fox-Kaemper, R.; Wesener, A.; Muenderlein, D.; Sondermann, M.; McWilliam, W.; Kirk, N. Urban community gardens: An evaluation of governance approaches and related enablers and barriers at different development stages. Landsc. Urban Plan. 2018, 170, 59–68. [Google Scholar] [CrossRef]
- Willemen, L.; Verburg, P.H.; Hein, L.; van Mensvoort, M.E.F. Spatial characterization of landscape functions. Landsc. Urban Plan. 2008, 88, 34–43. [Google Scholar] [CrossRef]
- Termorshuizen, J.W.; Opdam, P. Landscape services as a bridge between landscape ecology and sustainable development. Landsc. Ecol. 2009, 24, 1037–1052. [Google Scholar] [CrossRef]
- Clinton, N.; Stuhlmacher, M.; Miles, A.; Aragon, N.U.; Wagner, M.; Georgescu, M.; Herwig, C.; Gong, P. A global geospatial ecosystem services estimate of urban agriculture. Earth’s Future 2018, 6, 40–60. [Google Scholar] [CrossRef]
- Fagerholm, N.; Kayhko, N.; Ndumbaro, F.; Khamis, M. Community stakeholders’ knowledge in landscape assessments—Mapping indicators for landscape services. Ecol. Indic. 2012, 18, 421–433. [Google Scholar] [CrossRef]
- Plieninger, T.; Dijks, S.; Oteros-Rozas, E.; Bieling, C. Assessing, mapping, and quantifying cultural ecosystem services at community level. Land Use Policy 2013, 33, 118–129. [Google Scholar] [CrossRef] [Green Version]
- Burkhard, B.; Kroll, F.; Nedkov, S.; Müller, F. Mapping ecosystem service supply, demand and budgets. Ecol. Indic. 2012, 21, 17–29. [Google Scholar] [CrossRef]
- Hamilton, A.J.; Burry, K.; Mok, H.-F.; Barker, S.F.; Grove, J.R.; Williamson, V.G. Give peas a chance? Urban agriculture in developing countries. A review. Agron. Sustain. Dev. 2014, 34, 45–73. [Google Scholar] [CrossRef] [Green Version]
- Peng, J.; Liu, Z.; Liu, Y.; Hu, X.; Wang, A. Multifunctionality assessment of urban agriculture in Beijing City, China. Sci. Total Environ. 2015, 537, 343–351. [Google Scholar] [CrossRef] [PubMed]
- Xiao, W.; Zhao, G. Agricultural land land and rural-urban migration in China: A new pattern. Land Use Policy 2018, 74, 142–150. [Google Scholar] [CrossRef]
- Russo, A.; Cirella, G.T. Edible urbanism 5.0. Palgrave Commun. 2019, 5. [Google Scholar] [CrossRef]
- Beijing Municipal Bureau of Statistics; Beijing Survey Team of National Bureau of Statistics. Bulletin of National Economic and Social Development Statistics of Beijing in 2018; Bulletin of Beijing Municipal People’s Government: Beijing, China, 28 February 2019.
- China Weather Network Beijing Station. Beijing Topography and Flood Season Characteristics. Available online: http://www.weather.com.cn/beijing/sygdt/06/1898262.shtml?f_ww=1,2013-06-13/2020-02-12 (accessed on 15 January 2020).
- Feng, Z. Taking Stock of the Climate Characteristics of Beijing in 2019. Available online: http://bj.cma.gov.cn/xwzx/qxyw/202001/t20200115_1380086.html,2020-01-13/2020-02-12 (accessed on 15 February 2020).
- Beijing Municipal Bureau of Statistics. Ecological Bulletin. Available online: http://tjj.beijing.gov.cn/tjsj_31433/tjgb_31445/stgb_31450/ (accessed on 28 February 2020).
- Beijing Flower Technology Co., Ltd. Flower Garden. Available online: http://www.huaernc.com/ (accessed on 5 June 2018).
- Jia, K.; Li, Y.; Liang, S.; Wei, X.; Yao, Y. Combining estimation of green vegetation fraction in an arid region from Landsat 7 ETM+ data. Remote Sens. 2017, 9, 1121. [Google Scholar] [CrossRef] [Green Version]
- Li, J. It’s only natural. ChinAfrica 2018, 10, 30–31. [Google Scholar]
- Gulickx, M.M.C.; Verburg, P.H.; Stoorvogel, J.J.; Kok, K.; Veldkamp, A. Mapping landscape services: A case study in a multifunctional rural landscape in The Netherlands. Ecol. Indic. 2013, 24, 273–283. [Google Scholar] [CrossRef]
- Grafius, D.R.; Corstanje, R.; Harris, J.A. Linking ecosystem services, urban form and green space configuration using multivariate landscape metric analysis. Landsc. Ecol. 2018, 33, 557–573. [Google Scholar] [CrossRef] [Green Version]
- McGarigal, K.; Cushman, S.A.; Ene, E. FRAGSTATS: Spatial Pattern Analysis Program for Categorical Maps. 2012. Available online: http://www.umass.edu/landeco/research/fragstats/fragstats.html (accessed on 17 June 2017).
- Sinha, R.K.; Sharma, A. Landscape level disturbance gradient analysis in Daltonganj south forest division. J. Indian Soc. Remote Sens. 2006, 34, 233–243. [Google Scholar] [CrossRef]
- Mao, D.; Zhang, Y.C.; Kong, D.Z.; He, S.L.; Li, X.Y. Evaluation of urban multi-scale landscape ecological pattern based on open space classification: A case study in xinxiang, China. Appl. Ecol. Environ. Res. 2018, 16, 6787–6799. [Google Scholar] [CrossRef]
- Kim, J.-H.; Li, W.; Newman, G.; Kil, S.-H.; Park, S.Y. The influence of urban landscape spatial patterns on single-family housing prices. Environ. Plan. B Urban Anal. City Sci. 2018, 45, 26–43. [Google Scholar] [CrossRef] [PubMed]
- Kirkpatrick, J.B.; Davison, A. Home-grown: Gardens, practices and motivations in urban domestic vegetable production. Landsc. Urban. Plan. 2018, 170, 24–33. [Google Scholar] [CrossRef]
- Orsini, F.; Kahane, R.; Nono-Womdim, R.; Gianquinto, G. Urban agriculture in the developing world: A review. Agron. Sustain. Dev. 2013, 33, 695–720. [Google Scholar] [CrossRef] [Green Version]
- Saeumel, I.; Reddy, S.E.; Wachtel, T. Edible city solutions-one step further to foster social resilience through enhanced socio-cultural ecosystem services in cities. Sustainability 2019, 11, 972. [Google Scholar] [CrossRef] [Green Version]
- Krikser, T.; Zasada, I.; Piorr, A. Socio-economic viability of urban agriculturea comparative analysis of success factors in germany. Sustainability 2019, 11, 1999. [Google Scholar] [CrossRef] [Green Version]
- La Rosa, D.; Barbarossa, L.; Privitera, R.; Martinico, F. Agriculture and the city: A method for sustainable planning of new forms of agriculture in urban contexts. Land Use Policy 2014, 41, 290–303. [Google Scholar] [CrossRef]
- Scott, A.; Dean, A.; Barry, V.; Kotter, R. Places of urban disorder? Exposing the hidden nature and values of an English private urban allotment landscape. Landsc. Urban Plan. 2018, 169, 185–198. [Google Scholar] [CrossRef] [Green Version]
- Yoshida, S.; Yagi, H.; Kiminami, A.; Garrod, G. Farm diversification and sustainability of multifunctional peri-urban agriculture: Entrepreneurial attributes of advanced diversification in Japan. Sustainability 2019, 11, 2887. [Google Scholar] [CrossRef] [Green Version]
- Tappert, S.; Kloti, T.; Drilling, M. Contested urban green spaces in the compact city: The (re-)negotiation of urban gardening in Swiss cities. Landsc. Urban Plan. 2018, 170, 69–78. [Google Scholar] [CrossRef]
- Prove, C.; Dessein, J.; de Krom, M. Taking context into account in urban agriculture governance: Case studies of Warsaw (Poland) and Ghent (Belgium). Land Use Policy 2016, 56, 16–26. [Google Scholar] [CrossRef] [Green Version]
- The Research Group on Urbanization and Rural Migrant Workers in China. Cheng Zhen Hua Jin Cheng Zhong Nong Cun Lao Dong Li Zhuan Yi: Zhan Lue Jue Ze Yu Zheng Ce Si Lu. Chin. Rural Econ. 2011, 6, 4–14. [Google Scholar]
- Contesse, M.; van Vliet, B.J.M.; Lenhart, J. Is urban agriculture urban green space? A comparison of policy arrangements for urban green space and urban agriculture in Santiago de Chile. Land Use Policy 2018, 71, 566–577. [Google Scholar] [CrossRef]
- Peng, J.; Zhao, S.Q.; Tian, L.; Liu, Y.X.; Liu, Z.C. The dynamicas of mulit-functionality of urban agriculture, a case study of Beijing city. Chin. J. Agric. Resour. Reg. Plan. 2016, 37, 152–158. [Google Scholar]
- UN Habitat. Planning Sustainable Cities—Global Report on Human Settlements 2009. Available online: https://mirror.unhabitat.org/content.asp?typeid=19&catid=555&cid=5607 (accessed on 15 January 2020).


| Landscape Services | Definition |
|---|---|
| Education | Enables people to consciously increase their knowledge about agricultural culture through popular science information boards and close contact with agriculture landscape. |
| Exercise | Improves health and physical strength through agricultural activities. |
| Natural experience | Provides a place that makes people feel connected to nature. |
| Social cohesion | Enables people to enhance their relationship with companions through cooperation in agricultural cultivation. |
| Recreation | Creates a suitable atmosphere through landscaping to regulate and relax people’s bodies and minds. |
| Countryside life | Provides a place away from the hustle and bustle of the city for a while, and allows self-sufficiency. |
| Scenery services | The landscape created is natural and beautiful. |
| Indicators | Education | Exercises | Natural Experience | Social Cohesion | Recreation | Countryside Life | Scenery |
|---|---|---|---|---|---|---|---|
| SIMI | √ | √ | |||||
| LSI | √ | √ | √ | ||||
| CA | √ | √ | |||||
| LPI | √ | ||||||
| MSI | √ | ||||||
| Questionnaires | √ | √ | √ | √ | √ | √ | √ |
| Types of Prosperities | Categories | Total (%), n = 345 |
|---|---|---|
| Income (CNY) | 0–6000 | 0.0 |
| 6000–12,000 | 27.7 | |
| 12,000–18,000 | 42.6 | |
| 18,000–24,000 | 16.6 | |
| 24,000–30,000 | 12.5 | |
| Above 30,000 | 0.7 | |
| Education | Technical secondary school | 3.5 |
| College degree | 7.0 | |
| Bachelor’s degree | 57.0 | |
| Master’s degree | 23.3 | |
| Doctor’s degree | 9.3 | |
| Age | 21–30 | 9.3 |
| 31–40 | 31.4 | |
| 41–50 | 39.5 | |
| 51–60 | 14.0 | |
| >60 | 5.8 |
| Age | Education | Frequency of Visiting per Week | The Duration of Stay | The Way to Visit the Garden | Companion | |
|---|---|---|---|---|---|---|
| Education | 0.003 | 0.385 ** | 0.038 | −0.094 | 0.057 | −0.047 |
| Exercise | 0.446 ** | 0.013 | −0.136 | 0.323 ** | −0.230 * | −0.216 * |
| Natural experience | 0.113 | 0.201 * | 0.057 | 0.071 | −0.180 | 0.042 |
| Social cohesion | 0.140 | 0.001 | −0.066 | 0.287 ** | −0.021 | −0.037 |
| Recreation | 0.290 ** | 0.097 | −0.026 | 0.169 | −0.003 | 0.002 |
| Countryside life | 0.341 ** | 0.112 | −0.071 | 0.297 ** | −0.183 * | −0.126 |
| Scenery service | 0.025 | 0.153 | 0.196 * | 0.285 ** | −0.121 | 0.041 |
© 2020 by the authors. Licensee MDPI, Basel, Switzerland. This article is an open access article distributed under the terms and conditions of the Creative Commons Attribution (CC BY) license (http://creativecommons.org/licenses/by/4.0/).
Share and Cite
Xie, M.; Li, M.; Li, Z.; Xu, M.; Chen, Y.; Wo, R.; Tong, D. Whom Do Urban Agriculture Parks Provide Landscape Services to and How? A Case Study of Beijing, China. Sustainability 2020, 12, 4967. https://doi.org/10.3390/su12124967
Xie M, Li M, Li Z, Xu M, Chen Y, Wo R, Tong D. Whom Do Urban Agriculture Parks Provide Landscape Services to and How? A Case Study of Beijing, China. Sustainability. 2020; 12(12):4967. https://doi.org/10.3390/su12124967
Chicago/Turabian StyleXie, Miaomiao, Manyu Li, Zhaoyang Li, Meng Xu, Yan Chen, Ran Wo, and De Tong. 2020. "Whom Do Urban Agriculture Parks Provide Landscape Services to and How? A Case Study of Beijing, China" Sustainability 12, no. 12: 4967. https://doi.org/10.3390/su12124967
APA StyleXie, M., Li, M., Li, Z., Xu, M., Chen, Y., Wo, R., & Tong, D. (2020). Whom Do Urban Agriculture Parks Provide Landscape Services to and How? A Case Study of Beijing, China. Sustainability, 12(12), 4967. https://doi.org/10.3390/su12124967