Article

Energy Efficiency: Indicator, Estimation, and a New Idea

1
Department of Applied Economics and Management, National Ilan University, Yilan City, Yilan County 260, Taiwan
2
Department of Economics, Wichita State University, Wichita, KS 67260, USA
3
Department of Applied Economics, Fo-Guang University, Jiaoxi Township, Yilan County 262, Taiwan
4
Department of International Business Administration, Rajamangala University of Technology Thanyaburi Pathum Thani 12110, Thailand
5
Investment Office of Yilan Science Park, Hsinchu Science Park Bureau, Ministry of Science and Technology Hsinchu City, Hsinchu City 300, Taiwan
*
Author to whom correspondence should be addressed.
Sustainability 2020, 12(12), 4944; https://doi.org/10.3390/su12124944
Submission received: 17 May 2020 / Revised: 7 June 2020 / Accepted: 12 June 2020 / Published: 17 June 2020
(This article belongs to the Section Economic and Business Aspects of Sustainability)

Abstract

:
Energy efficiency has long been an important issue to the global economic and political theaters; however, searching for an effective and concise measure for efficiency remains a contentious and intriguing topic. There are two obvious flaws with the commonly used metrics in existing literature. First, there is a sense of confusion and misunderstanding between the definitions of energy efficiency and efficacy. As a result, the formulae and methods for measuring efficiency are often the subject of criticism. Second, even if the definition of efficiency is clear, the method of estimation can be quite cumbersome, making it difficult to comprehend or implement. This study attempts to address these two issues. With an OECD comparative dataset, it first presents the contradiction between efficiency and efficacy, explains the loss of effectiveness with the existing measurements, and then proposes a new and easy-to-use method for gauging energy efficiency, so that the succinctness and robustness of the measurement can be re-established. The paper serves as a guide to those who are interested in the controversial issues related to measuring energy efficiency. Both practitioners and policy makers will find an easy and reliable tool from this paper for measuring energy efficiency.

1. Introduction

Throughout the progression of human civilization, the need for and dependency on energy has become irreplaceable. This was especially the case after the Industrial Revolution, bringing in continuous inventions with the application of machinery and equipment. However, the inherent limitation of the energy supply has made energy discovery, regeneration, and conservation the three major concerns in the energy community. Among them, energy efficiency is often used by the public as a representation of energy conservation, making its importance self-evident.
Energy efficiency is a conceptual term. It has been widely and frequently applied by the public in their daily lives. For example, people may say that a car has lower fuel consumption; an air-conditioning device has a better cooling effect and it saves electricity; or a certain type of light bulb is brighter, has a longer life, and saves electricity. However, energy efficiency cannot be just a vague and ambiguous concept, lacking exact measurements. It needs to have a clear indicator and estimation method. For instance, to demonstrate the energy efficiency of a refrigerator, the government regulatory agency in Brazil uses a relative ratio of the effective internal volume, including the fridge and freezer, to the residential consumption of electricity [1]. To show the energy efficiency of the equipment in a plant, manufacturing industries in developed and developing countries often use the amount of output created by one energy input as an indicator [2]. To enhance energy efficiency and environmental performance of industrial products, Landi, Capitanelli, and Germani [3] incorporated the concept of virtual prototyping into eco-design, testing, and labeling phases of products, and proposed a numerical simulation analysis to measure the energy and time savings for enterprises. To evaluate and improve energy efficiency for residential buildings, Germani, Landi, and Rossi [4] developed a strategy to examine the economic and environmental impacts of the renewable electricity generation and electrochemical storage system. Landi, Castorani, and Germani [5] suggested a novel approach to analyzing energy flow, environmental impact, and the cost of a new modular integrated system, featuring a renewable energy power generation and smart electrochemical storage unit. This system helps make automatic production and self-consumption of electricity possible in residential buildings. To monitor and assess energy efficiency, Capitanelli, Germani, Landi, and Papetti [6] proposed a new knowledge-based tool to simulate the genuine behavior of residential buildings, concurrently considering all members and their interaction rules.
Several other scholars have also devoted themselves to the study of energy efficiency from different perspectives. In a review article, Tahir, Nadeem, Ahmed, Khan, and Qamar [7] expressed their concerns about energy efficiency, resulting from the efficacy of energy storage systems. Based on a comparative analysis, they endorsed the advantage of a hybrid-energy-storage-system and provided some implications derived from using microgrids. Hardisty, Shim, Sun, and Griffin [8] conducted a series of lab studies on the response of consumers’ willingness to purchase energy-efficient products. They confirmed that the psychological mechanism mattered to consumers when selecting energy-efficient products. Nevertheless, in light of the overall allocation of resources, economists often use the extent of energy over-consumption as a measure of energy efficiency [9].
Regardless of the aforementioned concepts or measures, energy efficiency appears to be regarded as a general term. When its measurement is in question, the lack of a clear definition may cause the results to vary and can result in them being difficult to evaluate, depending on the various needs or goals. Evidently, there is a need for a precise definition of energy efficiency, as well as an effective classification and clarification of measuring methods. Throughout this, there is a silver lining, however. A possible solution could come from a systematic examination of the existing connotations, indicators, and methods of estimating energy efficiency. This paper will divide “energy efficiency” into two categories. The first category is the efficacy of energy consumption, which is a quotient of dividing energy input (or energy consumption cost) by total benefit (or total operating cost). This quotient measures the contribution of each unit of energy input to the total benefit. The higher the quotient, the lower the energy consumption efficacy; please note that this definition is fairly similar to energy productivity. The second category entails the definition of energy economic efficiency, which measures the relative value of optimal and actual energy consumption. Based on the premise of the existing conditions, this method estimates the gap between the actual energy input and the least potential (that is, the most effective) energy input. The smaller the gap, the higher the economic efficiency. A ratio between 0 and 1 can easily be created, if one number is divided by another. Consequently, the dichotomous definition of energy efficiency assists with developing indicators and a means of estimation for gauging energy efficiency.
This paper has two main goals, with the first being to present an effective and comprehensive summary, classification, and clarification for the commonly adopted concepts and methods in the measurement of energy efficiency, based on the dichotomy between efficacy and efficiency. The second goal is the proposal of a reasonable and concise new method for the estimation of energy efficiency. To reaffirm the applicability of the new method, this paper examines and compares the empirical estimations of an international dataset. This paper is organized into four sections. After this introductory section, Section 2 summarizes the existing methods and presents new ideas for measuring energy efficiency. Section 3 covers empirical applications, including data collection, model estimation, and a comprehensive explanation of the results. Section 4 provides a brief conclusion to the paper.

2. The Measurements of Energy Efficiency

2.1. Common Measurements

“Energy efficiency” is a conceptual term that is commonly used across a wide range of areas such as engineering, architectural design, production activities, management, organization, economics, and numerous important policy design and development initiatives [10]. However, due to the multi-disciplinary nature of this definition, the meaning may vary depending on the domain, target, or purpose of use. This often causes confusion, not only to novices in this field, but also to regular users of the definition. Factually and in all fairness, efficiency means efficiency: it is a neutral term. As such, the meaning should remain unbiased and not vary by fields.
According to the Merriam-Webster’s Dictionary, efficiency means effective operation, as measured by a comparison of production with cost (as in energy, time, and money) [11]. When considering energy efficiency, the International Energy Agency defines something to be more energy efficient when it is able to provide more services with the same energy input or provide the same services with less energy input [12].
There are two core components in these two authoritative and classical definitions of an effective measurement of energy efficiency. The first is the comparison of output and input; the other is the comparison of output (service) for a given input (more or less), or the comparison of inputs for a given output (service). At this point, the proposition should have clearly converged at the focus of “comparison”, with the problem being the object for comparison, that is, “whom to compare with”. Accordingly, to introduce the methods for measuring energy efficiency, it is natural to divide the subject into two main categories: energy-consumption-efficacy-indicator (ECEI) and energy-economic-efficiency-estimate (EEEE).
Before discussing the methodology, we use Figure 1, a block diagram, to summarize the structure of this study and to enhance the readability of this article. Starting with this section, this paper proposes a dichotomy and divides the common measurement of energy efficiency into energy-consumption-efficacy-indicator (ECEI) and energy-economic-efficiency-estimate (EEEE). Equations (1) to (5) will discuss the concept of the former, while Equations (6) and (7) explain the idea of the latter. The methodology of EEEE has evolved into two main streams: data envelopment analysis (DEA) and stochastic frontier analysis (SFA). Equation (8) will illustrate the concept of DEA, while Equations (9) and (10) interpret the idea of SFA. This paper works along the path of SFA, uses Equations (11) to (18) to derive a new measurement, and applies Equation (19) to obtain a corresponding econometric model.

2.1.1. Energy-Consumption-Efficacy-Indicator

As in Equation (1), the ECEI is based on the comparison of two core components: output and input. The basic form of this definition is as follows [12]:
E C E I i = Q i E i
In the above formula, the subscript i represents the object to be measured, such as equipment, an enterprise, or an economy. The denominator E refers to the energy input consumption, such as the total amount or value of input. We use the word “total” in the denominator because the type of energy consumption may not be monotonous. One can obtain the total when oil, electricity, gas, and coal are converted into thermal oil equivalents and then summed up. When market price or average unit cost is multiplied in the calculations, we get the total value. The numerator Q refers to the total efficacy produced after energy consumption, such as total output value, total output quantity, total distance, total space, or total time. There are two reasons for using the word “total” in the numerator. First, for the specific measurement of object i, it may produce more than one variety or type of output. In the case of enterprises, the products may be non-uniform and diversified. Second, energy alone cannot be used to produce efficacy [13]. It needs to work together with other input elements. Therefore, the general meaning of Equation (1) is the same as its mathematical implication. It measures the output that can be brought about by each unit of energy input. If factor productivity means the benefits created by using inputs, Equation (1) is very similar to the energy productivity formula, which measures the efficacy produced by energy consumption. In the literature put forward by Atakhanova and Howie [14], the concept of energy productivity is used to analyze the industrial, service, and household electricity demands of Kazakhstan during 1994–2003. Furthermore, Miketa and Mulder [2] analyzed energy productivity for 10 manufacturing industries in 56 economies during 1971-1995. The use of energy productivity as a measure of energy efficiency can also be found in the work of Patterson [15].
The ECEI measurement method, as in Equation (1), has both advantages and disadvantages. The advantage is that it is easy to understand and calculate while not requiring complicated derivation from statistical and mathematical models. It takes only simple arithmetic to perform this measurement. The disadvantage is that even though the indicator shows the average energy efficiency, it lacks clear and independent criteria for distinguishing high and low performance. Thus, there is no clear basis for comparison. As a result, this indicator often needs to rely on its own past record, other targets, or a designated performance criterion. Therefore, extensions of Equation (1) naturally occurred.
Equation (2) shows the extension of ECEI, based on its own past, to help determine the efficacy level. In the formula, the target remains as i, but the previous period t−1 is the basis of comparison [11]. With this extension, the index shows the amount of output change, as a result of each additional unit of energy consumption. The latter concept is very similar to the marginal output of energy. The index can also be used to calculate energy productivity over time, which is a meaningful method of measuring changes in intertemporal energy productivity.
E C E I i = Q i , t Q i , t 1 E i , t E i , t 1 = Δ Q i Δ E i ,   o r   E C E I i = Q i , t E i , t / Q i , t 1 E i , t 1
Equation (3) is an extended version of ECEI based on more than one object, or with a specific performance criterion to judge the level of energy efficacy. Subscript j denotes a target other than i, and subscript s denotes a specific performance criterion. The resulting indicators can directly illustrate whether energy productivity is higher or lower relative to other targets or performance criteria.
E C E I i = Q i E i / Q j E j ,   o r   E C E I i = Q i E i / Q s E s ,   i j ,   i s
An article written by Bakar, Hassan, Abdullah, Rahman, Abdullah, Hussin, and Bandi [16] discusses the energy performance of buildings by making note of the referenced building for the construction of energy efficiency indicators (EEI). Cai, Liu, Dinolov, Xie, Liu, and Tuo [17] also discussed methods for energy efficiency through benchmarking.
The basic form of ECEI has other variations as well, which built upon the concept represented in Equation (1) and are based on the need for comparison. Generally, ECEI does not deviate from the formulae represented by Equations (4) and (5). Equation (4) is the reciprocal of Equation (1), simply inverting the numerator and the denominator. It can be interpreted as the average consumption of energy input per unit of output. In fact, such a concept is very similar to energy intensity.
E C E I i = E i Q i
Equation (5) can be regarded as a re-extension of Equation (4). It is based on the symmetry of production and cost: the total output corresponding to the total cost, and the energy input consumption (EC) corresponding to the total energy cost (TC). The ratio can be interpreted as the proportion of total cost used for energy. This concept is largely in line with the measurement of energy cost intensity or energy cost share.
E C E I i = E C i T C i
The concepts described in Equations (4) and (5) are common applications in the fields of processing, construction, and household appliances. Farla and Blok [18] constructed energy intensity indicators to explore industrial energy policy and carbon emissions issues in the Netherlands from 1980 to 1995. Heiple and Sailor [19] used energy use intensity to predict electricity consumption and analyze the implication of energy consumption. Sheng, Miao, Zhang, Lin, and Ma [20] examined the pattern of energy consumption of five-star hotels in China, explained the differences in energy use intensity between different climate zones, and pointed out the significance of energy consumption benchmarks in promoting building energy efficiency.

2.1.2. Energy-Economic-Efficiency-Estimate

The shortcoming of ECEI, mentioned in the previous subsection, is that it does not provide a guideline for independent judgment. This was the reason for an extension of measurement using Equations (2) and (3). Even so, it is still not an ideal measure of energy efficiency. From a different perspective, EEEE is an effective solution to energy efficiency comparison, which does not rely on the past, other targets, or a specified performance level. It focuses on itself and current conditions.
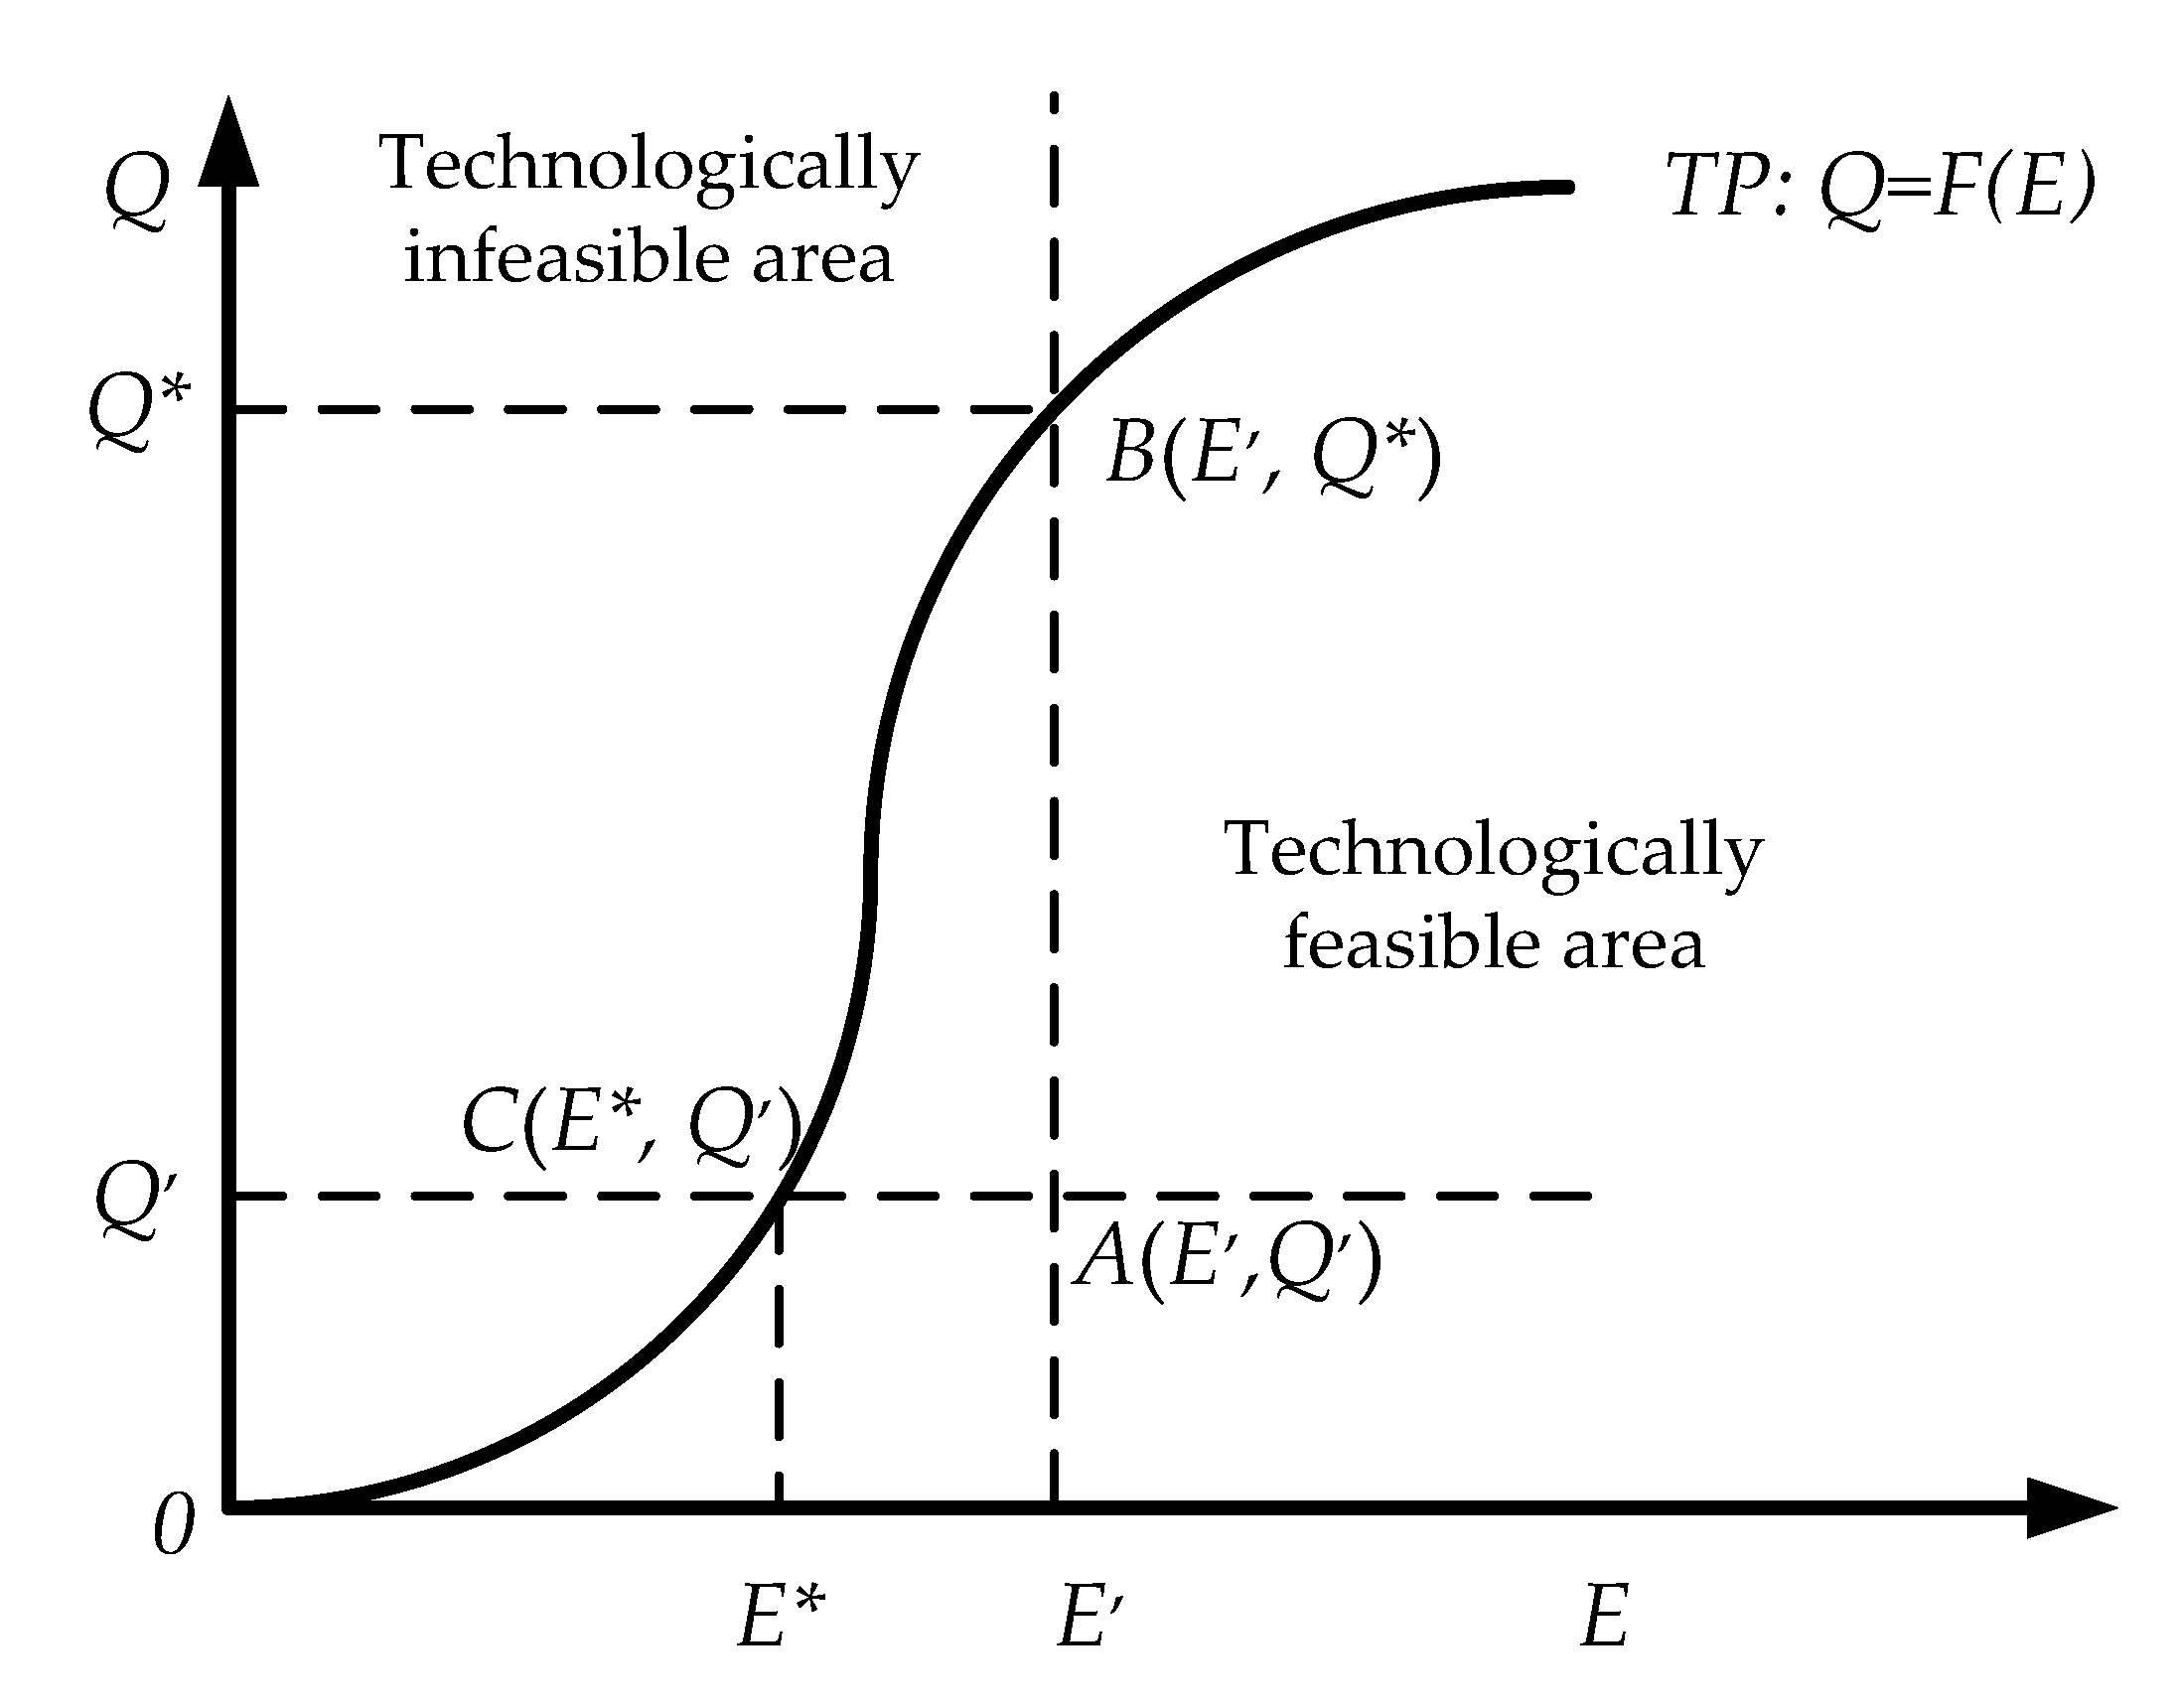
Based on the theory of economic efficiency analysis, the concept of radial distance of Farrell [21] can be illustrated in Figure 2. The horizontal axis in the figure is the consumption of energy input E, while the vertical axis is the total output Q. The line TP shows the functional relationship between factor input and total output, thereby indicating the theoretical level of Q at any given level of E. The line TP represents the technical frontier, and the area above it is the output level that cannot be achieved under the existing technical capabilities. The area below the line is an attainable output level, which is not yet achieved. Suppose there is an input-output combination at point A which corresponds to an actual energy input consumption E’ and an actual output level Q’. Under the same level of input E’, the input-output combination on the corresponding frontier is B, corresponding to the maximum output level Q*. Accordingly, the economic efficiency measured by the output will be:
E E E E i O = Q E / Q * E = Q Q *
The superscript “O” in Equation (6) represents the output. Using the maximum energy productivity as a benchmark, the implication of this measure is that the actual energy productivity gives the exact production efficiency of Q’/Q*. The value falls between 0 and 1. Unfortunately, the result obtained from this formula is short of meeting the demand for finding an energy efficiency measurement. The reason for this is clear: output measurement gives only the production efficiency. Conversely, energy efficiency could be obtained if we measure the input surface. In this case, for the same input-output combination A, the actual energy consumption input is E’, and the actual output level is Q’. If Q’ is held unchanged, the input-output combination on the corresponding frontier is C, and the minimum energy input consumption should be E*. The economic efficiency measured by the input side will be:
E E E E i I = Q E / Q E * = E * E
The superscript “I” in Equation (7) represents the input. The measure is based on the comparison of the actual energy productivity to the highest energy productivity (the benchmark). Thus, the formula gives a genuine measure of energy efficiency E*/E, and its value lies between 0 and 1. Interestingly, the results of this formula are more in line with the intuition of energy efficiency measurement. Moreover, they more completely define the two core components of energy efficiency: the comparison of output and input, as well as the comparison of input used, given an output (service) level.
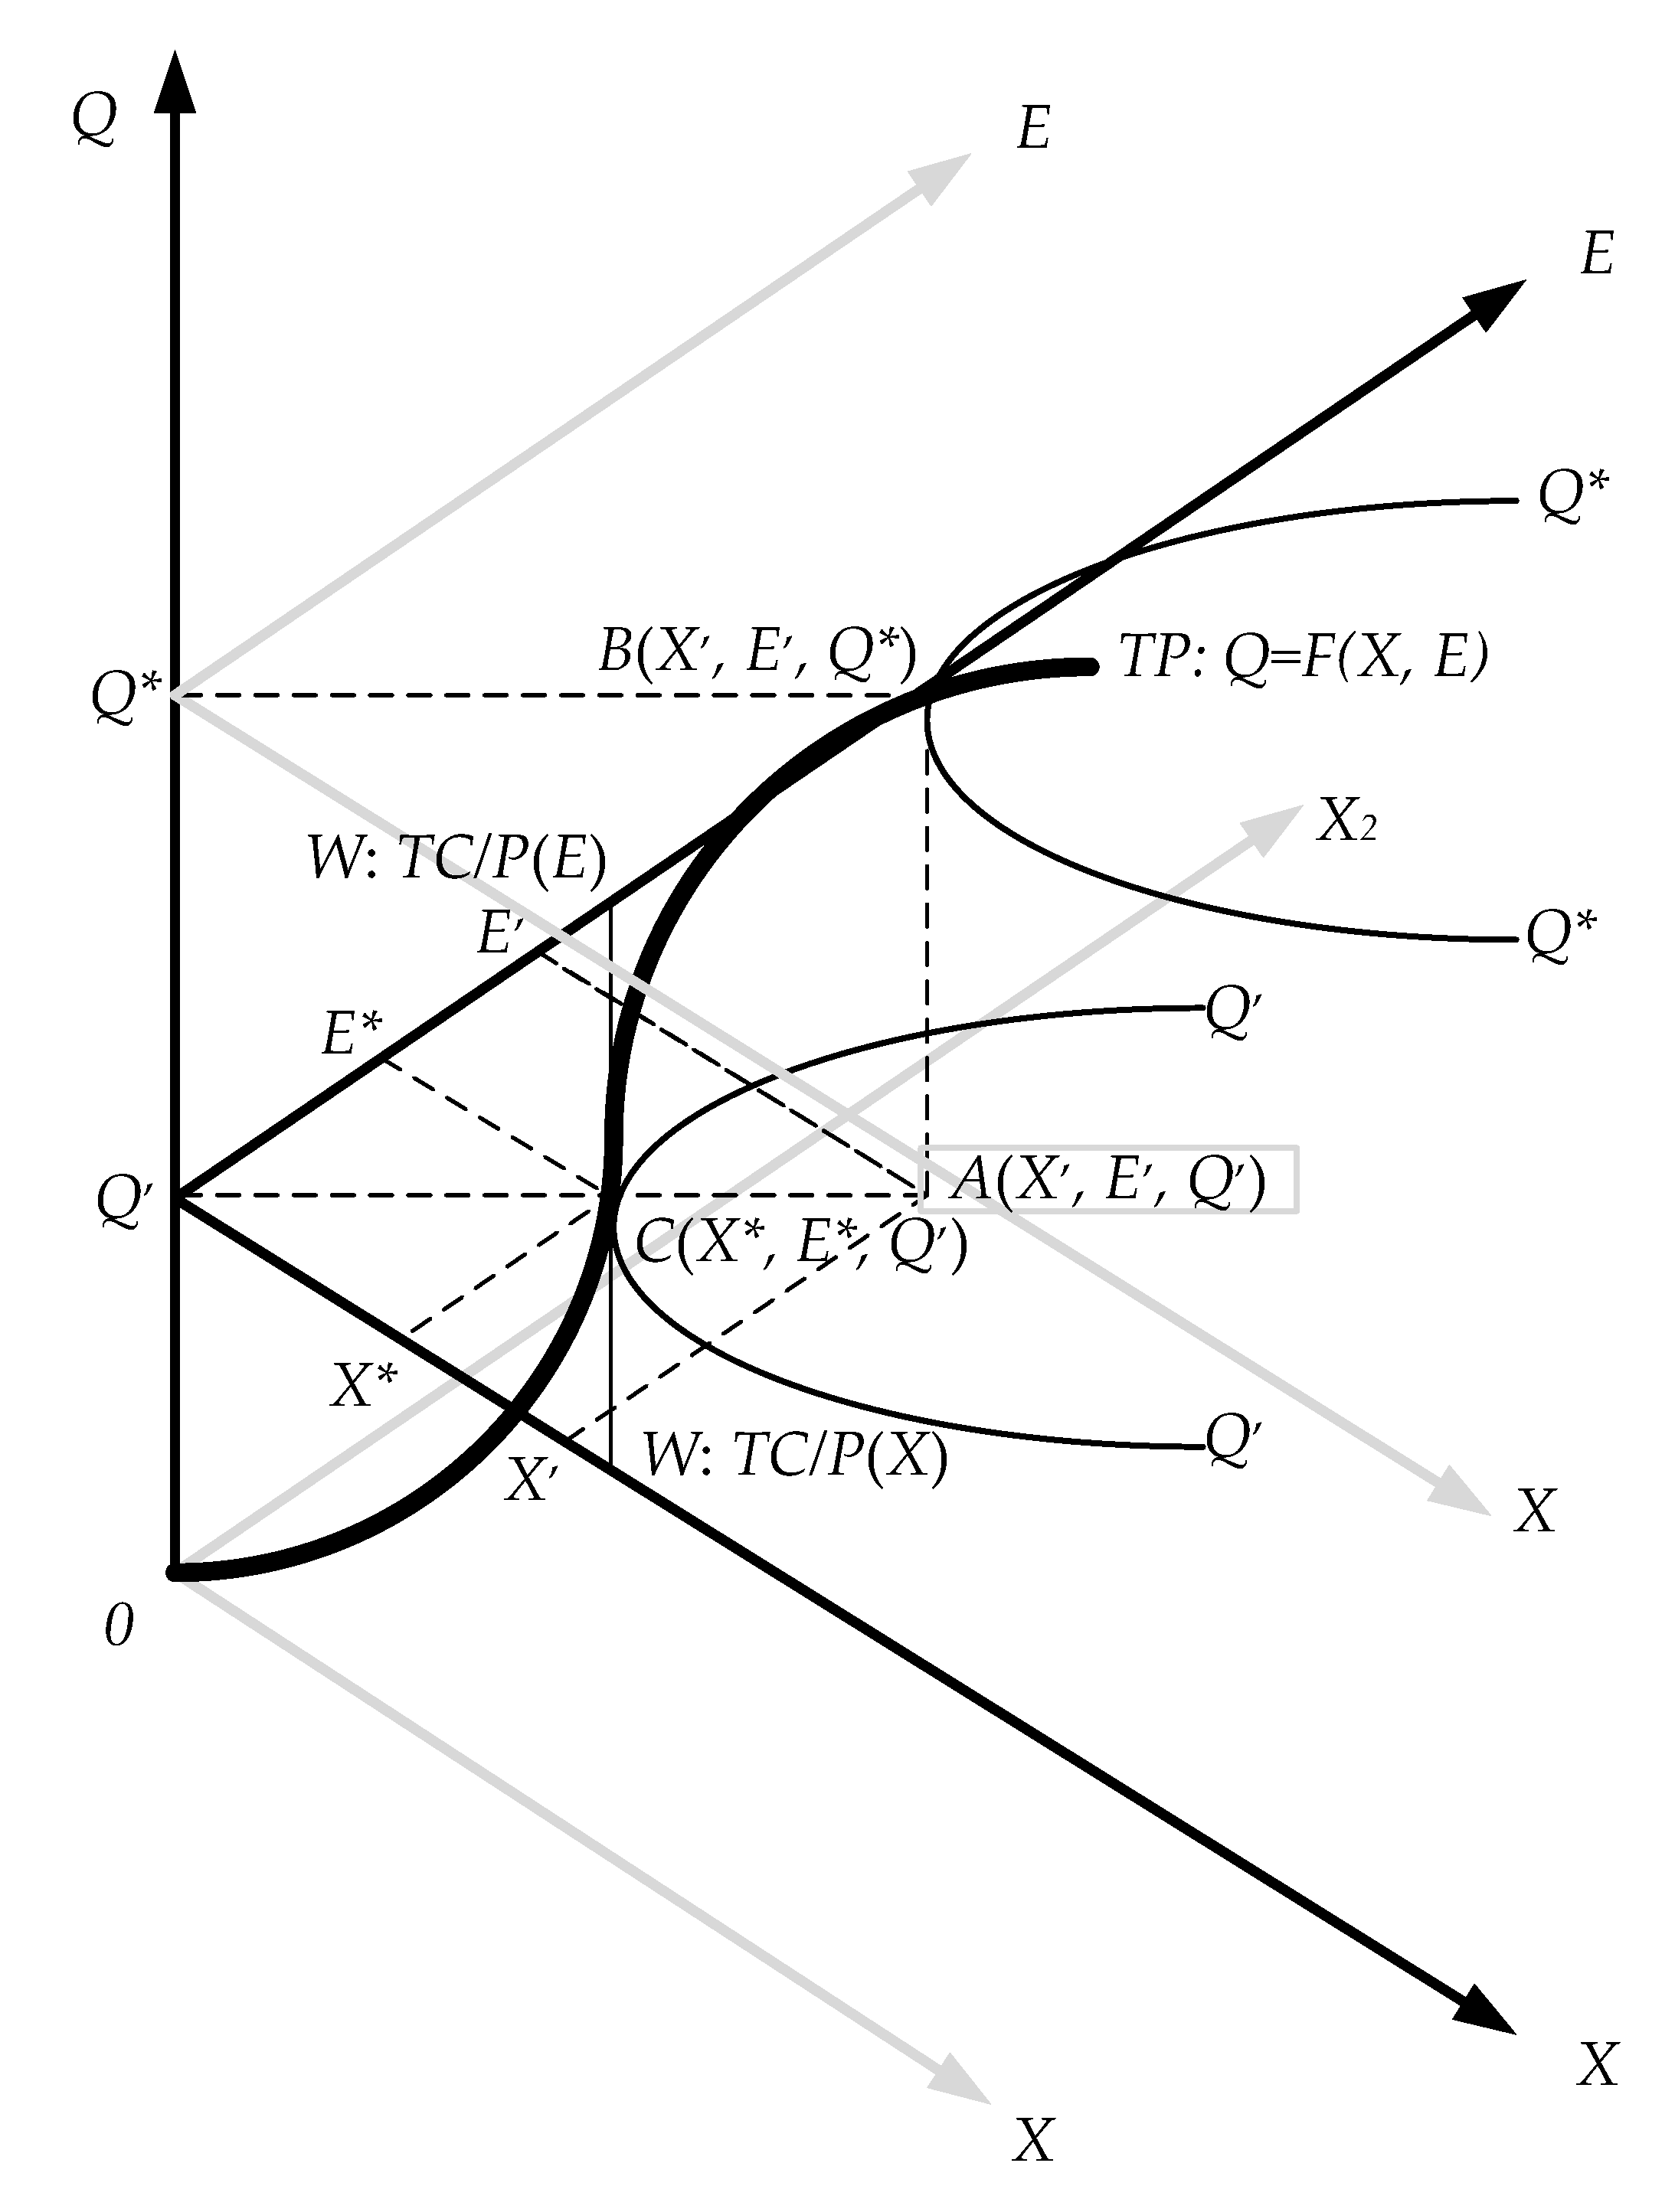
Thus far, the basic concept of EEEE has been roughly constructed, yet two follow-up conundrums still need to be addressed. First, energy alone cannot be used to produce output. This implies that using energy as a single input, as displayed in Figure 2, needs to be expanded into a multiple-input scenario. Second, the construction of a technical frontier needs to be decided on. This will involve developing an estimation method, which is the reason why EEEE is proposed. Figure 3, a three-dimensional diagram, is intended to help deal with these two challenges and to expand into a multiple-input scenario. The horizontal axis in the figure has two types of inputs, E for energy and X for other inputs. The vertical axis is the total output Q. At the output level of Q’, the actual production point is A, and the inputs used are E’ and X’. The iso-quant at this time is Q’Q’, the iso-cost line is WW, and the equilibrium point falls on C. For the same output level Q’, the minimum achievable inputs with the given technology are E* and X*, respectively. Therefore, the energy economic efficiency can be measured by Equation (7).
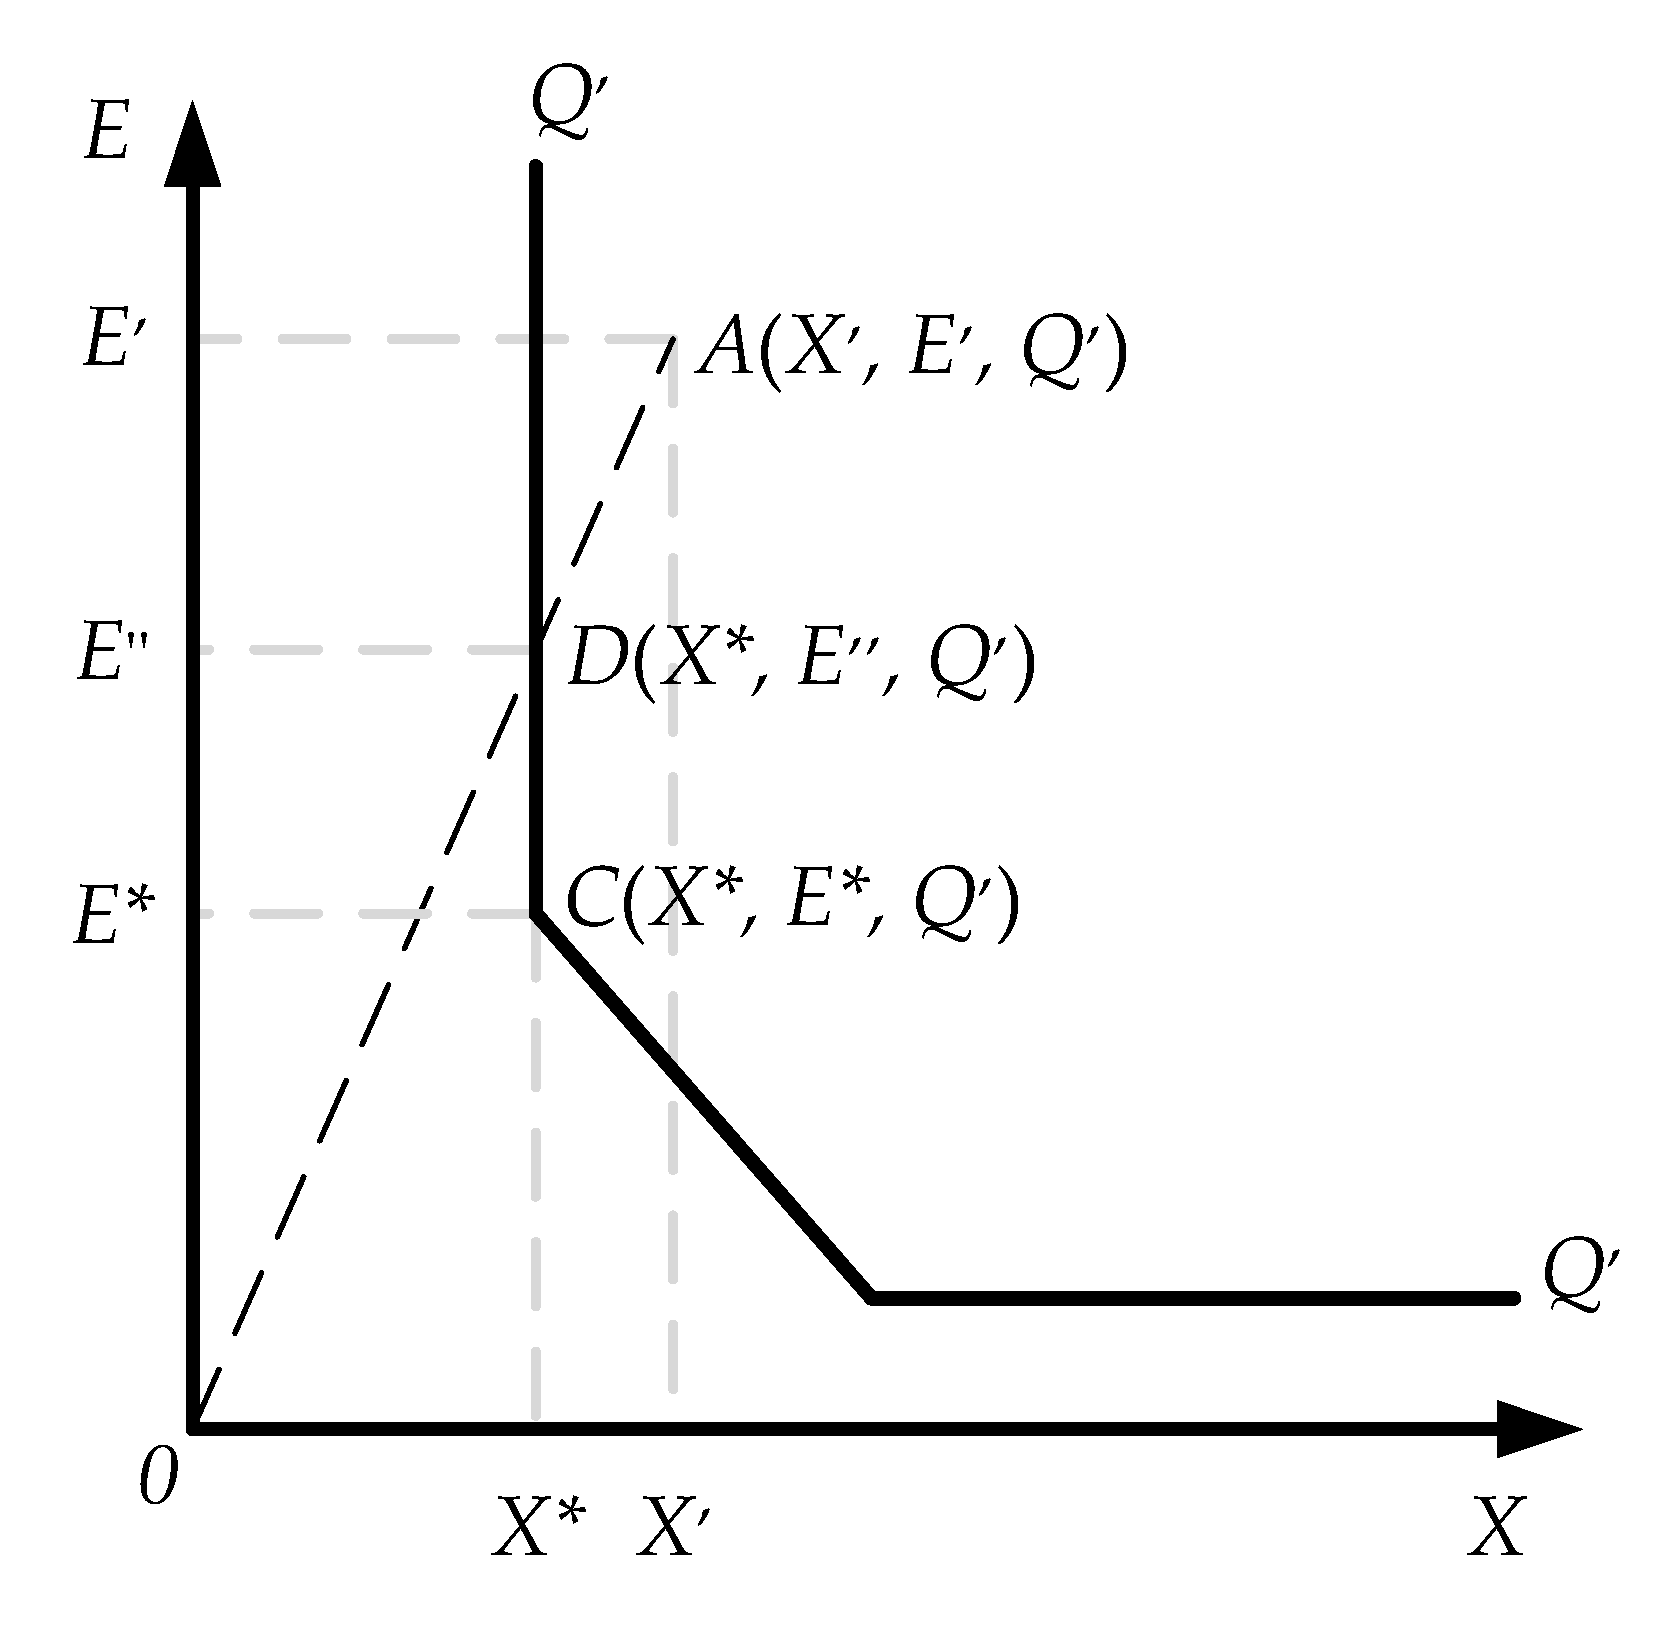
To construct and estimate the technical frontier, the most common estimation methods in the literature can be divided into two categories: data envelopment analysis (DEA) and stochastic frontier analysis (SFA). If we view Figure 3 from the top down and use the DEA measurement concept, we obtain Figure 4. The vertical axis is the energy input (E), the horizontal axis is the other input (X), and Q’Q’ is a conceptualized iso-quant. Point A represents the actual production point of a particular decision-making unit (DMU), using inputs X’ and E’ to obtain output Q’. Ray OA connects the origin and point A and its intersection point D, with Q’Q’ being a technical efficiency point; this means that the same output Q’ can be obtained with less input X* and E”. Therefore, the technical efficiency for point A can be measured as OD/OA, and the distance from point A to point D is called the “radial adjustment”. Purely in terms of energy, the energy input saved can be measured by E’E”. It can also be seen from Figure 4 that, if point D can be moved to point C again, while keeping output at Q’ and input at X*, the use of energy input can be further reduced. The saving of E”-E* is called the “slack adjustment”. Consequently, the literature names E* the “target energy input”, and E’ the “actual energy input”. Hu and Wang [13] called this the “total factor energy input (TFEE)”, a ratio which is essentially the same as EEEE, as shown in Equation (7).
With the above measurement concepts, the remaining tasks are the estimation of the technical frontier and efficiency values. Referring to Hu and Wang [13] and Hu and Kao [22], DEA proposes that the technical frontier is the envelope curve of all DMUs, and the efficiency value is the ratio of the actual point to the corresponding point of the frontier. With a classical constant return to scale model [23], we set the linear programming problem as follows:
M i n λ , θ   θ S u b j e c t   t o : { Q i + Q λ 0 θ H i H λ 0 λ 0
where i represents the i-th DMU and i goes from 1, 2, …, to N; Q is the output, and there are 1, 2, …, and M different products. Together, these constitute a M x N matrix. H is the input, and there are 1, 2, …, and J inputs. The energy input E and other inputs Xs give a J x N matrix. λ is the weight vector of N x 1. Then, the obtained θ is the solution of production efficiency. When multiplying the energy input by (1-θ), we can obtain the radial adjustment, which is a measure of energy saving. Recently, a number of extended studies have been based on the DEA method (such as [24,25,26,27,28,29,30,31]).
There are a number of advantages and disadvantages when using DEA in the estimation of EEEE. The major advantage is that the calculation process and results of linear programming are clear and straightforward. There is no ambiguity with result interpretation; it requires only the input and output in its estimation and is easily applicable to a multi-output scenario. However, there are two disadvantages to using this estimation technique. One is that the cost line WW is ignored when transforming from Figure 3 to Figure 4, even if the slack adjustment is included. Second, the calculation of the slack adjustment is based on a straight line. This is an inherited problem caused by the use of linear programming. It also indicates how restrictive a priori assumptions and compromises can be on frontier estimation.
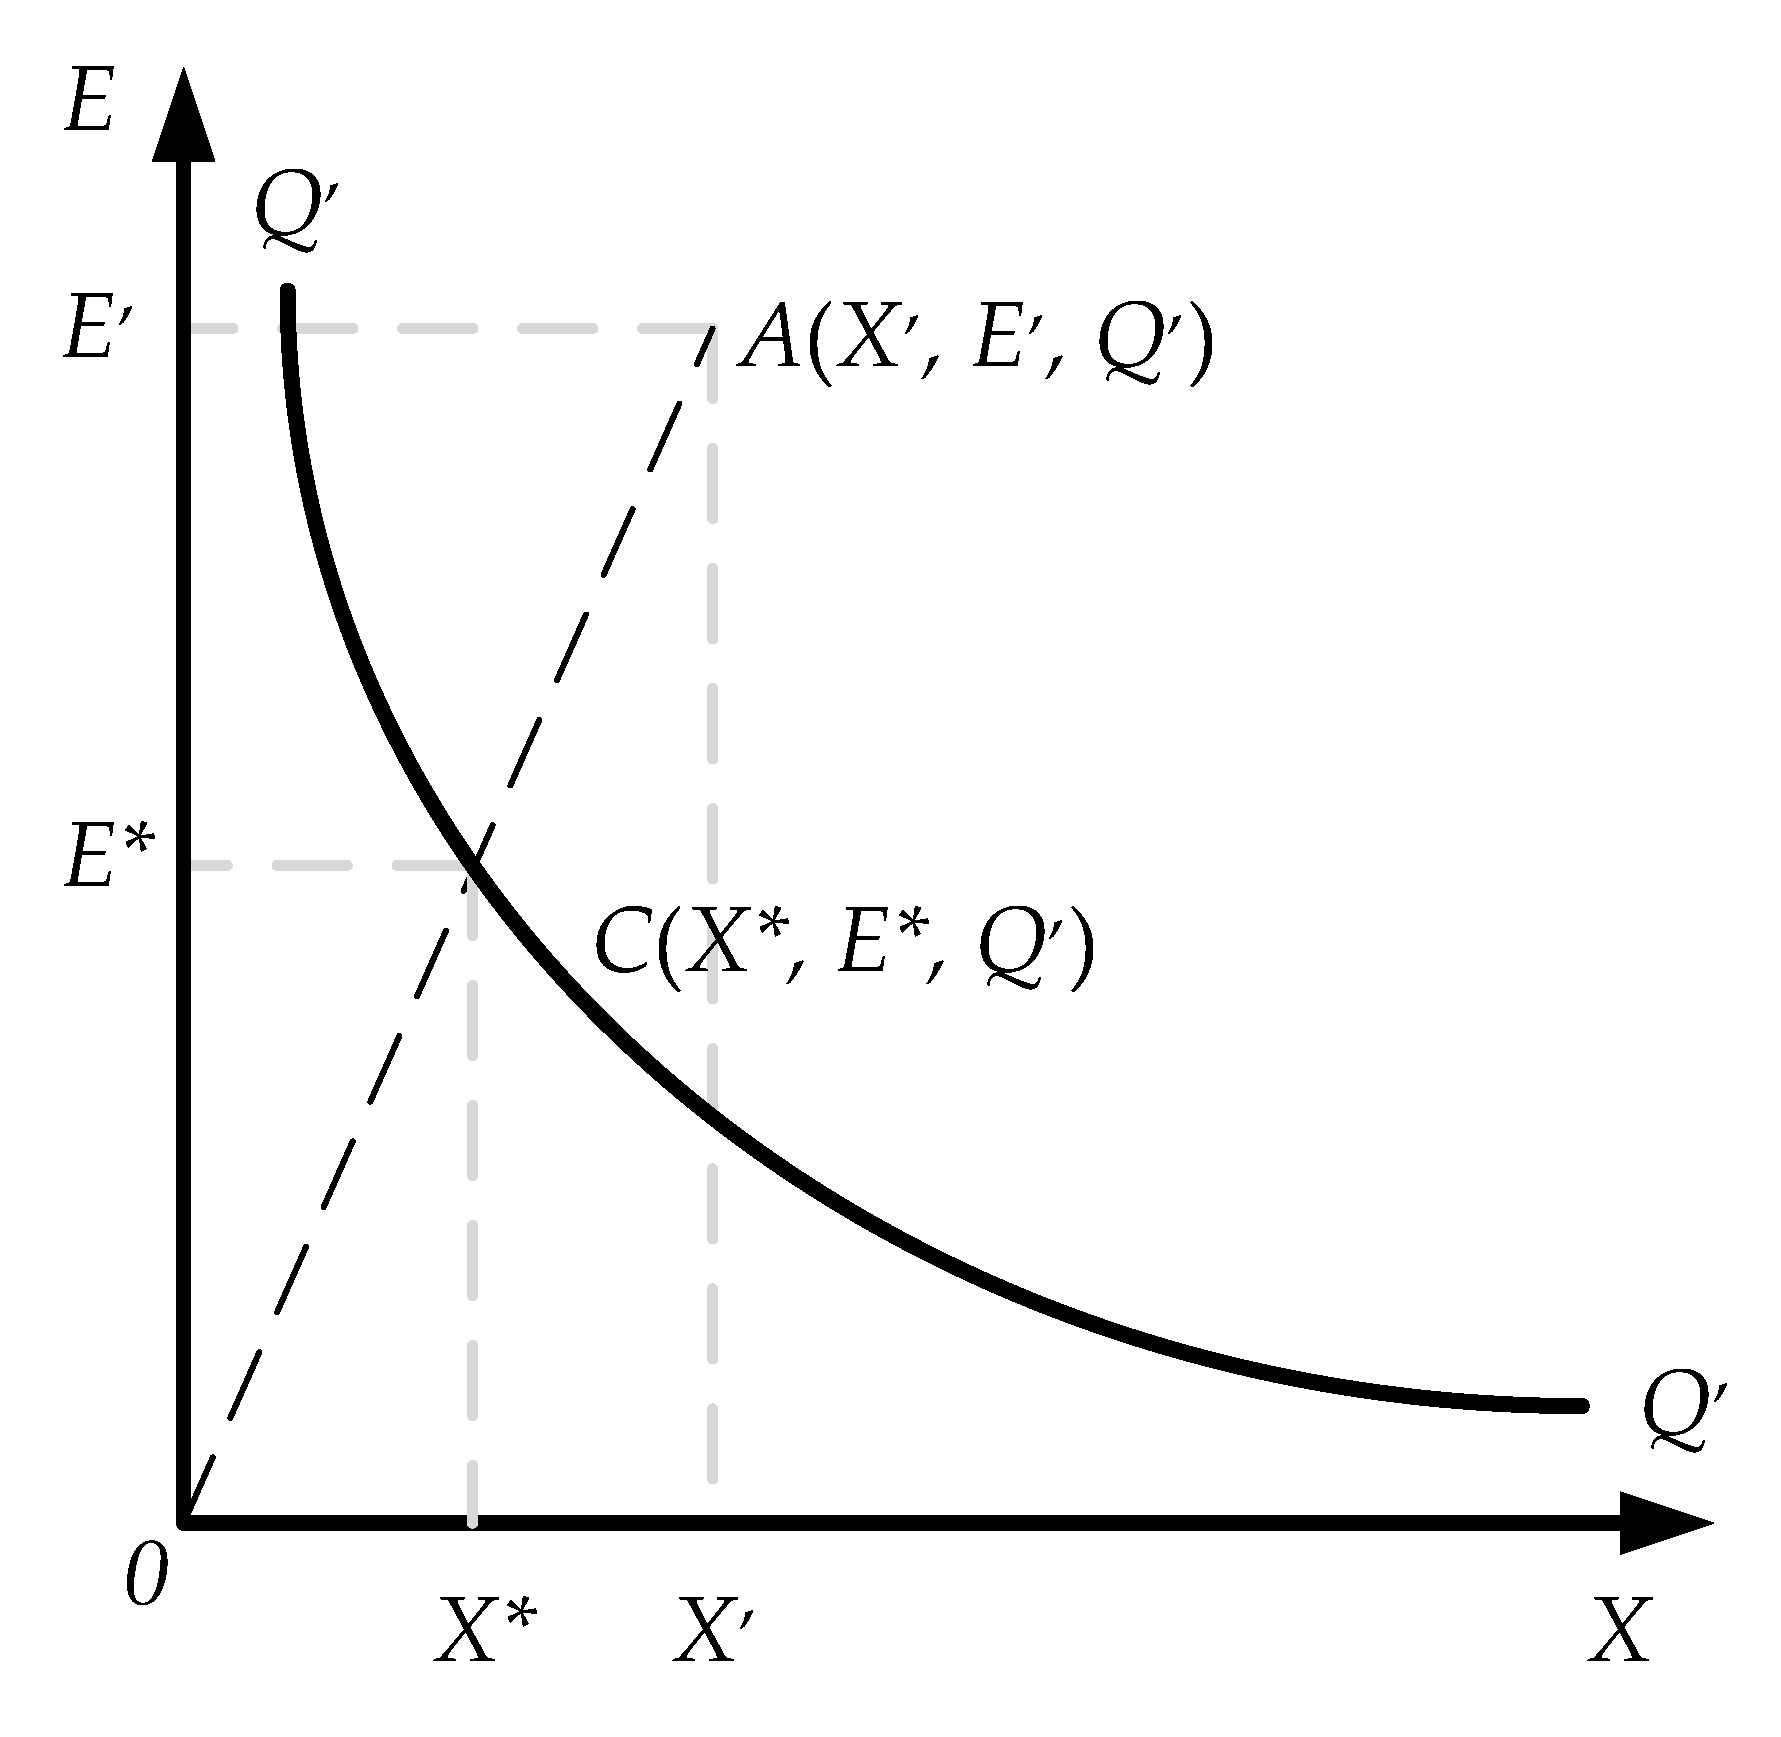
Following the SFA measurement concepts and viewing Figure 3 top-down, similar to what we did for DEA, we obtain Figure 5. In the graph, the vertical axis is output (Q), while the horizontal axis is energy input (E). Compared with other inputs (X), the curve in the image is the iso-quant (Q’Q’), point A is the actual production point of a particular DMU, and the inputs Q’ and E’ are used to obtain the output Q’. A ray OA radiates from the origin to point A, and the intersection point C with Q’Q’ represents a technical efficiency point indicating that the same output Q’ can be obtained with less input X* and E*. The technical efficiency of point A can be measured as OC/OA. In this case, the amount of energy saving is E’E*. Therefore, the literature calls E* the “target energy input”, E’ the “actual energy input”, and its ratio EEEE. Chen, Yang, Lee and Chi, [9] further define the segment of E’ to E* as “energy waste”, the segment of O to E* “energy utilization”, and both can be measured in the same way as in Equation (7).
Referring to Feijoó, France and Hernández [30] and Chen, Yang, Lee, and Chi [9], SFA’s energy efficiency measurement involves a two-stage estimation. The first stage is to estimate the production frontier. Using a logarithmic Cobb-Douglas function, the regression model can be specified as follows:
Q i = f C D ( β 0 , β E , β X i j | E i , X i j ) e ξ i ln Q i = β 0 + β E ln E i + β X i j j = 1 J 1 ln X i j + ξ i
In Equation (9), Q’ is the output level of the actual production point A in Figure 2, Figure 4, and Figure 5; E is the energy input; Xj is the j-th element of other inputs, and j = 1, 2, …, J − 1. These inputs usually include at least the physical capital input K, and the labor input L. ξ is a random marginal error term. Both the work of Aigner, Lovell, and Schmidt [32] and Meeusen and van den Broeck [33] note that it involves two mutually independent elements. One element is the random factor, which may cause the output to deviate because it is exogenous, unpredictable, and uncontrollable, such as the weather. This random factor has a two-sided symmetric normal distribution, denoted by v ~ N(0, σv2). Another element is the efficiency loss, which causes the output to deviate because of the non-controllable cause of production. This element is set as a one-sided, non-negative normal distribution, expressed as u ~ |N(µ, σu2)|, and ξ = vu.
The next step is the estimation of cost minimization, which involves the following mathematical optimization problem, with λ, E, and Xj as decision variables:
M i n λ , E , X j : T C i = P i E E i + j = 1 J 1 P i X j X i j S u b j e c t   t o : { Q i * = f C D ( E i , X i | β 0 , β E , β X i j , u , v ) F O C : f E ( E i ) = λ P i E ;   f X j ( X i j ) = λ P i X j T C i T C i r
In Equation (10), TC is the total production cost upon which the solution is based. It includes various factor costs, such as energy input E and other inputs Xj. P is the factor price and is limited to a level not greater than the true total production cost TCr. To get the producer equilibrium point, which is tangent to the cost line as shown in Figure 5, a set of the first order conditions (FOC) is also required. Based on this setting and all the parameters estimated from Equation (9), we can obtain SFA’s optimal energy input E* and the optimal amount of other inputs Xj*.
The use of SFA in the EEEE estimation also has advantages and disadvantages. The advantage is that its estimation process has a sufficient and complete theoretical basis originating from microeconomics. Additionally, there are no strong a priori assumptions and compromises, as there were in the DEA estimation. However, there are two drawbacks associated with this method. First, before the estimation, there is a need for complicated data collection, including both the factor inputs and factor prices. Second, it is based on a complicated two-stage estimation method. This may inevitably escalate substantial errors derived from the process. The research based on the SFA method includes the work of Feijoó, France, and Hernández [31], Zhou, Ang, and Zhou [34], Chen, Yang, Lee, and Chi, [9], and Filippini and Zhang [35].

2.2. A New Approach

Starting with the SFA method, this section proposes an effective and concise estimation method from a different perspective. Let us first consider the logical meaning and mathematical specification of Equation (11):
Q t K t ( a ) = Q t E t E t K t ( b ) = ( Q t E t * E t * E t ) E t K t ( c )
In Equation (11), we temporarily omit the subscript i, but add the subscript t to indicate the current period. The ratio Q/K of item (a) is output per unit of capital, that is, capital productivity. It is equivalent to item (b), the multiplication of the actual energy productivity Q/E and the actual energy consumption per unit of capital E/K. It is also equivalent to item (c), the product of the effective energy productivity Q/E*, the energy efficiency E*/E, and the actual energy consumption per unit of capital E/K. Among these terms, effectiveness means no inefficiency in energy consumption or waste; their relationship can be expanded into Equation (12):
Q t K t = [ ( γ t E * Q t 1 E t 1 ) ( d ) E t * E t ] E t K t w h e r e   γ t E * = Q t E t * Q t 1 E t 1 γ t E * = Q t E t * E t 1 Q t 1 Q t E t * = γ t E * Q t 1 E t 1
In Equation (12), item (d) is a variation of the effective energy productivity Q/E* of Equation (11). γE* is the effective energy productivity index, where Qt−1/Et−1 is the actual energy productivity of the previous period. This equation can be rewritten as:
Q t K t E t K t ( e ) = γ t E * Q t 1 E t 1 E t * E t Q t E t = γ t E * Q t 1 E t 1 E t * E t
In Equation (13), item (e) shows the result of dividing Equation (12) by Et/Kt. It can be further rewritten as:
Q t E t Q t 1 E t 1 = γ t E * E t * E t
Equation (14) can be converted into Equation (15), where γE is the actual energy productivity index, the product of the effective energy productivity index γE*, and EEEE.
γ t E = γ t E * E E E E t ,   γ t E = Q t E t Q t 1 E t 1 ,   γ t E * = Q t E t * Q t 1 E t 1 ,   a n d   E t * E t = E E E E t
The mathematical form of Equation (15) has been condensed in a refined and economically intuitive way. It shows that the actual energy productivity index is affected by two components: it increases with the expansion of the effective energy productivity index and decreases with the existence of energy inefficiency. Since E* is always smaller than E’, γE* is therefore constantly greater than γE, and the gap is the energy efficiency E*/E’. Equation (15) has some important economic implications; γE* refers to the ratio of the maximum energy productivity to the actual energy productivity of the current period. Meanwhile, γE refers to the ratio of the current actual energy productivity to the actual energy productivity of the previous period. Accordingly, lower energy productivity growth is caused by the loss of energy efficiency. To find EEEE, we take the natural logarithms on both sides of Equation (15) and obtain Equation (16):
ln γ t E = ln γ t E * + ln E E E E t
Thus, the correspondence between EEEE and the econometric method should be clear; in the actual calculation, the preparatory procedure is to treat lnγE as the dependent variable and use only the constant term as the explanatory variable. Conceptually, depending on the subject of research, one can also affix an additive dummy variable to the estimation. As in Equation (17), the SFA estimation gives the logarithmic effective energy productivity index γE* represented by α, values of the logarithmic energy efficiency parameter captured by −u, as well as the random uncontrollable elements captured by v.
ln γ t E = α ( u t ) + v t ,   S F   m o d e l { u = ln E E E E t 0 ~ N | ( 0 , σ u 2 ) | v t ~ i i d N ( 0 , σ v 2 )
By estimating the model as in Equation (17) and recording the natural logarithm of the results, we finally identify the effective energy productivity index γE* and the energy efficiency EEEE as follows:
e α = e ln γ t E * = γ t E * ;   e u t = e ln E E E E t = E E E E t = E t * E t

3. Empirical Applications

3.1. Data Collections and Preliminary Summaries

According to the basic model listed in Equation (17), the new estimation idea proposed in this paper has a simple demand for data. It requires only two variables: the actual total energy input and the actual total output. Here, the actual energy input is the aggregate consumption value of oil, electricity, coal, and gas, after converting each into the quadrillion British thermal unit (BTU) equivalent. The numbers are taken from the database of the U.S. Energy Information Administration (EIA). The actual total output, in million dollars, is measured by the annual real gross domestic product (GDP), and adjusted by the purchasing power parity (PPP) conversion factor based in 2011. The sample, taken from the World Bank’s World Development Indicator database, includes 20 Organization for Economic Co-operation and Development (OECD) economies and covers the period of 1992–2014. The reason for the selection was based on the data availability and completeness. Table 1 lists the 20 economies in this study, as well as the average and standard deviation of their real outputs and energy inputs.
Through a careful inspection of Table 1, we made several fascinating discoveries. First, Y is the annual real GDP, and it varies across the countries, perhaps reflecting the difference either in the scale (in population or area) or in the degree of economic development. Table 1 illustrates that the three largest economies are the U.S., Japan, and Germany. Second, E is the annual energy consumption, and the values among economies are also quite different. The reasons for the differences in energy consumption could result from the sources of demand or its usages (livelihood or business); it may also reflect the scale of demand and the consumption efficiency. Table 1 shows that the U.S. leads in energy consumption, followed by Australia and Finland. Third, observation of the real output and energy consumption may not offer much insight; however, it becomes very intriguing when we examine the two variables concurrently. Mainly, the table indicates that a higher output country is not necessarily a higher energy consumption country. As expected, with its size and population, the U.S. is ranked first both in GDP and energy consumption. It is puzzling to see that Japan and Germany, who were ranked second and third, have been ranked seventh and eleventh in energy consumption, respectively. In contrast, Australia and Finland have been ranked second and third in energy consumption, while their GDPs are eleventh and eighteenth, respectively. Naturally, by setting the energy consumption to 1, we are very curious about the output per unit of energy consumption among these countries. We are also curious about which country has the highest and the lowest numbers and how we can rank them. Furthermore, we are curious about how much output per unit of energy consumption has changed over time, which country has experienced the largest change, and how we can rank the changes. The curiosity is linked to two interesting measurements: energy productivity (EP) and the Energy Productivity Index (γ), both of which have been discussed in the paper previously.
Based on our calculations, Figure 6 displays two bar charts, representing the energy productivity and the Energy Productivity Index. Figure 6a shows that the U.S. has the best performance in energy productivity, followed by Mexico, Japan, and other countries. Taking the U.S. as an example, every one quadrillion BTUs of energy will result in an output of $1.163 billion. In addition, Figure 6b shows that annual average energy productivity grew at 6.63% in New Zealand, the fastest among the countries, followed by Austria and Ireland. Figure 6 provides more information and implications than what one can obtain from Table 1. Consequently, we ask another gripping question: how should energy efficiency be measured?

3.2. Specifications and Estimation Results

To estimate energy efficiency, we expand the basic model, represented by Equation (17), into Equation (19) by adding an intercept-type dummy variable.
ln γ i , t E = α 0 + i = 1 N 1 α i D i , t ( u i , t ) + v i , t ,   w h e r e   { u i , t = ln E E E E i , t 0 ~ N | ( μ , σ i , u 2 ) | v i , t ~ i i d N ( 0 , σ i , v 2 ) D i , t = { 1 ,   i f   i = i 0 ,   i f   i i
In the formula, α0 and αi are the expansion of α in Equation (17). D is a dummy variable and takes a value of 1 when the observation is i and zero otherwise. αi is the corresponding coefficient estimate. Because the dummy variable uses the U.S. as the basis for reference, lnγE* will be α0 for the U.S., and α0 + αi for the i-th economy. The rest of Equation (19) remains the same as Equation (17).
Table 2 shows the results from the SFA estimation; the table conveys several important messages. First, the value of κ is 0.803, indicating that, for the residual item, the share of the controllable factor is 80.3%. Second, because α0 is significant at the 1% level, and the estimate of lnγ* is 0.032, it is meaningful to use the U.S. as the benchmark. The estimated value of γ* will be around 1.033. This is the value of the Energy Productivity Index on the frontier. In other words, annual energy productivity growth could potentially reach 3.3%; however, Figure 6b shows that the actual energy productivity growth is merely 2.44%. Third, the coefficient estimates of a number of other α are also significant, indicating that compared with the frontier, the Energy Productivity Index of other economies falls at a different level. For instance, in the case of α2, the frontier value should be e(0.032+0.150), or around 1.199.
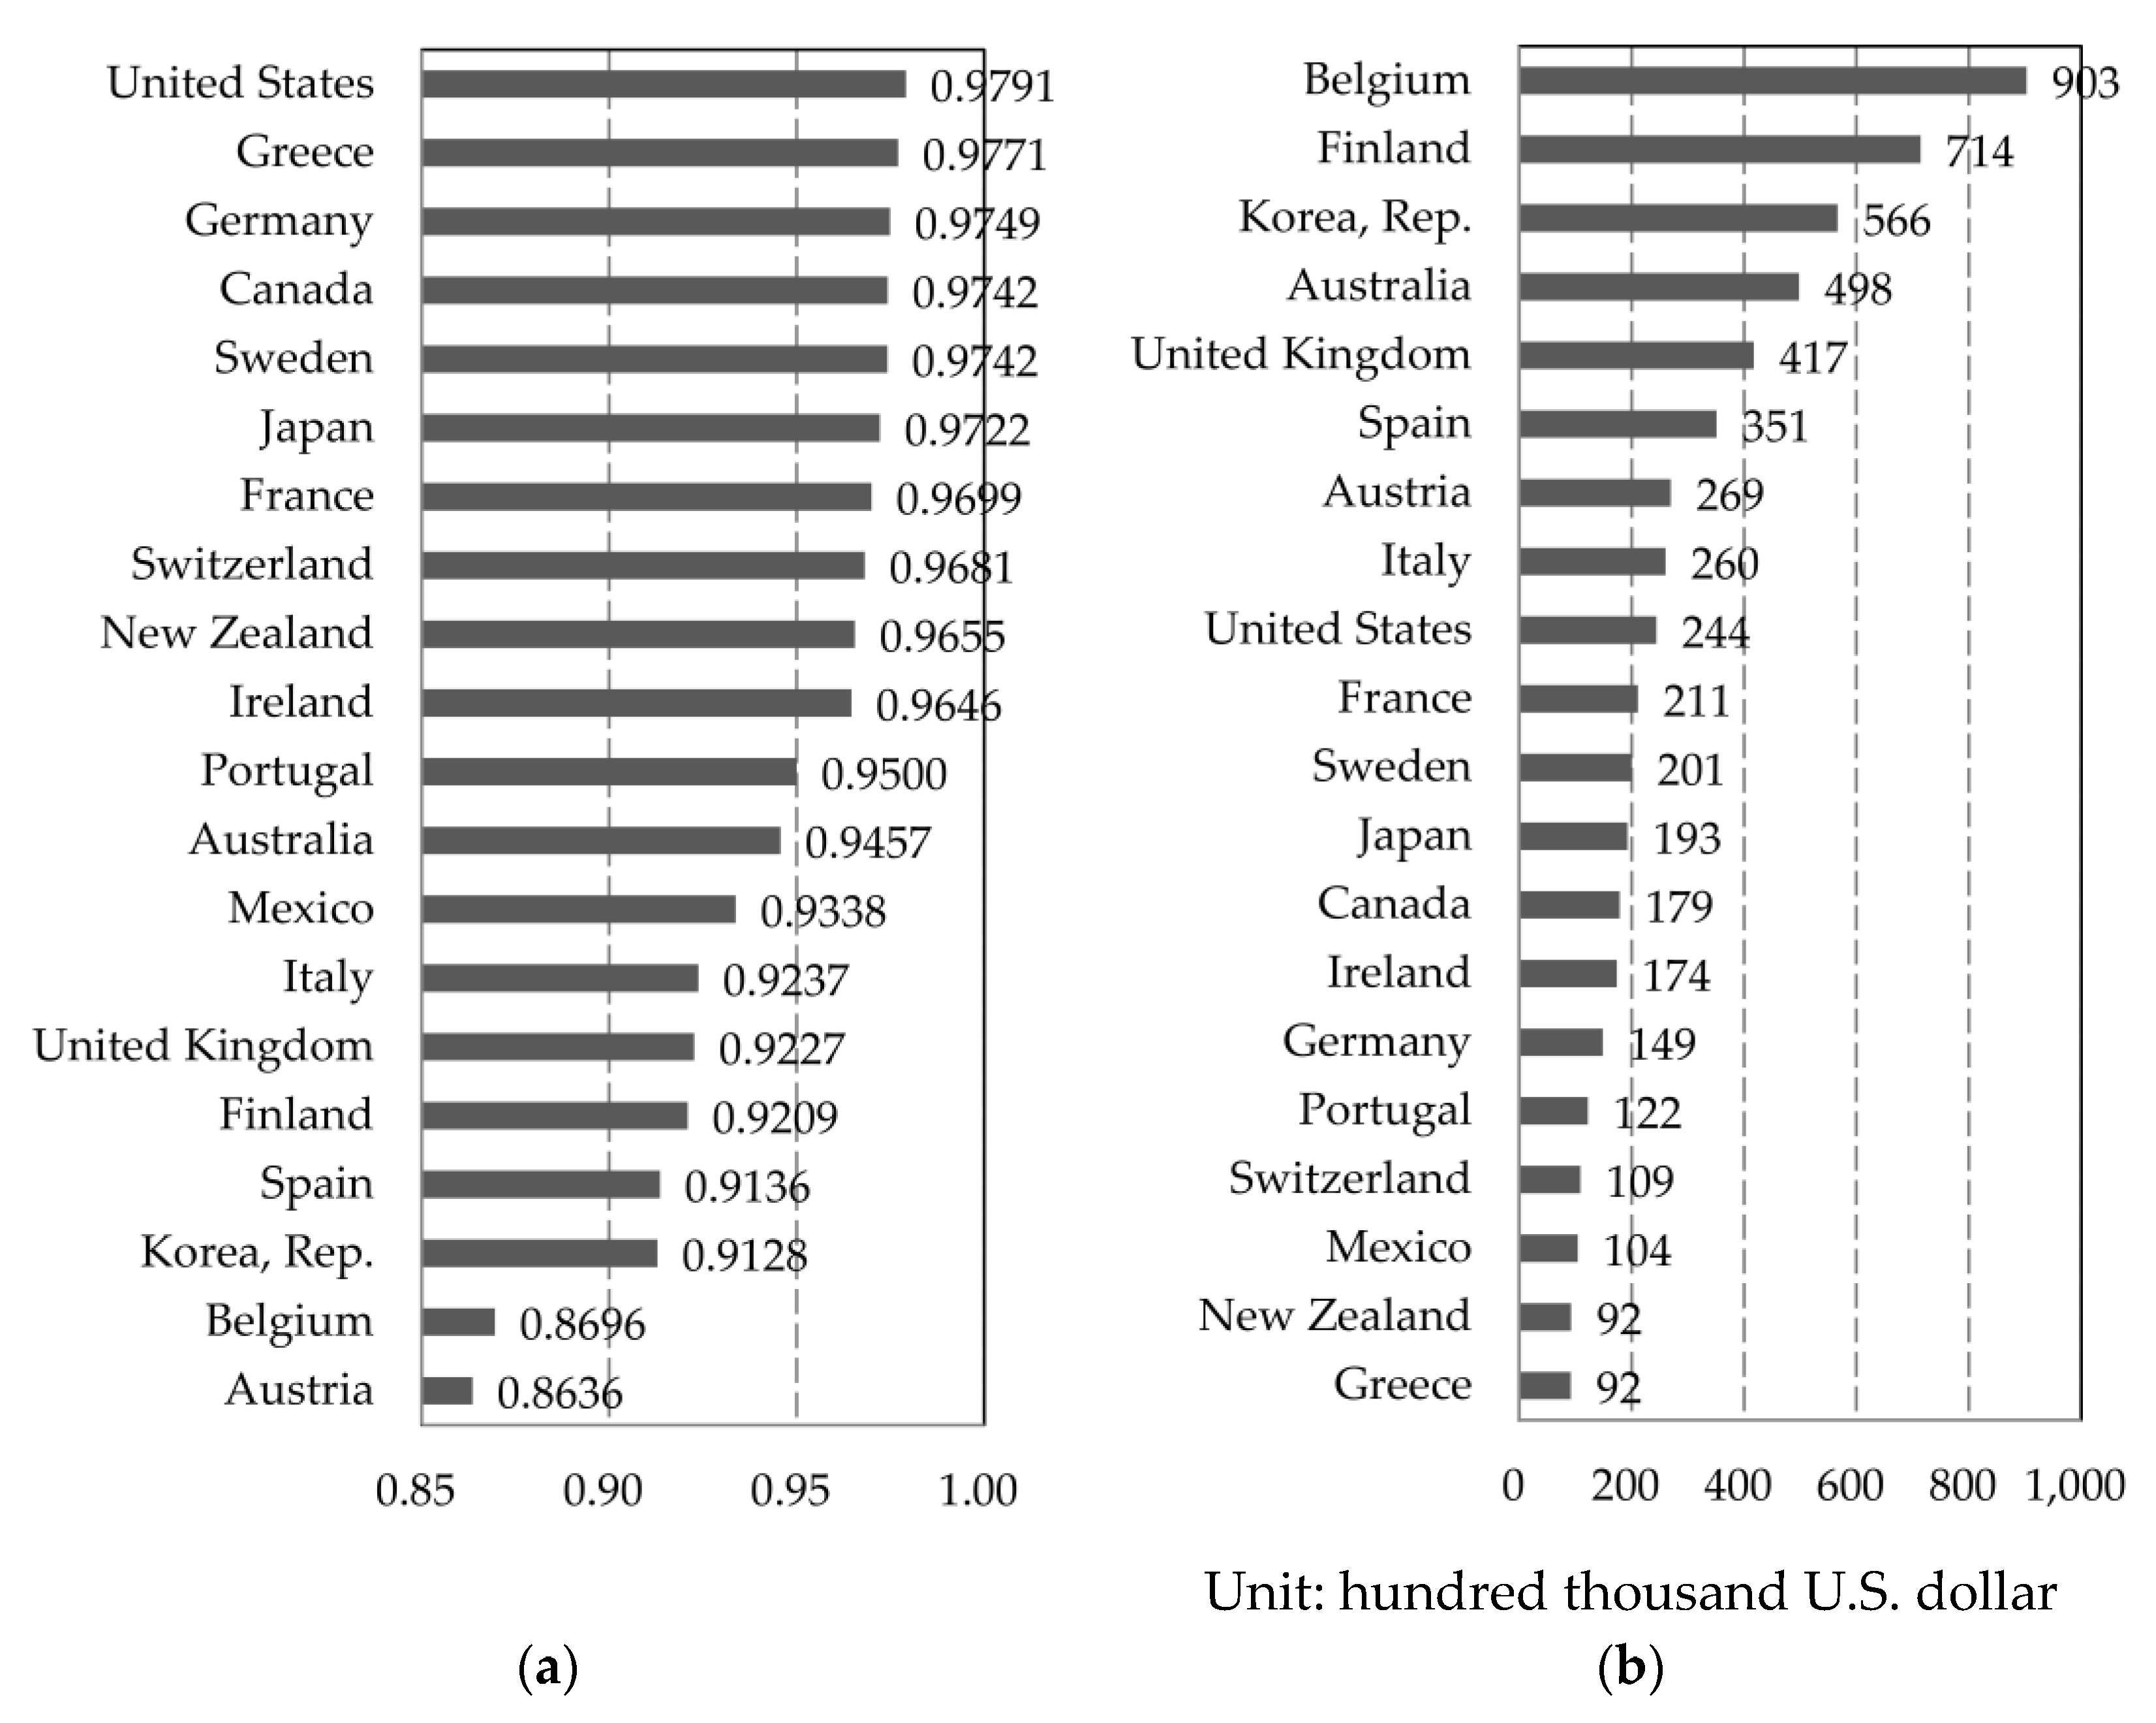
Figure 7 further summarizes the estimates of energy efficiency. Figure 7a reports the average values of energy efficiency for all countries for the period 1992–2014, illustrating that the U.S. had the highest value, 0.9791, followed by Greece and Germany. Overall, most countries have a value higher than 0.9, with the lowest value still above 0.85. Figure 7b shows the potential magnitude of a reduction in energy consumption during the sample period, relative to the minimum energy input. Our calculations indicated that Belgium has the largest potential for reducing energy consumption, followed by Finland and South Korea. It is interesting to note that the U.S. has a relatively low magnitude for reduction, which reflects its high energy efficiency. This inference can be applied to other countries as well.
An overview of the results from this section offers two insights. The first is that our new estimation approach is feasible in empirical applications. Second, our model provides a technique through which the magnitude of reducible energy consumption can be computed and exposed; thus, our new modeling idea and the estimation results may incite curiosity around its implications for energy policies.

3.3. Further Comparisons

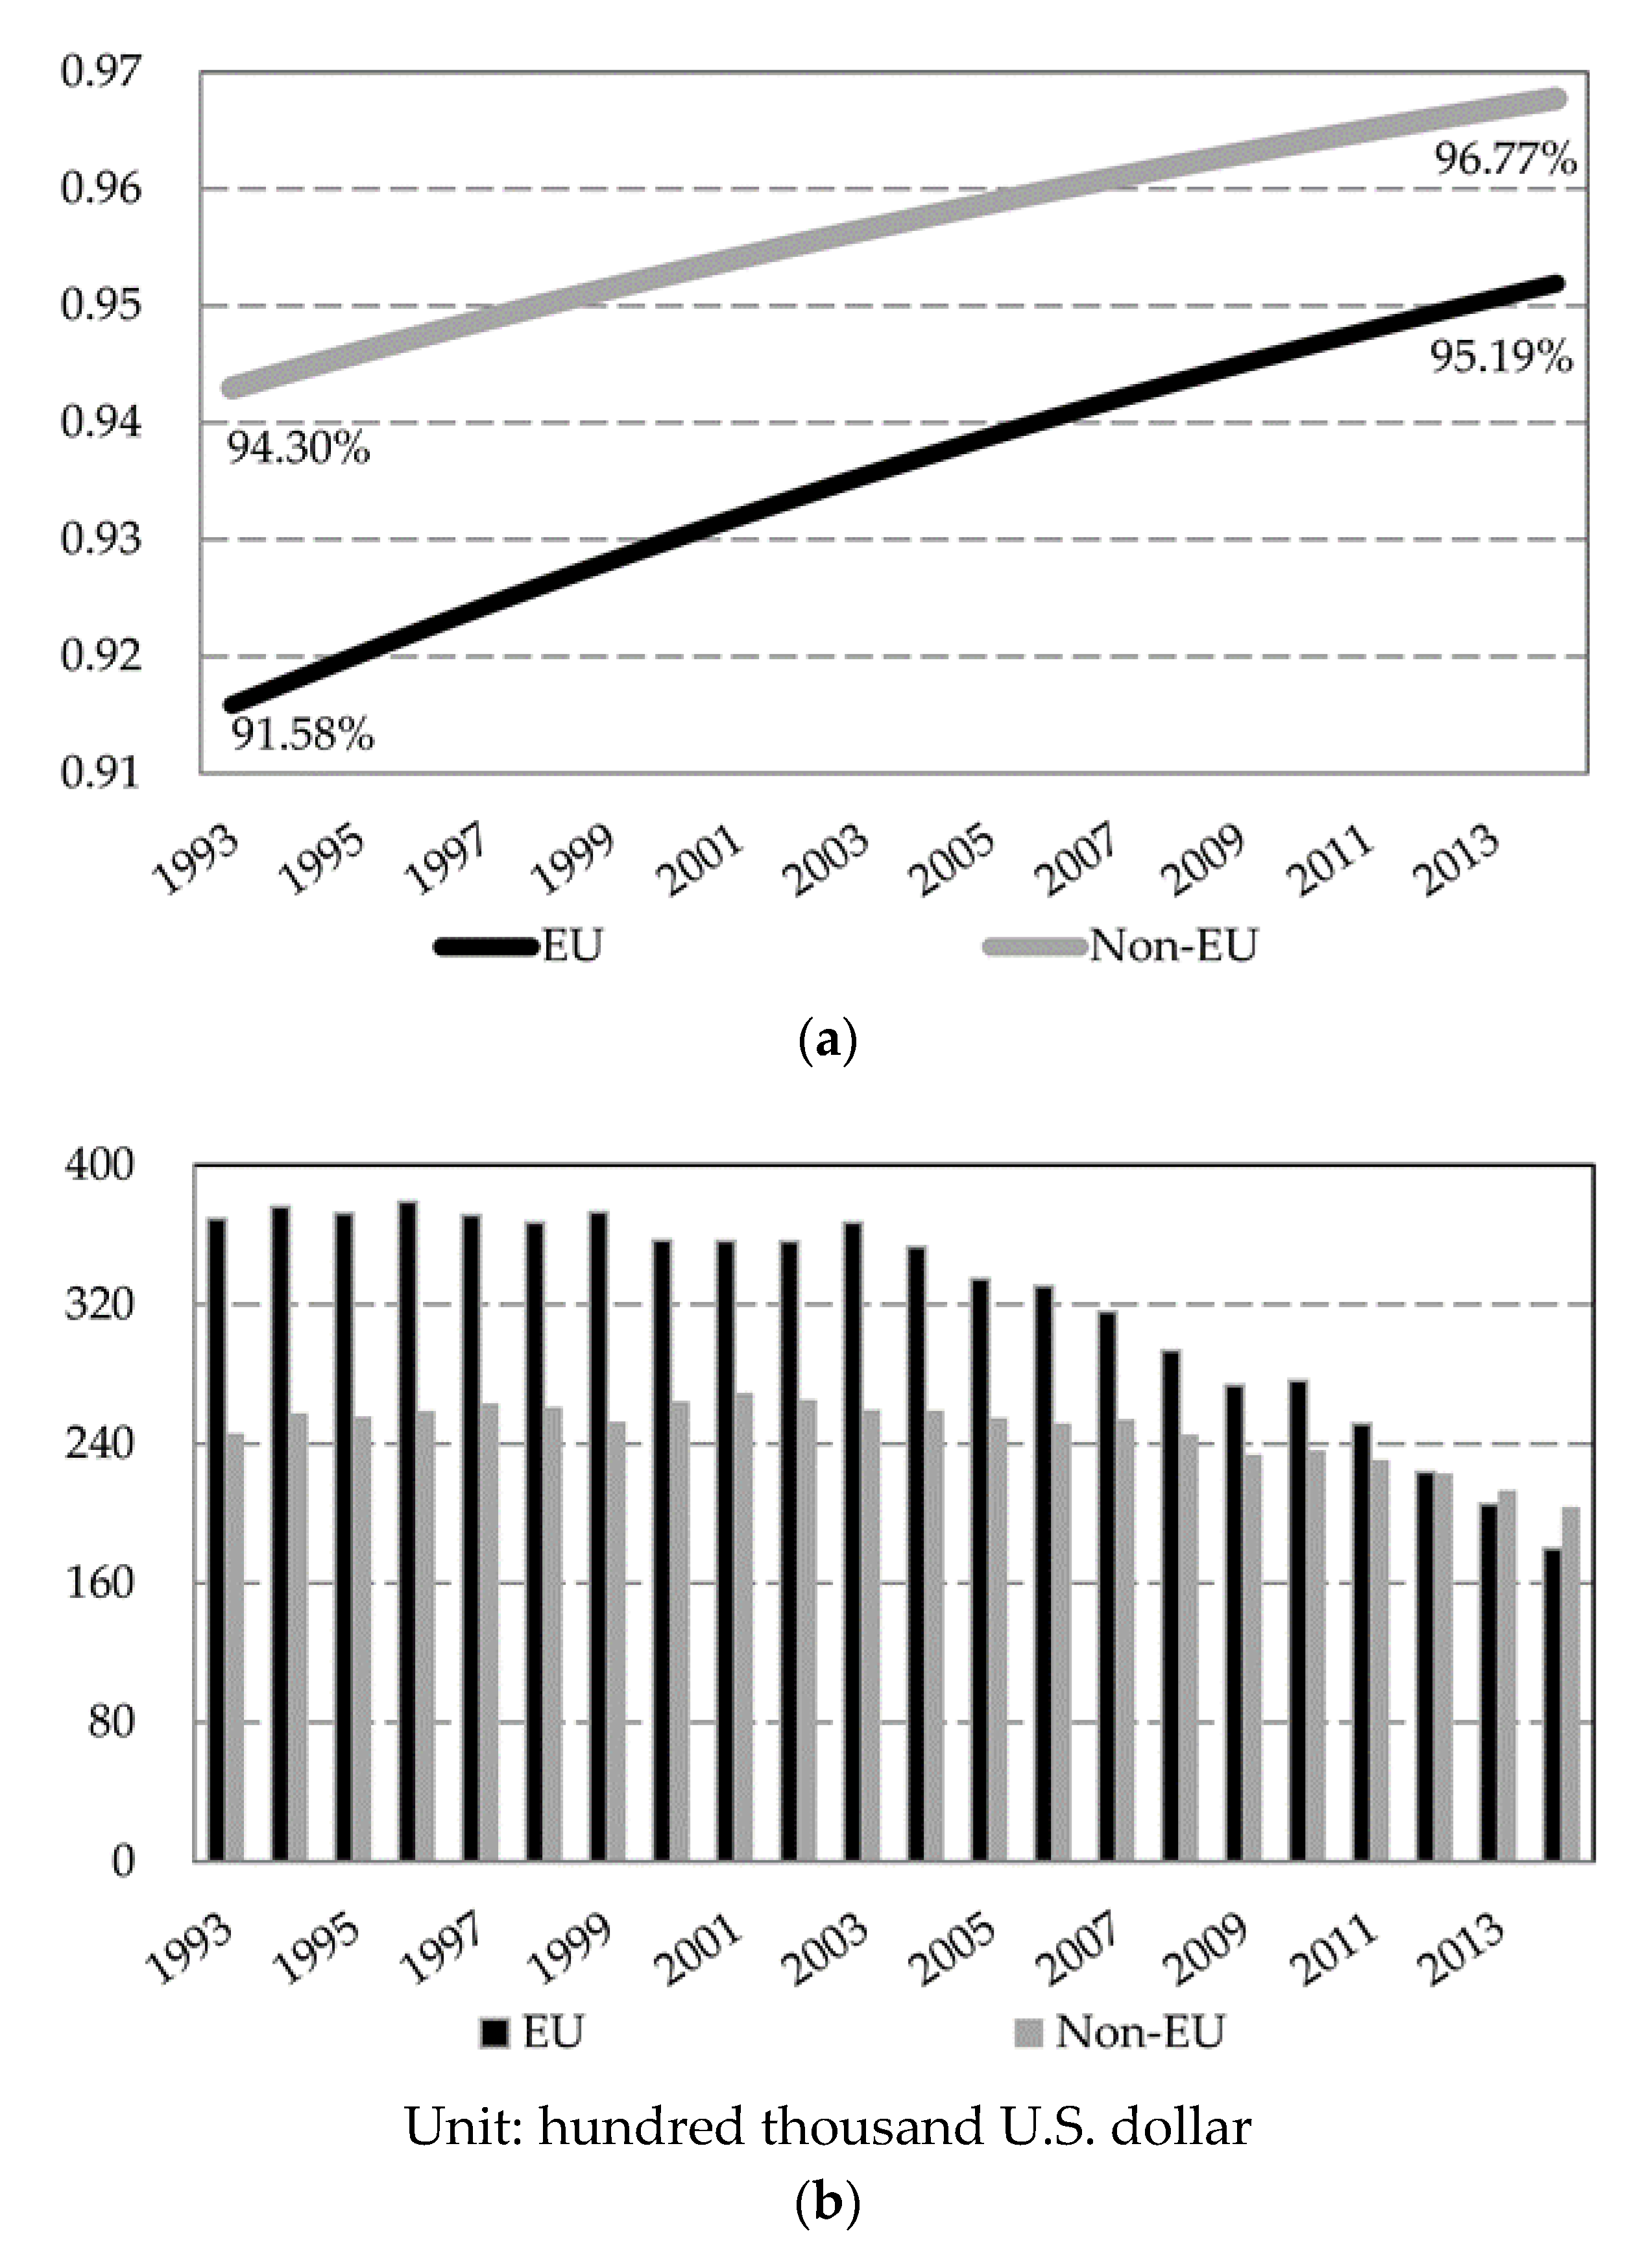
The energy efficiency estimates obtained above can be used further for cross-analysis. Figure 8 consolidates the results by dividing the sample into EU and Non-EU groups. Three prominent points are worth discussing. First, and in Figure 8a, the black line is the trend line of the average energy efficiency for the EU group during the sample period, and the grey line is the trend line for the Non-EU group. The trend line for the Non-EU group is consistently higher than the trend line for the EU group; judging by the slope, the Non-EU group has a steeper trend line, showing an average energy efficiency between 94.30% and 96.77%, and a compound annual growth rate of 0.1235%. In contrast to the Non-EU group, the average energy efficiency for the EU group is between 91.58% and 95.19%, and the annual compound growth rate is 0.1841%. Furthermore, the black bars in Figure 8b show the reducible energy consumption over the years for the EU group. The grey bars represent the reducible amount for the Non-EU countries. It manifests that, progressively, the reducible amount of energy consumption for the EU group is approaching that of the Non-EU group, and since 1994 has been below it.
The results from the group comparisons have several implications. First, a higher energy efficiency for Non-EU countries appears to be counterintuitive. However, regardless of being a member of the EU or not, it is noteworthy that the empirical sample includes only the OECD countries due to their advanced economic conditions and industriousness. It is obvious that in terms of the energy efficiency, the EU members have a faster speed in catching up, which is also reflected in the decreasing amount of reducible energy consumption. Based on the analysis, we should point out that EU countries tend to rely on a more coherent and cooperative decision-making process when dealing with issues related to energy, energy conservation, and sustainable economic development. In contrast, Non-EU countries lack a systematic and organized policy-making process, allowing the EU group to catch up rapidly in energy efficiency improvement.

4. Conclusions

Energy efficiency is undoubtedly a critical issue concerning the sustainability of civilization. It is one of the most important topics for current and future research. This article contributes to the literature on energy efficiency in two aspects: bringing clarity to the concept of energy efficiency and proposing a new metric for it.
Due to the multi-disciplinary nature of energy efficiency, definitions and metrics are ambiguous at best and confusing at worst. To avoid confusion, this study suggests a dichotomy to divide the general term into energy efficacy and energy efficiency. Energy efficacy refers to how much output can be generated from a unit of energy use, a term more inclined to the perspective of science and engineering. Energy efficiency refers to the potential maximum (due) benefit reached or approached by a given energy input, which is more economically oriented.
The second contribution of this paper is to propose a new idea for measuring energy efficiency. This paper offers a new, practical, and elegant approach from the perspective of economics, along with the inference of relevant literature, to measure energy efficiency. In the empirical estimation, we use the OECD data to prove the operability of the novel idea. This paper not only contributes to the literature with a clear definition of the concept for energy efficiency in a multi-disciplinary research environment, it also provides a feasible and straightforward template of model design and specification from the economic perspective.
Finally, we must humbly recognize the limitations of this research. When dealing with issues related to energy efficiency, the idea proposed in this article is more suitable for analyzing economic, commercial, and management matters at the aggregate level, such as the regional or national levels. It is less applicable to the evaluation of energy efficacy for specific products, devices, or equipment. Even though the issues considered and approaches taken in science and engineering could be multi-disciplinary in nature, the concept of energy efficiency varies greatly depending on the applicable objects and purposes.

Author Contributions

Conceptualization, K.-H.C.; methodology, K.-H.C.; software, L.-Y.L.; validation, J.-C.C.; formal analysis, S.-Y.P. and K.-H.C.; investigation, K.-H.C., J.-C.C. and J.-M.L.; resources, S.-Y.P.; data curation, L.-Y.L.; Writing—Original draft preparation, K.-H.C.; Writing—Review and editing, J.-C.C.; visualization, J.-M.L.; supervision, K.-H.C. and J.-C.C.; project administration, K.-H.C.; funding acquisition, S.-Y.P., K.-H.C., J.-C.C., J.-M.L. and L.-Y.L. All authors have read and agreed to the published version of the manuscript.

Funding

The authors are grateful for financial support from the Ministry of Science and Technology of Taiwan (ROC) (Grant No.: 109-2410-H-197-005-) enabling this research to be completed.

Conflicts of Interest

The authors declare no conflict of interest.

References

  1. De Melo, C.A.; Jannuzzi, G.M. Energy Efficiency Standards for Refrigerators in Brazil: A Methodology for Impact Evaluation. Energy Policy 2010, 38, 6545–6550. [Google Scholar] [CrossRef]
  2. Miketa, A.; Mulder, P. Energy Productivity across Developed and Developing Countries in 10 Manufacturing Sectors: Patterns of Growth and Convergence. Energy Econ. 2005, 27, 429–453. [Google Scholar] [CrossRef]
  3. Landi, D.; Capitanelli, A.; Germani, M. Ecodesign and Energy Labelling: The Role of Virtual Prototyping. Procedia Cirp 2017, 61, 87–92. [Google Scholar] [CrossRef]
  4. Germani, M.; Landi, D.; Rossi, M. Efficiency and Environmental Analysis of A System for Renewable Electricity Generation and Electrochemical Storage of Residential Buildings. Procedia Cirp 2015, 29, 839–844. [Google Scholar] [CrossRef]
  5. Landi, D.; Castorani, V.; Germani, M. Interactive Energetic, Environmental and Economic Analysis of Renewable Hybrid Energy System. Int. J. Interact. Des. Manuf. 2019, 13, 885–899. [Google Scholar] [CrossRef]
  6. Capitanelli, A.; Germani, M.; Landi, D.; Papetti, A. A Methodology to Design A Knowledge-based Tool for Residential Buildings Simulation. ASME 2015 International Mechanical Engineering Congress and Exposition. Am. Soc. Mech. Eng. Digit. Collect. 2015. [Google Scholar] [CrossRef]
  7. Tahir, Y.; Nadeem, M.F.; Ahmed, A.; Khan, I.A.; Qamar, F. A Review on Hybrid Energy Storage Systems in Microgrids. In Proceedings of the 2020 3rd International Conference on Computing, Mathematics and Engineering Technologies (iCoMET), Sukkur, Pakistan, 29–30 January 2020; pp. 1–7. [Google Scholar]
  8. Hardisty, D.J.; Shim, Y.; Sun, D.; Griffin, D.W. Encouraging Energy Efficiency: Product Labels Activate Temporal Tradeoffs 2020. Available online: https://papers.ssrn.com/sol3/papers.cfm?abstract_id=3576266 (accessed on 31 May 2020).
  9. Chen, K.H.; Yang, H.Y.; Lee, J.M.; Chi, C.F. The Impact of Energy Prices on Energy Consumption, and Energy Efficiency: Evidence from Taiwan. Energy Effic. 2016, 9, 1329–1349. [Google Scholar] [CrossRef]
  10. Shove, E. What Is Wrong with Energy Efficiency. Build. Res. Inf. 2018, 46, 779–789. [Google Scholar] [CrossRef]
  11. Merriam-Webster Dictionary. Available online: https://www.merriam-webster.com/dictionary/efficiency (accessed on 11 October 2018).
  12. International Energy Agency. Energy Efficiency Indicators: Essential for Policy Making 2014. Available online: https://www.iea.org/publications/freepublications/ (accessed on 23 February 2020).
  13. Hu, J.L.; Wang, S.C. Total-factor Energy Efficiency of Regions in China. Energy Policy 2006, 34, 3026–3217. [Google Scholar] [CrossRef]
  14. Atakhanova, Z.; Howie, P. Electricity Demand in Kazakhstan. Energy Policy 2007, 35, 3729–3743. [Google Scholar] [CrossRef]
  15. Patterson, M.G. What is Energy Efficiency? Concepts, Indicators, and Methodological Issues. Energy Policy 1996, 24, 377–390. [Google Scholar] [CrossRef]
  16. Bakar, N.N.A.; Hassan, M.Y.; Abdullah, H.; Rahman, H.A.; Abdullah, M.P.; Hussin, F.; Bandi, M. Energy Efficiency Index as An Indicator for Measuring Building Energy Performance: A review. Renew. Sustain. Energy Rev. 2015, 44, 1–11. [Google Scholar] [CrossRef]
  17. Cai, W.; Liu, F.; Dinolov, O.; Xie, J.; Liu, P.; Tuo, J. Energy Benchmarking Rules in Machining Systems. Energy 2018, 142, 258–263. [Google Scholar] [CrossRef]
  18. Farla, J.C.; Blok, K. The Use of Physical Indicators for the Monitoring of Energy Intensity Developments in the Netherlands, 1980–1995. Energy 2000, 25, 609–638. [Google Scholar] [CrossRef]
  19. Heiple, S.; Sailor, D.J. Using Building Energy Simulation and Geospatial Modeling Techniques to Determine High Resolution Building Sector Energy Consumption Profiles. Energy Build. 2008, 40, 1426–1436. [Google Scholar] [CrossRef] [Green Version]
  20. Sheng, Y.; Miao, Z.; Zhang, J.; Lin, X.; Ma, H. Energy Consumption Model and Energy Benchmarks of Five-star Hotels in China. Energy Build. 2018, 165, 286–292. [Google Scholar] [CrossRef]
  21. Farrell, M.J. The Measurement of Productive Efficiency. J. R. Stat. Soc. 1957, 120, 253–290. [Google Scholar] [CrossRef]
  22. Hu, J.L.; Kao, C.H. Efficient Energy-saving Targets for APEC Economies. Energy Policy 2007, 35, 373–382. [Google Scholar] [CrossRef]
  23. Charnes, A.; Cooper, W.W.; Rhodes, E. Measuring the Efficiency of Decision Making Units. Eur. J. Oper. Res. 1978, 2, 429–444. [Google Scholar] [CrossRef]
  24. Bi, G.B.; Song, W.; Zhou, P.; Liang, L. Does Environmental Regulation Affect Energy Efficiency in China's Thermal Power Generation? Empirical Evidence from A Slacks-based DEA Model. Energy Policy 2014, 66, 537–546. [Google Scholar] [CrossRef]
  25. Wu, A.H.; Cao, Y.Y.; Liu, B. Energy Efficiency Evaluation for Regions in China: An Application of DEA and Malmquist Indices. Energy Effic. 2014, 7, 429–439. [Google Scholar] [CrossRef]
  26. Li, K.; Lin, B. Metafrontier Energy Efficiency with CO2 Emissions and Its Convergence Analysis for China. Energy Econ. 2015, 48, 230–241. [Google Scholar] [CrossRef]
  27. Li, M.J.; Tao, W.Q. Review of Methodologies and Polices for Evaluation of Energy Efficiency in High Energy-Consuming Industry. Appl. Energy 2017, 187, 203–215. [Google Scholar] [CrossRef]
  28. Shi, S.A.; Xia, L.; Meng, M. Energy Efficiency and Its Driving Factors in China’s Three Economic Regions. Sustainability 2017, 9, 2059. [Google Scholar] [CrossRef] [Green Version]
  29. Chen, X.; Gao, Y.; An, Q.; Wang, Z.; Neralić, L. Energy Efficiency Measurement of Chinese Yangtze River Delta’s Cities Transportation: A DEA Window Analysis Approach. Energy Effic. 2018, 11, 1941–1953. [Google Scholar] [CrossRef]
  30. Tian, P.; Lin, B. Regional Technology Gap in Energy Utilization in China's Light Industry Sector: Non-parametric Meta-frontier and Sequential DEA Methods. J. Clean. Prod. 2018, 178, 880–889. [Google Scholar] [CrossRef]
  31. Feijoó, M.L.; France, J.F.; Hernández, J.M. Global Warming and the Energy Efficiency of Spanish Industry. Energy Econ. 2002, 24, 405–423. [Google Scholar] [CrossRef]
  32. Aigner, D.J.; Lovell, C.A.K.; Schmidt, P. Formulation and Estimation of Stochastic Frontier Production Function Models. J. Econom. 1977, 6, 21–37. [Google Scholar] [CrossRef]
  33. Meeusen, W.; van Den Broeck, J. Efficiency Estimation from Cobb–Douglas Production Functions with Composed Error. Int. Econ. Rev. 1977, 18, 435–444. [Google Scholar] [CrossRef]
  34. Zhou, P.; Ang, B.W.; Zhou, D.Q. “Measuring Economy-wide Energy Efficiency Performance: A Parametric Frontier Approach. Appl. Energy 2012, 90, 196–200. [Google Scholar] [CrossRef]
  35. Filippini, M.; Zhang, L. Estimation of the Energy Efficiency in Chinese Provinces. Energy Effic. 2016, 9, 1315–1328. [Google Scholar] [CrossRef]
Figure 1. Block Diagram for the Measurement of Energy Efficiency.
Sustainability 12 04944 g001
Figure 2. Technical Frontier and Efficiency Measurement—Single Input.
Sustainability 12 04944 g002
Figure 3. Technical Frontier and Efficiency Measurement—Multi-Input.
Sustainability 12 04944 g003
Figure 4. Graphical Concept of the data envelopment analysis (DEA) Estimation.
Sustainability 12 04944 g004
Figure 5. Graphical Concept of the stochastic frontier analysis (SFA)Estimation.
Sustainability 12 04944 g005
Figure 6. The Energy Productivity and Energy Productivity Index of 20 Organization for Economic Co-operation and Development (OECD) Sample Countries, 1992-2014 (a) Energy Productivity of 20 OECD Sample Countries, 1992–2014 (b) Energy Productivity Index of 20 OECD Sample Countries, 1992–2014.
Sustainability 12 04944 g006
Figure 7. The Energy Efficiency and Reducible Energy Consumption of 20 Sample OECD Countries, 1992–2014. (a) Energy Efficiency Estimation of 20 OECD Sample Countries, 1992–2014 (b) Reducible Energy Consumption of 20 OECD Sample Countries, 1992–2014.
Sustainability 12 04944 g007
Figure 8. The Performance of Energy Efficiency of OECD EU Members and Non-EU Members, 1992–2014. (a) The Energy Efficiency Trends for the EU and Non-EU Groups Notes: The vertical axis is the annual average energy efficiency, between 0 and 1. (b) Bar Chart of Reducible Energy Consumption for the EU and Non-EU Groups Notes: The vertical axis is the estimated annual average of reducible energy consumption. The unit of measurement is quadrillion BTUs.
Sustainability 12 04944 g008
Table 1. Summary Statistics of Average Output, Energy Input, and Energy Productivity Index for 20 OECD Countries, 1992–2014.
Countries/VariablesAnnual Real GDP (Y)Energy Input (E)
Australia759,560.49 (175,281.54)9165.18 (807.55)
Austria309,220.85 (56,641.41)1955.71 (363.62)
Belgium376,454.54 (67,298.53)6873.83 (658.86)
Canada1,201,127.99 (209,265.47)6890.83 (371.59)
Finland175,925.26 (37,793.12)8936.78 (1185.88)
France2,053,349.04 (354,517.80)7012.62 (421.088)
Germany2,912,371.78 (422,470.86)5895.23 (304.03)
Greece276,505.40 (51,521.54)4000.78 (551.46)
Ireland155,637.13 (53,521.13)4872.44 (588.88)
Italy1,911,839.25 (215,882.75)3397.29 (457.09)
Japan4,233,242.28 (231,577.82)6910.15 (379.08)
Korea, Rep.1,211,316.10 (343,360.55)6680.78 (2334.85)
Mexico1,391,473.43 (352,353.99)1593.64 (299.30)
New Zealand114,982.99 (23,353.74)2693.54 (530.81)
Portugal238,144.89 (46,207.78)2450.33 (481.05)
Spain1,224,794.42 (307,470.61)4074.65 (694.89)
Sweden335,742.70 (62,579.79)7652.06 (932.18)
Switzerland338,275.48 (74,689.45)3403.52 (180.23)
United Kingdom2,095,952.86 (359,169.68)5347.64 (545.83)
United States13,581,642.44 (2,235,112.17)11,674.81 (562.09)
Notes: The unit of Y is million dollars and the unit of E is quadrillion BTUs. The figures in the parentheses are standard deviations. All the figures in this table are provided with 2-digit significance. Countries are arranged alphabetically.
Table 2. MLE Estimation of the Stochastic Frontier Analysis (Dependent Variable: Energy Productivity Index).
VariablesCoefficientStd. Err.
α00.032 (0.015)***
α10.042 (0.040)
α20.150 (0.036)***
α30.138 (0.044)***
α40.012 (0.030)
α50.071 (0.031)***
α60.0061 (0.0321)
α70.011 (0.026)
α8−0.0077 (0.0265)
α90.041 (0.032)
α100.061 (0.040)
α11−0.0014 (0.0235)
α120.043 (0.073)
α130.022 (0.067)
α140.035 (0.021)*
α150.040 (0.021)**
α160.072 (0.034)***
α170.017 (0.028)
α180.013 (0.038)
α190.080 (0.027)***
σ20.0320 (0.0031)***
κ0.803 (0.018)***
μ−0.321 (0.079)**
η0.0280 (0.0051)***
Log-likelihood ratio460.0048
No. of observations20
No. of periods22
No. of samples440
Notes: ***, **, and * denote coefficient significance at 1%, 5%, and 10%, respectively. The figures in the parentheses are standard errors. All the figures in this table are provided with 2-digit significance.