Responses of Concrete Using Steel Slag as Coarse Aggregate Replacement under Splitting and Flexure


1
Faculty of Civil Engineering, Ho Chi Minh City University of Technology and Education, 01 Vo Van Ngan St, Thu Duc District, Ho Chi Minh City 700000, Vietnam
2
Faculty of Transportation Engineering, Ho Chi Minh City University of Transport, 02 Vo Oanh St, Ward 25, Binh Thanh District, Ho Chi Minh City 700000, Vietnam
*
Author to whom correspondence should be addressed.
Sustainability 2020, 12(12), 4913; https://doi.org/10.3390/su12124913
Submission received: 16 April 2020
/
Revised: 9 June 2020
/
Accepted: 10 June 2020
/
Published: 16 June 2020
Abstract
:Experimental tests were performed to investigate the responses of coarse steel slag concrete under splitting and flexure. The name of coarse steel slag concrete (CSC) here refers to concrete using industrial byproduct steel slag as natural coarse aggregate replacement. Three CSC types were examined in this investigation as follows: CSC1, CSC2, and CSC3, having a water/cement ratio of 0.57, 0.50, and 0.45, respectively. In the compositions of the three studied CSCs, the water content by weight remained constant and other partial materials were changed, but the ratio of coarse steel slag/fine river sand was still fixed. Under splitting, three types of test methods were conducted including a cylinder splitting test, side-cube splitting test, and diagonal-cube splitting with the same sizes: the diameter of the cylinder and side of the cube were 100 mm. The orders of splitting test methods were observed for CSC2 as follows: cylinder > side-cube > diagonal-cube in terms of maximum applied load, and, cylinder > diagonal-cube > side-cube in terms of splitting strength. Additionally, there were clear size effects on the splitting strengths of CSC2 with different sizes as follows: 70 mm, 100 mm, 150 mm for cylindrical diameter, and/or cubic side. Under flexure, there was a strong co-relationship between compressive strength and flexural resistance of CSCs. The flexural engineering parameters were examined then assessed for plain CSCs, using a rectangular prism with the size of 100 × 100 × 300 mm (width × height × span-length), and, for steel-reinforced beams using CSCs with the size of 200 × 300 × 3000 mm (width × height × span-length).
1. Introduction
The recycling of industrial waste and byproducts has greatly attracted interest from many researchers for the purpose of sustainable infrastructure development. The sustainable factors mentioned here could be listed in relation to some advantages such as saving the cost of construction, reducing waste storage area, minimizing bad influences on the environment, and preserving natural energy and resources [1]. Steel slag is one of the common industrial wastes that is formed from the iron and steel making industries [2]. Specifically, steel furnace slag can be produced from two major technologies: Basic Oxygen Furnace (BOF) and Electric Arc Furnace (EAF). The EAF will create two slag types, so-called black slag (Electric Arc Furnace Slag, EAFS) and white slag (Ladle Furnace Slag, LFS), in the process of remelting unalloyed and alloyed steel waste, respectively [3]; black slag was also the steel slag kind used in this investigation. For practical application, some available studies reported that steel slag could be utilized in ceramics and the pavement of roads [4,5,6]. Used as a cement replacement material, the steel-slag powder could play a role as a mineral admixture [7,8] and also influences on hydration process, similar to cement in concrete [9]. Additionally, the steel-slag powder could be used to improve the mechanical and self-sensing properties of high-performance fiber-reinforced concrete [10,11]. In a large particle form, steel-slag could be employed as a coarse aggregate or a fine aggregate to produce concrete [12,13]. Compared with the crushed limestone aggregate, the steel-slag aggregate could generate a denser microstructure of concrete leading to better mechanical resistances [14,15].
In Vietnam, there has been a great demand to recycle steel slag due to its harmful environmental impact, since a great amount of excess steel slag has limited employment, e.g., only Ba Ria-Vung Tau province, belonging to Southern Vietnam, has annually received from steel manufacturing plants about 3.75 million tons of billet, and steel slag production is nearly up to 412,000–562,000 tons in a year [16]. This has become a major interest of government administrators because a massive amount of steel slag increasing year by year possibly becomes an environmental risk. A few references [17,18,19,20,21] are available regarding the application of Vietnamese steel slag. Lam et al. [17,18,19] proposed using steel-slag aggregate for roller-compacted concrete pavement. Recently, the authors studied coarse steel slag concretes (CSCs) using steel slag sourced from Ba Ria-Vung Tau province [20,21]. These studies focused mainly on various mixing proportions of CSCs and their corresponding compressive performances. This research work will highlight the splitting and flexural responses of CSCs, with some motivations as follows:
- (a)
- Even though most engineering parameters of concrete have been taken under compression, researchers have still studied its tensile properties together. This is due to the fact that many structural members in a construction contained a tensile stress phase on a part of the cross-section, e.g., beam structures, eccentric-loaded columns. The splitting tensile test and the flexural tensile test were used in this research because these testing types were comparatively simpler and easier than direct tensile tests [22,23].
- (b)
- Both compressive cube specimens and compressive cylinder specimens have been commonly used according to testing standards. The cylinder specimen with a diameter of 150 mm and a height of 300 mm has been applied primarily in Canada, United States, and Australia. On the contrary, the cube specimen with dimensions of 150 mm or 100 mm has been used largely in Europe and Vietnam [24]. In general, the splitting specimen may be different from a compressive specimen in shape, however, it is very convenient if they are identical: no need for various mold types and time is saved for specimen preparation. Therefore, the cube specimens and cylinder specimens were examined then evaluated in this investigation.
- (c)
- Concretes and/or quasi-brittle materials, with their brittle nature, have revealed the size-dependent mechanical properties [25,26,27]. In the previous study [21], the authors explored the clear size effect on the compressive strength of CSCs. How does size and shape affect the splitting strength of CSCs? And how will splitting test methods affect the splitting strength of CSCs, despite using identical-sized specimens? An investigation is required to obtain conversion factors for CSCs using various sizes of splitting specimens, as well as splitting test methods; this would help civil engineers transfer rapidly from one to others.
The results of this study are expected to answer the above questions. This helps to better understand the mechanical properties of CSCs, and furthermore, helps to ensure progress in construction safely and proper engineering design using CSCs. The eventual aim of this research is to widen the application of steel slag with its huge quantity consumed. The specific objectives are listed as follows: (1) to evaluate the splitting strengths of CSC using different testing methods, (2) to discover the influence of different-sized specimens on the splitting strength of CSC, (3) to investigate the flexural behaviors of plain CSCs, and, (4) to investigate the flexural behaviors of reinforced CSC beams.
2. Direct and Indirection Tensile Test of Concrete
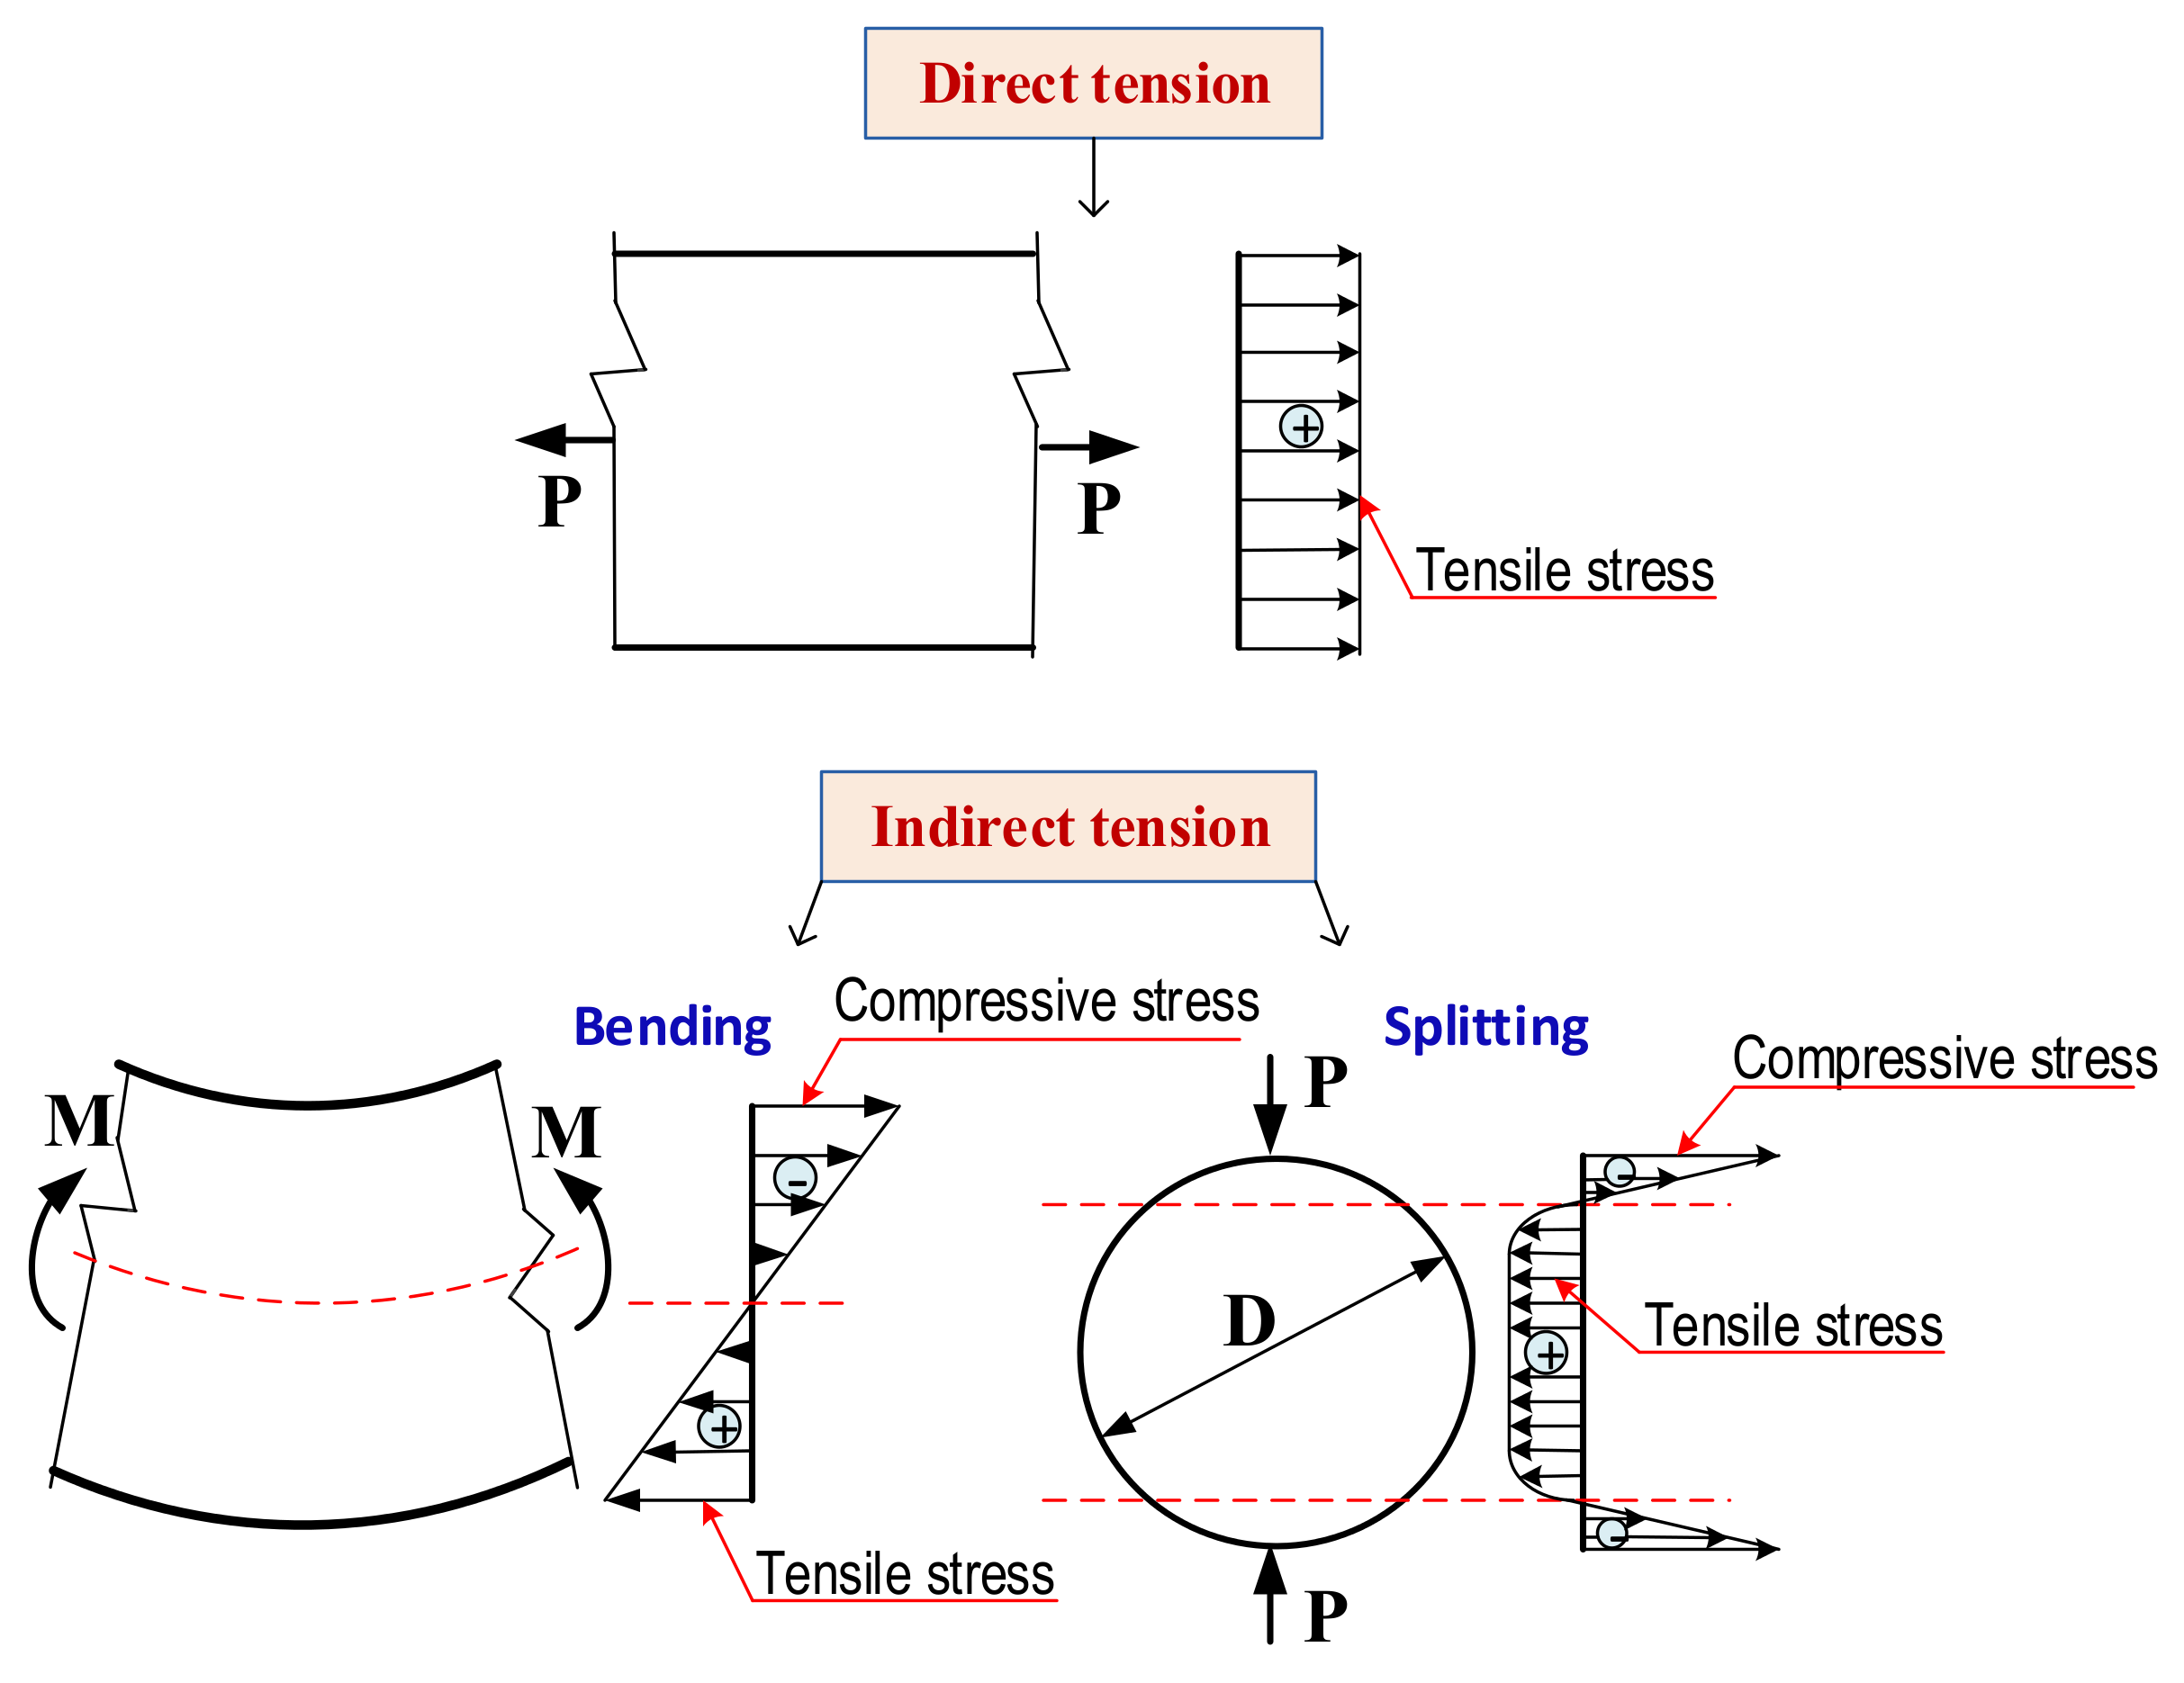
Generally, there are three forms of loading to measure the strength of a material in tension: direct tension, flexure, and splitting tension [22]. The direct tensile test has been frequently used for steel bars but rarely used for concrete specimens, since the brittleness of concrete commonly generates a local failure at two ends of specimens [23], i.e., the low tensile strength of concrete badly affected the recorded histories of load and displacement. Therefore, indirect tensile tests, including the tensile bending test and tensile splitting test, have been suitable for concrete specimens. Figure 1 describes the different stress distributions on the cross-section of the specimen in direct and indirect tension. As shown in Figure 1, the indirect tension had both phases: compressive stress and tensile stress distributed on the cross-section [28]; on the contrary, the direct tension had only tensile stress. With the support of the compressive phase, the indirect tensile strength would be higher than the direct tensile strength [29]. With reference to ACI 318 [30], the direct tensile strength (), flexural strength (), and splitting strength () could be correlated with compressive strength () under the square root scale, given by Equation (1), Equation (2) and Equation (3), respectively. The scale coefficients in Equations (1)–(3) for traditional concrete are ranked as follows: = 0.33 < = 0.56 < = 0.62 [30]. These coefficients were adopted using standard specimens as follows: cylinder with a diameter of 150 mm and a length (or height) of 300 mm for splitting (or compressive) specimens, a rectangular prism with width × height × span-length of 150 × 150 × 450 mm for the flexural specimens. For CSCs, the values of and would be experimentally investigated.
2.1. Splitting Tension
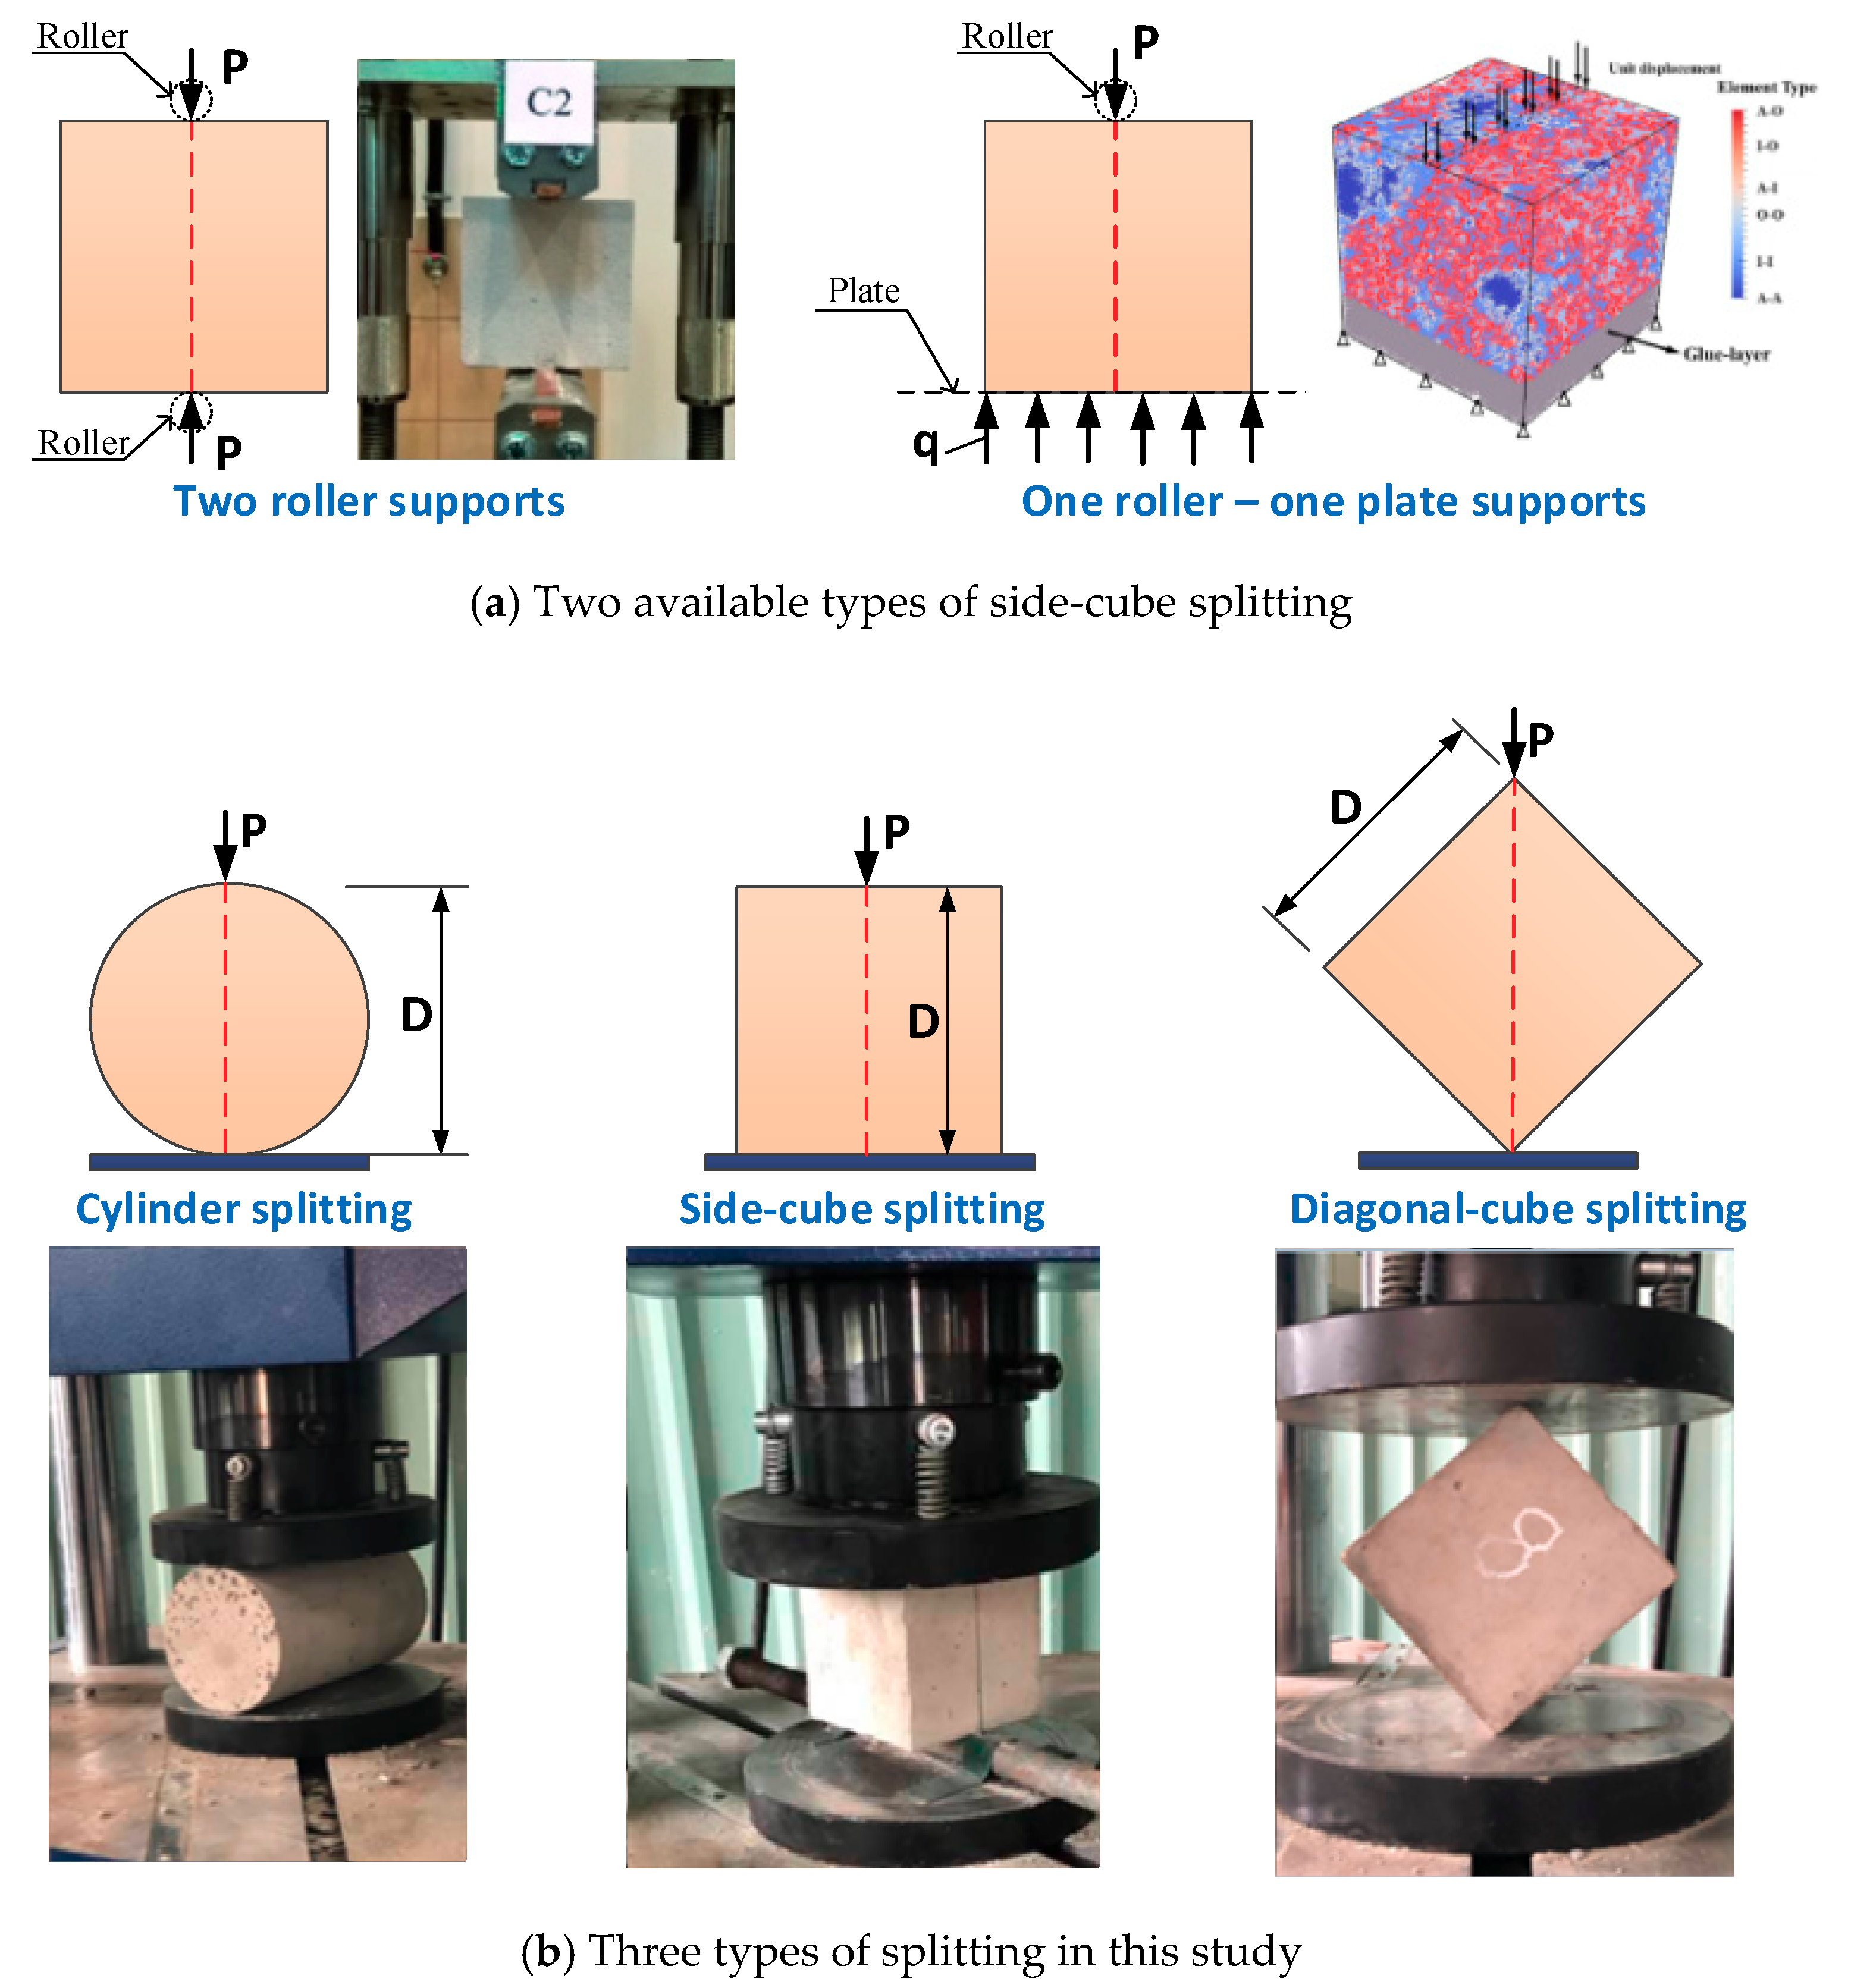
It has been established that the simplest and most reliable method is the splitting tensile test using a cylinder specimen. This testing type provides a lower coefficient of variation [31,32]. However, cube specimens have also been used for side-cube splitting or diagonal-cube splitting. Besides, side-cube splitting could be conducted under two roller supports [28,33,34] or one roller–one plate supports [35,36] as described in Figure 2a. The splitting type with one roller–one plate supports was chosen for the research owing to its being more stable and suitable for laboratory equipment. Figure 2b describes three testing methods for splitting tests in this investigation: cylinder splitting, side-cube splitting, and diagonal-cube splitting.
As described in Figure 2, the specimen under applied load () would fail with the main crack along a vertical plane, and, the splitting stress was perpendicular to the direction. Based on the theory of elasticity, Equations (4) and (5) were adopted for calculating the cylinder splitting strength () and diagonal-cube splitting strength (), respectively [28]. Equation (6) was proposed by Zhang et al. [36] for side-cube splitting strength (). In these equations, was the maximum applied load, was the diameter of the cylinder specimen or side of the cube specimen, was the length of the cylinder specimen.
2.2. Flexural Tension
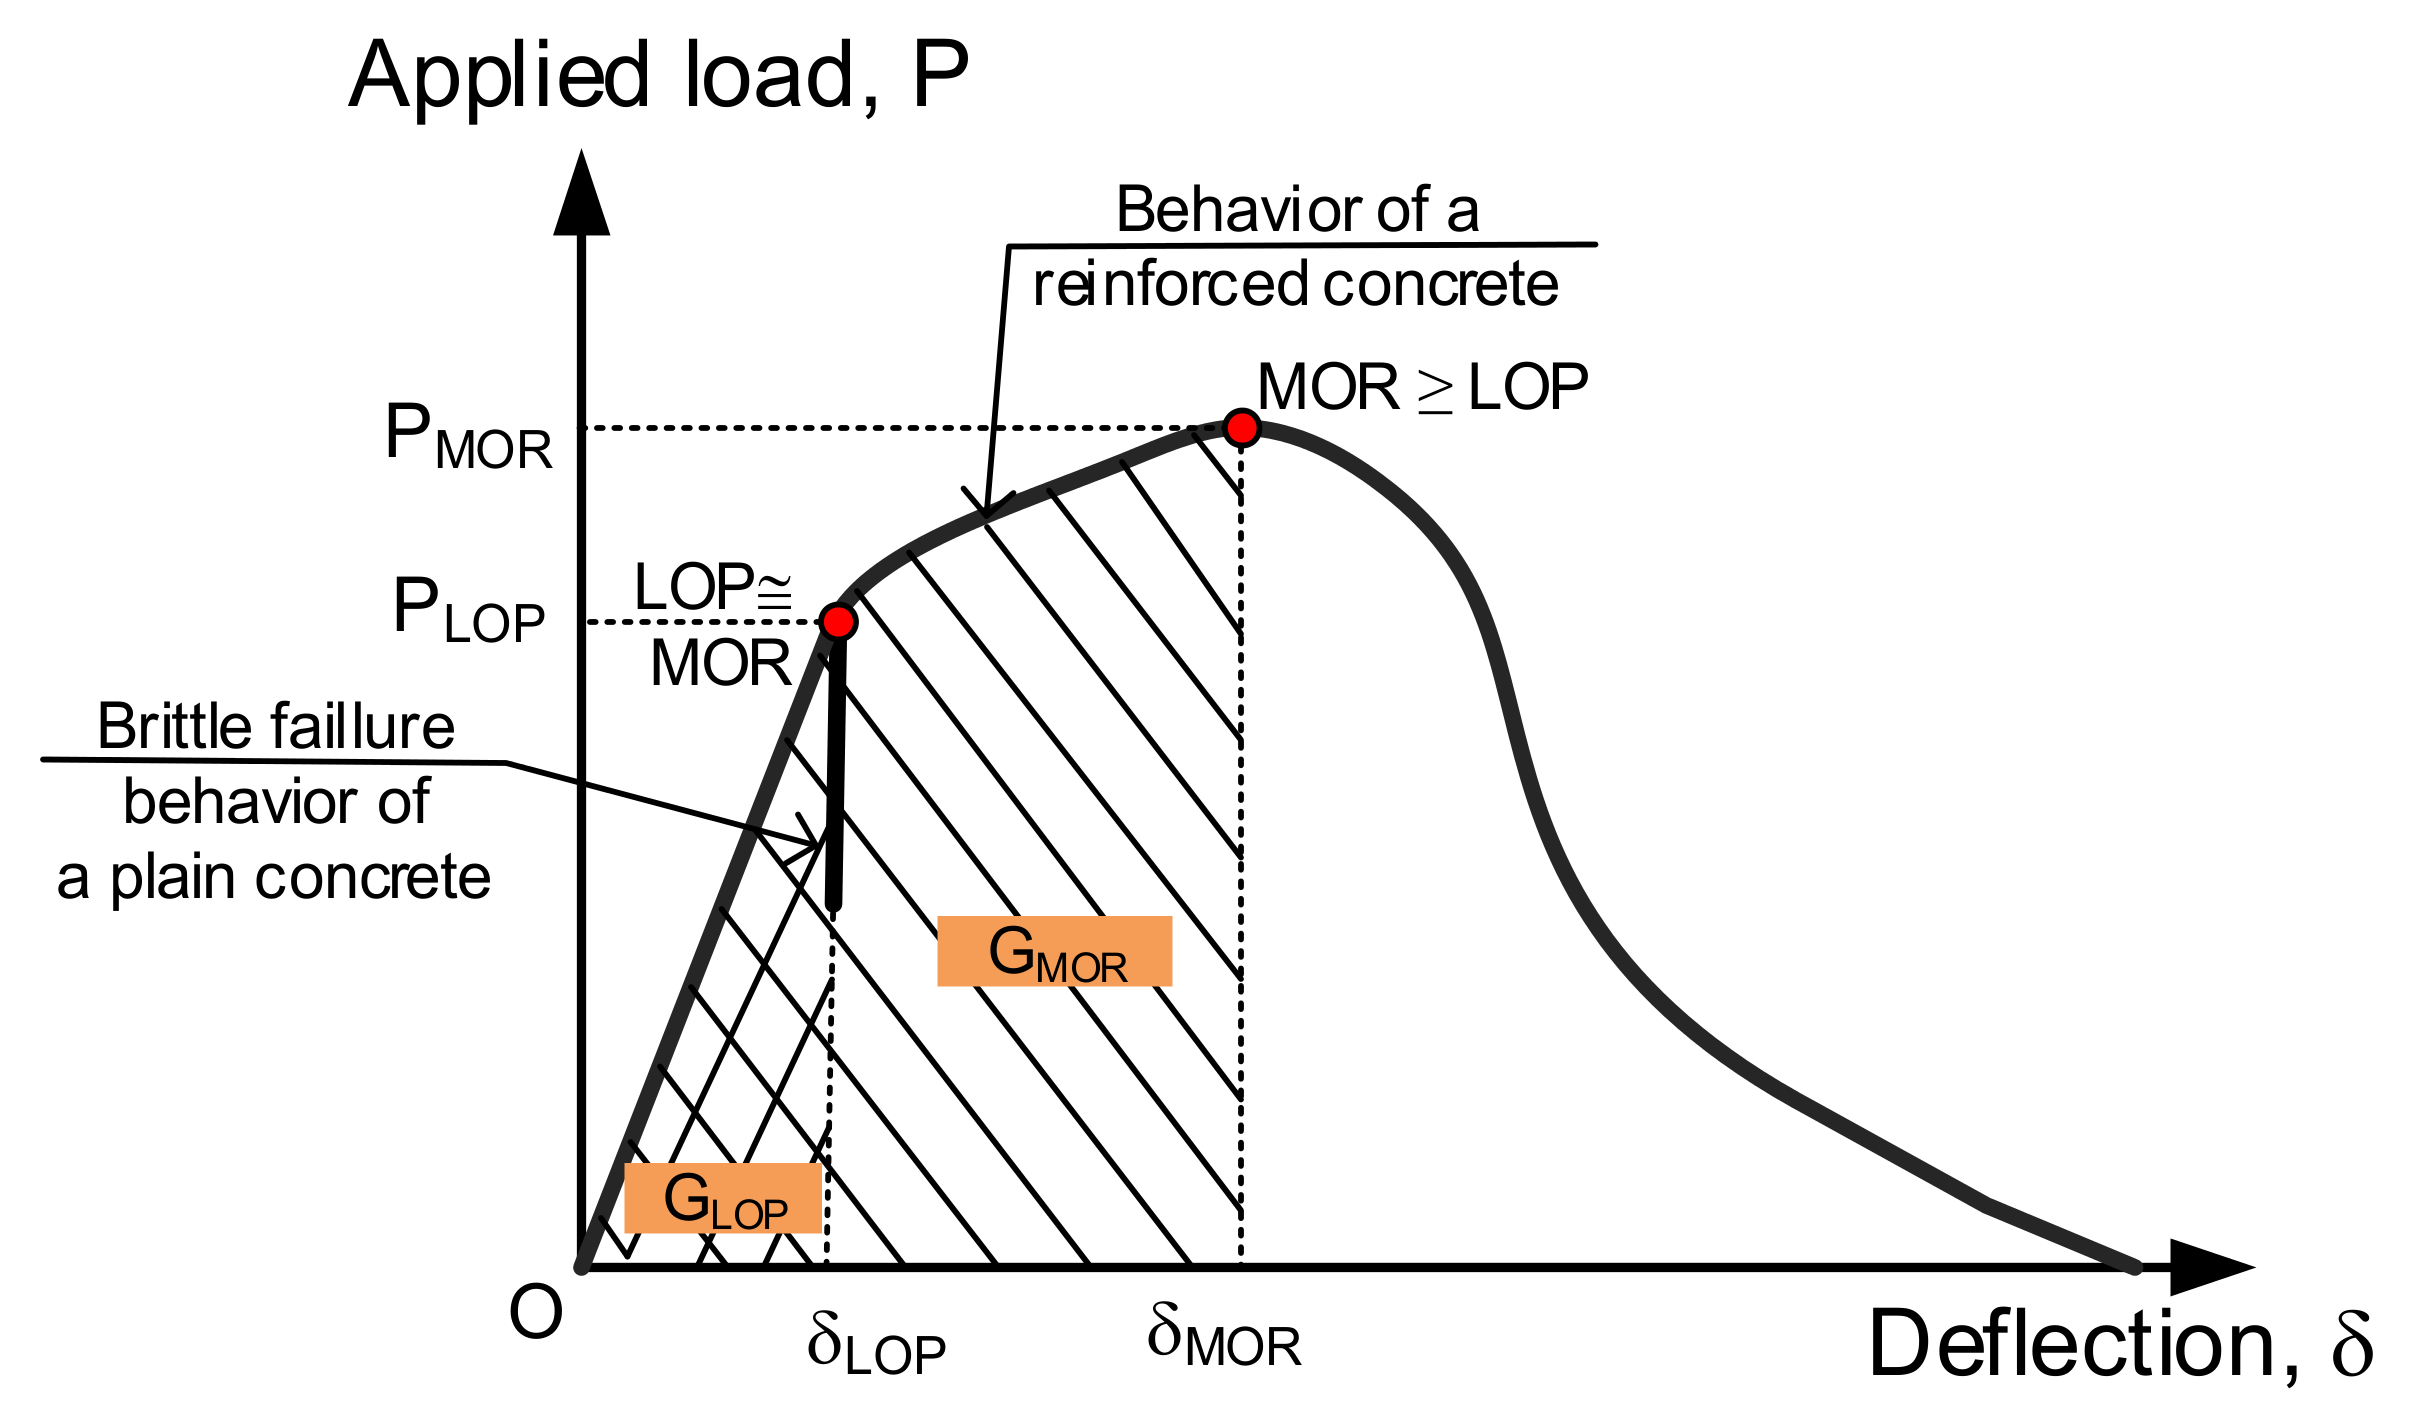
Flexural behavior of CSC material and reinforced CSC beams were assessed under a four-point bending test (4PBT) regarding ASTM D6272 [37], and a three-point bending test (3PBT) regarding ASTM D790 [38], respectively. Figure 3 displays the typical load versus deflection response of concrete.
As shown in Figure 3, two engineering points in the typical flexural response curve should be noticed: (i) the limit of proportionality (LOP), and (ii) the modulus of rupture (MOR). The LOP was the limit of the linear part while the MOR was the peak of the curve. The flexural strength at LOP () and flexural strength at MOR () were given by Equations (7) and (8) for 4PBT and 3PBT, respectively. In Equations (7) and (8), , and were the span-length, width, and height of the flexural specimen, respectively. Furthermore, the energy absorption capacity was determined as the area below the load versus the deflection response curve, using Equations (9) and (10) for and , respectively. and represent the energy absorbed by a beam under an increasing applied load accompanied with a change of the corresponding deflection, from 0 to , and from 0 to , respectively.
3. Experiment
3.1. Materials, Mixtures and Specimen Preparation
The outline of the experimental scheme was displayed in Figure 4, while Table 1 provides the compositions, compressive strengths, and elastic modulus of three CSC types including CSC1, CSC2, CSC3 having a water/cement (W/C) ratio of 0.57, 0.50 and 0.45, respectively. In the compositions of three studied CSCs, the water content by weight remained constant and other partial materials were changed, but the ratio of coarse steel slag/fine river sand was still fixed. The compressive strengths () of CSC1, CSC2, CSC3 were 22.91, 32.26, 35.68 MPa, respectively, while their modulus of elasticities () were 31.12, 36.68, 39.21 GPa, respectively [21].
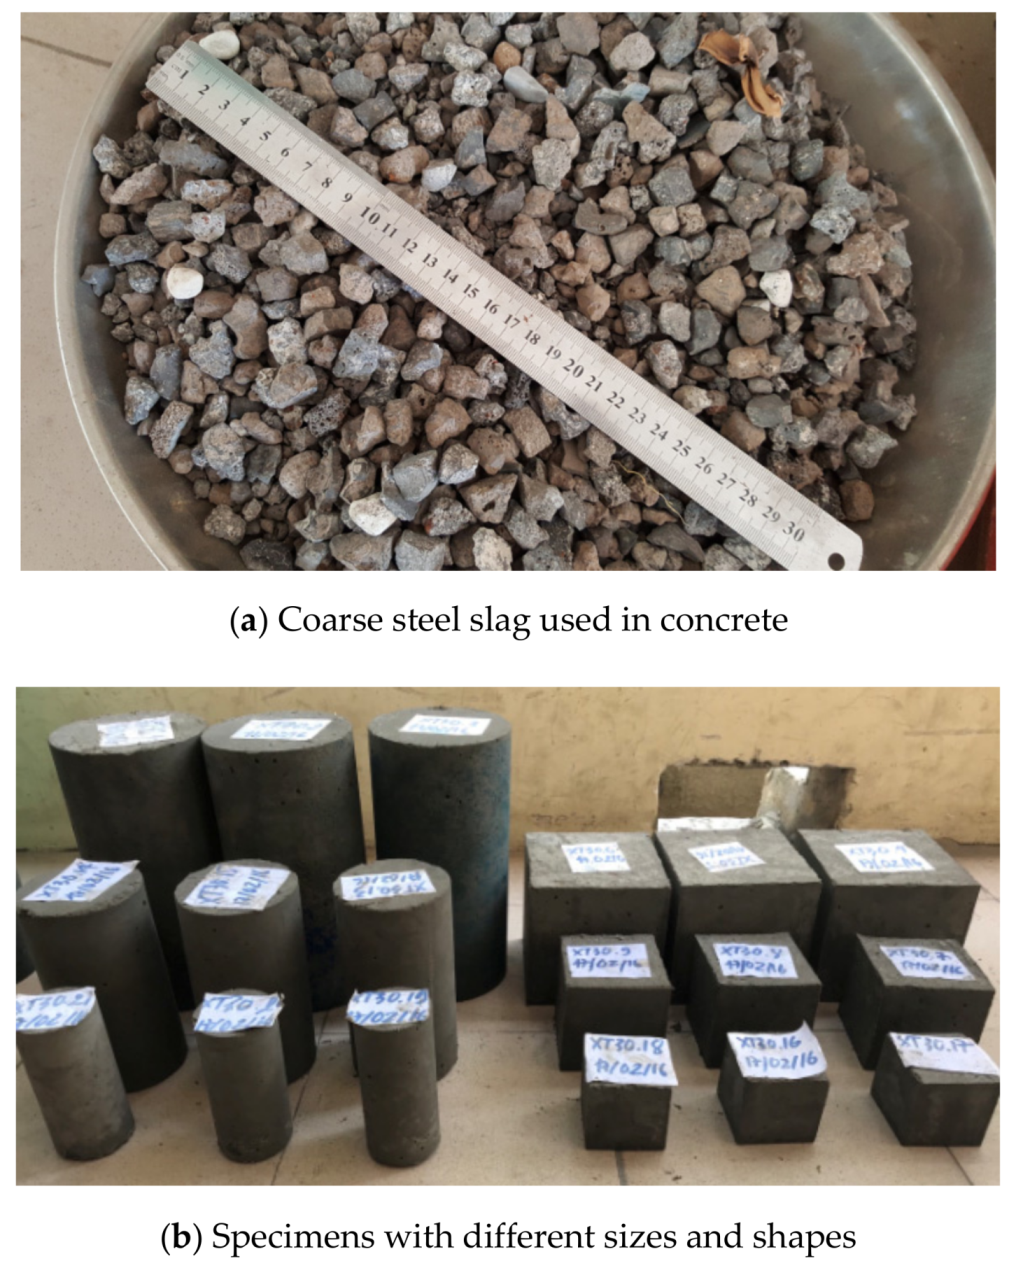
Table 2 presents the size distribution of fine aggregate and coarse aggregate while the chemical composition of coarse steel slag was presented in Table 3. Moreover, Table 4 provides the physical properties of the coarse steel slag. Figure 5a shows the photos describing steel slag used as a coarse aggregate in this research. For splitting tests, six different-sized specimens for 7 tested series were designed as follows: cube 70.7 mm, cube 100 mm (used for side-cube splitting and diagonal-cube splitting), cube 150 mm, cylinder 70 mm, cylinder 100 mm and cylinder 150 mm in diameter; the cast specimens were shown in Figure 5b. The length of the cylinder splitting specimen was twice its diameter. The cement PCB40 INSEE made in Vietnam was used for making CSCs. The CSCs were mixed using a laboratory mixer with a capacity of 150 L. The big beams were cured in a laboratory with a temperature of 28 ± 5 °C and a relative humidity of 70–80% prior to testing, and in the first week, wet coverings would remain in the beam surface and be kept moist during curing work. The other specimens were cured in water with a temperature of 25 ± 5 °C. They would be taken out of the water, then dried at room temperature; the curing time depended upon the plan of the test presented in Figure 4. At least 3 specimens were examined and averaged for each testing series, except that the big beam only examined one for each CSC type.
3.2. Test Setup
A MATEST machine with 100-ton-capacity was used for bending and splitting tests, while a 50-ton servo-hydraulic actuator, with a large frame, connecting a portable data logger with 30 channels, was used for testing the big beam. All tests were displacement controlled with a loading speed of 1.0 mm/min. The specimens and big beams were tested at a temperature of 28 ± 5 °C and relative humidity of 70–80% in the laboratory room.
4. Results and Discussion
4.1. Splitting Test
4.1.1. Splitting Behaviors of CSC2
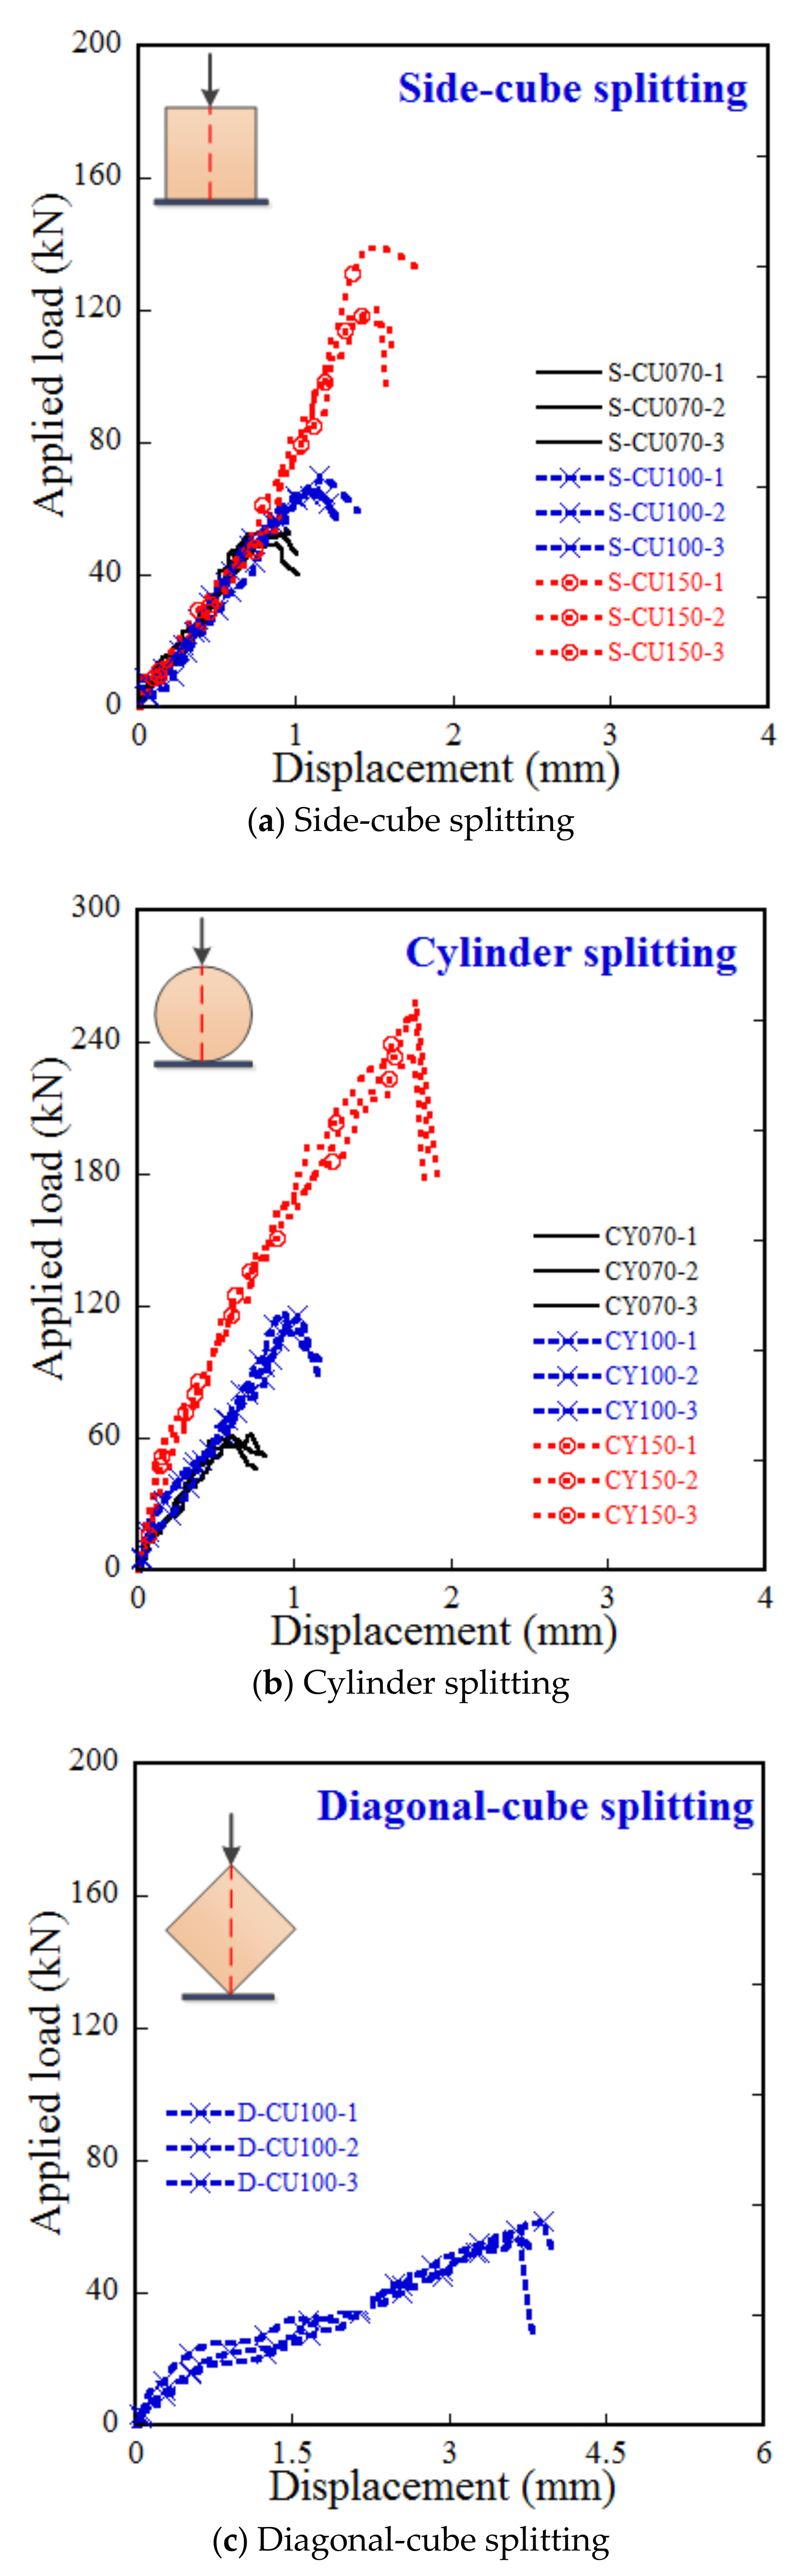
A total of seven splitting series were examined at the testing age of 28 days using mixture CSC2. Figure 6a shows the responses of applied load versus displacement of side-cube splitting specimens with three different-sized series named S-CU070, S-CU100, S-CU150, for the cube sides of 70.7 mm, 100 mm, 150 mm, respectively. Figure 6b presents the responses of cylinder splitting specimens using three different-sized series named CY070, CY100, CY150 for cylinder diameters of 70 mm, 100 mm, 150 mm, respectively. Figure 6c displays only the diagonal-cube splitting behavior using 100-mm cube specimens named D-CU100. As shown in Figure 6a,b, the larger-sized specimens revealed the higher peak load and stiffness indicated through the curve slope. The displacement at peak load of the diagonal-cube splitting behavior was observed to be fairly higher than those of other series, although the corresponding peak load was rather low.
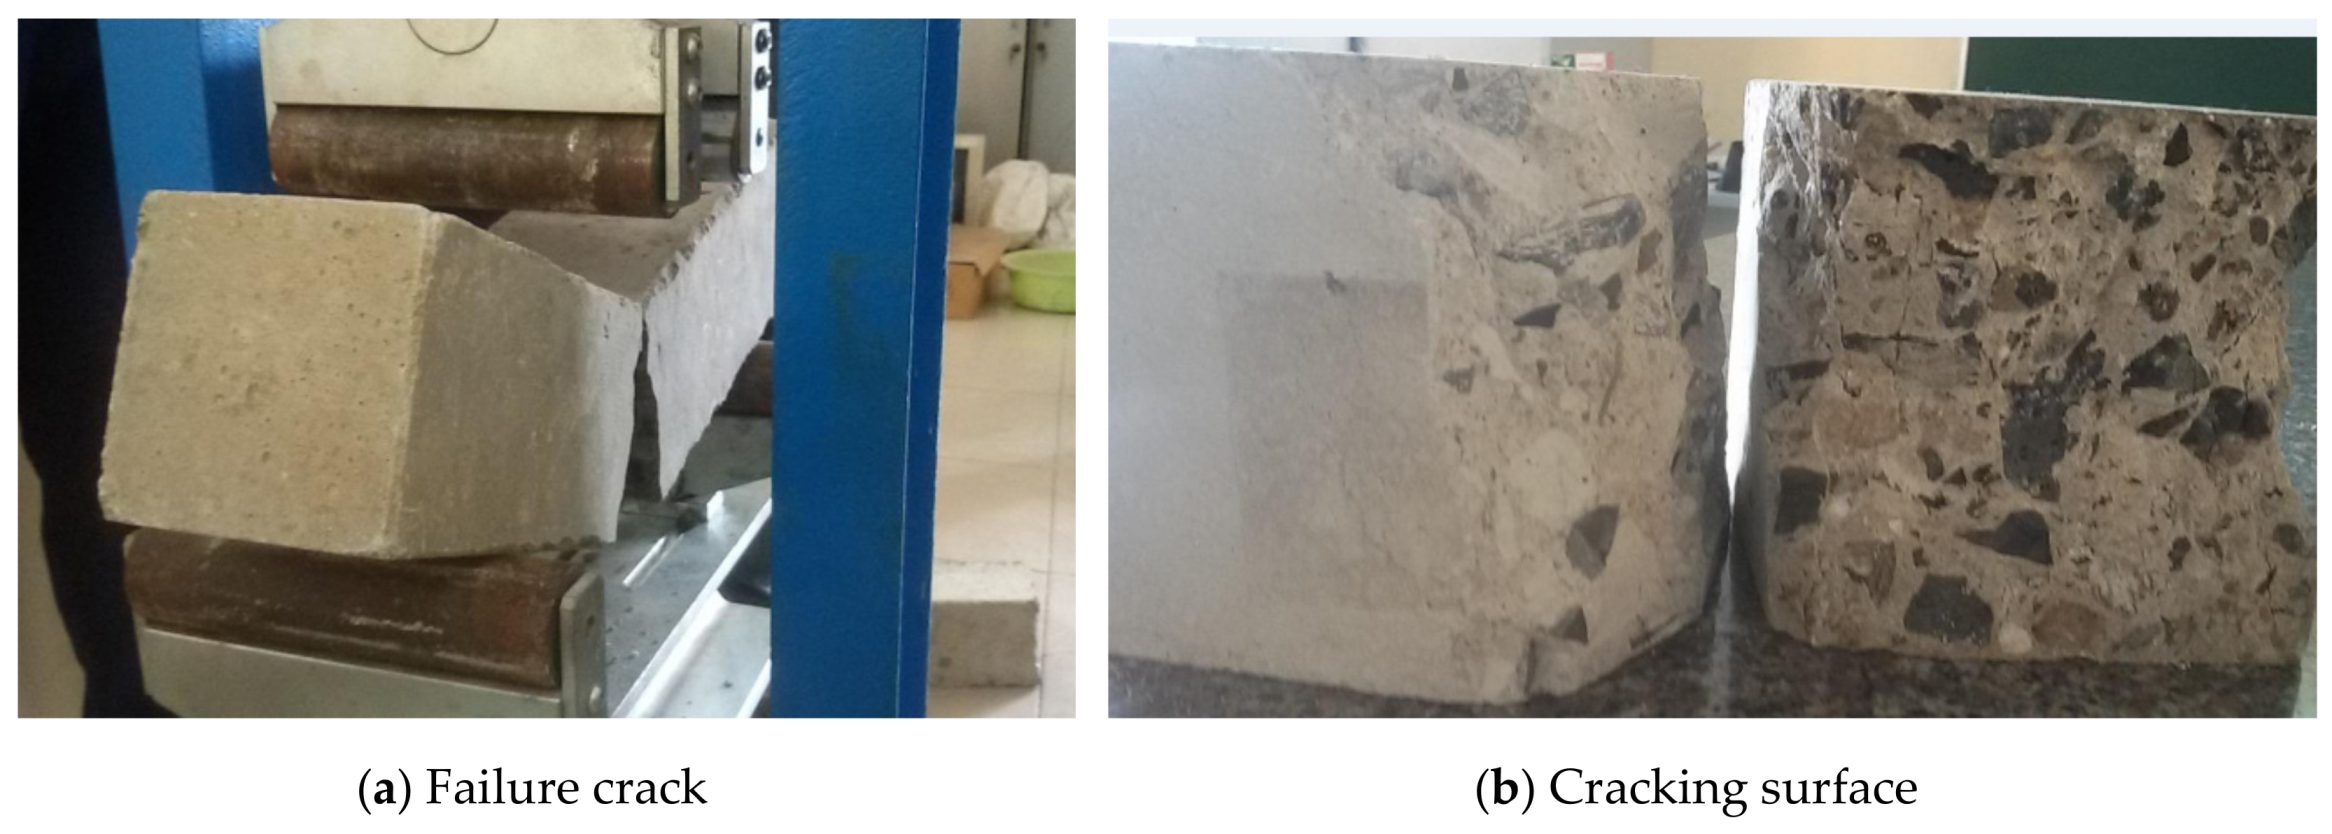
Table 5 provides the details of test results with their splitting strengths derived from Equations (4)–(6). Figure 7 shows the influences of specimen size and shape on the cylinder and side-cube splitting strengths of the CSC2. With identical shape, the size-dependent splitting strength was explored for both cylinder splitting specimens and side-cube splitting specimens: the larger-sized specimens produced the lower splitting strength. Figure 8 displays the photos of typical crack patterns of the tested specimens: cylinder splitting (a), side-cube splitting (b), and diagonal-cube splitting (c). The failure cracks propagated vertically along with the applied load, regardless of the splitting series. Nonetheless, the tip of the diagonal-cube splitting specimen was locally broken, and this observation could explain why the measured displacement at the peak load of the D-CU100 series was relatively large.
4.1.2. Influence of Testing Methods on Splitting Strength of CSC
Based on the data presented in Table 5, the splitting strengths of CSC2 were evaluated using different test methods, including cylinder splitting, side-cube splitting, and diagonal-cube splitting. Although the three tested series had the same size, 100 mm in diameter of the cylinder or 100 mm in side of the cube, their splitting strengths were different, with an order as follows: CY100 (3.64 MPa) > D-CU100 (3.11 MPa) > S-CU100 (3.56 MPa). Compared with the CY100, the splitting strengths of S-CU100 and D-CU100 were lower than that of CY100 (14.6% and 2.2%, respectively). Considering the convenience in testing, the cylinder splitting was highly self-balancing, whereas the side-cube splitting and the diagonal-cube splitting were more difficult due to their easy instability under loading.
4.1.3. Conversion Factors for Splitting Specimens of CSC with Different Specimen Types
Since various standard codes still exist using different standard-specimens, a conversion factor helps to quickly translate a mechanical parameter from one standard-specimen to another. In this section, the splitting strength of various series would be compared with that of CY150 using conversion factors () given by Equation (11). In Table 6, the CY150 was considered as the basic specimen, and, the obtained conversion factor for the splitting strength of CSC2 was presented. Table 6 also provided the conversion factor for the splitting strength of traditional concrete (NC) reported by Kanos et al. [39]: the conversion factors for the splitting strength of CSC were the same as that of NC, with a coarse aggregate size = 5 mm, but considerably higher than that of NC, with = 15 mm.
Here, was the splitting strength of the cylinder with a diameter of 150 mm, and was the splitting strength of the tested series.
Adopting ACI 318 [30], the splitting strength of traditional concrete could be related to the compressive strength under square root proportionality, and, as mentioned in Equation (3), the scale factor of = 0.56 was recommended for traditional concrete. It was noted that both and in Equation (3) were examined at the testing age of 28 days using a cylinder of 150 × 300 mm. For CSC2, the = 3.53 MPa and =36.68 MPa were averaged from cylinder specimens of 150 × 300 mm, thus the = 0.58 for CSC2 was attained. This value was somewhat higher than for traditional concrete, of course, and it was required to conduct further study with a lot of CSC types together, and with a large number of specimens tested for affirming.
4.1.4. Brittleness Indicator Regarding Splitting Strength of CSC2
Weibull developed his size effect law based on the statistical approach [25]. Equation (12) describes the principle rule of this law for concrete or quasi-brittle materials and Equation (13) is used to correlate the failure strength () with its failure probability . Equation (14) is the logarithm form of Equation (13), it is simply a linear function of , where , , . Using the least square method with linear regression, the value of and can be obtained. In the analysis, = , is the total of tested specimens used for analysis, is strength order of , is the scale parameter and is the failure strength.
Here, and are the different effective volumes of two specimens with their corresponding strengths of and , respectively; is considered as a brittleness indicator, often called Weibull modulus.
Figure 9a performs the achievement of brittleness indicator () for both side-cube splitting strength and cylinder splitting strength. The brittleness indicator was achieved using the least-squares method as follows: = 3.27 with 9 side-cube splitting specimens and = 17.02 with 9 cylinder splitting specimens in the analysis. Figure 9b presents the Weibull distribution of splitting strength using the achieved brittleness indicator. The analysis results revealed that the cylinder splitting specimen, with lower , was less sensitive to size than the side-cube splitting specimen with higher .
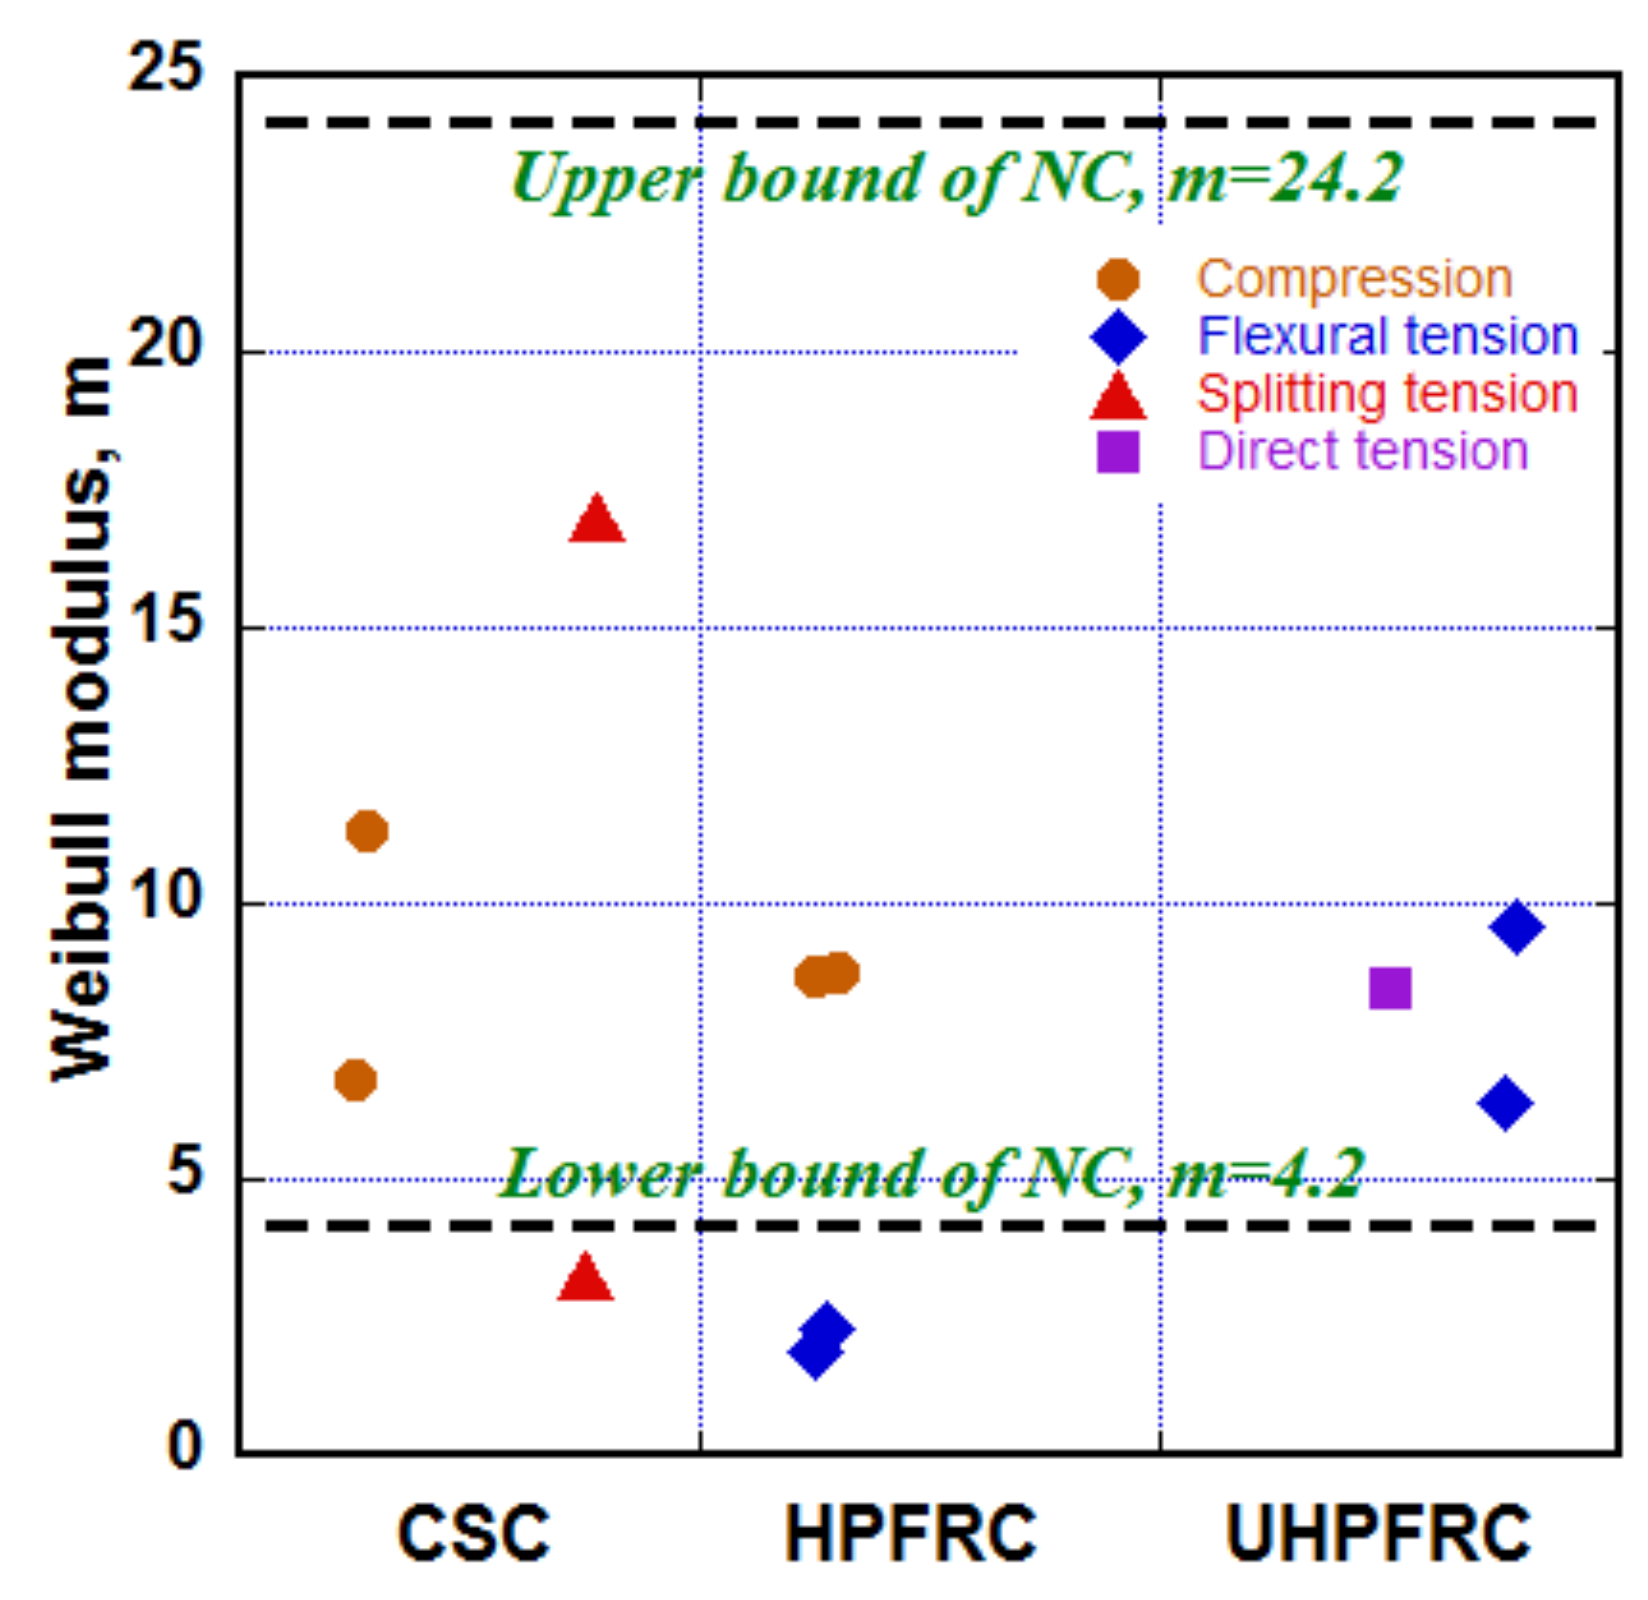
Table 7 and Figure 10 show the brittleness indicator (Weibull modulus) of various kinds of concrete, under different tests. Four kinds of concrete were compared including CSC, HPFRC, UHPFRC, and traditional concrete (NC). The loading kinds were compression, direct tension, flexural tension, splitting tension. The achieved = 17.02 for the cylinder splitting strength of CSC was inside the boundary of NC, ranging from 4.2 to 24.2, as summarized by Bazănt [42], however, the value of = 3.27 for the side-cube splitting strength of CSC was below this range. In addition, the values of HPFRC under flexure were also outside the range of NC, whereas other cases were inside.
4.2. Response of CSCs under Flexure
4.2.1. Flexural Strength of Plain CSCs
The typical flexural behavior of the plain CSCs was provided in Figure 3 for plain concrete with brittle failure. Figure 11 shows the typical crack of CSCs under 4-PBT; the flexural specimen was 100 × 100 × 300 mm (width × height × span-length). As shown in Figure 11, only a single crack occurred in all tested specimens and the crack surface was toward perpendicular to the neutral axis. The flexural strength, denoted (MPa), was calculated using Equation (7) with in this case. Table 8 supplies the values of CSC1, CSC2, and CSC3 as follows: 4.83, 5.75, and 6.14 MPa at testing age of 28 days, respectively; 4.88, 5.86, and 6.36 MPa at testing age of 56 days, respectively.
Figure 12 presents the evaluation of the flexural strengths of CSCs. As shown in Figure 12, the of CSCs at 56-days’ age were higher than those at 28-days’ age, regardless of matrix type. In addition, the increase in was completely consistent with the increase in compressive strength () given in Table 1. i.e., the higher compressive strength would produce a higher flexural strength. According to ACI 318 [30], the flexural strength of traditional concrete would be proportional to the square root of the compressive strength, as presented in Equation (2), with scale factor = 0.62. It was noticed that the value = 0.62 was applied for cylinder compressive specimen with dimensions of 150 × 300 mm (diameter × height) and prism flexural specimen with dimensions of 150 × 150 × 450 mm (width × height × span-length). For CSCs, the was averaged to be 1.04, from testing data; this value was considerably higher than that of traditional concrete. The significant difference of was thought to be due to size effect; flexural specimens in this study, having dimensions of 100 × 100 × 300 mm, might produce a higher value in comparison with the of 150 × 150 × 450 mm.
4.2.2. Flexural Behaviors of Reinforced CSC Beams
Three reinforced CSC beams were tested under three-point bending, using three mixture types: CSC1, CSC2, CSC3. It was noticed that the order of concrete type in terms of was as follows: CSC1 < CSC2 < CSC3. The details of the reinforced CSC beams were described in Figure 13a, while the properties of steel reinforcement were provided in Table 9. The reinforcement/section ratio of the beams was 1.28%. Deflection and tensile strain at beam bottom were measured with the help of Linear Variable Differential Transformers (LVDTs) and strain gauges; their specific locations were provided in Figure 13b. The flexural parameters would be evaluated at LOP and MOR as follows: load-carrying capacity at LOP (), midspan deflection capacity at LOP (), midspan flexural strain at LOP (), energy absorption capacity at LOP (), load-carrying capacity at MOR (), midspan deflection capacity at MOR (), midspan flexural strain at MOR (), energy absorption capacity at MOR ().
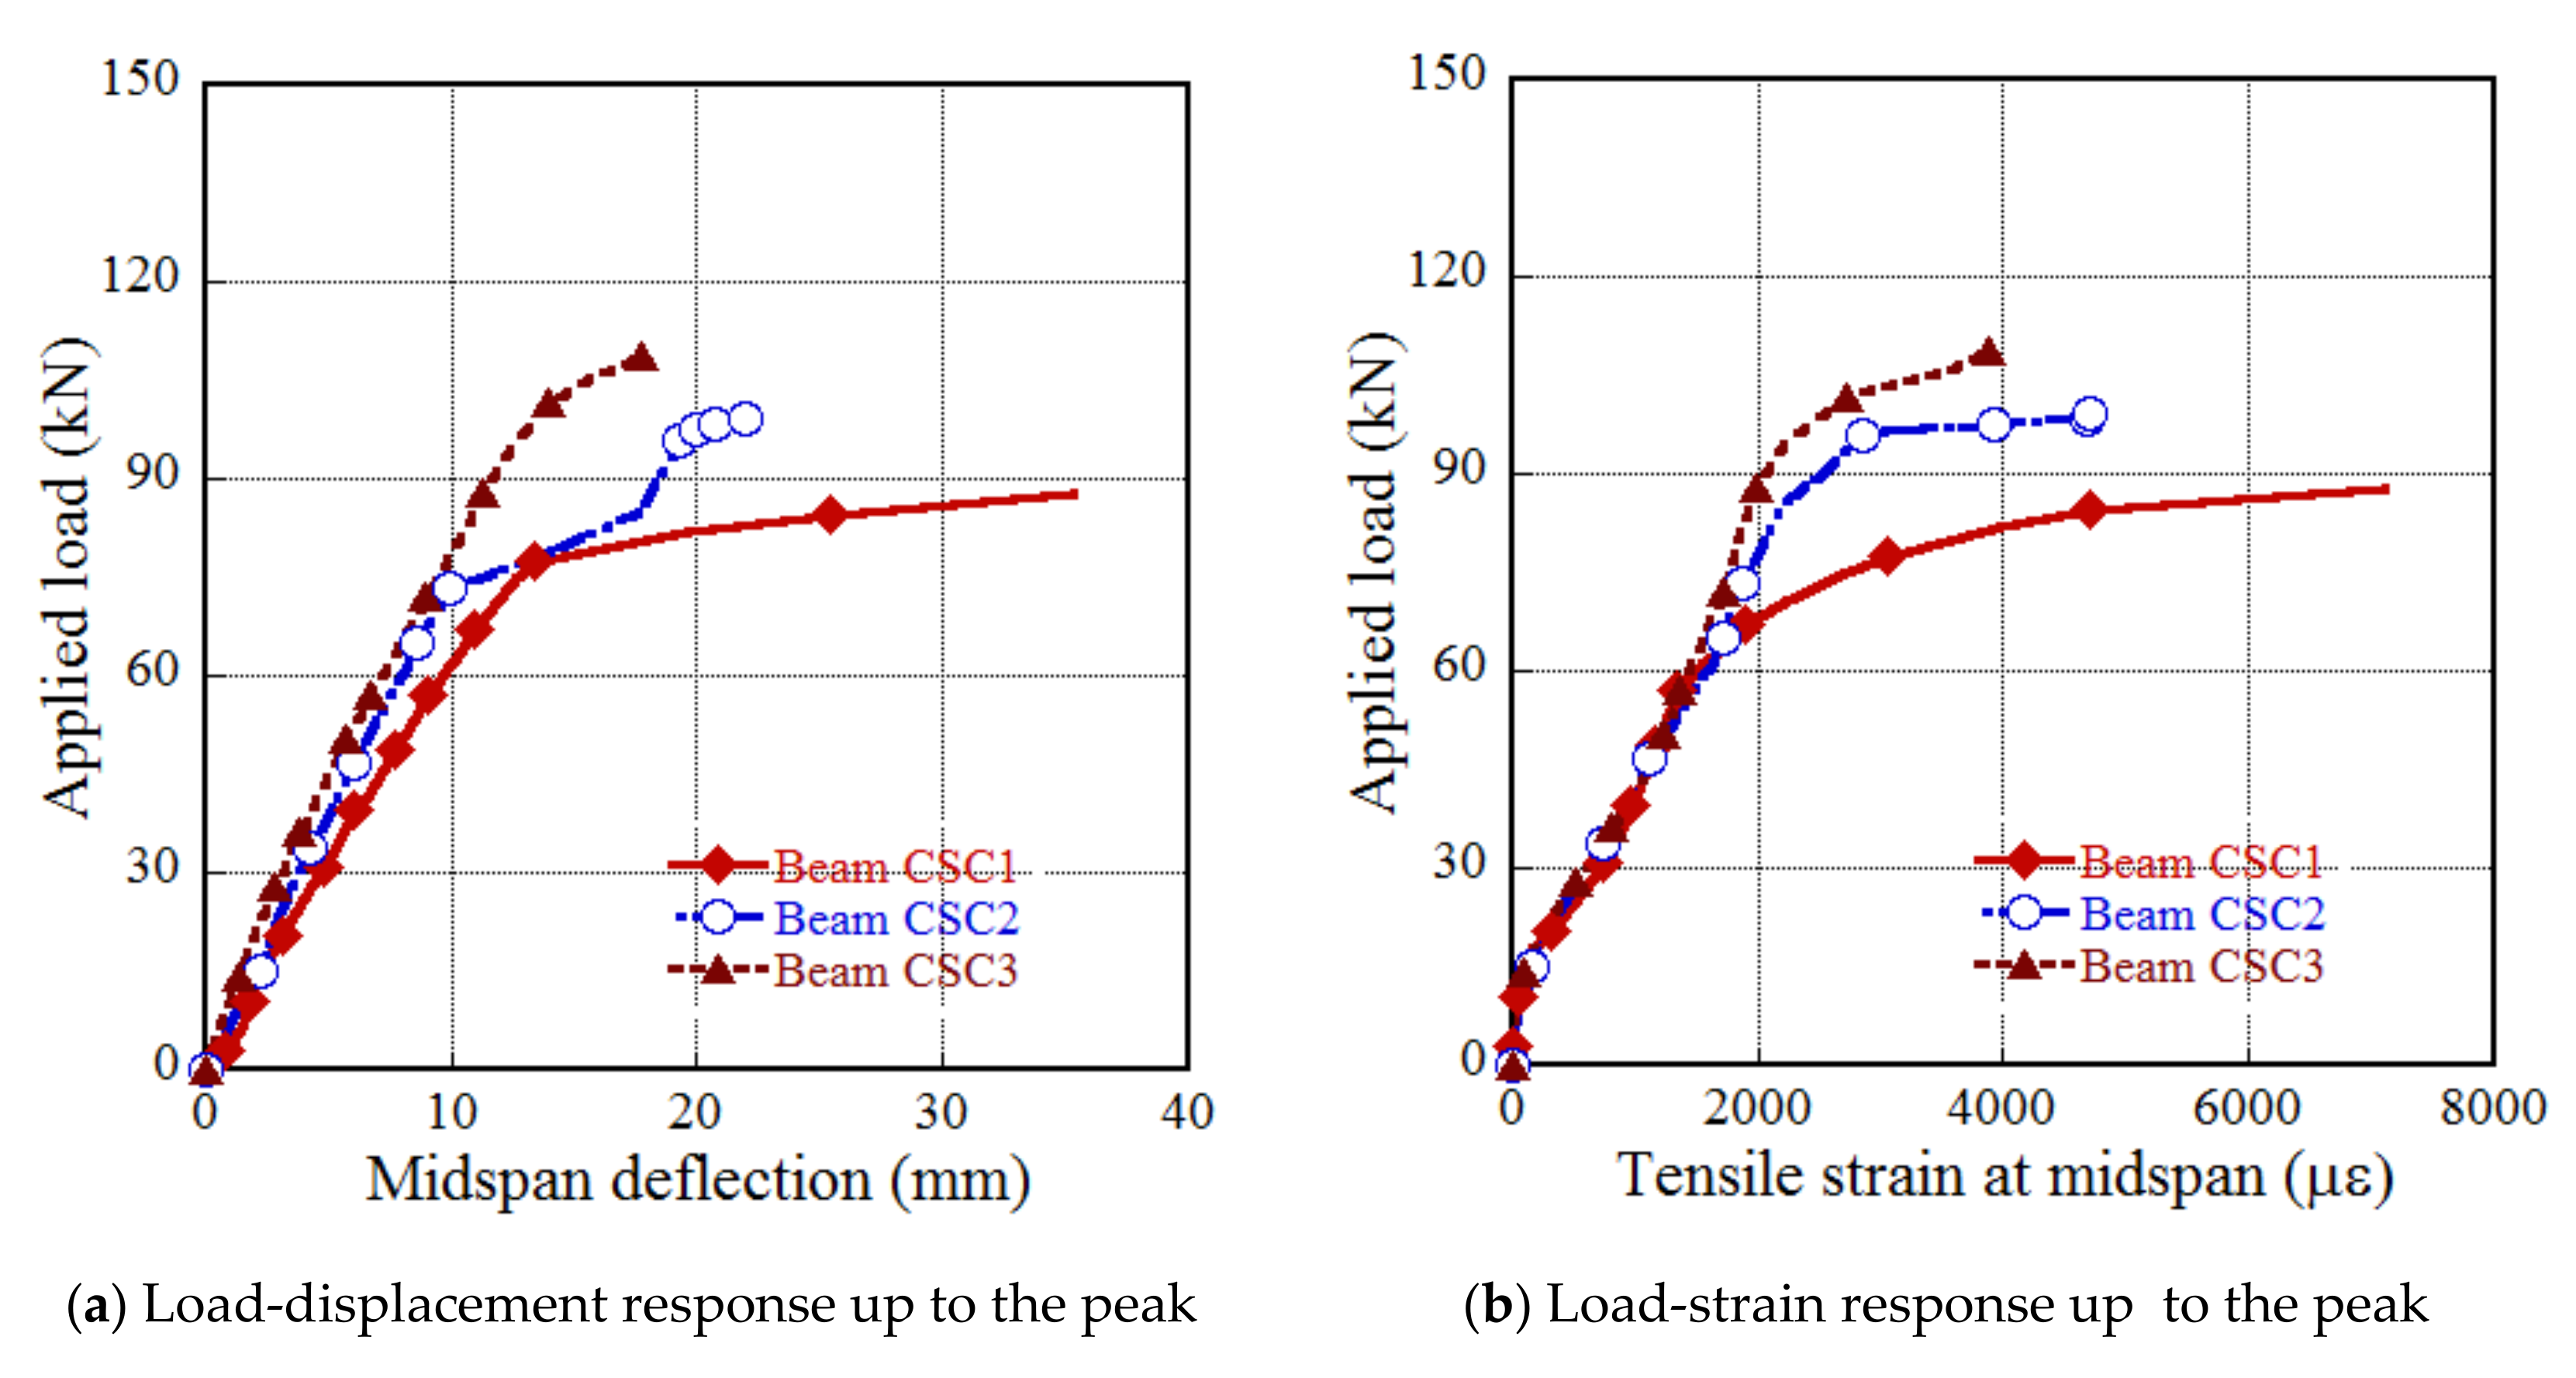
Figure 14a exposes the load versus midspan deflection response, while Figure 14b presents the relationship between load and tensile strain at midspan of the tested beams. The values of flexural parameters were summarized in Table 10 and comparatively described in Figure 15. In detail, the beams CSC1, CSC2 and CSC3 produced their flexural parameters at LOP as follows: of 57.28, 73.36 and 87.96 kN, respectively; of 9.08, 9.90 and 11.25 mm, respectively; of 2682, 3744 and 3959 , respectively; of 262.33, 375.29 and 538.34 J, respectively. At MOR, their flexural parameters of the beams CSC1, CSC2 and CSC3 were measured as follows: of 88.08, 98.47 and 108.46 kN, respectively; of 35.35, 22.48 and 17.76 mm, respectively; of 10939, 9379 and 7772 , respectively; of 2396.96, 1397.43 and 1197.98 , respectively.
Figure 15 presents the comparison of flexural resistances of three reinforced CSC beams. As shown in Figure 15, at LOP, the higher compressive strength of CSCs produced the higher values of all flexural parameters, i.e., the order of beam types in terms of all flexural parameters were as follows: CSC1 < CSC2 < CSC3. However, at MOR, only increased with the increasing of ; other parameters, including , , , exhibited the opposite trend, i.e., the order of beam types in terms of , , were ranked as follows: CSC1 > CSC2 > CSC3. The trends of CSC flexural resistances were consistent with those of NC flexural resistances [43]: the higher concrete compressive strength would produce a higher load carrying capacity but a lower ductility of the reinforced concrete beam. The reductions of , , meant that a reinforced CSC beam became more brittle when it was prepared from a CSC with higher compressive strength. The fact that midspan deflections of the tested beams, which were decreased with the increasing of could be attributed to the increase in the elastic modulus of CSCs, which was also proportional to the square root of [30].
4.2.3. Crack Patterns of the Tested Beams
Cracking behavior of concrete is strongly affected by the load-carrying capacity of a concrete beam, and crack/damage patterns occurring could be favorably correlated to the flexural failure mode. Figure 16 displays the crack distribution in the three tested beams. As shown in Figure 16, in each beam, the first crack appeared at midspan with its direction toward perpendicular to the beam axis, other cracks then appeared further and further from the midspan. The major cracks at failure were not the first cracks but they propagated toward the applied load where the ultimate compressive capacity of concrete was reached. These crack patterns indicated ductile flexural failure, which was governed by concrete crushing after yielding of the steel bars. This crack pattern type of CSC was also found for traditional concrete in observation of steel-reinforced beam failures [44,45].
The flexural strength of a reinforced concrete beam at LOP () would be theoretically equal to the flexural strength of plain concrete, . Equation (15) is used to compute the and it is then summarized in Table 11. As given in Table 12, the derived were much higher (about three times) than the at 28-days’ age presented in Table 11. The presence of steel bars was thought to limit the crack initiation from the air hole embedded in concrete to some extent, like the role of steel fibers in HPFRCs [11].
where was the equivalent moment of inertia of the cross-section, which was considered with the different stiffnesses of the steel bar and concrete according to the elastic modulus, and was the distance from extreme compression fiber to the neutral axis.
4.2.4. Co-Relationship between Curvature, Deflection and Flexural Strain
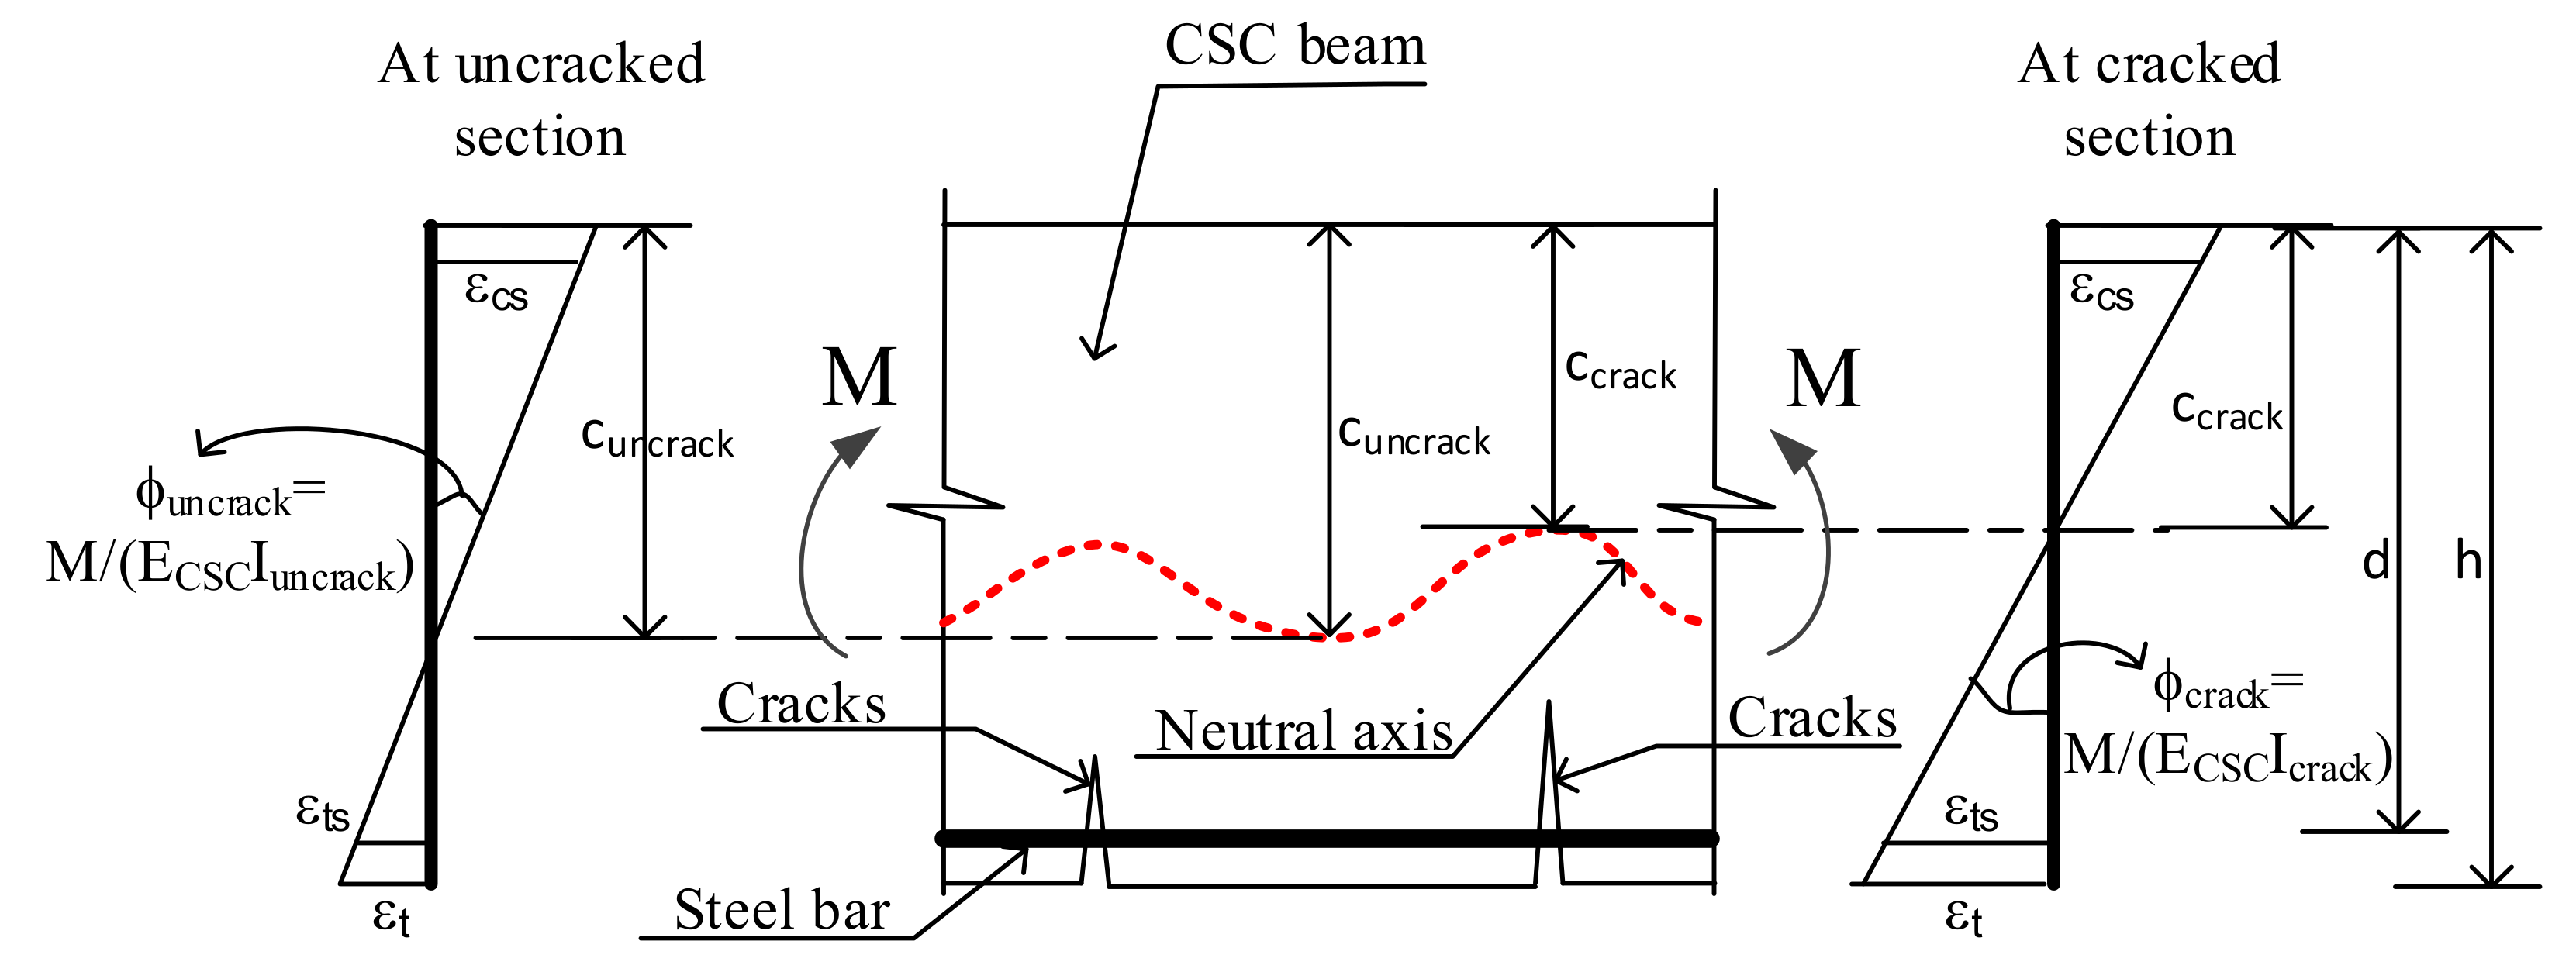
According to linear elastic theory, the midspan deflection of a beam under three-point bending is due to the moment and shear, and it is correlated with curvature, as presented in Equation (16) [29]. In this equation, is the curvature, and are the Poisson’s ratio and shear coefficient of the material, respectively; and are the height and span-length of the beam, respectively. With = 0.2 for concrete, 1/ = 1.5 for the rectangular section, , Equation (16) can be written as Equation (17), which is also valid for nonlinear behaviors, since the deflection now depends only upon the beam profile. On the other hand, Equation (17) also reveals that the deflection due to shear force is relatively small, only 3.6% of deflection due to the moment. The curvature regarding the Euler–Bernoulli model is equal to the ratio between flexural strain () at the beam bottom and the distance from the neutral axis to the bottom surface, as given by Equation (18). Figure 17 displays the model correlating curvature, flexural strain, and beam rigidity at the cracked section (), or beam rigidity at the uncracked section () [46]. As shown in Figure 17, the crack clearly causes an increase in curvature, which thus results in a reduction in beam rigidity and an increase in deflection, even in the case when the applied load does not increase. The location of the neutral axis () can be determined as follows: using the first moment of area for the uncracked section, and/or, using the force equilibrium of stress distribution along with section depth for the cracked section.
Table 12 supplies the comparative flexural strain of the CSCs at LOP and MOR. In this table, the derived flexural strain was theoretically computed using Equations (17) and (18), while the measured flexural strain was directly obtained from testing work. The differences in flexural strain at LOP and MOR, according to theory and experiment, were rather high: 7–15% at LOP and 17–20% at MOR. The reason was thought to be due to the incorrect location of the neutral axis, which was determined using other compressive parameters, such as or . Despite the many differences in flexural strain through experiments, the co-relationship between curvature, deflection, and the flexural strain was made clear, and they could be used to predict each other. Table 13 presents the comparative flexural moments, including experimental moment () and nominal moment resistance (). The was the total of the moment due to the beam self-weight and moment due to the maximum applied load. The was estimated based on the material properties. The differences between the and were observed to be 9–20%, the true was always higher than the (about 1.1–1.3 times). This meant that ACI 318 [30] could be used for designing reinforced CSC beams with high reliability and safety.
5. Conclusions
The responses of the coarse steel slag concrete (CSC) under splitting and flexure were investigated in this research work. The observations and conclusions can be summarized from test results as follows:
- With the same size, the order of splitting test methods, in terms of the splitting strength of the coarse steel slag concrete, was as follows: cylinder splitting > diagonal-cube splitting > side-cube splitting. Besides, the cylinder splitting was highly stable under loading, whereas the two others were not.
- The coarse steel slag concrete exhibited a splitting strength that was clearly size-dependent, for both side-cube splitting specimens and cylinder splitting specimens. In addition, the conversion factors for splitting strength were derived for various splitting series; they were useful in quickly translating the splitting strength from one to others. The side-cube splitting specimens exhibited more sensitivity to size than the cylinder splitting specimens.
- The brittleness indicators of the coarse steel slag concrete, defined as the Weibull modulus according to Weibull’s size effect law, were analytically achieved as follows: = 3.27 for side-cube splitting specimens and = 17.02 for cylinder splitting specimens. The brittleness indicators of various kinds of concrete, under different loading types, were comparatively reviewed.
- The flexural strength of the plain coarse steel slag concrete increased with increasing of testing age, it was also suitable with compressive strength. The derived conversion factors for flexural strength were somewhat similar to that of traditional concrete.
- The increase in compressive strength of coarse steel slag concretes produced an increase in all flexural parameters at LOP, including load carrying capacity, midspan deflection capacity, midspan flexural strain, and energy absorption capacity. However, at MOR, an increase in compressive strength generated an increase in load-carrying capacity at MOR only, but a decrease in other flexural parameters.
- The flexural parameters of the tested reinforced beams, using coarse steel slag concrete, were generally consistent with the theory for traditional concrete. Under loading, there was a strong co-relationship between the initiation and propagation of the crack, curvature, deflection, and flexural strength.
Author Contributions
Conceptualization, D.-H.P.; data curation, H.-H.M.; investigation, T.-T.-H.N. and D.-H.P.; writing—original draft preparation, D.-L.N. and T.-T.-H.N.; writing—review & editing, D.-L.N. and T.-T.-H.N. All authors have read and agreed to the published version of the manuscript.
Funding
This research received no external funding.
Acknowledgments
The research was supported by Ho Chi Minh City University of Technology and Education, Ho Chi Minh City University of Transport. The authors are grateful for this support. The opinions expressed in this paper are those of the authors and do not necessarily reflect the views of the sponsors.
Conflicts of Interest
The authors declare no conflict of interest.
References
- Mehta, P.K.; Monteiro, P.J. Concrete Microstructure, Properties and Materials, 4th ed; McGraw-Hill Education: New York, NY, USA; Chicago, IL, USA; San Francisco, CA, USA; Athens, Greece; London, UK; Madrid, Spain; Mexico City, Mexico; Milan, Italy; New Delhi, India; Singapore; Sydney, Australia; Toronto, ON, Canada, 2014. [Google Scholar]
- Shi, C. Steel slag—Its production, processing, characteristics, and cementitious properties. J. Mater. Civ. Eng. 2004, 16, 230–236. [Google Scholar] [CrossRef]
- Rađenović, A.; Malina, J.; Sofilić, T. Characterization of ladle furnace slag from carbon steel production as a potential adsorbent. Adv. Mater. Sci. Eng. 2013, 2013, 1–6. [Google Scholar] [CrossRef] [Green Version]
- Pasetto, M.; Baliello, A.; Giacomello, G.; Pasquini, E. Sustainable solutions for road pavements: A multi-scale characterization of warm mix asphalts containing steel slags. J. Clean. Prod. 2017, 166, 835–843. [Google Scholar] [CrossRef]
- Galán-Arboledas, R.J.; de Diego, J.Á.; Dondi, M.; Bueno, S. Energy, environmental and technical assessment for the incorporation of EAF stainless steel slag in ceramic building materials. J. Clean. Prod. 2017, 142, 1778–1788. [Google Scholar] [CrossRef]
- Poulikakos, L.; Papadaskalopoulou, C.; Hofko, B.; Gschösser, F.; Falchetto, A.C.; Bueno, M.; Arraigada, M.; Sousa, J.; Ruiz, R.; Petit, C. Harvesting the unexplored potential of European waste materials for road construction. Resour. Conserv. Recycl. 2017, 116, 32–44. [Google Scholar] [CrossRef]
- Kourounis, S.; Tsivilis, S.; Tsakiridis, P.E.; Papadimitriou, G.D.; Tsibouki, Z. Properties and hydration of blended cements with steelmaking slag. Cem. Concr. Res. 2007, 37, 815–822. [Google Scholar] [CrossRef]
- Zhang, T.; Yu, Q.; Wei, J.; Li, J.; Zhang, P. Preparation of high performance blended cements and reclamation of iron concentrate from basic oxygen furnace steel slag. Resour. Conserv. Recycl. 2011, 56, 48–55. [Google Scholar] [CrossRef]
- Li, J.; Yu, Q.; Wei, J.; Zhang, T. Structural characteristics and hydration kinetics of modified steel slag. Cem. Concr. Res. 2011, 41, 324–329. [Google Scholar] [CrossRef]
- Song, J.; Nguyen, D.L.; Manathamsombat, C.; Kim, D.J. Effect of fiber volume content on electromechanical behavior of strain-hardening steel-fiber-reinforced cementitious composites. J. Compos. Mater. 2015, 49, 3621–3634. [Google Scholar] [CrossRef]
- Nguyen, D.-L.; Lam, M.N.-T.; Kim, D.-J.; Song, J. Direct tensile self-sensing and fracture energy of steel-fiber-reinforced concretes. Compos. Part B 2020, 183, 107714. [Google Scholar] [CrossRef]
- Mo, L.; Zhang, F.; Deng, M.; Jin, F.; Al-Tabbaa, A.; Wang, A. Accelerated carbonation and performance of concrete made with steel slag as binding materials and aggregates. Cem. Concr. Compos. 2017, 83, 138–145. [Google Scholar] [CrossRef]
- Palankar, N.; Shankar, A.R.; Mithun, B.M. Durability studies on eco-friendly concrete mixes incorporating steel slag as coarse aggregates. J. Clean. Prod. 2016, 129, 437–448. [Google Scholar] [CrossRef]
- Monosi, S.; Ruello, M.L.; Sani, D. Electric arc furnace slag as natural aggregate replacement in concrete production. Cem. Concr. Compos. 2016, 66, 66–72. [Google Scholar] [CrossRef]
- Netinger, I.; Bjegović, D.; Vrhovac, G. Utilisation of steel slag as an aggregate in concrete. Mater. Struct. 2011, 44, 1565–1575. [Google Scholar] [CrossRef]
- Tran, A.T.; Tran, G.H.; Nguyen, N.T.H.; Nguyen, K.S. Characterization of carbonated steelmaking slag and its potential application in construction. Vietnam J. Sci.Technol. 2019, 57, 61. [Google Scholar] [CrossRef] [Green Version]
- Lam, M.N.T.; Jaritngam, S.; Le, D.H. Roller-compacted concrete pavement made of Electric Arc Furnace slag aggregate: Mix design and mechanical properties. Constr. Build. Mater. 2017, 154, 482–495. [Google Scholar] [CrossRef]
- Lam, M.N.T.; Le, D.H.; Jaritngam, S. Compressive strength and durability properties of roller-compacted concrete pavement containing electric arc furnace slag aggregate and fly ash. Constr. Build. Mater. 2018, 191, 912–922. [Google Scholar] [CrossRef]
- Lam, M.N.T.; Jaritngam, S.; Le, D.H. EAF Slag Aggregate in Roller-Compacted Concrete Pavement: Effects of Delay in Compaction. Sustainability 2018, 10, 1122. [Google Scholar] [CrossRef] [Green Version]
- Nguyen, T.T.H.; Phan, D.H.; Mai, H.H. Modified compositions of concretes using steel slag coarse aggregate. J. Build. 2016, 2, 63–71. [Google Scholar]
- Nguyen, T.-T.-H.; Phan, D.-H.; Mai, H.-H.; Nguyen, D.-L. Investigation on Compressive Characteristics of Steel-Slag Concrete. Materials 2020, 13, 1928. [Google Scholar] [CrossRef]
- Neville, A.M. Properties of Concrete, 4th ed.; Longman London: Essex, UK, 1995; p. 844. ISBN 978-0-273-75580-7. [Google Scholar]
- Zheng, W.; Kwan, A.K.H.; Lee, P.K.K. Direct tension test of concrete. Mater. J. 2001, 98, 63–71. [Google Scholar]
- Huu, P.D. High. Strength Concrete and High. Performance Concrete; Construction Publishing House: HaNoi, Vietnam, 2008; p. 26. [Google Scholar]
- Weihull, W. A statistical distribution function of wide applicability. J. Appl. Mech. 1951, 18, 290–293. [Google Scholar]
- Bažant, Z. Size effect in blunt fracture: Concrete, rock, metal. J. Eng. Mech. 1984, 110, 518–535. [Google Scholar] [CrossRef]
- Bazant, Z.P.; Kazemi, M.T. Size effect on diagonal shear failure of beams without stirrups. ACI Struct. J. 1991, 88, 268–276. [Google Scholar]
- Badagha, D.G.; Modhera, C.K. Experimental Approach to Enhance the Indirect Split Tensile Strength for Cylindrical and Cubic Specimen for Various Fibrous Mortars under Different Environment Conditions. Indian J. Sci. Technol. 2015, 8, 8. [Google Scholar] [CrossRef] [Green Version]
- Nguyen, D.-L.; Thai, D.-K.; Kim, D.-J. Direct tension-dependent flexural behavior of ultra-high-performance fiber-reinforced concretes. J. Strain Anal. Eng. Des. 2017, 52, 121–134. [Google Scholar] [CrossRef]
- ACI 318-14. Building Code Requirements for Structural Concrete; ACI: Polis, IN, USA, 2019. [Google Scholar]
- Hannant, D.; Buckley, K.; Croft, J. The effect of aggregate size on the use of the cylinder splitting test as a measure of tensile strength. Matér. Constr. 1973, 6, 15–21. [Google Scholar] [CrossRef]
- Oluokun, F.A.; Burdette, E.G.; Deatherage, J.H. Splitting tensile strength and compressive strength relationships at early ages. ACI Mater. J. 1991, 88, 115–121. [Google Scholar]
- Min, F.; Yao, Z.; Jiang, T. Experimental and numerical study on tensile strength of concrete under different strain rates. Sci. World J. 2014, 2014, 1–11. [Google Scholar] [CrossRef] [Green Version]
- Małyszko, L.; Kowalska, E.; Bilko, P. Splitting tensile behavior of autoclaved aerated concrete: Comparison of different specimens’ results. Constr. Build. Mater. 2017, 157, 1190–1198. [Google Scholar] [CrossRef]
- Šavija, B.; Zhang, H.; Schlangen, E. Influence of microencapsulated phase change material (PCM) addition on (micro) mechanical properties of cement paste. Materials 2017, 10, 863. [Google Scholar] [CrossRef] [PubMed] [Green Version]
- Zhang, H.; Šavija, B.; Schlangen, E. Combined experimental and numerical study on micro-cube indentation splitting test of cement paste. Eng. Fract. Mech. 2018, 199, 773–786. [Google Scholar] [CrossRef] [Green Version]
- ASTM D6272-02. Standard Test Method for Flexural Properties of Unreinforced and Reinforced Plastics and Electrical Insulating Materials by Four-Point Bending; ASTM International: West Conshohocken, PA, USA, 2002. [Google Scholar]
- Standard ASTM D790-07. Standard Test Method for Flexural Properties of Unreinforced and Reinforced Plastics and Electrical Insulation Materials; American Society for Testing and Materials: West Conshohocken, PA, USA, 2010. [Google Scholar]
- Kanos, A.; Perdikaris, P. Size effect on concrete splitting tensile strength and modulus of elasticity. In Measuring, Monitoring and Modeling Concrete Properties; Springer: Dordrecht, The Netherlands, 2006; pp. 239–246. ISBN 978-1-4020-5104-3. [Google Scholar]
- Nguyen, D.L.; Ryu, G.S.; Koh, K.T.; Kim, D.J. Size and geometry dependent tensile behavior of ultra-high-performance fiber-reinforced concrete. Compos. Part B Eng. 2014, 58, 279–292. [Google Scholar] [CrossRef]
- Nguyen, D.L.; Kim, D.J.; Ryu, G.S.; Koh, K.T. Size effect on flexural behavior of ultra-high-performance hybrid fiber-reinforced concrete. Compos. Part B Eng. 2013, 45, 1104–1116. [Google Scholar] [CrossRef]
- Bazant, Z. Probabilistic modeling of quasibrittle fracture and size effect. In Proceeding of the 8th International Conference on Structural Safety and Reliability (ICOSSAR), Newport Beach, CA, USA, 1 January 2001; Corotis, R.B., Scheuller, G.I., Shinozuka, M., Eds.; Swets & Zeitlinger (Balkema): Lisse, The Netherlands, 2001; pp. 1–23. [Google Scholar]
- Li, L.Z.; Lo, S.H.; Su, R.K.L. Experimental Study of Moderately Reinforced Concrete Beams Strengthened with Bolted-Side Steel Plates. Adv. Struct. Eng. 2013, 16, 499–516. [Google Scholar] [CrossRef] [Green Version]
- Słowik, M. The analysis of failure in concrete and reinforced concrete beams with different reinforcement ratio. Arch. Appl. Mech. 2019, 89, 885–895. [Google Scholar] [CrossRef] [Green Version]
- Carmona, J.R.; Ruiz, G.; del Viso, J.R. Mixed-mode crack propagation through reinforced concrete. Eng. Fract. Mech. 2007, 74, 2788–2809. [Google Scholar] [CrossRef]
- Devadas, M. Reinforced Concrete Design; Tata McGraw-Hill Punlishing Company Limited: New York, NY, USA, 2003; ISBN 0-07-049504-1. [Google Scholar]
Figure 1.
Different stress distributions in direct and indirect tension.

Figure 2.
Testing methods for splitting tension.

Figure 3.
Typical load versus deflection response of concrete.

Figure 4.
Outline of the experimental scheme.
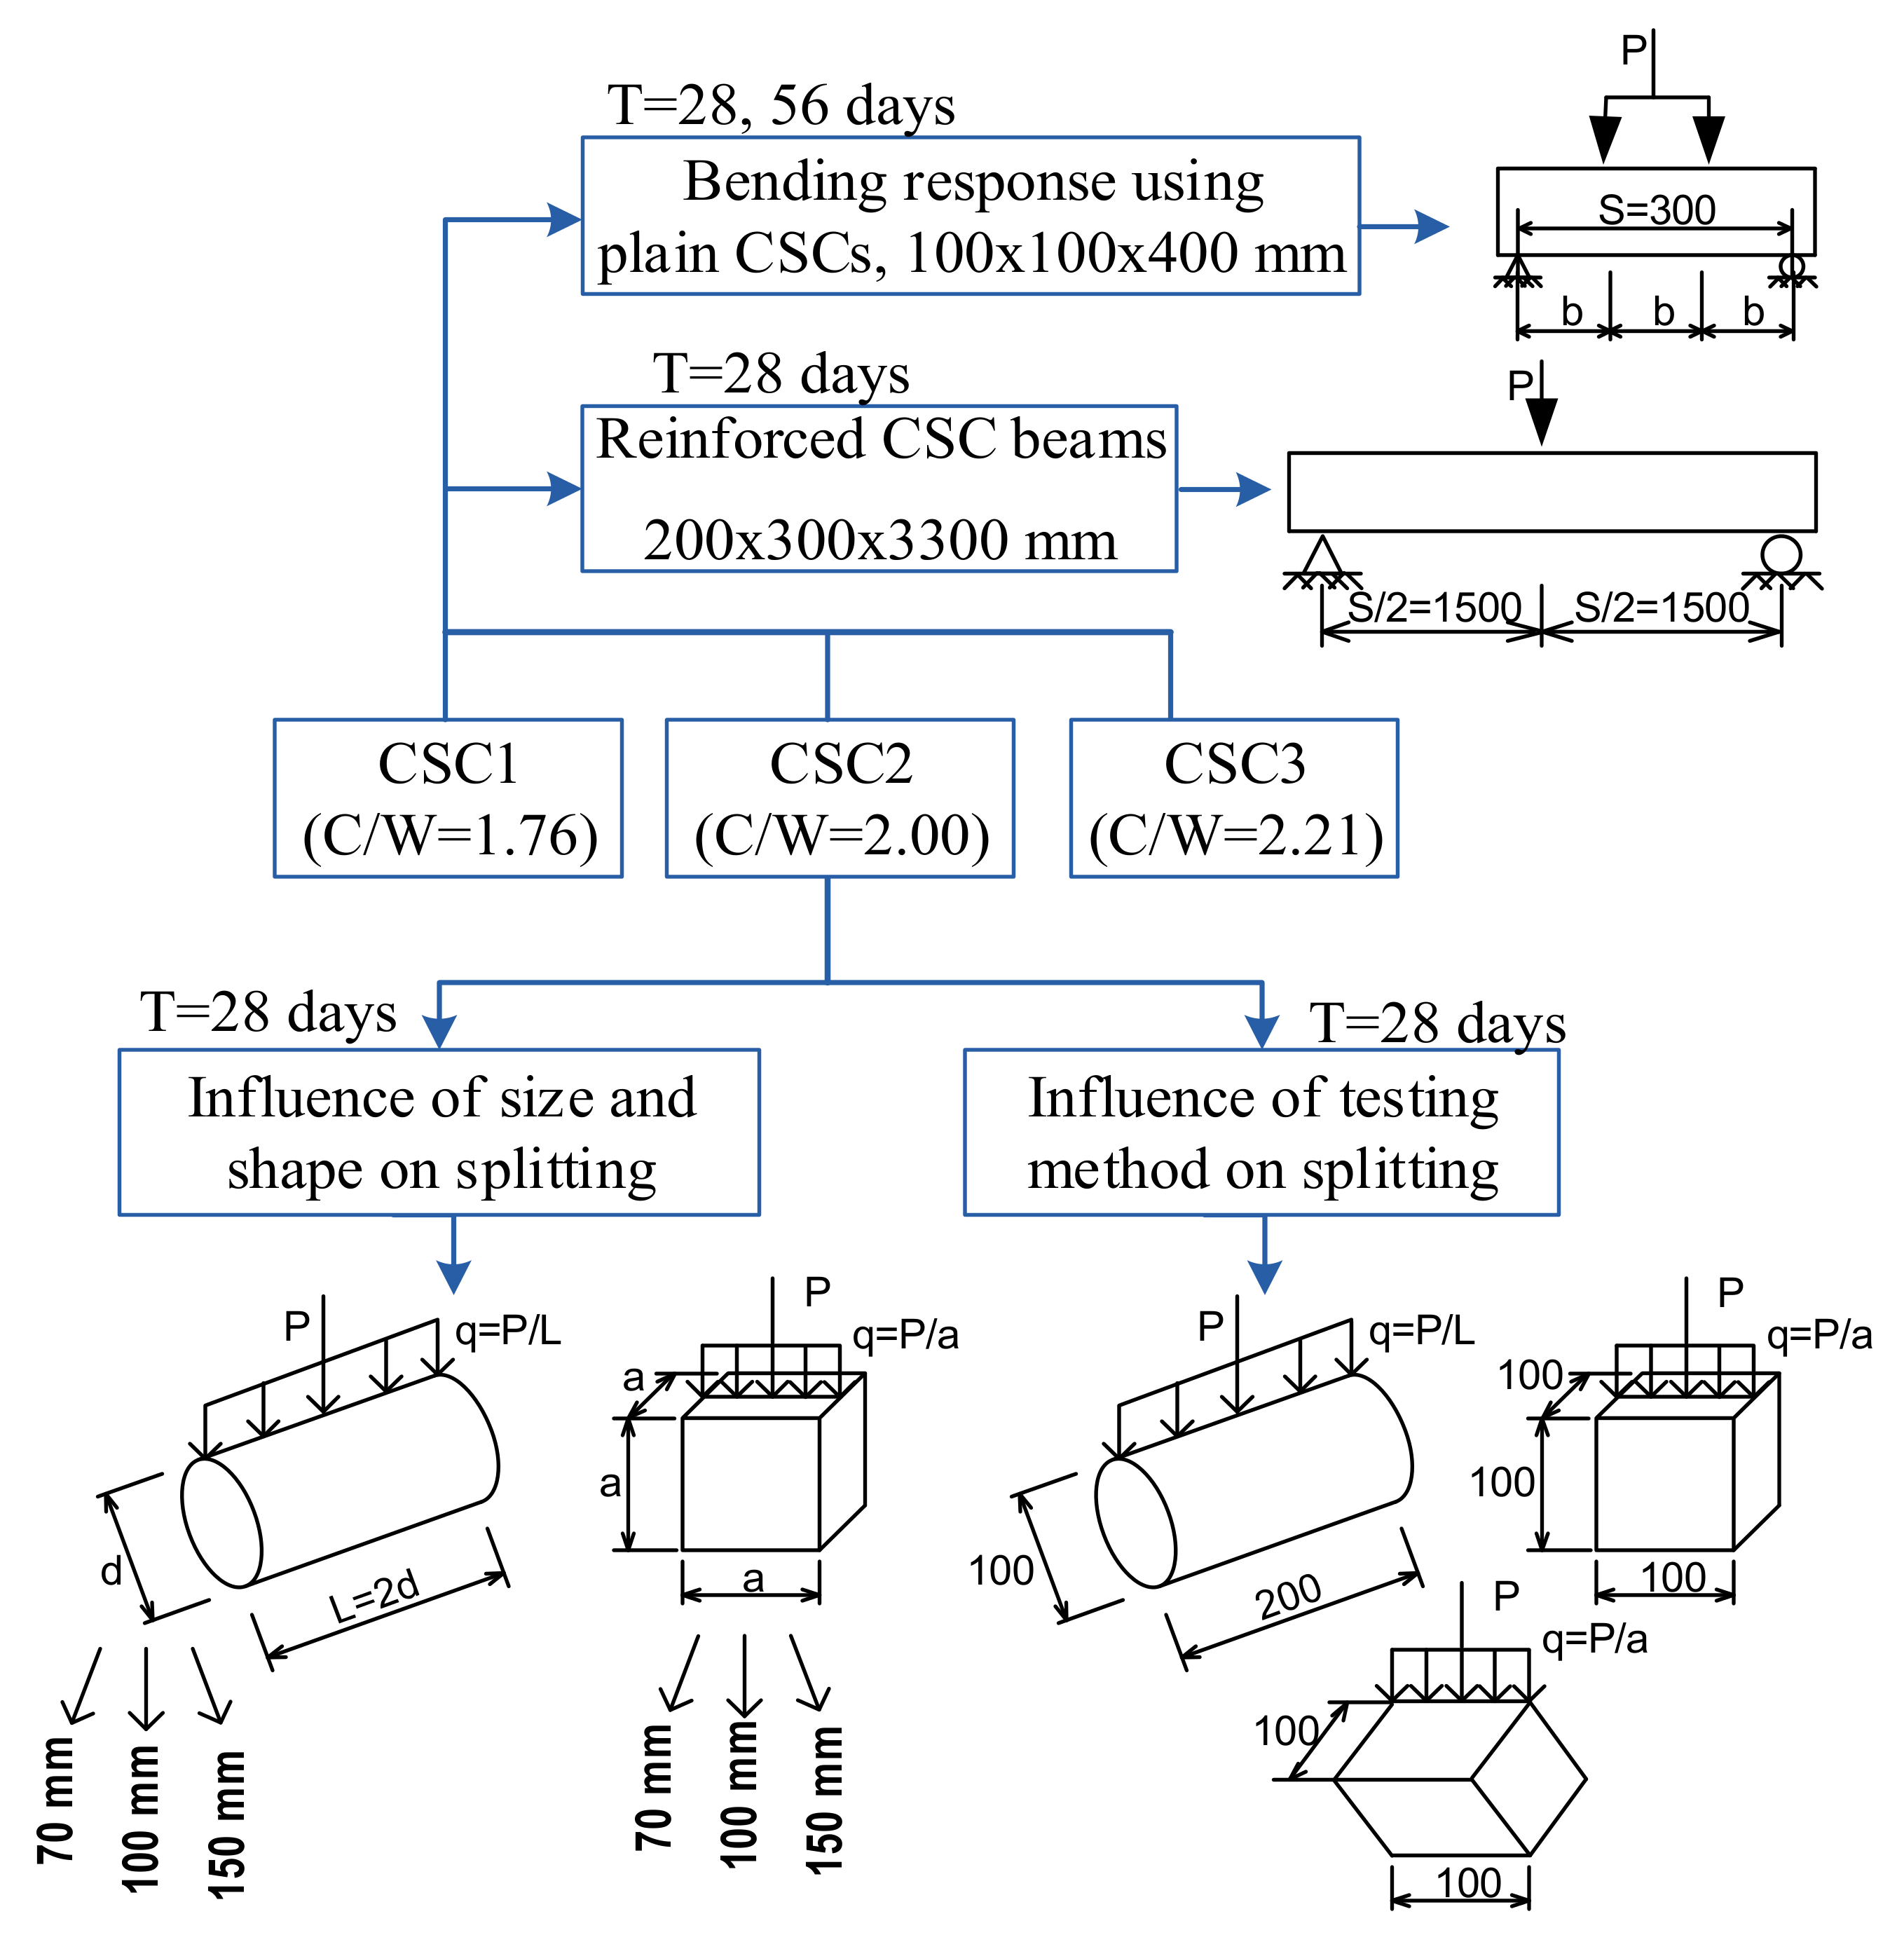
Figure 5.
Photos of steel-slag and preparing specimens.

Figure 6.
Splitting tensile behaviors of CSCs using different specimen types and test methods.

Figure 7.
Influence of specimen size and shape on the cylinder and side-cube splitting strengths of CSC2.
Figure 7.
Influence of specimen size and shape on the cylinder and side-cube splitting strengths of CSC2.
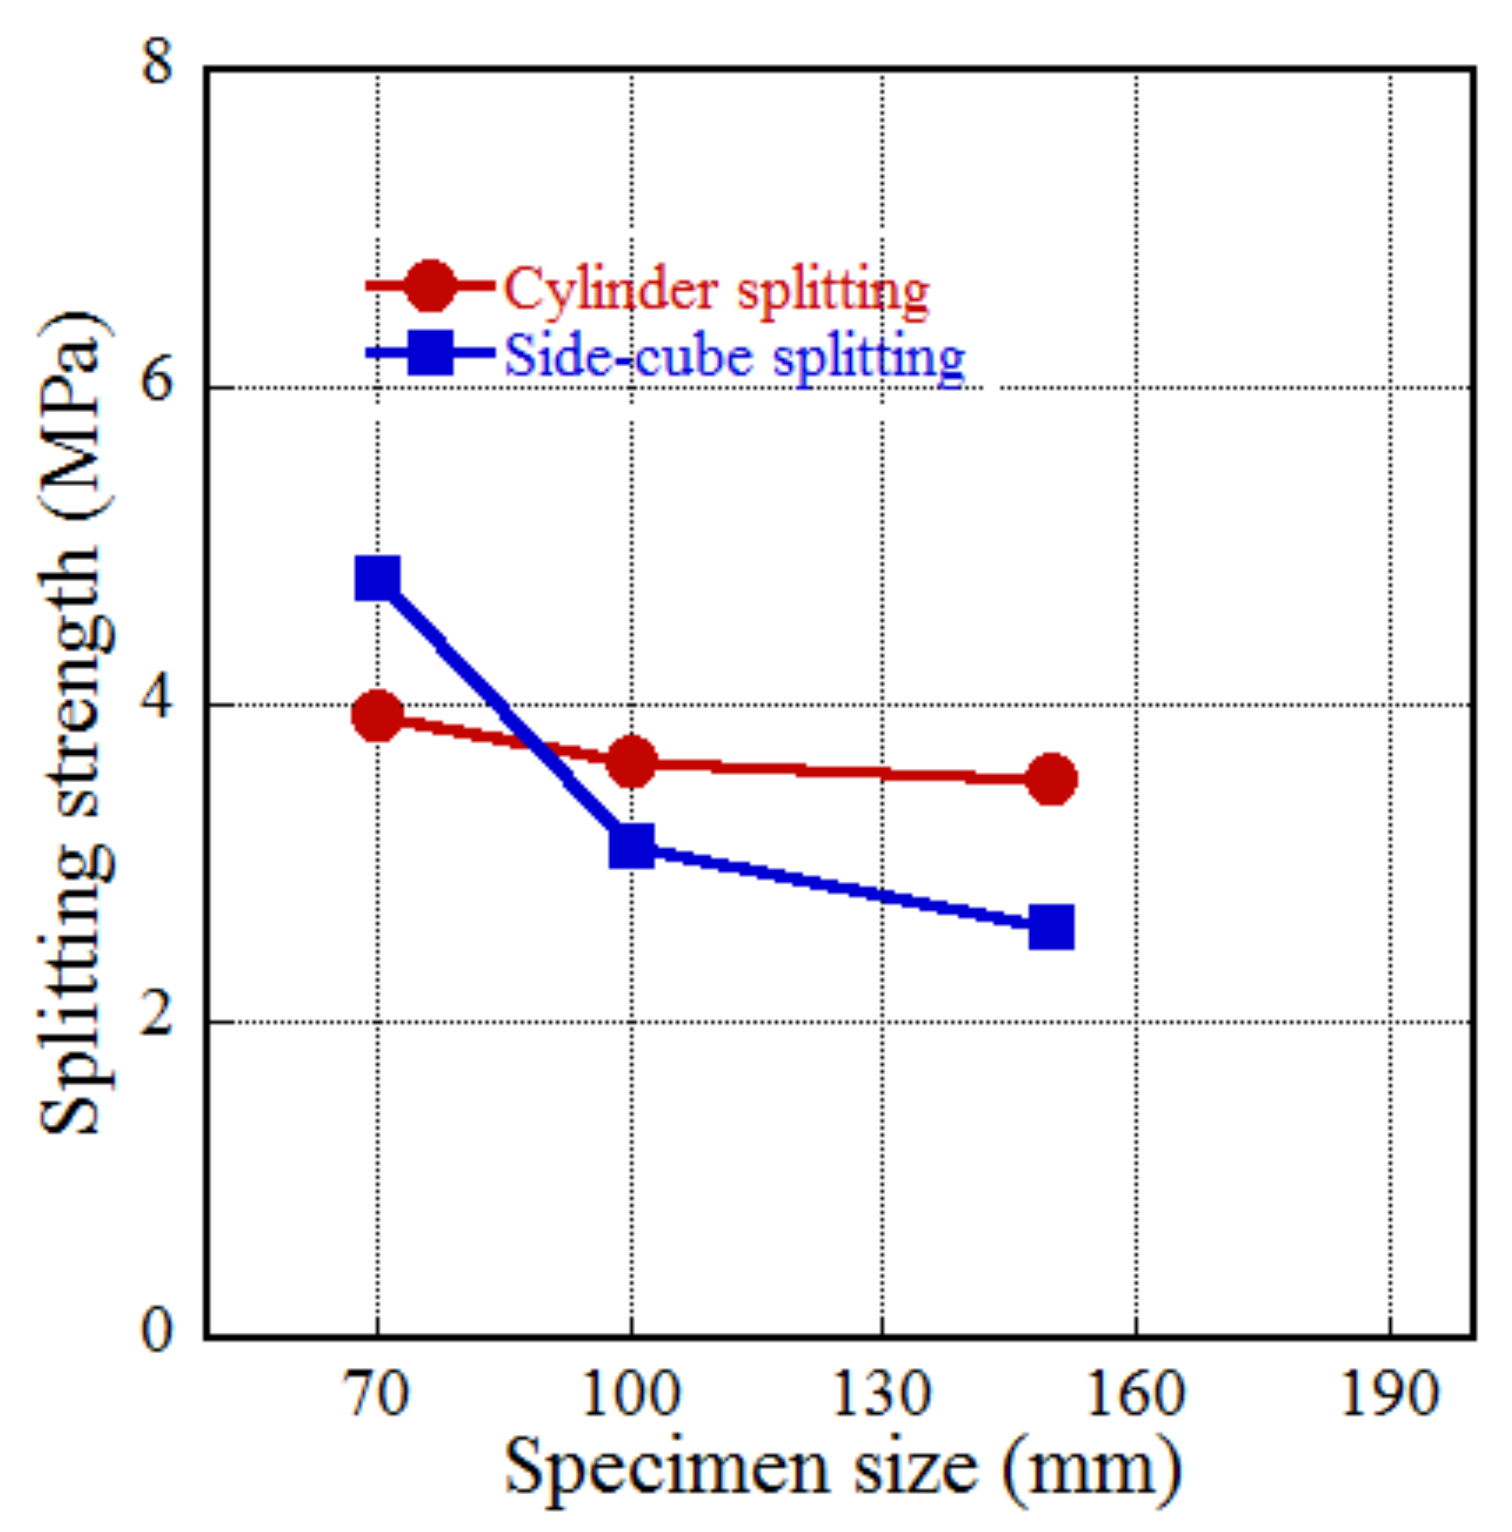
Figure 8.
Photos of typical crack patterns of the splitting specimens.
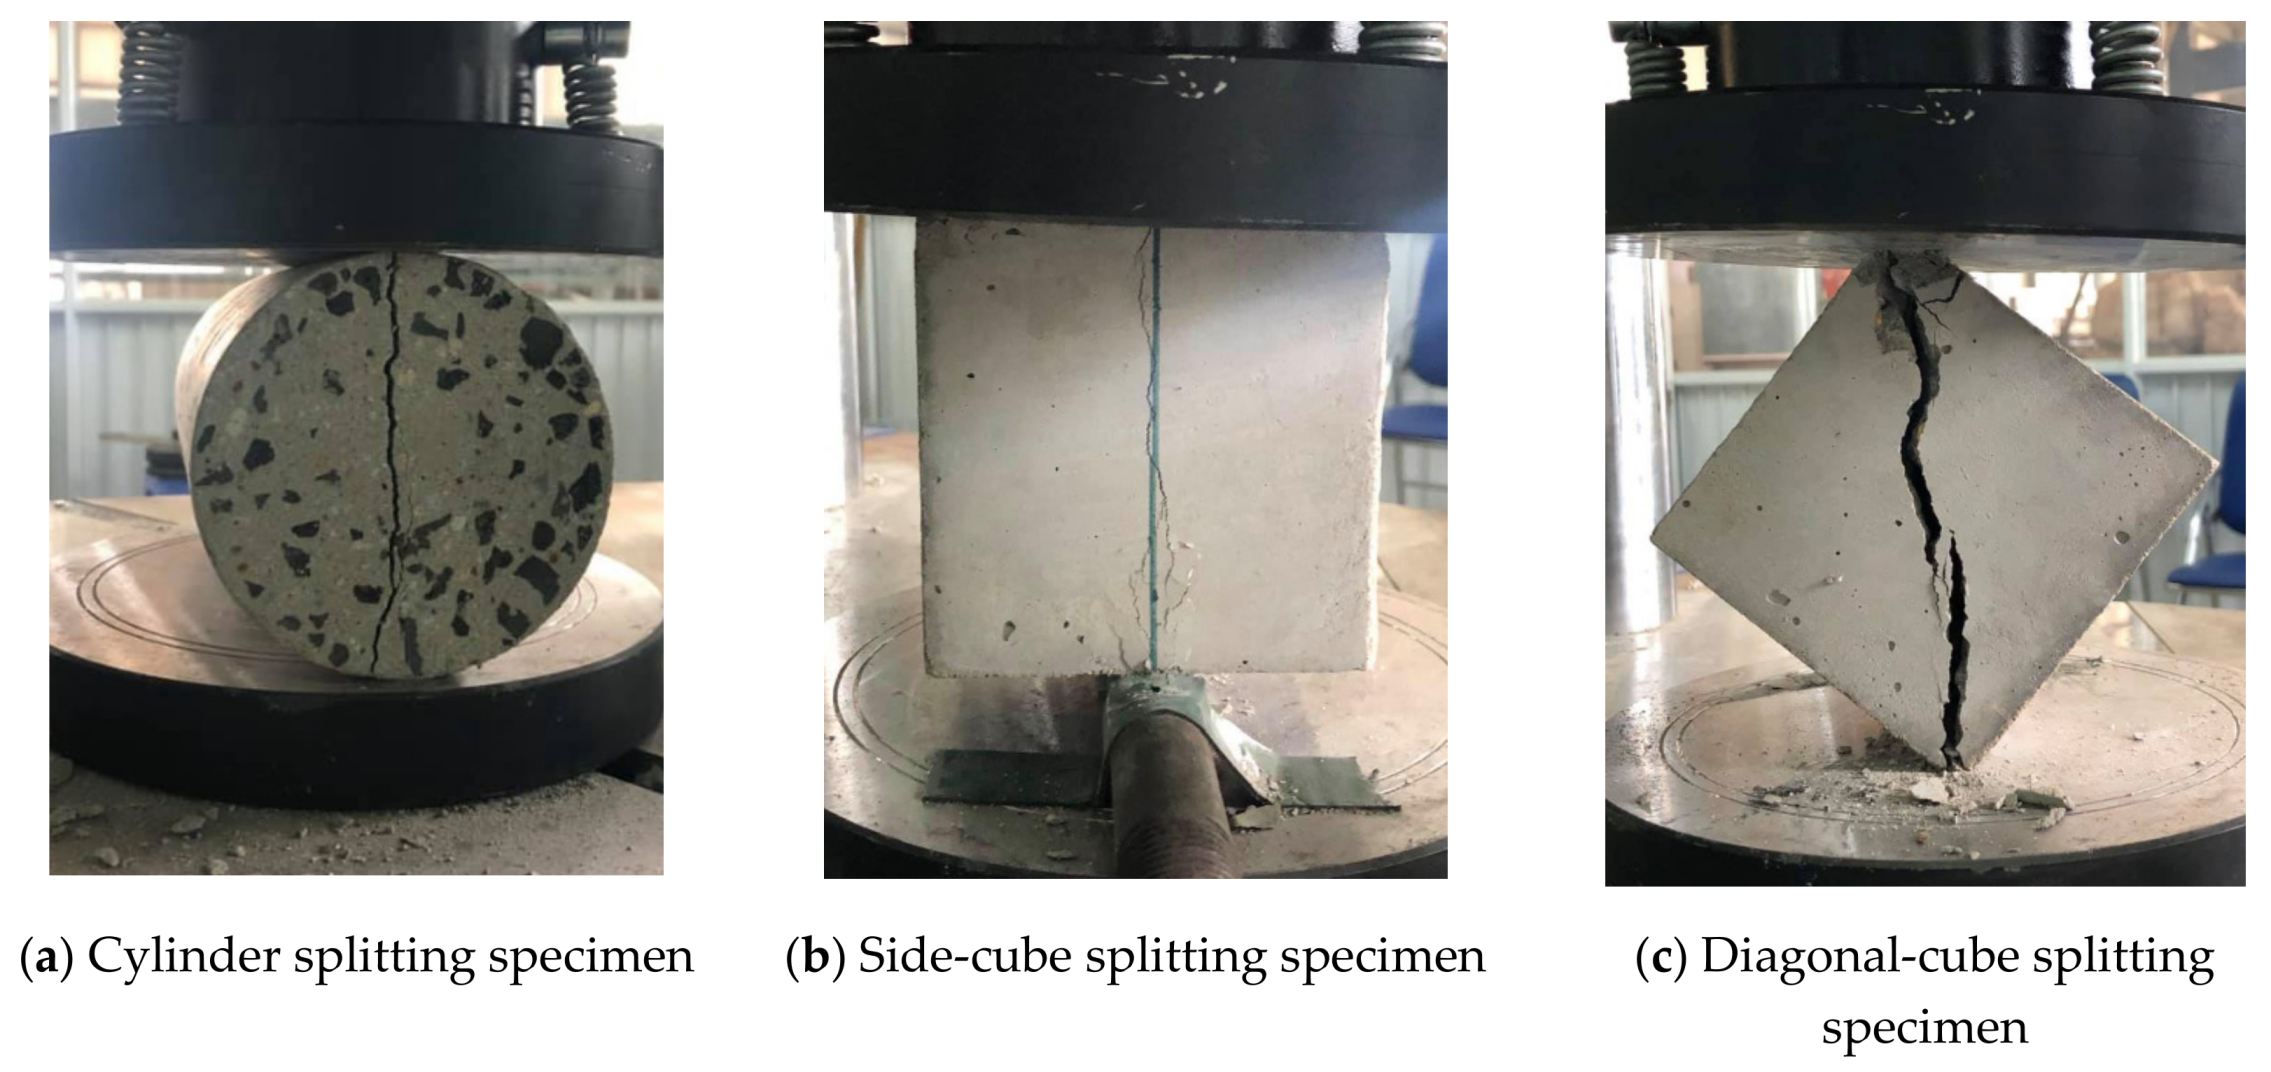
Figure 9.
Determining the brittleness indicator of the CSC2 according to Weibull’s size effect law.
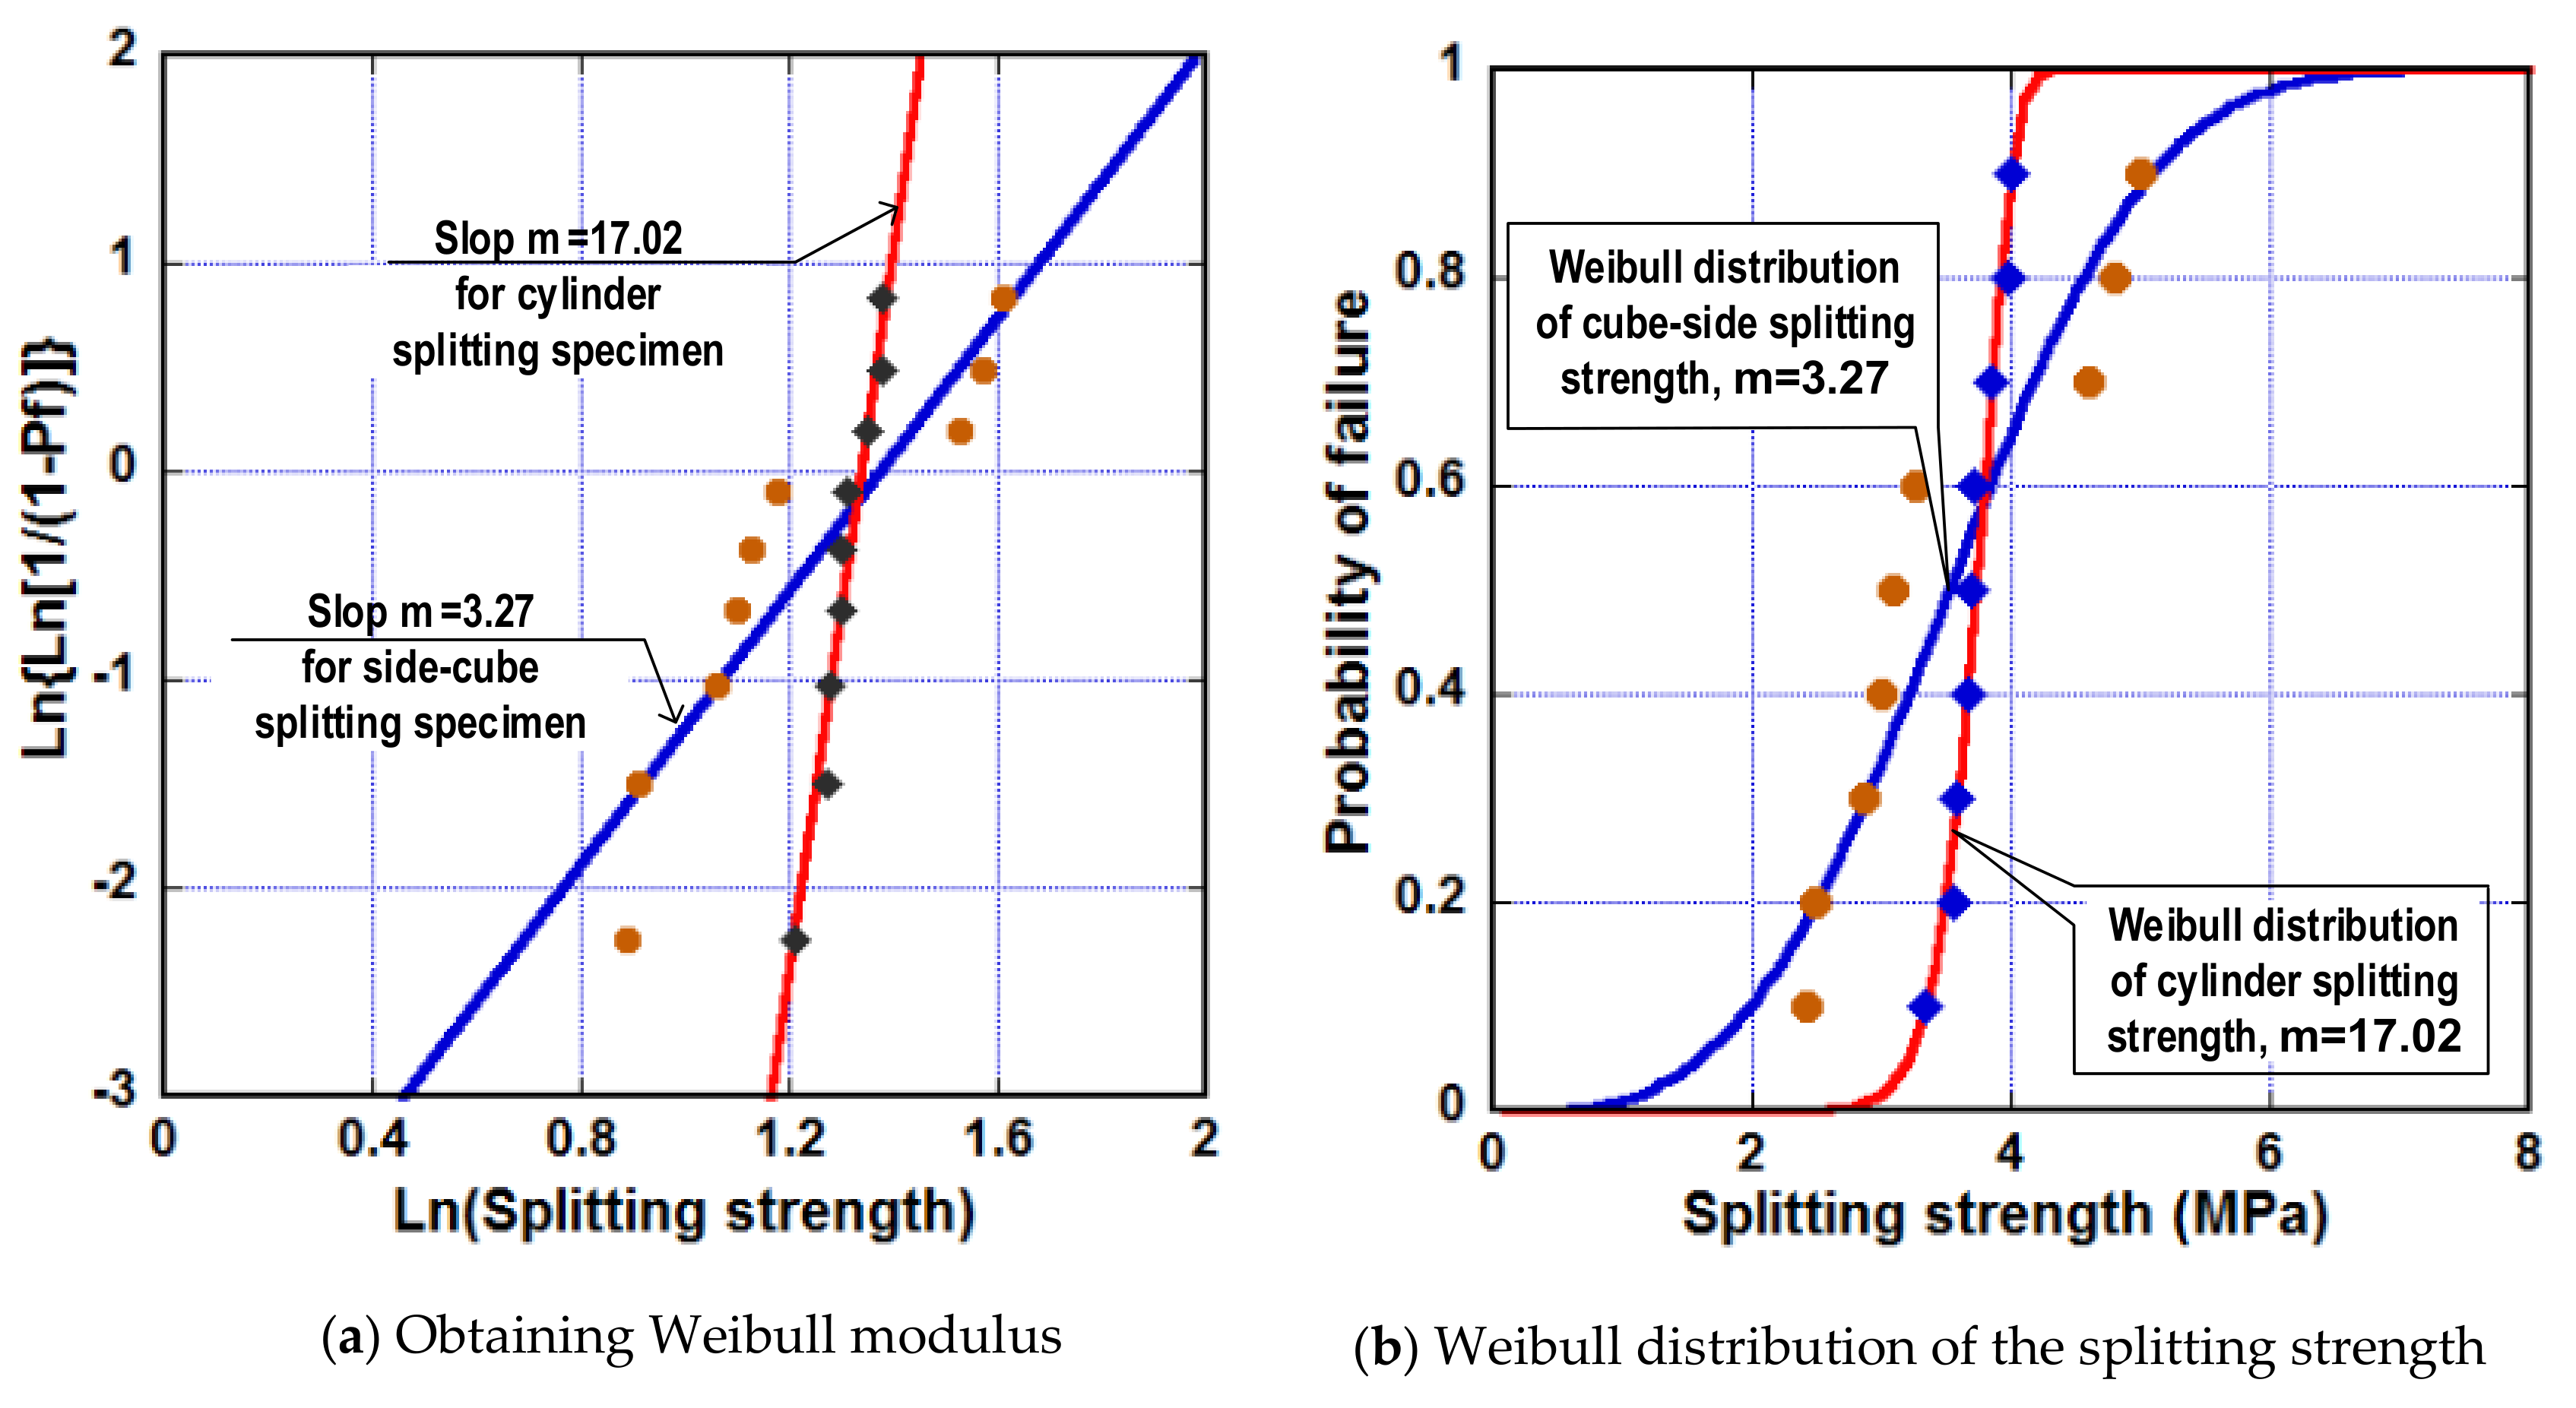
Figure 10.
Review of brittleness indicators regarding the failure strength of various kinds of concrete.
Figure 10.
Review of brittleness indicators regarding the failure strength of various kinds of concrete.

Figure 11.
Typical crack under 4-PBT using 100 × 100 × 300 mm specimen of CSCs.

Figure 12.
Evaluation of the flexural strengths of CSCs at 28-days’ and 56-days’ age.
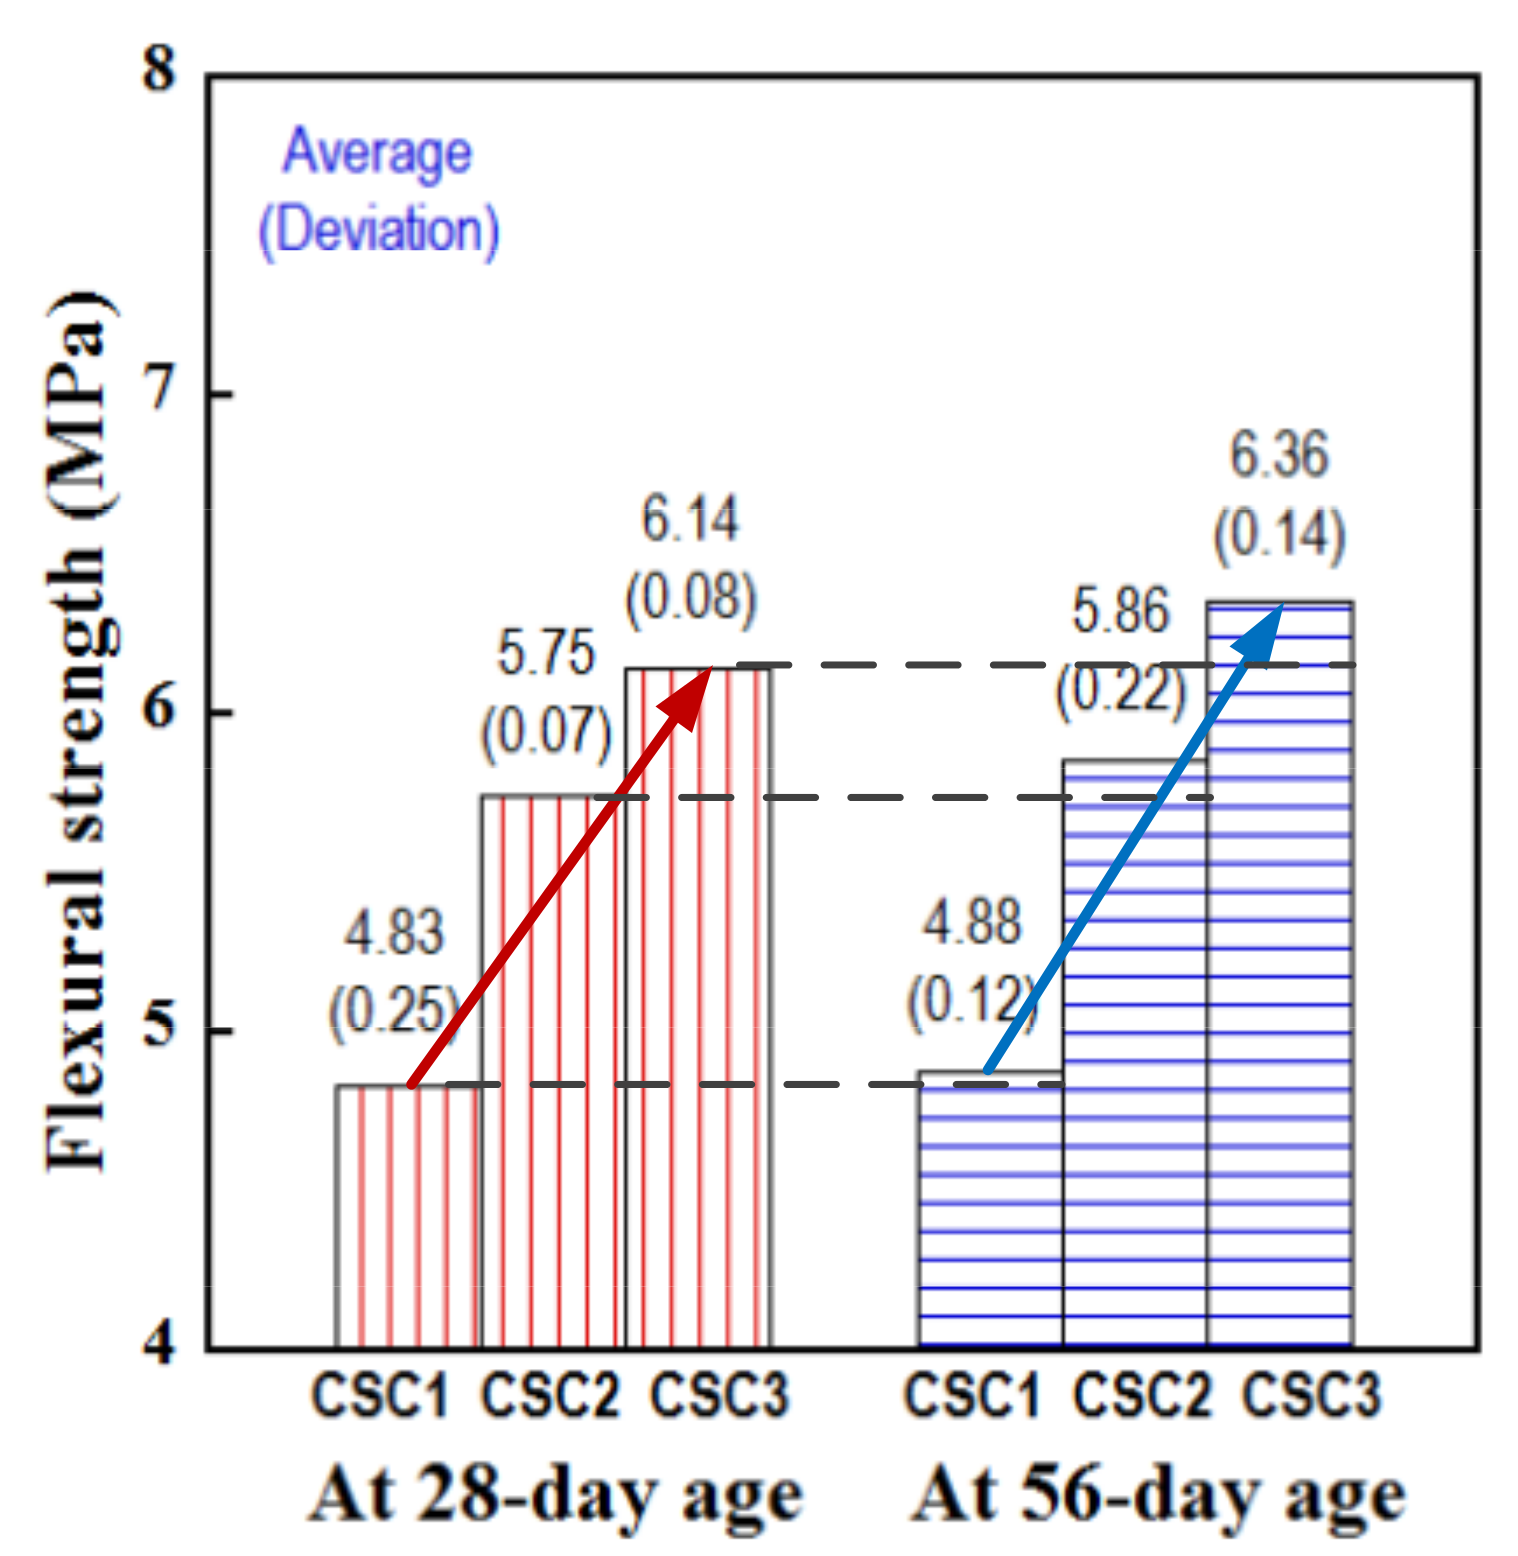
Figure 13.
Detail of the tested CSC beams.
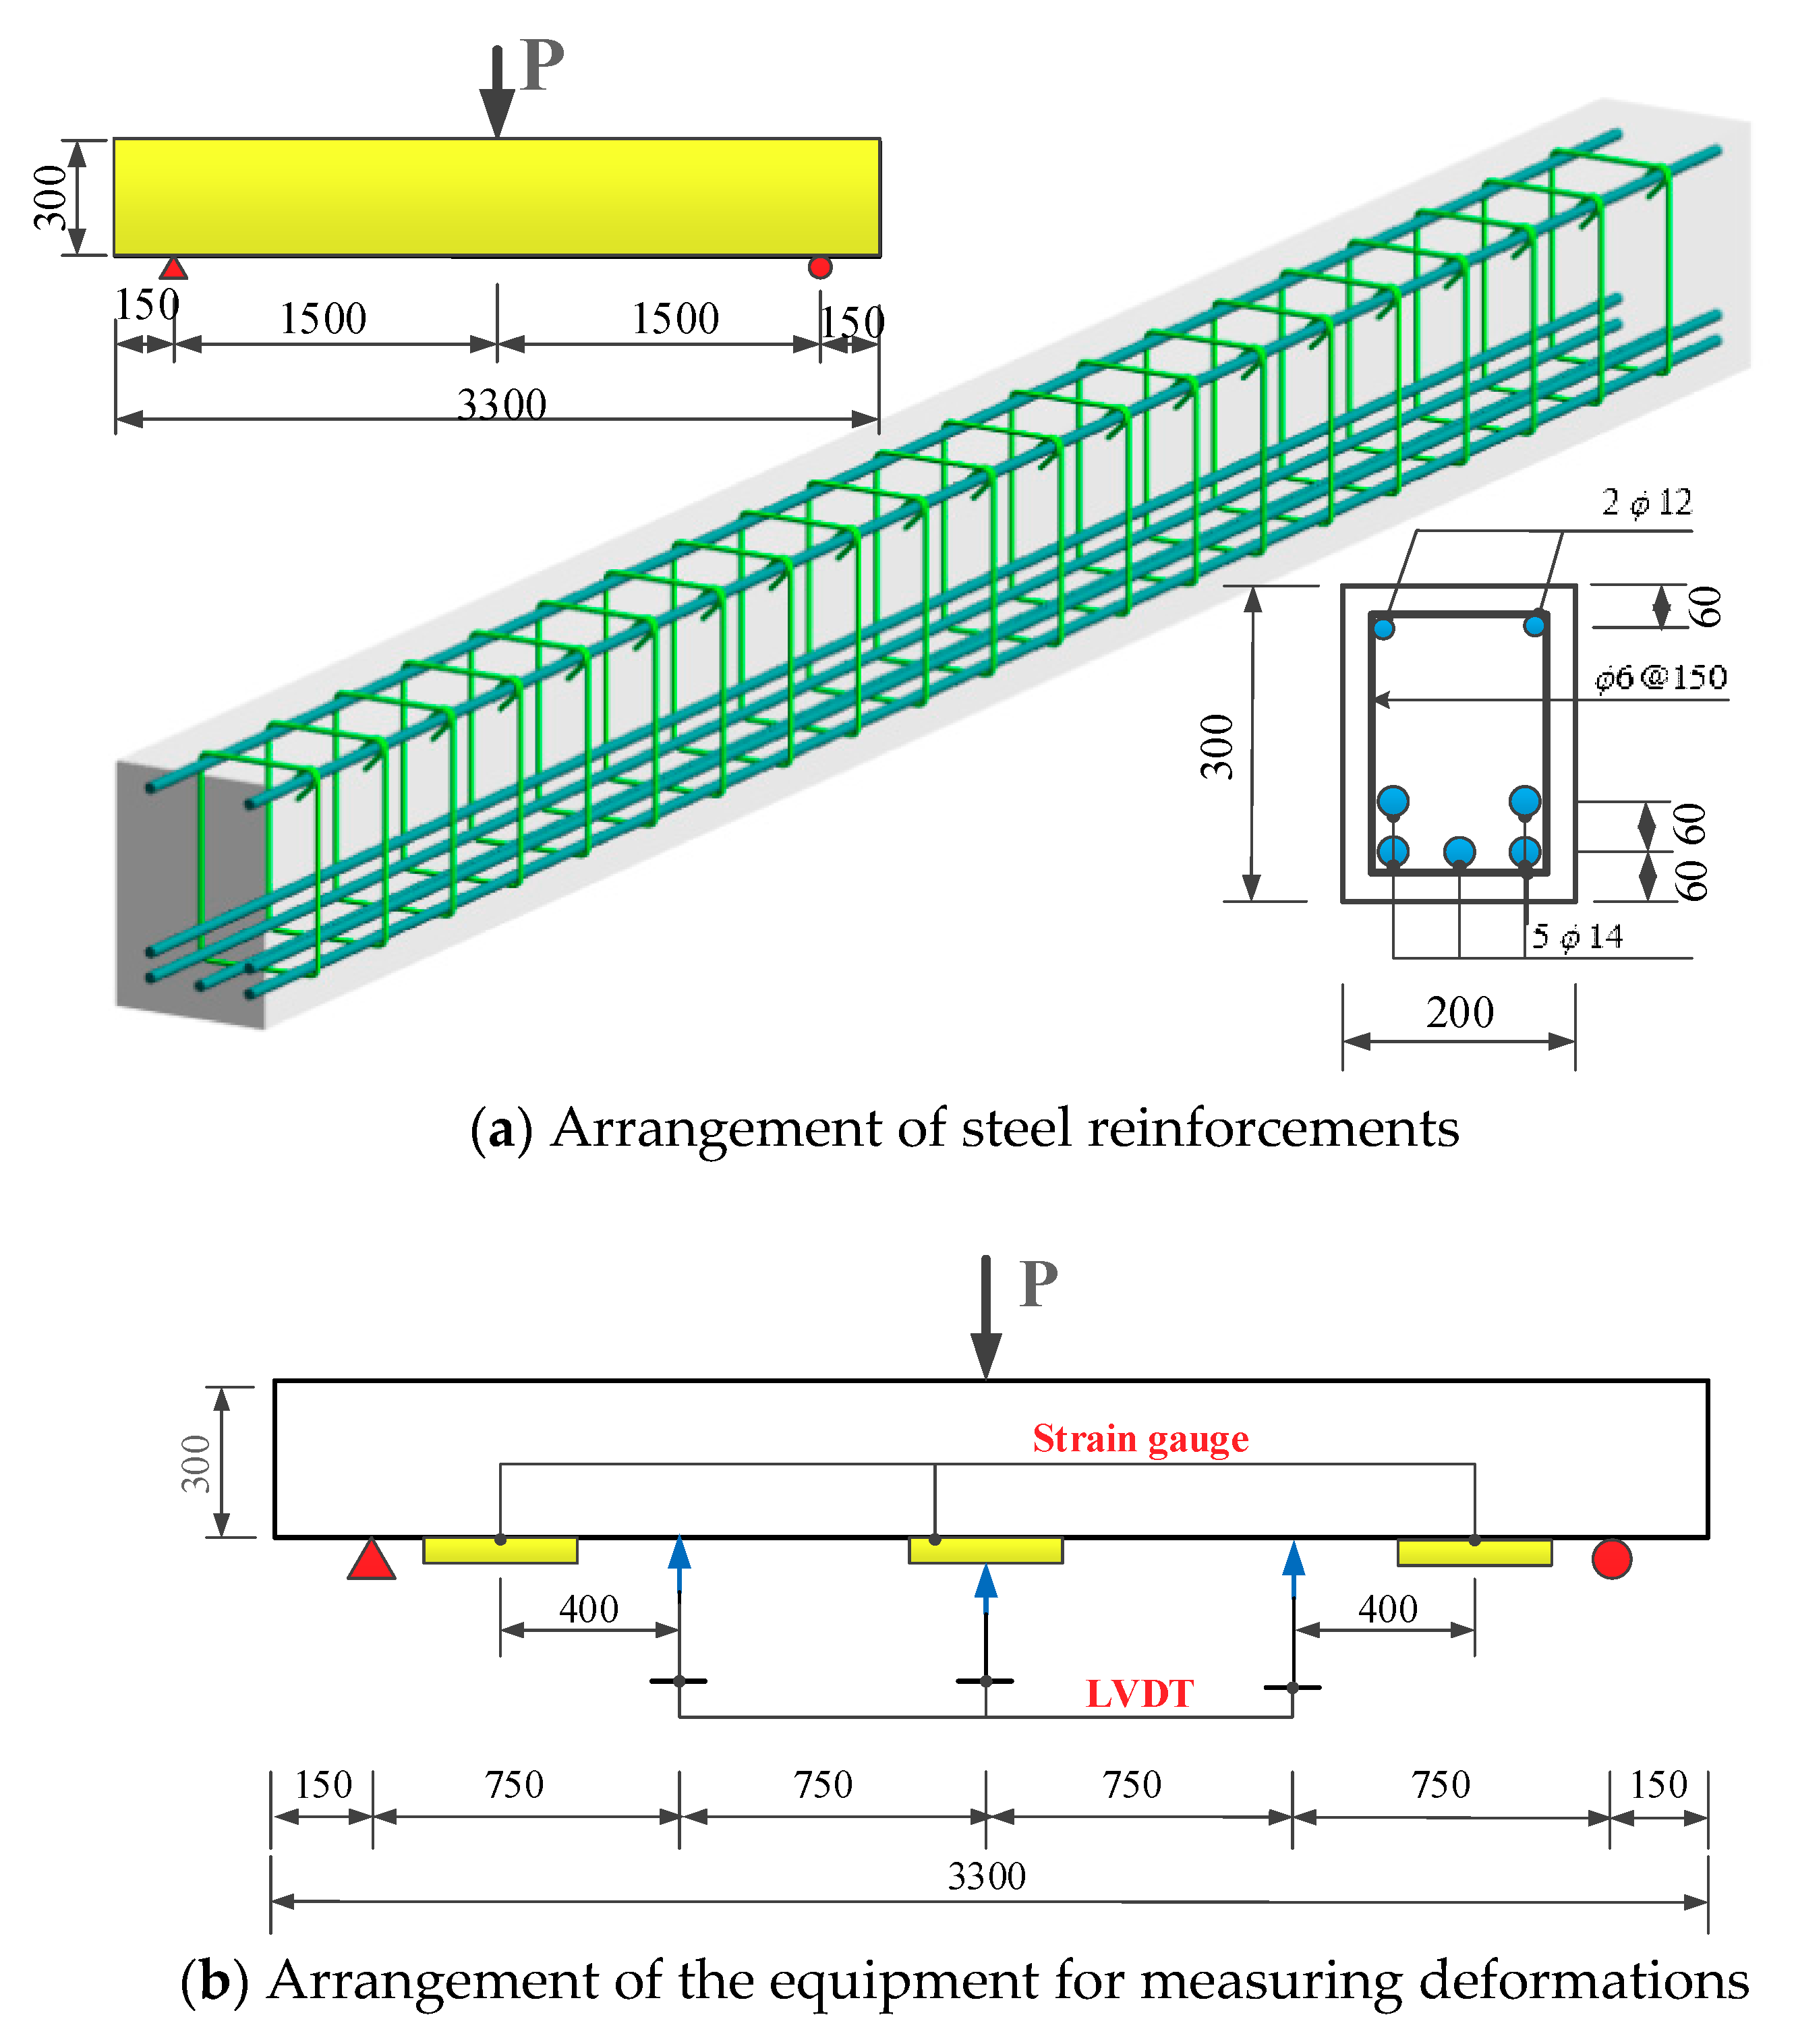
Figure 14.
Flexural behaviors of the reinforced CSC beams.

Figure 15.
Comparison of flexural resistances of three reinforced CSC beams.
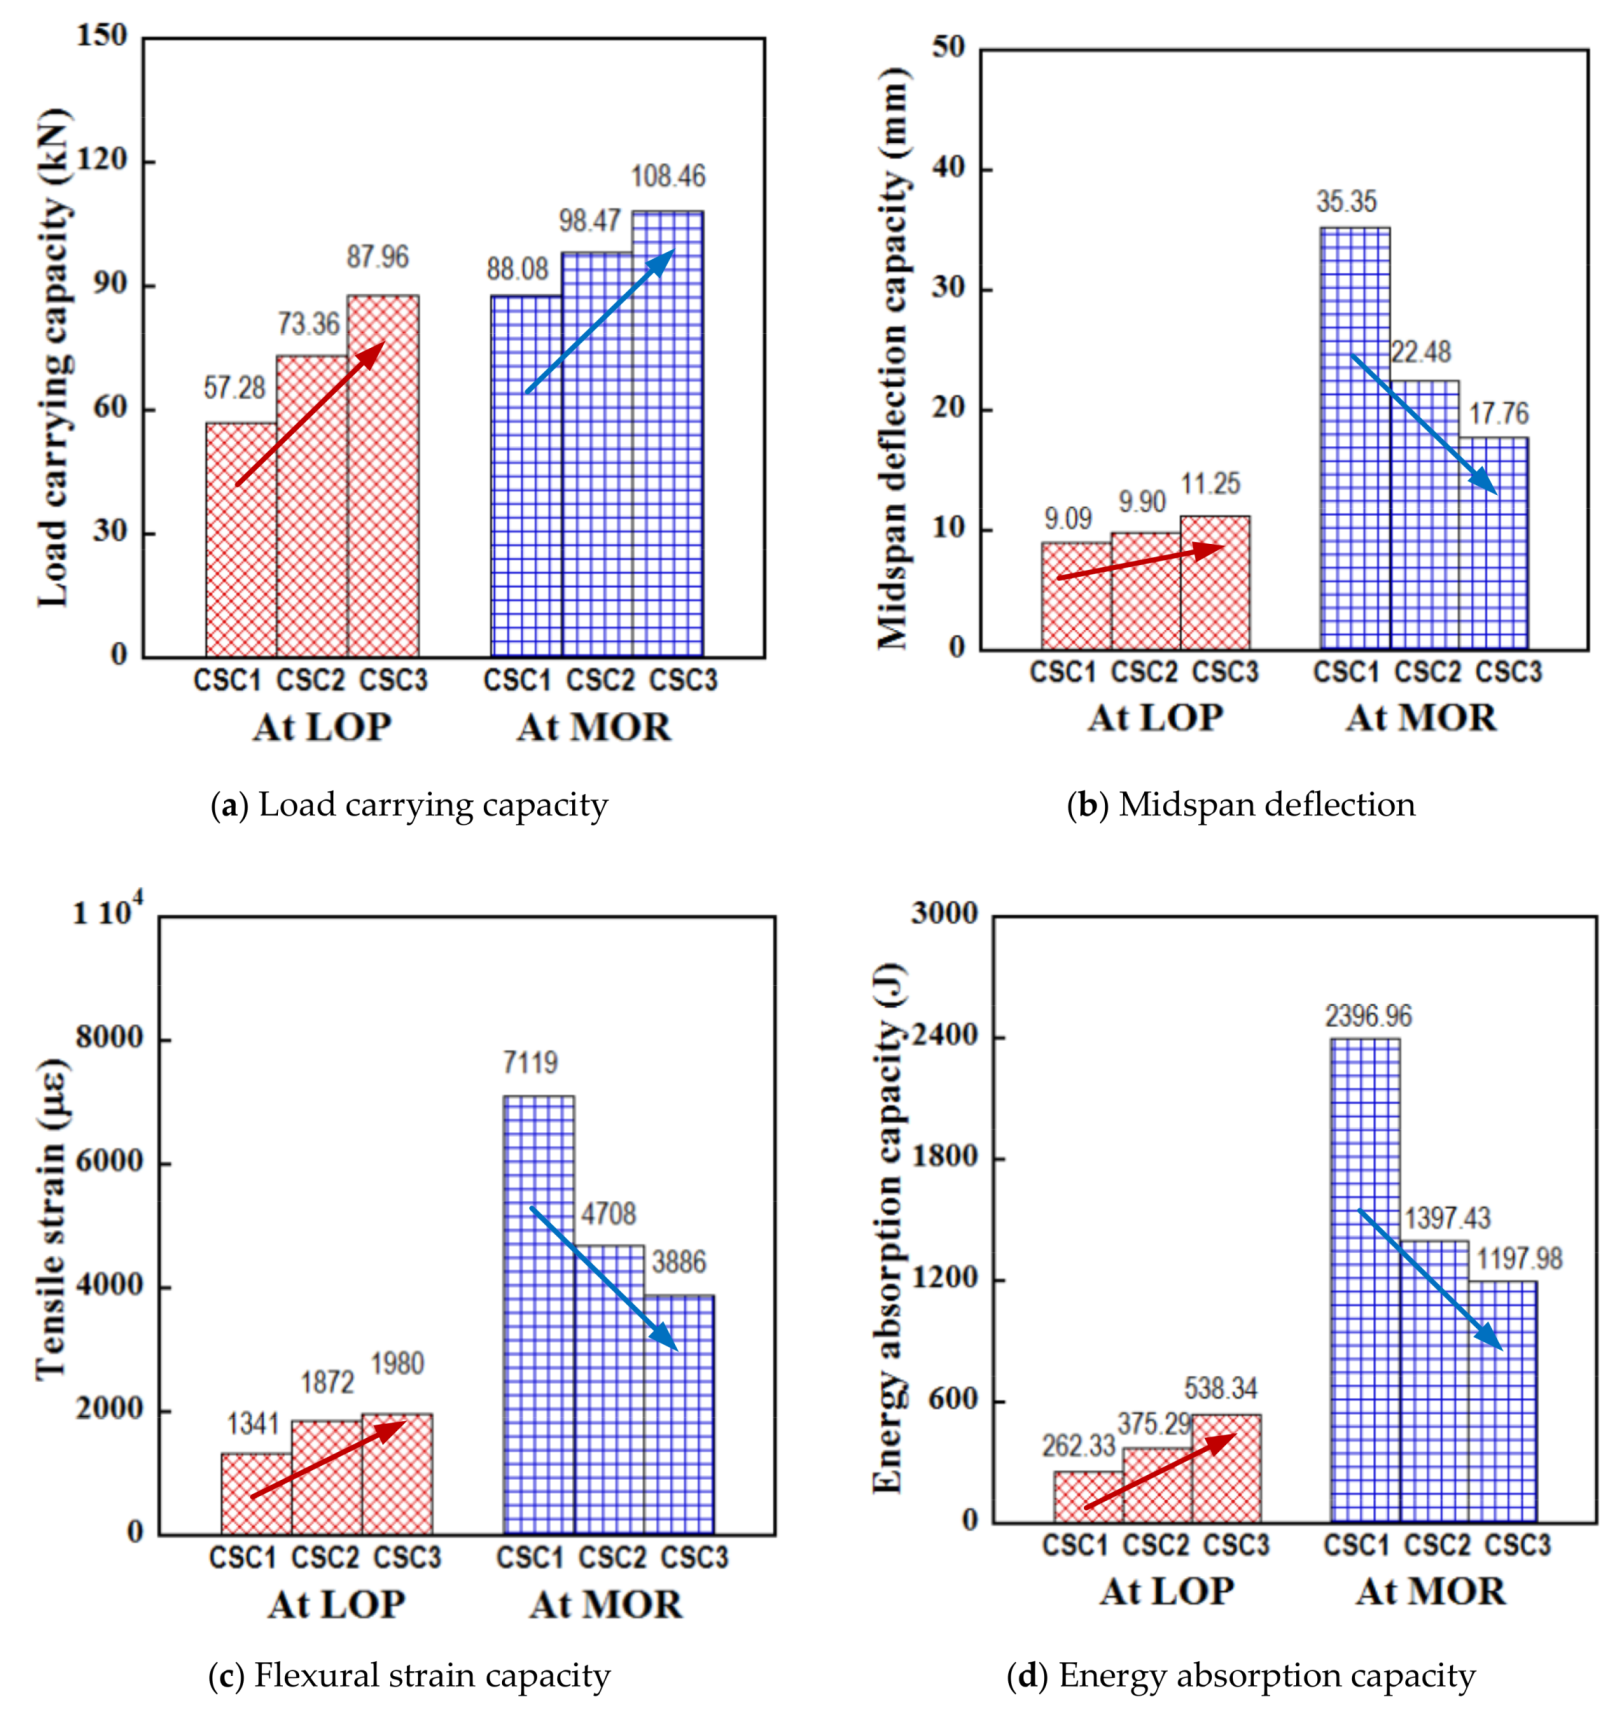
Figure 16.
Crack distribution in three reinforced CSC beams.
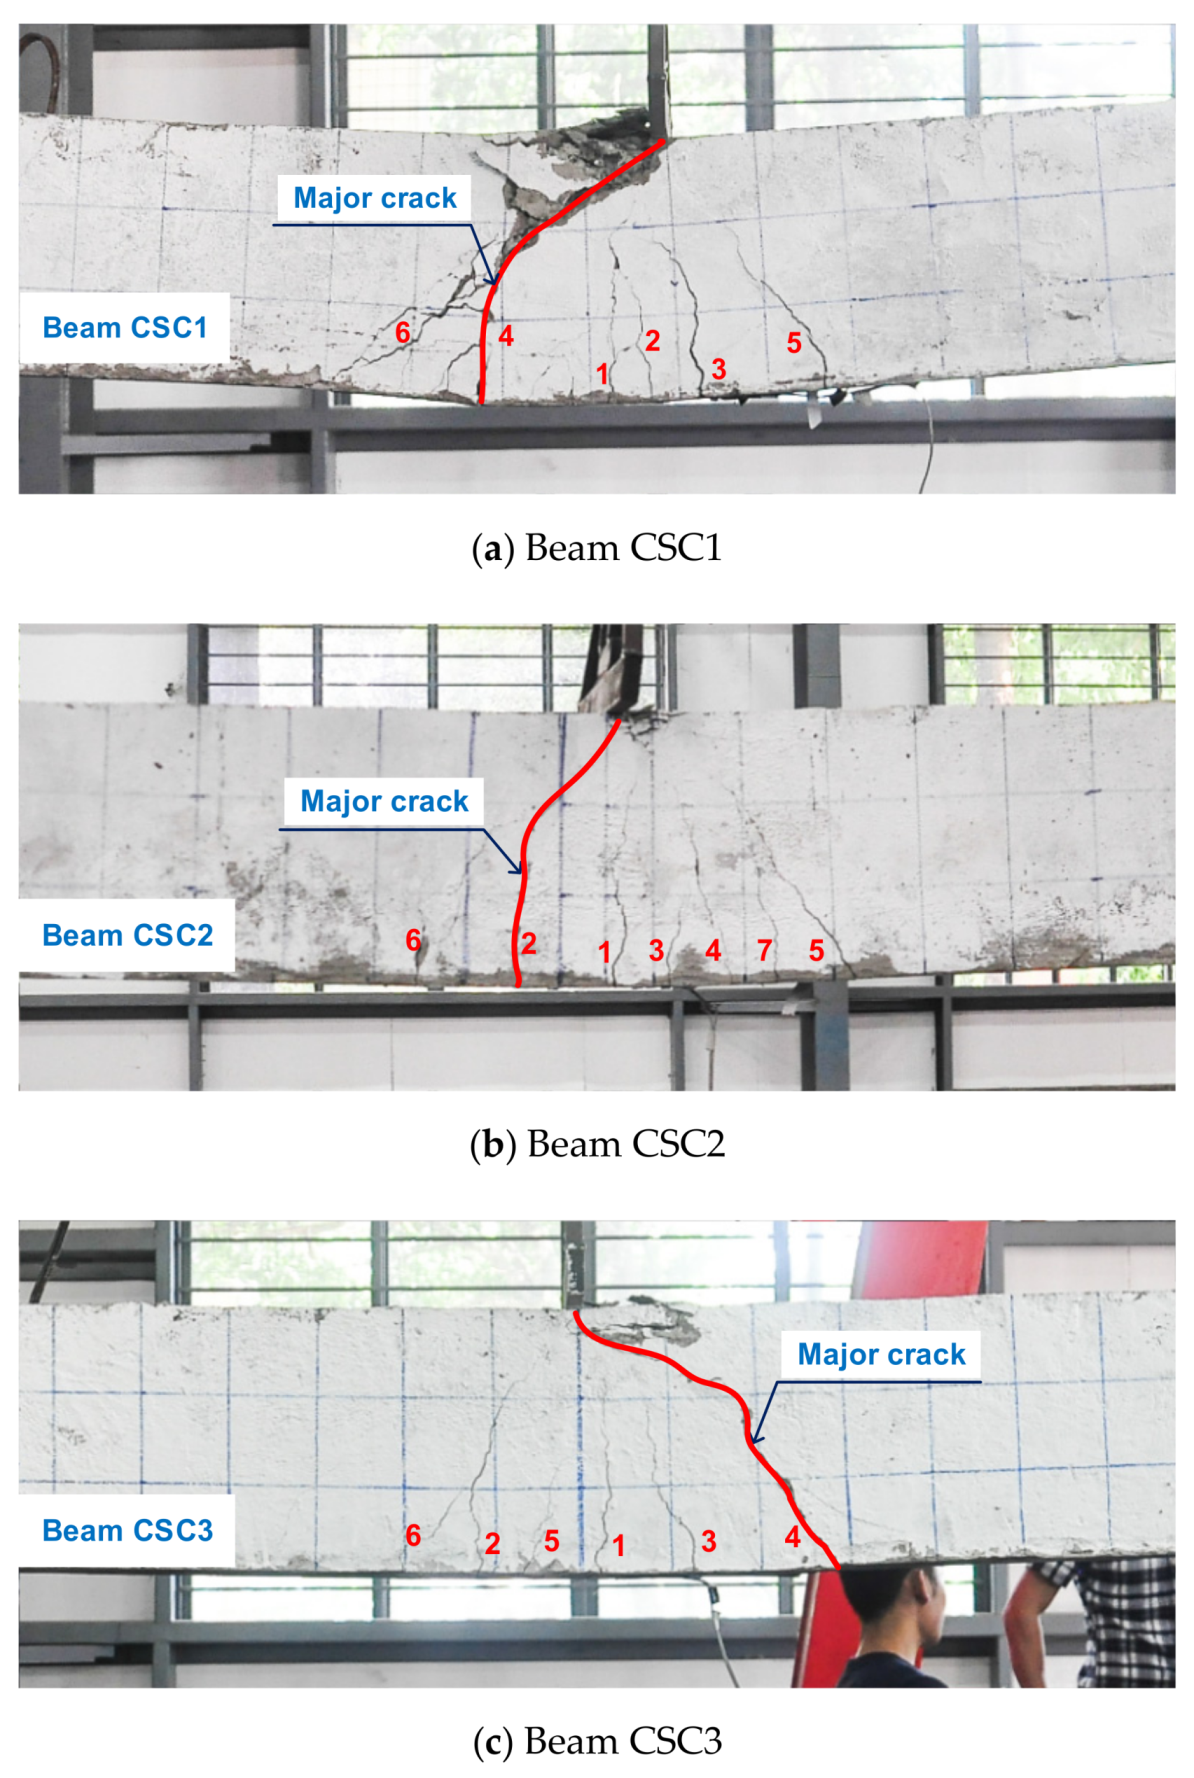
Figure 17.
Model correlating curvature, flexural strain and beam rigidity of CSC.


Table 1.
Mixture proportion of CSCs.
| Mixture | Cement (Kg/m3) | Fine River Sand (Kg/m3) | Coarse Steel Slag (Kg/m3) | Water (Kg/m3) | (MPa) | (GPa) |
|---|---|---|---|---|---|---|
| CSC1 | 385 | 740 | 1466 | 219 | 22.91 | 31.12 |
| CSC2 (control) | 437 | 722 | 1432 | 219 | 32.26 | 36.68 |
| CSC3 | 485 | 706 | 1400 | 219 | 35.68 | 39.21 |
Note: compressive strength () and modulus of elasticity () using a cylinder with diameter×heigth of 150 × 300 mm [21].
Table 2.
Size distribution of river sand and coarse steel slag.
| River Sand | Coarse Steel Slag | ||
|---|---|---|---|
| Size of Sieve (mm) | Pass (%) | Size of Sieve (mm) | Pass (%) |
| 4.75 | 100 | - | - |
| 2.36 | 91.5 | - | - |
| 1.18 | 73.4 | 37.5 | 100 |
| 0.6 | 54 | 19 | 91 |
| 0.3 | 24.5 | 9.5 | 44 |
| 0.15 | 7 | 4.75 | 5.1 |
| <0.14 | 0.0 | <4.75 | 0 |
Table 3.
Chemical configuration composition of coarse steel slag (%).
| SiO2 | Al2O3 | FeO | Fe2O3 | CaO | MgO | Na2O | K2O | TiO2 | P2O5 | SO3 | Loss on Ignition |
|---|---|---|---|---|---|---|---|---|---|---|---|
| 55.27 | 18.56 | 0.20 | 11.66 | 5.77 | 1.85 | 1.34 | 1.72 | 1.02 | 1.48 | 0.39 | 0.21 |
Table 4.
Physical properties of coarse steel slag.
| Physical Properties | Coarse Steel Slag | |
|---|---|---|
| Dmin–Dmax | 5–20 | mm |
| Specific gravity | 3.56 | g/cm3 |
| Bulk dry specific gravity | 3.32 | g/cm3 |
| Bulk saturated surface dry specific gravity | 3.39 | g/cm3 |
| Water absorption | 2.1 | % |
| Bulk density | 1720 | kg/m3 |
| Voids | 48.2 | % |
Table 5.
Splitting resistances of the CSC2 using different specimen types.
| Specimen Type (Specimen Name) Formula | Parameter | Maximum Force, | Splitting Strength |
|---|---|---|---|
| 70.7 × 70.7 × 70.7 (S-CU070) | Specimen1 | 53.80 | 5.00 |
| Specimen2 | 49.48 | 4.60 | |
| Specimen3 | 51.66 | 4.80 | |
| Average value | 51.64 | 4.80 | |
| Standard deviation | 2.16 | 0.20 | |
| 100 × 100 × 100 (S-CU100) | Specimen1 | 70.07 | 3.26 |
| Specimen2 | 64.43 | 2.99 | |
| Specimen3 | 66.57 | 3.09 | |
| Average value | 67.03 | 3.11 | |
| Standard deviation | 2.85 | 0.13 | |
| 150 × 150 × 150 (S-CU150) | Specimen1 | 120.64 | 2.49 |
| Specimen2 | 139.16 | 2.87 | |
| Specimen3 | 117.88 | 2.43 | |
| Average value | 125.89 | 2.60 | |
| Standard deviation | 11.57 | 0.24 | |
| Ø70 × 140 (CY070) | Specimen1 | 59.28 | 3.85 |
| Specimen2 | 61.46 | 3.99 | |
| Specimen3 | 61.10 | 3.97 | |
| Average value | 60.61 | 3.94 | |
| Standard deviation | 1.17 | 0.08 | |
| Ø100 × 200 (CY100) | Specimen1 | 116.40 | 3.71 |
| Specimen2 | 111.40 | 3.55 | |
| Specimen3 | 115.59 | 3.68 | |
| Average value | 114.46 | 3.64 | |
| Standard deviation | 2.68 | 0.09 | |
| Ø150 × 300 (CY150) | Specimen1 | 259.03 | 3.66 |
| Specimen2 | 253.47 | 3.59 | |
| Specimen3 | 236.11 | 3.34 | |
| Average value | 249.54 | 3.53 | |
| Standard deviation | 11.96 | 0.17 | |
| 100 × 100 × 100 (D-CU100) | Specimen1 | 56.40 | 2.93 |
| Specimen2 | 59.98 | 3.82 | |
| Specimen3 | 61.67 | 3.93 | |
| Average value | 59.35 | 3.56 | |
| Standard deviation | 2.69 | 0.55 |
Table 6.
Conversion factors for splitting and compressive strength of CSC with various splitting series.
Table 6.
Conversion factors for splitting and compressive strength of CSC with various splitting series.
| Testing Type of Splitting | Basic Specimen | |||||||
|---|---|---|---|---|---|---|---|---|
| S-CU070 | S-CU100 | S-CU150 | CY070 | CY100 | CY150 | D-CU100 | ||
| CSC | CY150 | 0.74 | 1.13 | 1.36 | 0.90 | 0.97 | 1.00 | 0.99 |
| NC, dmax 5 mm [39] | CY150 | - | - | - | 090 | 0.95 | 1.00 | - |
| NC, dmax 15 mm [39] | CY150 | - | - | - | 0.76 | 0.73 | 1.00 | - |
Table 7.
Brittleness indicator (Weibull modulus) of various kinds of concrete under different tests.
Table 7.
Brittleness indicator (Weibull modulus) of various kinds of concrete under different tests.
| Concrete Kind | Testing Type | |||
|---|---|---|---|---|
| Compression | Direct Tension | Flexural Tension | Splitting Tension | |
| CSC | 6.80; 11.32 [21] | - | - | 3.27; 17.02 [this study] |
| HPFRC | 8.69; 8.74 [39] | - | 1.90; 2.31 [39] | - |
| UHPFRC | - | 8.50 [40] | 6.40; 9.60 [41] | - |
| NC deviation | 4.20 ÷ 24.2 [42] | |||
Table 8.
Flexural strength of CSCs at testing age of 28 days and 56 days.
| Matrix Type | Specimen | Testing at 28 days | Testing at 56 days | ||
|---|---|---|---|---|---|
| Specimen1 | 16.54 | 4.96 | 15.96 | 4.79 | |
| Specimen2 | 16.62 | 4.99 | 16.10 | 4.83 | |
| CSC1 | Specimen3 | 15.13 | 4.54 | 16.71 | 5.01 |
| Average value | 16.10 | 4.83 | 16.26 | 4.88 | |
| Standard deviation | 0.84 | 0.25 | 0.40 | 0.12 | |
| Specimen1 | 19.19 | 5.76 | 20.39 | 6.12 | |
| Specimen2 | 18.93 | 5.68 | 19.27 | 5.78 | |
| CSC2 | Specimen3 | 19.40 | 5.82 | 18.98 | 5.69 |
| Average value | 19.17 | 5.75 | 19.55 | 5.86 | |
| Standard deviation | 0.23 | 0.07 | 0.74 | 0.22 | |
| Specimen1 | 20.33 | 6.10 | 21.39 | 6.42 | |
| Specimen2 | 20.29 | 6.09 | 20.67 | 6.20 | |
| CSC3 | Specimen3 | 20.79 | 6.24 | 21.56 | 6.47 |
| Average value | 20.47 | 6.14 | 21.21 | 6.36 | |
| Standard deviation | 0.28 | 0.08 | 0.47 | 0.14 | |
Table 9.
Properties of steel reinforcing bars.
| Type of Steel Bar | Yield Strength (MPa) | Ultimate Tensile Strength (MPa) | Modulus of Elasticity (GPa) | Shape Surface |
|---|---|---|---|---|
| Ø6 | 240 | 380 | 200 | plain |
| Ø12, Ø14 | 400 | 570 | 200 | deformed |
Table 10.
Flexural parameters of the reinforced CSC beams at 28-days’ age.
| Beam Name | Load at LOP, (kN) | Midspan Deflection at LOP | Flexural Strain at LOP | Energy at LOP, (J) | Load at MOR, (kN) | MidSpan Deflection at MOR | Flexural Strain at MOR | Energy at MOR, (J) |
|---|---|---|---|---|---|---|---|---|
| Beam CSC1 | 57.28 | 9.08 | 1341 | 262.33 | 88.08 | 35.35 | 7119 | 2396.96 |
| Beam CSC2 | 73.36 | 9.90 | 1872 | 375.29 | 98.47 | 22.48 | 4708 | 1397.43 |
| Beam CSC3 | 87.96 | 11.25 | 1980 | 538.34 | 108.46 | 17.76 | 3886 | 1197.98 |
Table 11.
Determination of flexural strength at LOP of the tested beams.
| Beam Name | Load at LOP, (kN) | Elastic Modulus of CSC | Location of Neutral Axis at LOP | Equivalent Moment of Inertia | Flexural Strength at LOP |
|---|---|---|---|---|---|
| Beam CSC1 | 57.28 | 31.12 | 153 | 481,328,912 | 13.16 |
| Beam CSC2 | 73.36 | 36.68 | 152 | 475,762,177 | 17.10 |
| Beam CSC3 | 87.96 | 39.21 | 152 | 473,745,984 | 20.62 |
Table 12.
Comparative flexural strain at LOP.
| Beam Name | Midspan Deflection at LOP/MOR (mm) | Curvature at LOP/MOR (1/m) | Location of Neutral Axis at LOP/MOR (mm) | Derived Flexural Strain at LOP/MOR | Measured Flexural Strain at LOP/MOR | Difference (%) |
|---|---|---|---|---|---|---|
| Beam CSC1 | 9.08/35.35 | 0.0101/0.0393 | 153/82 | 1488/8563 | 1341/7119 | 10/17 |
| Beam CSC2 | 9.90/22.48 | 0.0110/0.0250 | 152/64 | 1627/5895 | 1872/4690 | 15/20 |
| Beam CSC3 | 11.25/17.76 | 0.0125/0.0197 | 152/76 | 1851/4736 | 1980/3886 | 7/18 |
Table 13.
Comparative flexural moments.
| Beam Name | Compressive Strength | Location of Neutral Axis at MOR | Estimated Moment Resistance, | Experimental Moment | Difference (%) |
|---|---|---|---|---|---|
| Beam CSC1 | 22.91 | 93 | 61.72 | 67.75 | 9 |
| Beam CSC2 | 32.26 | 68 | 65.25 | 75.54 | 14 |
| Beam CSC3 | 35.68 | 64 | 66.08 | 83.03 | 20 |
© 2020 by the authors. Licensee MDPI, Basel, Switzerland. This article is an open access article distributed under the terms and conditions of the Creative Commons Attribution (CC BY) license (http://creativecommons.org/licenses/by/4.0/).
Share and Cite
MDPI and ACS Style
Nguyen, T.-T.-H.; Mai, H.-H.; Phan, D.-H.; Nguyen, D.-L. Responses of Concrete Using Steel Slag as Coarse Aggregate Replacement under Splitting and Flexure. Sustainability 2020, 12, 4913. https://doi.org/10.3390/su12124913
AMA Style
Nguyen T-T-H, Mai H-H, Phan D-H, Nguyen D-L. Responses of Concrete Using Steel Slag as Coarse Aggregate Replacement under Splitting and Flexure. Sustainability. 2020; 12(12):4913. https://doi.org/10.3390/su12124913
Chicago/Turabian StyleNguyen, Thi-Thuy-Hang, Hong-Ha Mai, Duc-Hung Phan, and Duy-Liem Nguyen. 2020. "Responses of Concrete Using Steel Slag as Coarse Aggregate Replacement under Splitting and Flexure" Sustainability 12, no. 12: 4913. https://doi.org/10.3390/su12124913
Note that from the first issue of 2016, this journal uses article numbers instead of page numbers. See further details here.