Did the Consumption Voucher Scheme Stimulate the Economy? Evidence from Smooth Time-Varying Cointegration Analysis

Abstract
1. Introduction
2. Materials and Methods
2.1. Methods
2.2. Materials
3. Results
3.1. Descriptive Statistics
3.2. Unit Root Tests
3.3. Specification Tests and Short-run Adjustment
3.4. Long-Run Relationship
4. Discussion
5. Conclusions
Supplementary Materials
Author Contributions
Funding
Acknowledgments
Conflicts of Interest
References
- Gopinath, G. The Great Lockdown: Worst Economic Downturn since the Great Depression. IMFBlog 2020. Available online: https://blogs.imf.org/2020/04/14/the-great-lockdown-worst-economic-downturn-since-the-great-depression/ (accessed on 26 May 2020).
- Chi, C. Taiwan’s Response to the Coronavirus Pandemic-New Updated. Cambridge Core Blog 2020. Available online: https://www.cambridge.org/core/blog/2020/04/16/taiwans-response-to-the-coronavirus-pandemic/ (accessed on 26 May 2020).
- Taipei Times. EDITORIAL: Stimulus Vouchers Welcome. Available online: https://www.taipeitimes.com/News/editorials/archives/2020/05/26/2003737032 (accessed on 26 May 2020).
- Kan, K.; Peng, S.-K.; Wang, P. Understanding consumption behavior: Evidence from consumers’ reaction to shopping vouchers. Am. Econ. J. Econ. Policy 2017, 9, 137–153. [Google Scholar] [CrossRef]
- CEPD. Statistical and Impact Assessment Report on the Implementation of the Economic Stimulus Consumption Voucher Scheme; Council for Economic Planning and Development, Executive Yuan: Taipei, Taiwan, 2009; Available online: https://web.ntpu.edu.tw/~guan/courses/ConsumptionVoucherReport.pdf?fbclid=IwAR2hDNV-7MsGRU4YPU4lYzQrIEb4F4dj592GicTY9wcsOcTU0GEFIwWH89A (accessed on 26 May 2020).
- Zeng, Z.C. The Evaluation for the Initiative Activities of Local Governments: Three Comments on Consumption Voucher; National Policy Foundation: Taipei, Taiwan, 2009; Available online: http://www.npf.org.tw/post/2/5457 (accessed on 26 May 2020).
- DGBAS. Macroeconomics Statistics Database; Directorate-General of Budget, Accounting and Statistics, Executive Yuan: Taipei, Taiwan, 2020. Available online: https://statdb.dgbas.gov.tw/pxweb/Dialog/statfile9L.asp (accessed on 26 May 2020).
- Modigliani, F.; Steindel, C.; Hymans, S.H.; Juster, F.T. Is a tax rebate an effective tool for stabilization policy? Brook. Pap. Econ. Act. 1977, 1977, 175. [Google Scholar] [CrossRef]
- Gechert, S.; Horn, G.A.; Paetz, C. Long-term effects of fiscal stimulus and austerity in Europe. Oxf. Bull. Econ. Stat. 2018, 81, 647–666. [Google Scholar] [CrossRef]
- Dawid, H.; Harting, P.; Neugart, M. Fiscal transfers and regional economic growth. Rev. Int. Econ. 2018, 26, 651–671. [Google Scholar] [CrossRef]
- Jordà, Ò.; Taylor, A.M. The time for austerity: Estimating the average treatment effect of fiscal policy. Econ. J. 2016, 126, 219–255. [Google Scholar] [CrossRef]
- Kaplan, G.; Violante, G. A model of the consumption response to fiscal stimulus payments. Econometrica 2011, 82, 1199–1239. [Google Scholar] [CrossRef][Green Version]
- Misra, K.; Surico, P. Consumption, income changes, and heterogeneity: Evidence from two fiscal stimulus programs. Am. Econ. J. Macroecon. 2014, 6, 84–106. [Google Scholar] [CrossRef]
- Parker, J.A.; Souleles, N.S.; Johnson, D.S.; McClelland, R. Consumer spending and the economic stimulus payments of 2008. Am. Econ. Rev. 2013, 103, 2530–2553. [Google Scholar] [CrossRef]
- Sahm, C.R.; Shapiro, M.D.; Slemrod, J. Check in the mail or more in the paycheck: Does the effectiveness of fiscal stimulus depend on how it is delivered? Am. Econ. J. Econ. Policy 2012, 4, 216–250. [Google Scholar] [CrossRef]
- Wei, W.C. The dynamics analysis and simulation of macroeconomic behavior of Taiwan’s invigorating economy consumption voucher. Taiwan. J. Appl. Econ. 2011, 89, 153–181. [Google Scholar] [CrossRef]
- Sahm, C.R.; Shapiro, M.D.; Slemrod, J. Household response to the 2008 tax rebate: Survey evidence and aggregate implications. In Tax Policy and the Economy; Brown, J.R., Ed.; University of Chicago Press: Chicago, IL, USA, 2010; Volume 24, pp. 69–110. [Google Scholar]
- Shapiro, M.D.; Slemrod, J. Did the 2008 tax rebates stimulate spending? Am. Econ. Rev. 2009, 99, 374–379. [Google Scholar] [CrossRef] [PubMed]
- Holland, M.; Marçal, E.; De Prince, D. Is fiscal policy effective in Brazil? An empirical analysis. Q. Rev. Econ. Financ. 2020, 75, 40–52. [Google Scholar] [CrossRef]
- Ramey, V.A.; Zubairy, S. Government spending multipliers in good times and in bad: Evidence from US historical data. J. Political Econ. 2018, 126, 850–901. [Google Scholar] [CrossRef]
- Hong, C.-Y.; Li, J.-F. On measuring the effects of fiscal policy in global financial crisis: Evidences from an export-oriented island economy. Econ. Model. 2015, 46, 412–415. [Google Scholar] [CrossRef]
- Berger, D.; Vavra, J. Measuring how fiscal shocks affect durable spending in recessions and expansions. Am. Econ. Rev. 2014, 104, 112–115. [Google Scholar] [CrossRef]
- Hsieh, C.-T.; Shimizutani, S.; Hori, M. Did Japan’s shopping coupon program increase spending? J. Public Econ. 2010, 94, 523–529. [Google Scholar] [CrossRef]
- Taylor, J.B. The lack of an empirical rationale for a revival of discretionary fiscal policy. Am. Econ. Rev. 2009, 99, 550–555. [Google Scholar] [CrossRef]
- Agarwal, S.; Liu, C.; Souleles, N.S. The reaction of consumer spending and debt to tax rebates-Evidence from consumer credit data. J. Political Econ. 2007, 115, 986–1019. [Google Scholar] [CrossRef]
- Park, J.Y.; Hahn, S.B. Cointegrating regressions with time varying coefficients. Econ. Theory 1999, 15, 664–703. [Google Scholar] [CrossRef]
- Bai, J.; Perron, P. Computation and analysis of multiple structural change models. J. Appl. Econ. 2003, 18, 1–22. [Google Scholar] [CrossRef]
- Johansen, S. Likelihood Based Inference in Cointegrated Vector Autoregressive Models; Oxford University Press: Oxford, UK, 1995. [Google Scholar]
- Matilla-García, M.; Pérez, P.; Sanz, B. Testing for parameter stability: The Spanish consumption function. Appl. Econ. Lett. 2006, 13, 445–448. [Google Scholar] [CrossRef]
- Song, H.; Romilly, P.; Liu, X. The UK consumption function and structural instability: Improving forecasting performance using a time-varying parameter approach. Appl. Econ. 1998, 30, 975–983. [Google Scholar] [CrossRef]
- Lucas, R.E. Econometric policy evaluation: A critique. In The Phillips Curve and Labor Markets; Brunner, K., Meltzer, A.H., Eds.; Carnegie-Rochester Conference Series on Public Policy: Amsterdam, The Netherlands, 1976; Volume 1, pp. 19–46. [Google Scholar]
- Clausen, V.; Schürenberg-Frosch, H. Private consumption and cyclical asymmetries in the Euro area. Intereconomics 2012, 47, 190–196. [Google Scholar] [CrossRef][Green Version]
- Park, S.Y.; Zhao, G. An estimation of U.S. gasoline demand: A smooth time-varying cointegration approach. Energy Econ. 2010, 32, 110–120. [Google Scholar] [CrossRef]
- Zuo, H.; Park, S.Y. Money demand in China and time-varying cointegration. China Econ. Rev. 2011, 22, 330–343. [Google Scholar] [CrossRef]
- Chang, Y.; Martinez-Chombo, E. Electricity Demand Analysis Using Cointegration and Error-Correction Models with Time Varying Parameters: The Mexican Case; Working Paper; Department of Economics, Rice University: Houston, TX, USA, 2003; Available online: http://www.ruf.rice.edu/~econ/papers/2003papers/08Chang.pdf (accessed on 26 May 2020).
- Park, J.Y. Canonical cointegrating regressions. Econometrica 1992, 60, 119. [Google Scholar] [CrossRef]
- Narayan, P.K.; Popp, S. A new unit root test with two structural breaks in level and slope at unknown time. J. Appl. Stat. 2010, 37, 1425–1438. [Google Scholar] [CrossRef]
- Hall, A. Testing for a unit root in time series with pretest data-based model selection. J. Bus. Econ. Stat. 1994, 12, 461–470. [Google Scholar]
- Chen, W.Y. Does housing cost affect birth rates in Taiwan? The ADL test for threshold cointegration. Rom. J. Econ. Forecast. 2013, 16, 90–103. [Google Scholar]
- Chu, M.C. Summary for triplicate stimulus coupons. Taiwan News. 2 June 2020. Available online: https://www.taiwannews.com.tw/ch/news/3943404 (accessed on 6 June 2020).
- Huang, T. Taiwan’s local governments roll out hot deals to boost stimulus voucher spending. Taiwan News. 2 June 2020. Available online: https://www.taiwannews.com.tw/en/news/3943854 (accessed on 6 June 2020).


| Variables | Description | Mean | Std. Dev | Max | Min |
|---|---|---|---|---|---|
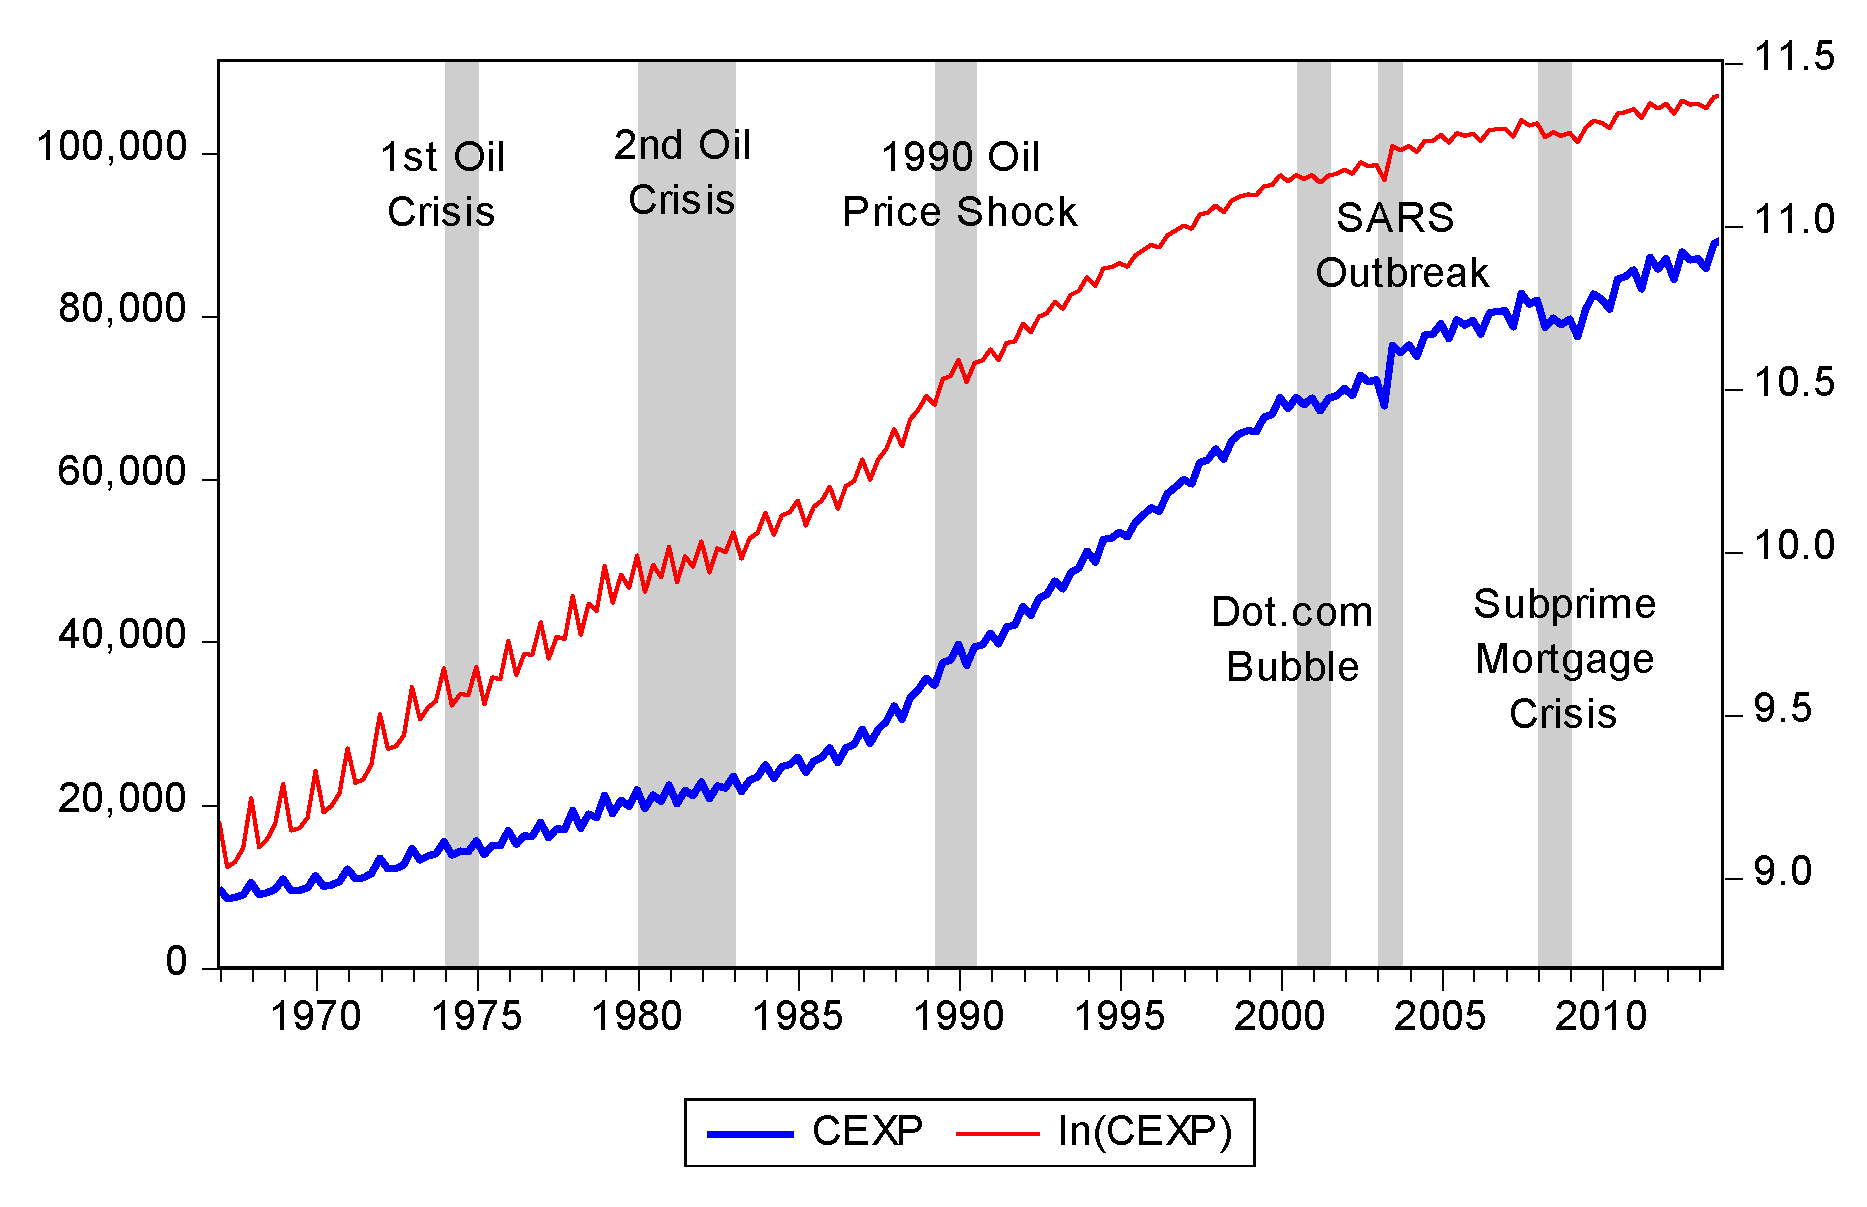
| CEXP | Private Consumption Per capita at the 2006 price level (NT$) | 43,916.45 | 27,186.74 | 89,336.33 | 8,358.36 |
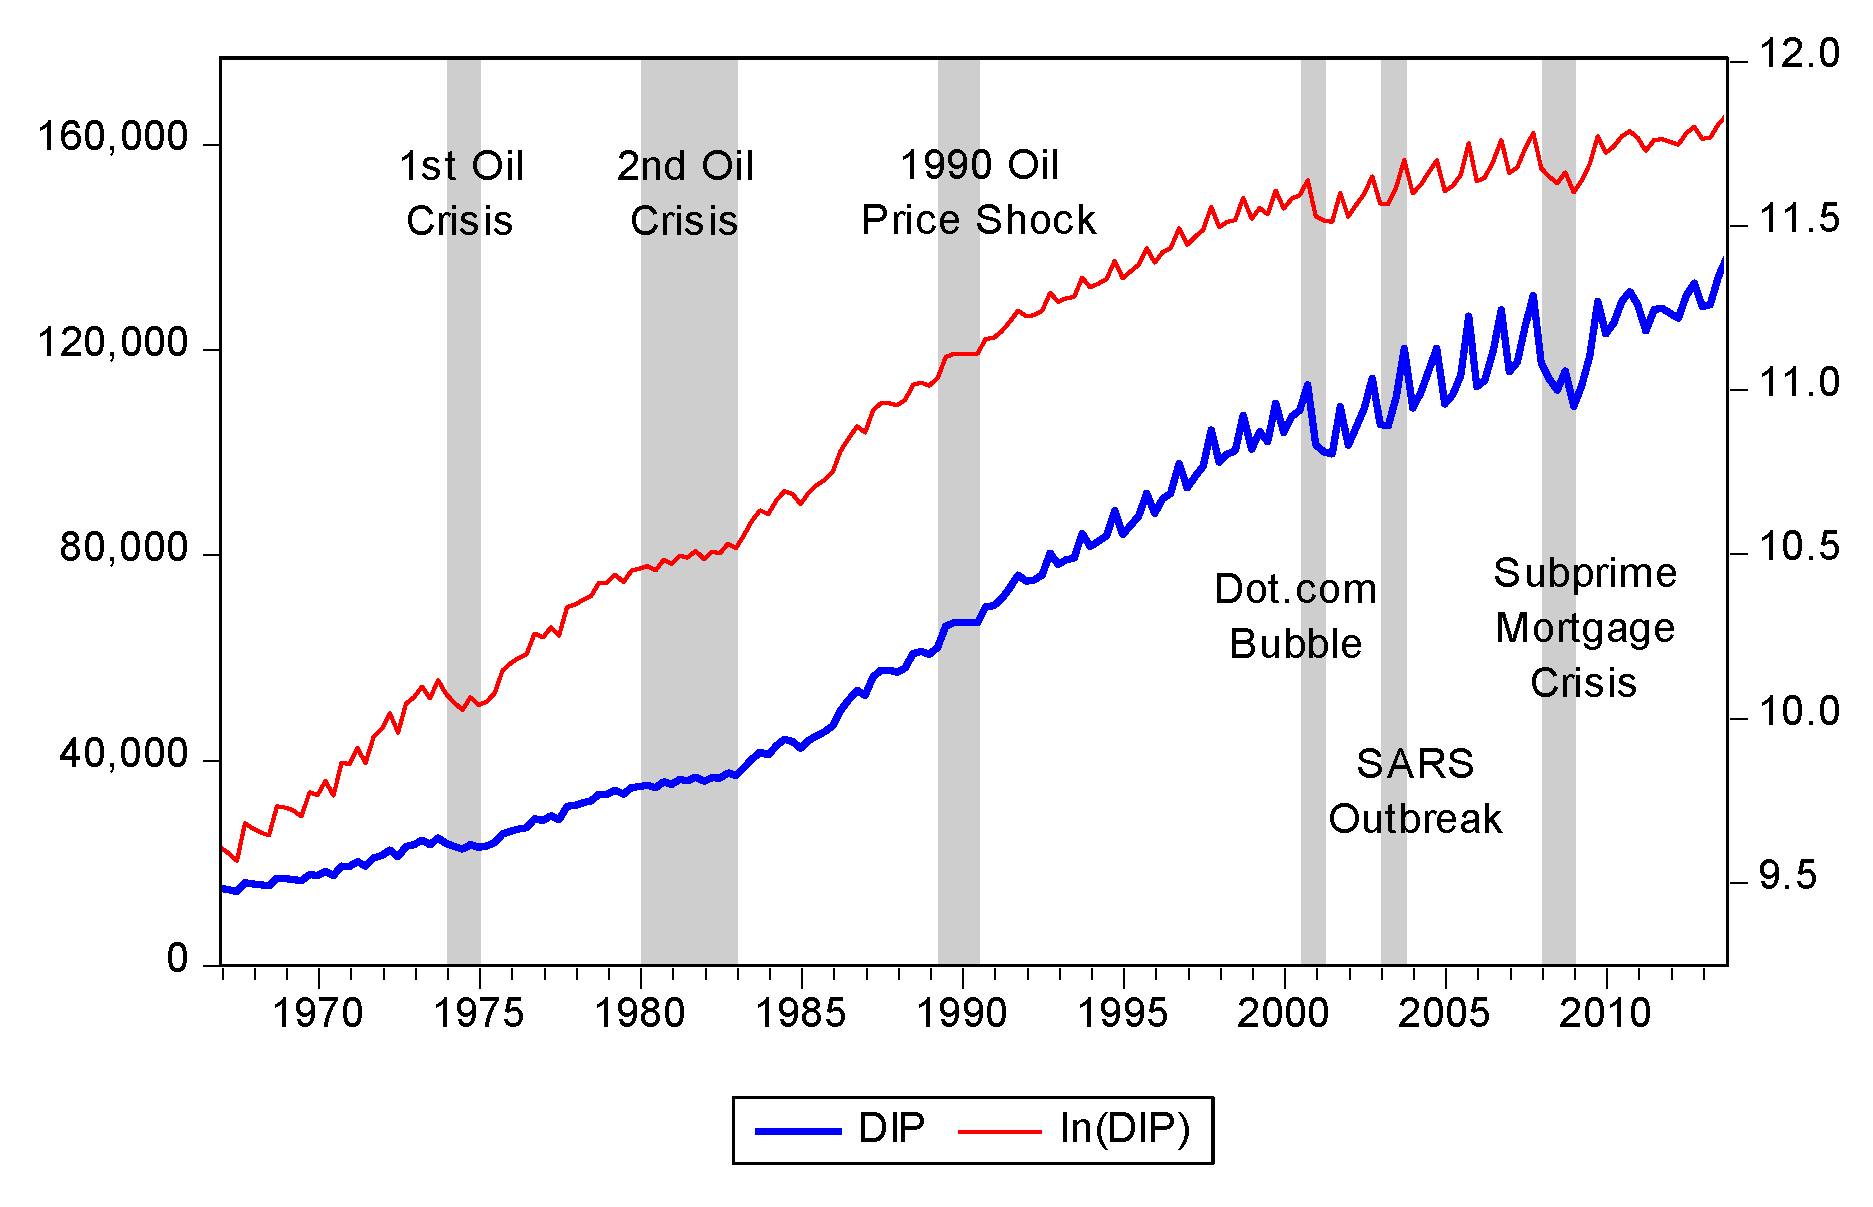
| DIP | Disposal Income per capita at the 2006 price level (NT$) | 69,492.07 | 39,429.60 | 13,7664.4 | 14,238.22 |
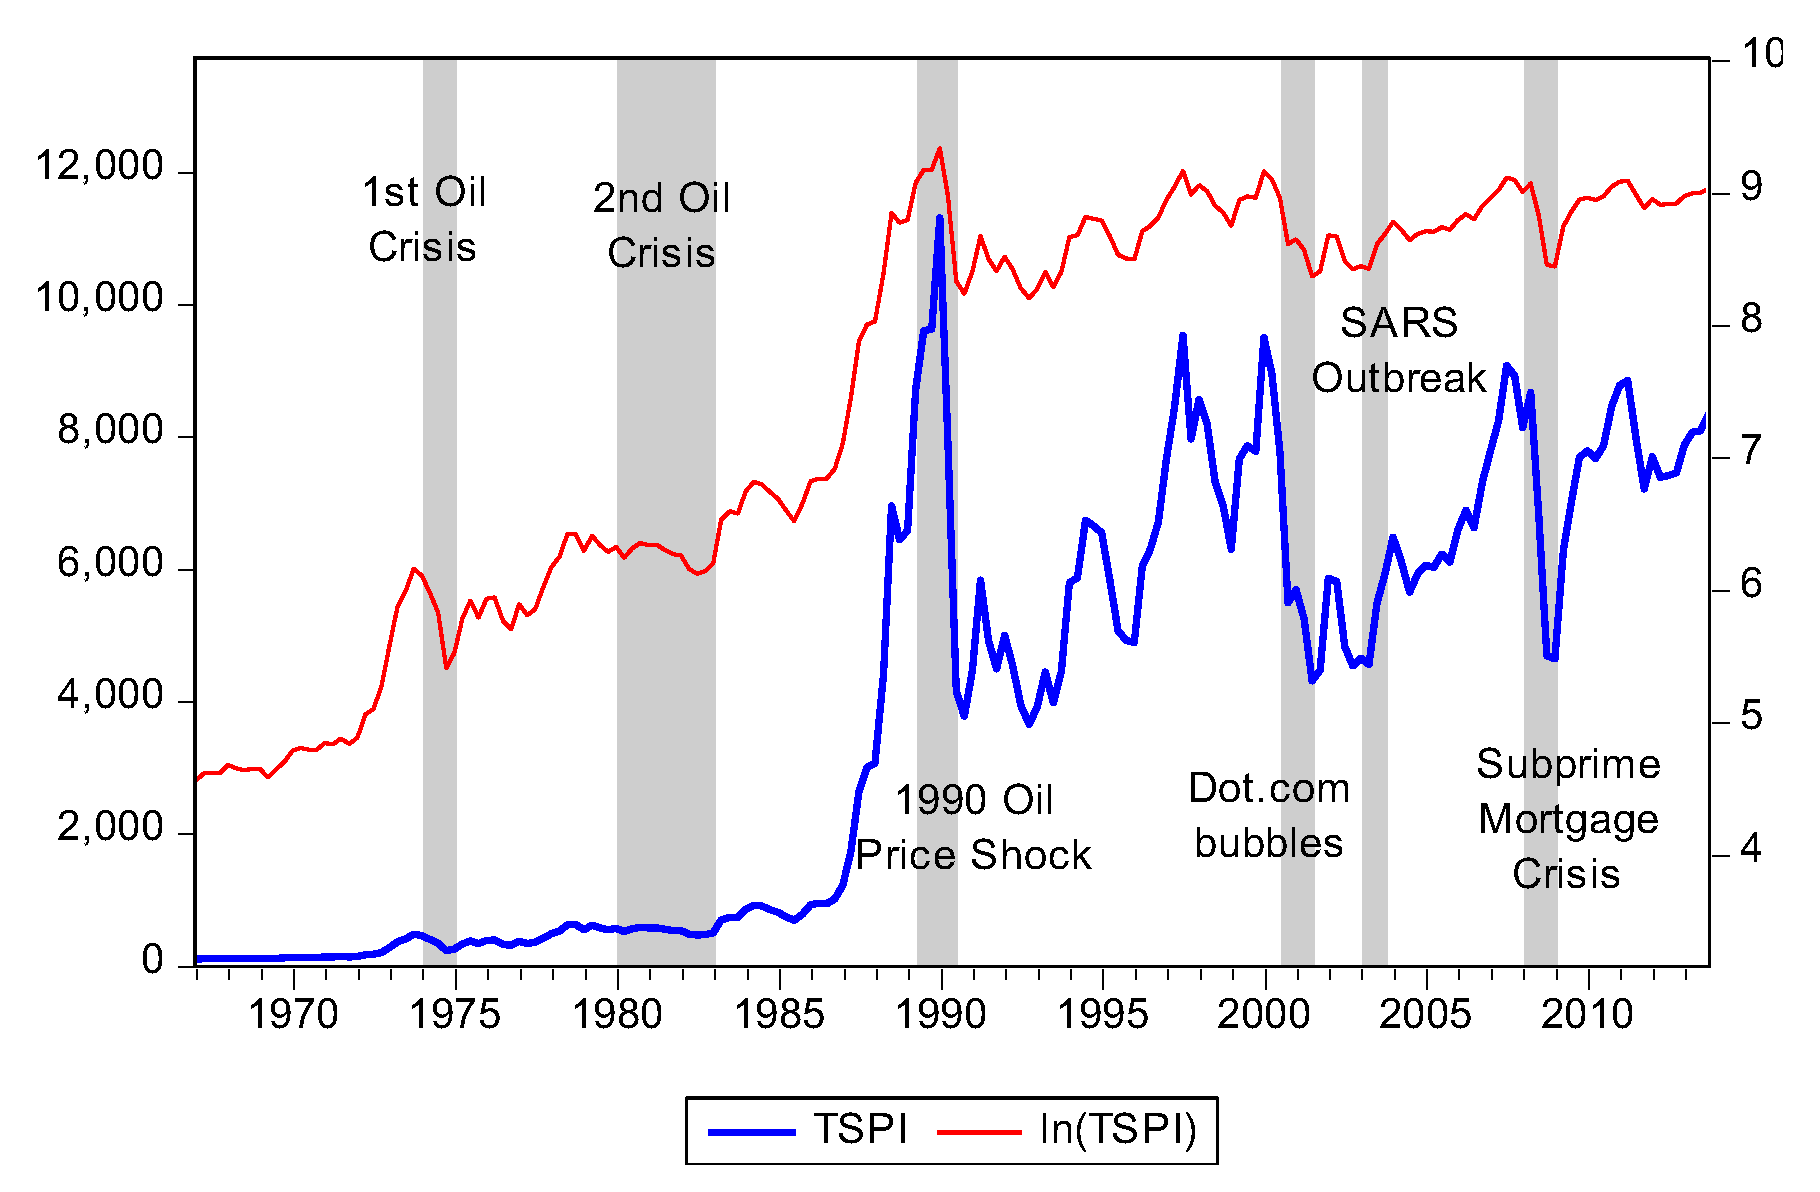
| TSPI | Taiwan Stock Exchange Capitalization- Weighted Index (Points) | 38,63.53 | 32,88.82 | 11,294.67 | 94.67 |
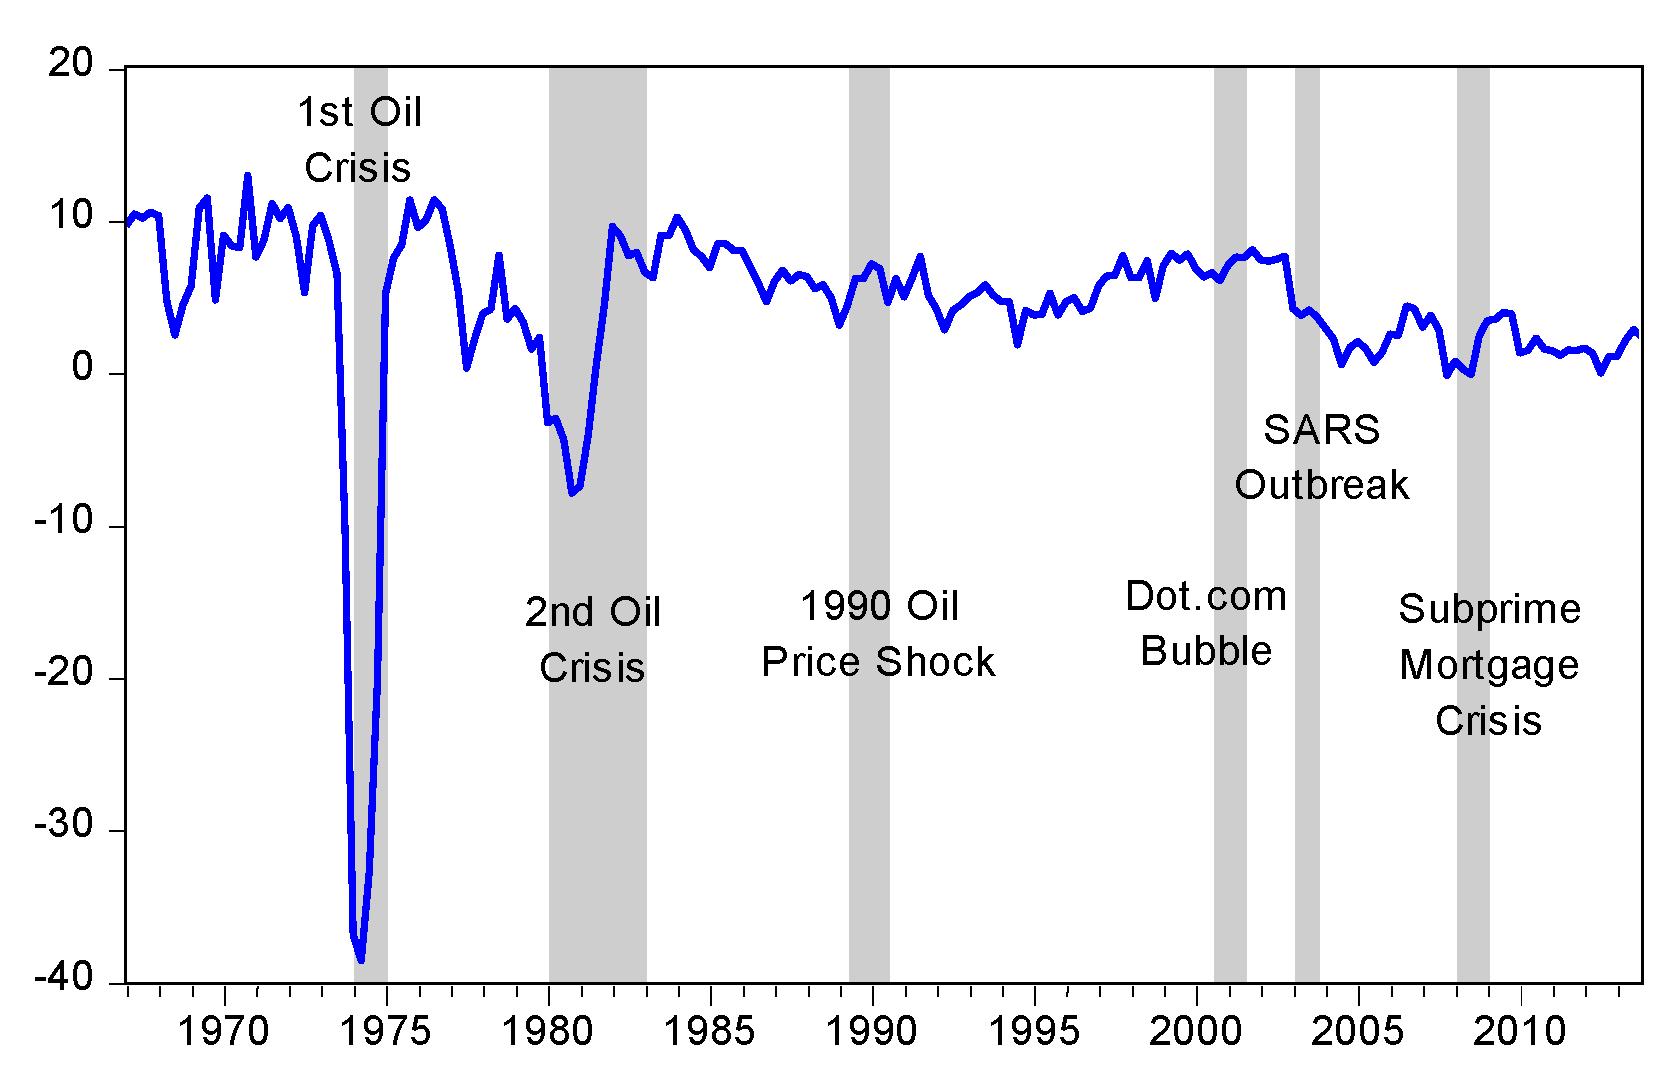
| RIR | Real Interest Rate=Prime Lending Rate-Inflation Rate (%) | 4.30 | 6.57 | 12.94 | −38.60 |
| (a) ADF & PP | Levels | Differences | ||||||
| Demeaned | De-trended | Demeaned | De-trended | |||||
| ADF | PP | ADF | PP | ADF | PP | ADF | PP | |
| ln(CEXP) | −2.051 | −1.812 | −0.160 | −2.485 | −3.628† | −31.115† | −4.196† | −38.426† |
| ln(DIP) | −2.758 | −2.661 | −0.318 | −1.028 | −4.054† | −20.983† | −4.968† | −24.223† |
| ln(TSPI) | −1.502 | −1.561 | −4.034* | −3.421 | −6.541† | −9.617† | −9.709† | −9.858† |
| ln(RIR) | −5.071† | −3.376* | −5.078† | −3.364 | −7.898† | −18.665† | −7.875† | 18.839† |
| (b) New ADF | Levels-M1 | Levels-M2 Levels | ||||||
| ADF | TB1 | TB2 | Lags | ADF | TB1 | TB2 | Lags | |
| ln(CEXP) | −1.426 | 1975.Q2 | 2003.Q2 | 19 | −1.577 | 1975.Q2 | 2003.Q2 | 19 |
| ln(DIP) | −1.203 | 1973.Q4 | 2000.Q4 | 8 | −4.049 | 1990.Q3 | 2000.Q4 | 8 |
| ln(TSPI) | −3.079 | 1987.Q1 | 1990.Q3 | 18 | −4.341 | 1988.Q1 | 1990.Q1 | 7 |
| ln(RIR) | −1.616 | 1973.Q4 | 1978.Q1 | 20 | −2.064 | 1973.Q4 | 1979.Q2 | 20 |
| CV5% | −4.136 | −5.318 | ||||||
| CV1% | −4.731 | −4.714 | ||||||
| (a) Model Specification Test | H0: Fixed Coefficient Cointegration Model HA: STVC Model | H0: STVC Model HA: No Cointegration |
|---|---|---|
| Test Statistics | 527.49 | 2.01 |
| 1% Critical Values | 13.28 | 13.28 |
| 5% Critical Values | 9.49 | 9.49 |
| 10% Critical Values | 7.78 | 7.78 |
| (b) Results for Error Correction Model | ||
| Variables | Coefficient | t-Statistic |
| △ln(CEXP)t-1 | −0.426 | −4.32† |
| △ln(DIP)t-2 | −0.384 | −4.99† |
| △ln(TSPI)t-1 | 0.046 | 2.51* |
| ECt-1 | −0.281 | −2.38* |
| ECt-2 | −0.228 | −2.19* |
| Dummy Var for 1st Quarter | 0.031 | 4.09† |
| Dummy Var for 2nd Quarter | −0.055 | −7.84† |
| Dummy Var for 3rd Quarter | −0.027 | −1.91 |
| Constant | 0.034 | 5.01† |
| R2 | 74.50% | |
| Adjusted R2 | 73.34% | |
| Durbin-Watson stat | 2.10 | |
| (a) Tests for Structure Breaks | Statistics | 5% Critical Values | |
|---|---|---|---|
| Double Maximum Tests | UD max | 250.93 | 8.88 |
| WD max | 252.02 | 9.91 | |
| 250.93 | 8.58 | ||
| 160.82 | 7.22 | ||
| Sup F Tests | 134.08 | 5.96 | |
| 138.06 | 4.99 | ||
| 114.85 | 3.91 | ||
| 250.93 | 8.58 | ||
| 30.58 | 10.13 | ||
| Sequential Sup F Tests | 29.78 | 11.14 | |
| 45.08 | 11.83 | ||
| 7.15 | 12.25 | ||
| # of Breaks | 4 | ||
| (b) Estimates for Parameters | |||
| Periods | Coefficient | 95% CIs | Break Points |
| 1967Q2–1974Q1 | 0.686 | [0.679, 0.692] | ------ |
| 1974Q2–1985Q3 | 0.765 | [0.760, 0.770] | 1974Q2 |
| 1985Q4–1992Q4 | 0.736 | [0.730, 0.743] | 1985Q4 |
| 1993Q1–2006Q4 | 0.772 | [0.767, 0.776] | 1993Q1 |
| 2007Q1–2013Q4 | 0.735 | [0.728, 0.742] | 2007Q1 |
| R2 | 73.91% | ||
| Adjusted R2 | 73.34% | ||
© 2020 by the authors. Licensee MDPI, Basel, Switzerland. This article is an open access article distributed under the terms and conditions of the Creative Commons Attribution (CC BY) license (http://creativecommons.org/licenses/by/4.0/).
Share and Cite
Lin, F.-L.; Chen, W.-Y. Did the Consumption Voucher Scheme Stimulate the Economy? Evidence from Smooth Time-Varying Cointegration Analysis. Sustainability 2020, 12, 4895. https://doi.org/10.3390/su12124895
Lin F-L, Chen W-Y. Did the Consumption Voucher Scheme Stimulate the Economy? Evidence from Smooth Time-Varying Cointegration Analysis. Sustainability. 2020; 12(12):4895. https://doi.org/10.3390/su12124895
Chicago/Turabian StyleLin, Feng-Li, and Wen-Yi Chen. 2020. "Did the Consumption Voucher Scheme Stimulate the Economy? Evidence from Smooth Time-Varying Cointegration Analysis" Sustainability 12, no. 12: 4895. https://doi.org/10.3390/su12124895
APA StyleLin, F.-L., & Chen, W.-Y. (2020). Did the Consumption Voucher Scheme Stimulate the Economy? Evidence from Smooth Time-Varying Cointegration Analysis. Sustainability, 12(12), 4895. https://doi.org/10.3390/su12124895