Article

A Life Cycle Analysis of Deploying Coking Technology to Utilize Low-Rank Coal in China

1
School of Business, Central South University, Changsha 410083, China
2
School of Energy, Power and Mechanical Engineering, North China Electric Power University, Beijing 102206, China
3
School of Economics and Management, North China Electric Power University, Beijing 102206, China
*
Author to whom correspondence should be addressed.
Sustainability 2020, 12(12), 4884; https://doi.org/10.3390/su12124884
Submission received: 12 May 2020 / Revised: 8 June 2020 / Accepted: 10 June 2020 / Published: 15 June 2020

Abstract

:
At present, the excess capacity in China’s coke industry can be deployed to utilize some low-rank coal, replacing coking coal with potential economic gains, energy efficiency, and environmental benefits. This study presents a life cycle analysis to model these potential benefits by comparing a metallurgical coke technical pathway with technical pathways of gasification coke integrated with different chemical productions. The results show that producing gasification coke is a feasible technical pathway for the transformation and development of the coke industry. However, its economic feasibility depends on the price of cokes and coals. The gasification coke production has higher energy consumption and CO2 emissions because of its lower coke yield. Generally speaking, using gasification coke to produce F-T oils has higher economic benefits than producing methanol, but has lower energy efficiency and higher carbon emissions.

1. Introduction

Since the beginning of the new century, the rapid development of China’s urbanization and industrialization has driven the rapid development of the coke industry and the rapid expansion of its domestic coke capacity. China’s coke production totaled 438 million tons in 2018, accounting for over 60% of the world’s total coke production, and China is the world’s largest coke country [1]. From the statistics of coke consumption structure by industry, coke consumption in the steel industry accounts for about 85% of the country’s total coke consumption [1]. However, the steel industry has faced supply-side structural reforms recently in China, which have forced coke companies to reduce capacity under tremendous pressure. On the other hand, there are fewer coking coal resources for producing coke. China has more proven reserves of low-rank coal, with reserves of about 875.73 billion tons, accounting for 59% of proven reserves [2]. Utilizing excess coke capacity, replacing some high-quality coking coal with low-rank coal with large reserves and low cost, and producing gasification coke for the chemical industry will be conducive to the sustainable development of the coke industry [3].
Life cycle analysis (LCA) is an environmental impact assessment analysis tool that is used to evaluate the activity, process, and product. Using LCA, one can study the environmental impact and corresponding energy use throughout the life cycle (LC) of the research object [4]. At present, LCA has been widely used in chemical catalysts [5,6], biofuels [7,8,9], solar energy [10,11], wind energy [12,13], power generation [14,15], and the coal chemical industry [16,17,18]. Among them, using LCA in the coal chemical industry can analyze the coal-based synthetic natural gas (SNG) life cycle (LC) [19,20], coal-to-methanol alternative fuel [21,22,23], and coal to olefins [24,25]. Ou et al. studied fuel consumption and CO2 emission throughout the LC process with a focus on the carbon emissions [26]. Ou et al. used the LCA method to evaluate traditional gasoline fuels, coal-based methanol new vehicle fuels, electric-powered vehicles, and biofuels, and found that fuel consumption and CO2 emission of biofuels were significantly lower than other fuels or energy [27]. Qin et al. used software to study CO2 traces throughout the LC process [28]. Li et al. studied the production process of SNG and power cogeneration [29]. In the research, the fuel consumption and CO2 emission were the key problems. Studies of some research pathways of synthetic natural gas found that synthetic natural gas can reduce fuel consumption and CO2 emission. Based on the above literature, however, no studies specifically investigated coal liquefaction LCA to supply vehicle power.
This paper uses LCA to study the impact and economic potential of coal coking transformation technologies. Some research coal coking pathways are studied in detail for their economic benefits, energy consumption, and CO2 emissions. In Section 2, the modeling details and equations of LCA are introduced. In Section 3, the economy, energy, and environmental performance of some typical research pathways of coal coking are compared. In Section 4, some findings with perspectives are concluded.

2. Mathematic Modeling

Section 2 presents a mathematic modeling coal-coking-related pathways LCA. In this paper, the low-rank coal used was the long flame coal, which came from the Shenfu coalfield in Yulin City, Shaanxi Province. Long flame coal is the bituminous coal with the lowest degree of metamorphism, and its main characteristics are high volatility (volatile on dry ash-free volatile Vdaf > 37%) and no cohesion or weak cohesion (caking index G < 5). In Figure 1, the processes from coal to the final products related to the coal-coking-related pathways are shown. Four parts make up Figure 1. Table 1 and Table 2 list the coal-coking-related research pathways and the input and output of typical metallurgical coking and gasification coking processes.
In order to ensure the fairness of comparison, this paper assumed that the raw coal transportation distance was 50 km and the product transportation distance was 500 km. Therefore, the technical pathway MC in Table 1 can be expressed as: after being mined and washed, the coking coal was transported 50 km by railway to the coking plant and used for production of metallurgical coke and other by-products, then finally transported 500 km to the steel plant in a large truck. Other pathways can also be expressed as such.
Metallurgical and gasification coke production can share the same coke oven, and the production processes are basically similar. The main differences are the characteristics of the incoming coal and various products. Related data of typical metallurgical and chemical gasification coke productions are listed in Table 2 [3,30]. It can be seen that, compared with metallurgical coke production, the coke production of gasification coke is reduced, but the tar, crude benzene, and coke oven gas production are increased.
In particular, it is important to note that the final products of some technical pathways involved in this paper were chemical raw materials, not energy products, so estimating the energy consumption and CO2 emission of products at the end use was not easy. Therefore, the whole life cycle described in this paper was uniformly defined as four stages that ended in the product; that is, the final use of the product was not considered.

2.1. Economic Benefit Analysis

Introducing the net benefit per product (Bp, with the unit Yuan/ton, or USD/ton) as an index for economic analysis:
B p = t b t c m p .
Here, t b and t c represent the total annual economic benefit and total annual economic cost of whole technical pathway, respectively; m p represents the annual amount of product. t b and t c can be calculated as follows:
t b = p m p p p ,
t c = c ( p c + t p c ) m c + C p r o + p C d i s p m p .
Here, m c represents the annual amount of raw coal, p p represents the price of the product; p c and t p c represent the coal price and railway transportation price per ton of coal, respectively; C d i s p is the entire cost per ton of the product in the distribution process; C p r o represents the total annual cost in the process of production, calculated as
C p r o = T C C p r o ε + A O M C p r o ,
with
ε = 1 1 ( 1 + i ) n ,
A O M C p r o = V O M C p r o + F O M C p r o = ( α V + α F ) T C C p r o ε .
Here, T C C p r o represents the entire capital cost; ε represents the capital recovery factor; A O M C p r o represents the annual operation and maintenance cost, composed of the annual variable operation and maintenance cost ( V O M C p r o ) and the annual fixed operation and maintenance cost, which can be obtained by multiplying the annual T C C p r o by empirical coefficients α V and α F , respectively. C d i s p can be calculated as C p r o , and bypassed here. t p c , according to the announcement of the China railway transportation company, can be calculated as follows:
t p c = t p a + t p b L c .
Here, t p a and t p b both represent transportation prices; L c represents the transportation distance of raw coal.
Table 3 shows the key parameters for the economic analysis.

2.2. Life Cycle Energy Consumption Analysis

The energy consumption (Ep, with the unit MJ/ton) of a given technology pathway in the life cycle energy analysis is introduced in this paper as follows:
E p = t e c m p .
Here, t e c is the total amount of input primary energy, and the calculation equation is written as follows:
t e c = e c m i n + e c t r a + e c p r o + e c d i s .
Here, e c m i n ,     e c t r a ,   e c p r o ,   and   e c d i s represent the energy consumptions of the four processes of coal mining, coal transportation, production, and distribution, respectively. Due to the energy consumption calculation of each process being very similar, we take the calculation of e c p r o as an example:
e c p r o = P E e c p r o + S E e c p r o + M C e c p r o ,
with
S E e c p r o = i S E e c p r o i η i   ( i = e l e c t r i c i t y , d i e s e l ,   e t c . ) ,
M C e c p r o = j [ M C p r o j ( m e c j + m r e c j ) ] + E F B e c p r o + E F B R e c p r o   ( j = steel ,   cement ,   etc . )
where P E e c p r o and S E e c p r o i are the direct primary energy and direct secondary energy consumptions per unit of product in the technical pathway, respectively; η i is the energy transformation efficiency during the secondary energy production; M C p r o j is the material consumption in the technical pathways; m e c j and m r e c j represent the energy consumption per unit of material in the production process and the aforementioned material recycling process, respectively; similarly, E F B e c p r o and E F B R e c p r o represent the energy consumption per unit of product in the course of the equipment/factory construction and recycling, respectively.
The main parameters of the economic benefit analysis in this paper are listed in Table 4.

2.3. Life Cycle CO2 Emissions Analysis

In this section, CO2 emissions per product (CEp, with the unit ton/ton) of the given technology pathway in the life cycle environmental analysis is introduced as follows:
E C p = t c e m p .
Here, t c e represents the total amount of CO2 emissions. Its calculation method is similar to t e c , which is composed of the same aforementioned four parts, and it can be calculated as follows:
t c e = c e m i n + c e t r a + c e p r o + c e d i s .
For example, c e p r o can be calculated as follows:
c e p r o = P E c e p r o + S E c e p r o + M C c e p r o ,
with
S E c e p r o = j [ S E W p r o i ( d c e i + i c e i ) ]   ( i = electricity ,   diesel ,   etc . ) ,
M C c e p r o = j [ M C p r o j ( m c e j + m r c e j ) ] + C c e p r o + C R c e p r o   ( j = steel ,   cement ,   etc . ) ,
where, P E c e p r o and S E c e p r o are the direct CO2 emissions per unit of product of the primary energy and the indirect CO2 emissions from the secondary energy in the technical pathway, respectively. d c e i and i c e i represent the direct and indirect CO2 emissions in its energy production; M C c e p r o represents the indirect CO2 emissions per unit of product from material (such as steel, cement) consumption in the technical pathways; m c e j and m r c e j represent the CO2 emissions per unit of material in the process of material production and recycling, respectively; C c e p r o and C R c e p r o represent the CO2 emissions due to equipment/factory construction and the recovery process.
The main parameters that are applied to compute direct CO2 emissions are listed in Table 5.

3. Results and Discussion

The life cycle analyses of different technical pathways of coal coking are introduced and analyzed. The four technical pathways are divided into two categories: the product of both MC and GC is coke, and GC-M and GC-O are extensions of the gasification coke product chain.

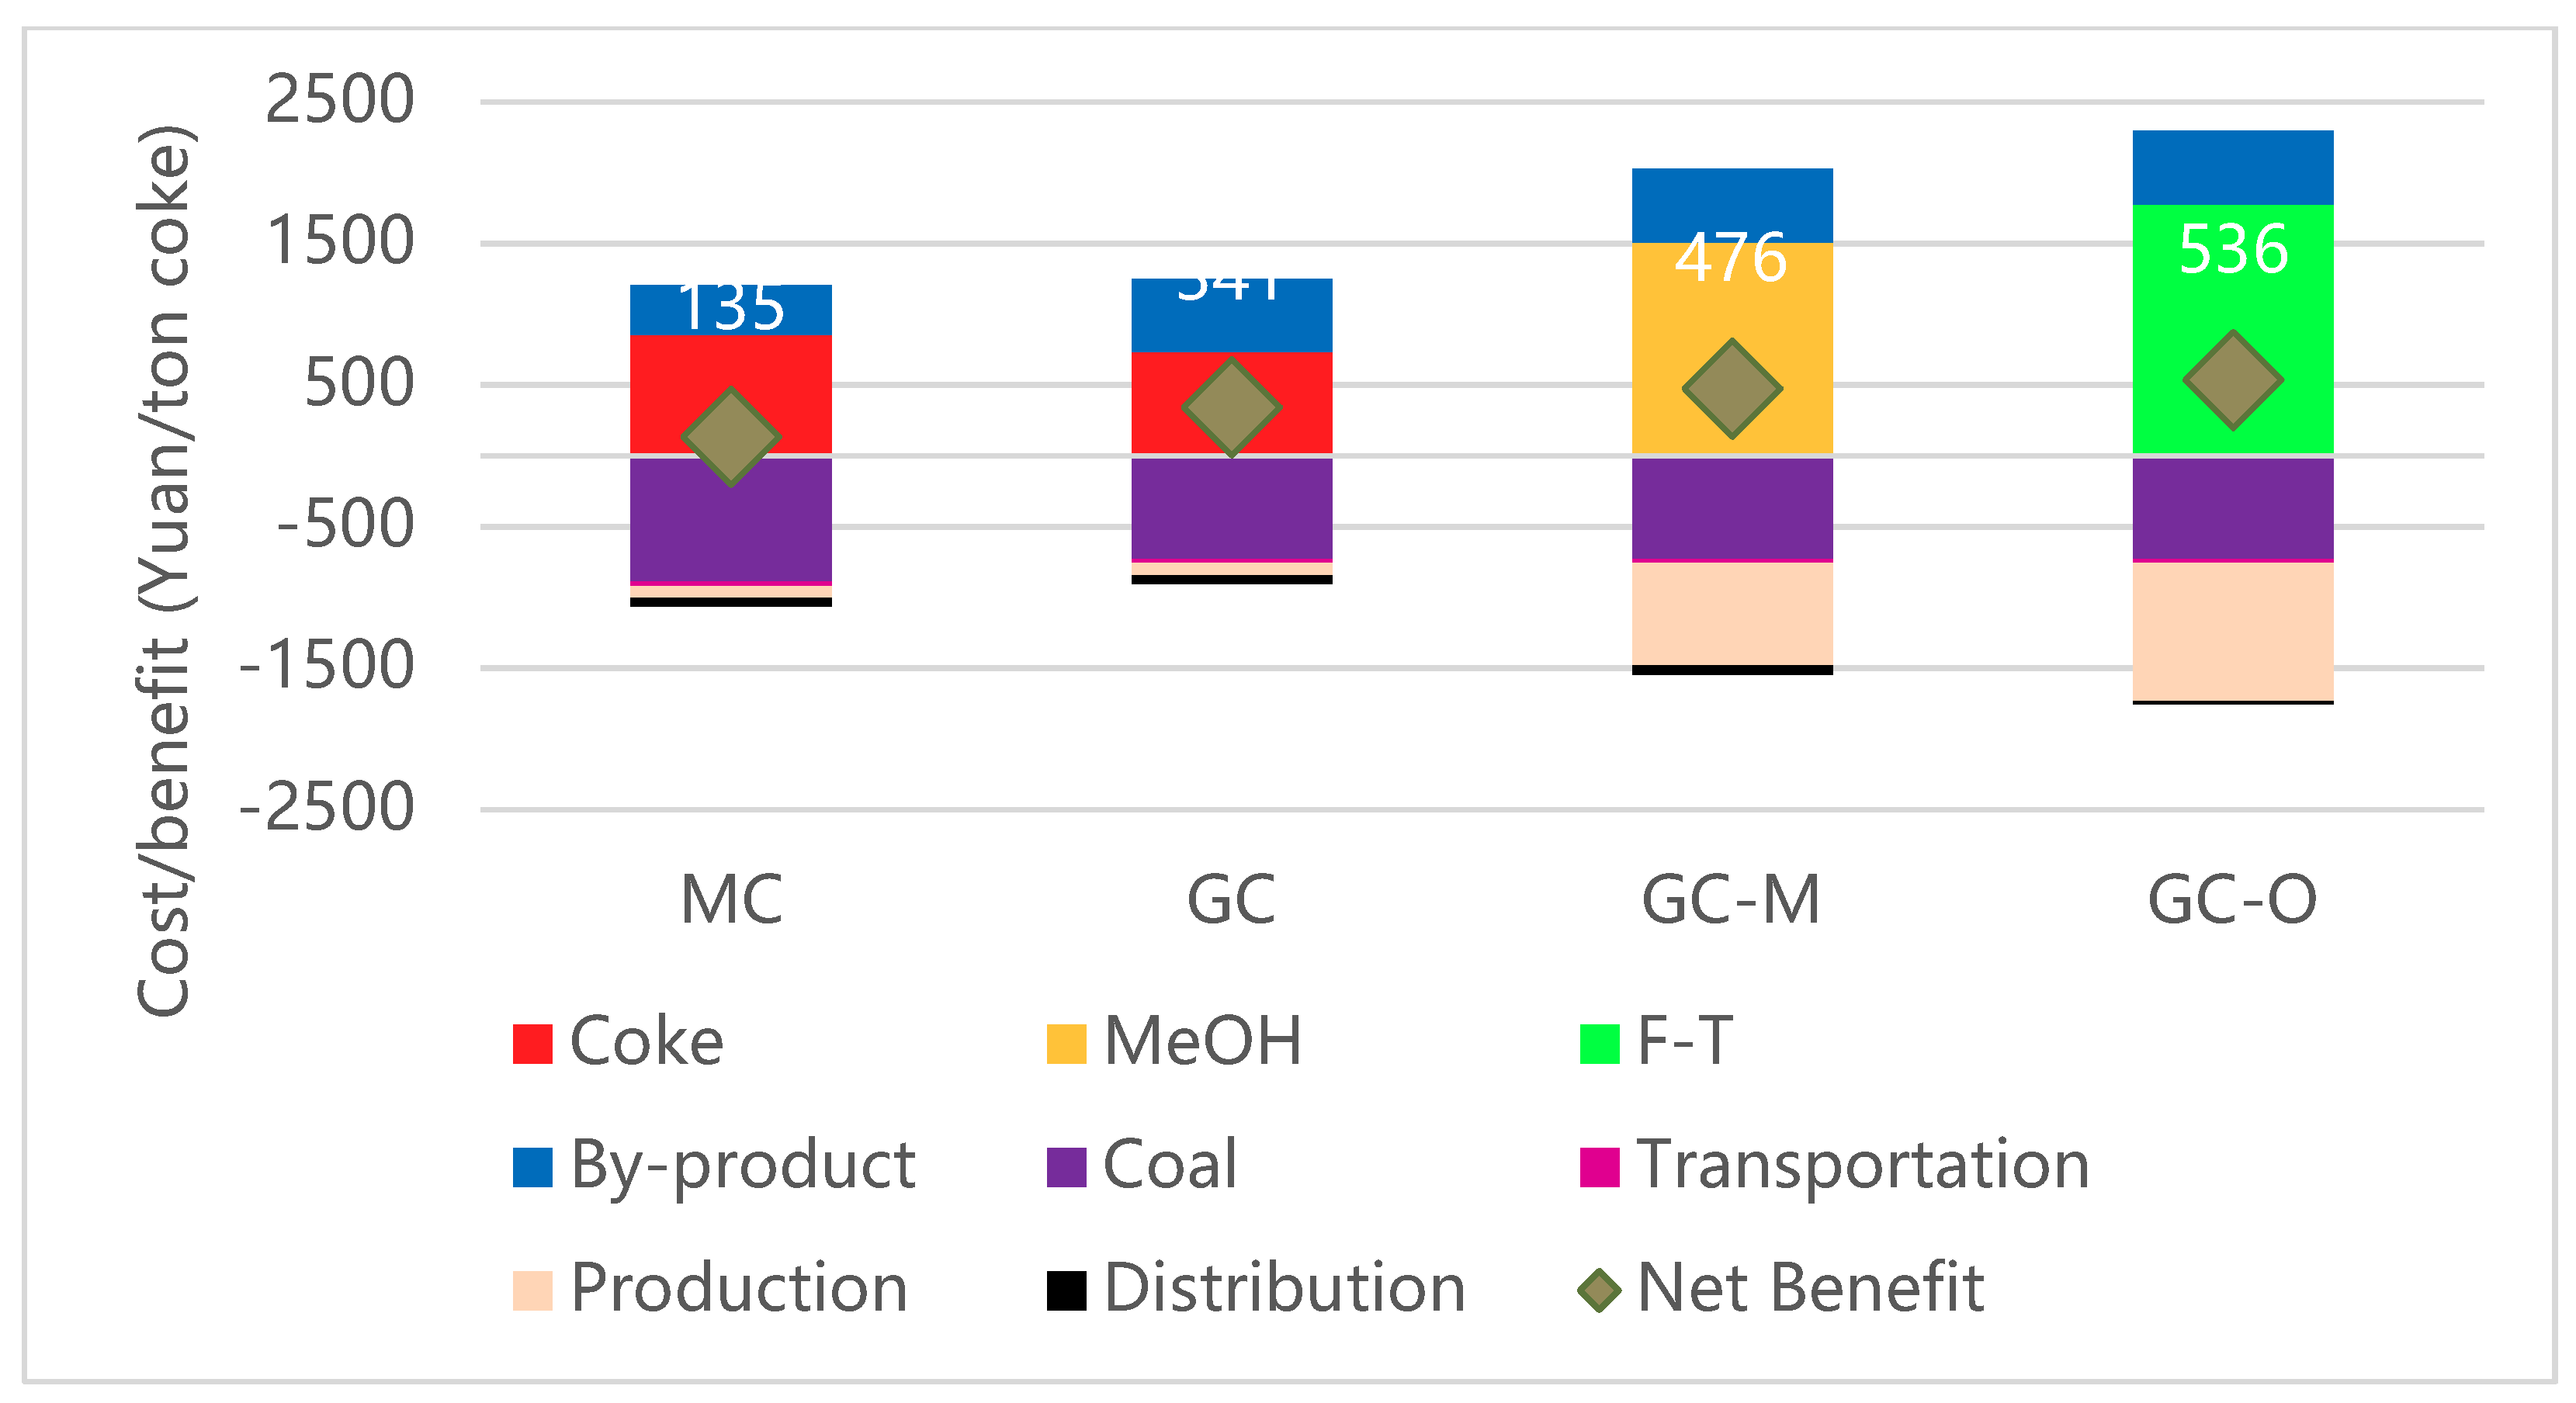
3.1. Economic Benefit Analysis

Figure 2 shows the economic costs and benefits of the four technical pathways. In Figure 2, positive values are benefits, mainly from sales of the main products (coke, methanol, or oil products) and by-products (tar, benzene, coke oven gas, etc.); negative values are costs, which include mainly four parts: raw coal purchase cost, raw coal transportation cost, production cost, and product transportation cost; the red diamonds and values represent the net benefits. In Figure 2, Figure 3 and Figure 4, the unit selected is the Yuan, and the exchange rate between the Yuan and the US dollar is shown in Table 3. Therefore, only the Yuan is used in Figure 2, Figure 3 and Figure 4. Comparing the metallurgical coke and gasification coke pathways according to Figure 2, the coke yield of the gasification coke pathway was lower than that of the metallurgical coke pathway, according to the perspective of benefit comparison analysis. This was because the gasification coke pathway had a lower coke yield and price than the metallurgical coke pathway, but its by-product benefits were significantly higher than the metallurgical coke pathway, because of its higher by-product yield (seen in Table 2). From the cost comparison of these two pathways, gasification coke was significantly lower than metallurgical coke because gasification coke production used some low-cost and low-rank coal. From the perspective of net benefit comparison, the gasification coke pathway was higher than the metallurgical coke pathway, which showed that the use of coke production capacity and the addition of low-rank coal to produce gasification coke had a certain economic value.
We compared two coke pathways with two gasification coke-derived technical pathways (GC-M and GC-O). The yield of the main products of the latter two pathways was significantly higher than that of the two coke pathways. This was because the price of the product after derived chemical processing was much higher than the price of coke. After derived chemical processing, however, the production cost of the latter two pathways was much higher than the two coke pathways. From the perspective of net benefit, for the unit of coke production the net benefit of the latter two technical pathways was higher than that of the two coke pathways, indicating that it was of economic value to carry out deep processing of chemical products based on gasification coke.

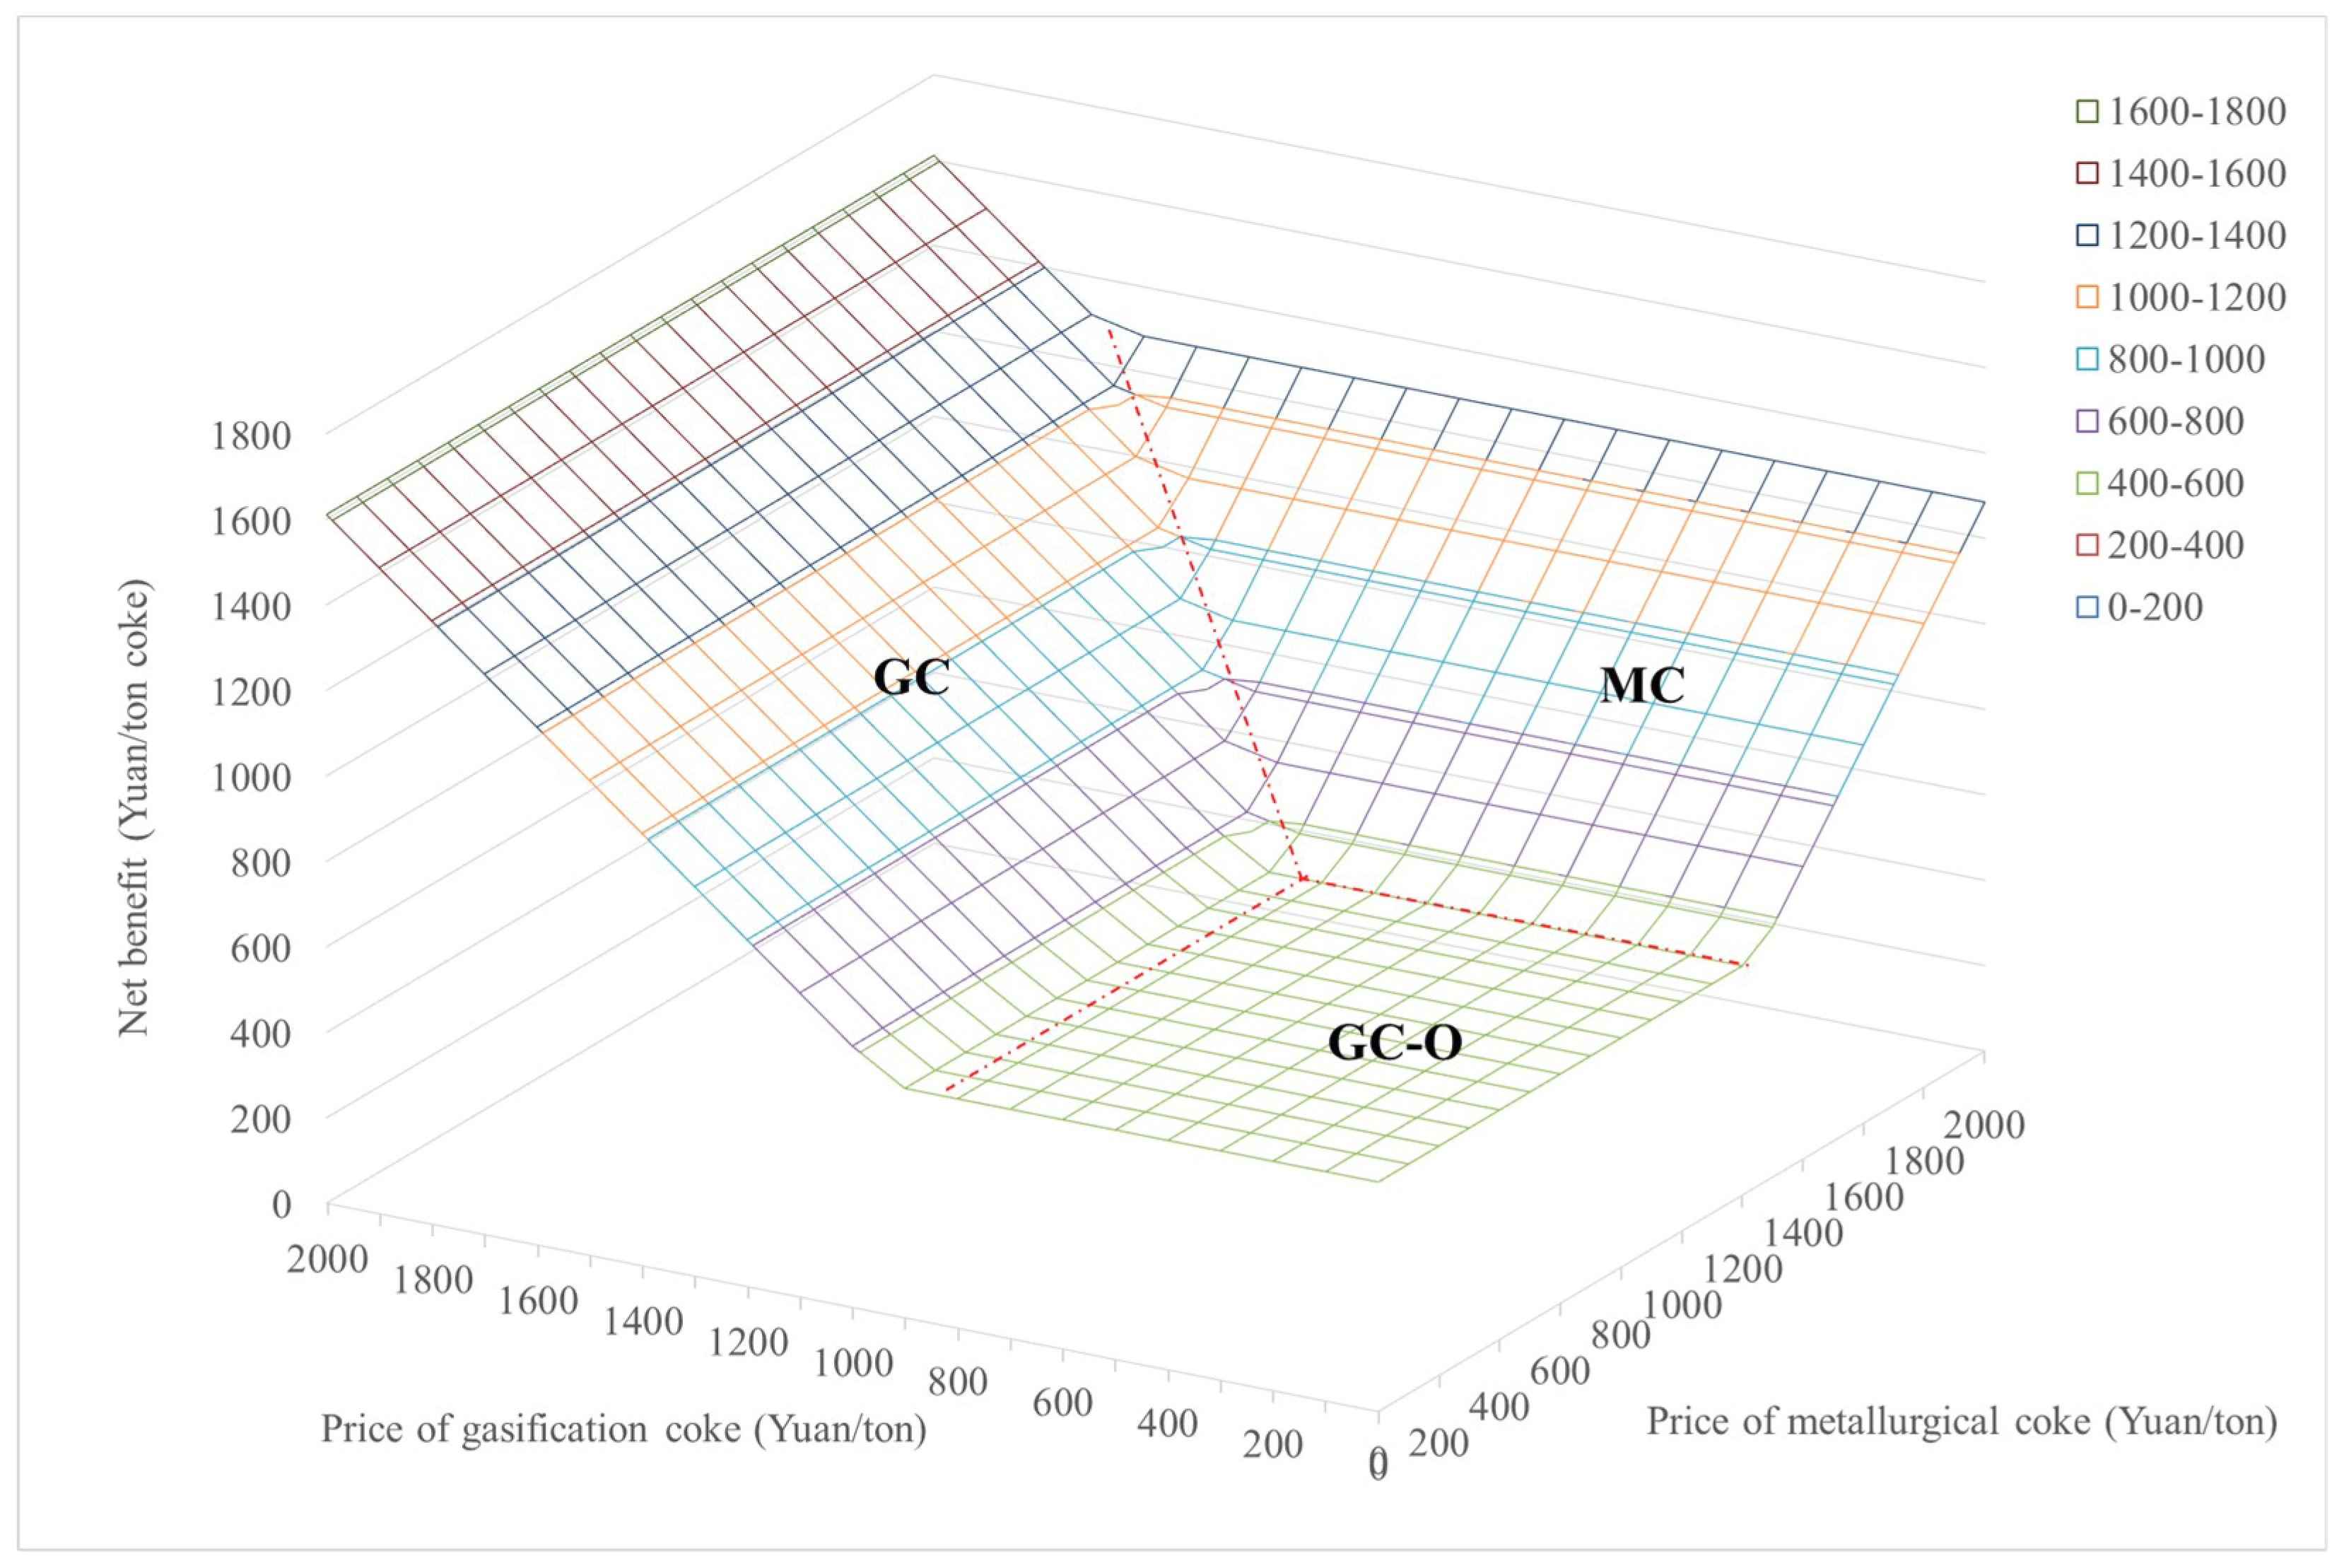
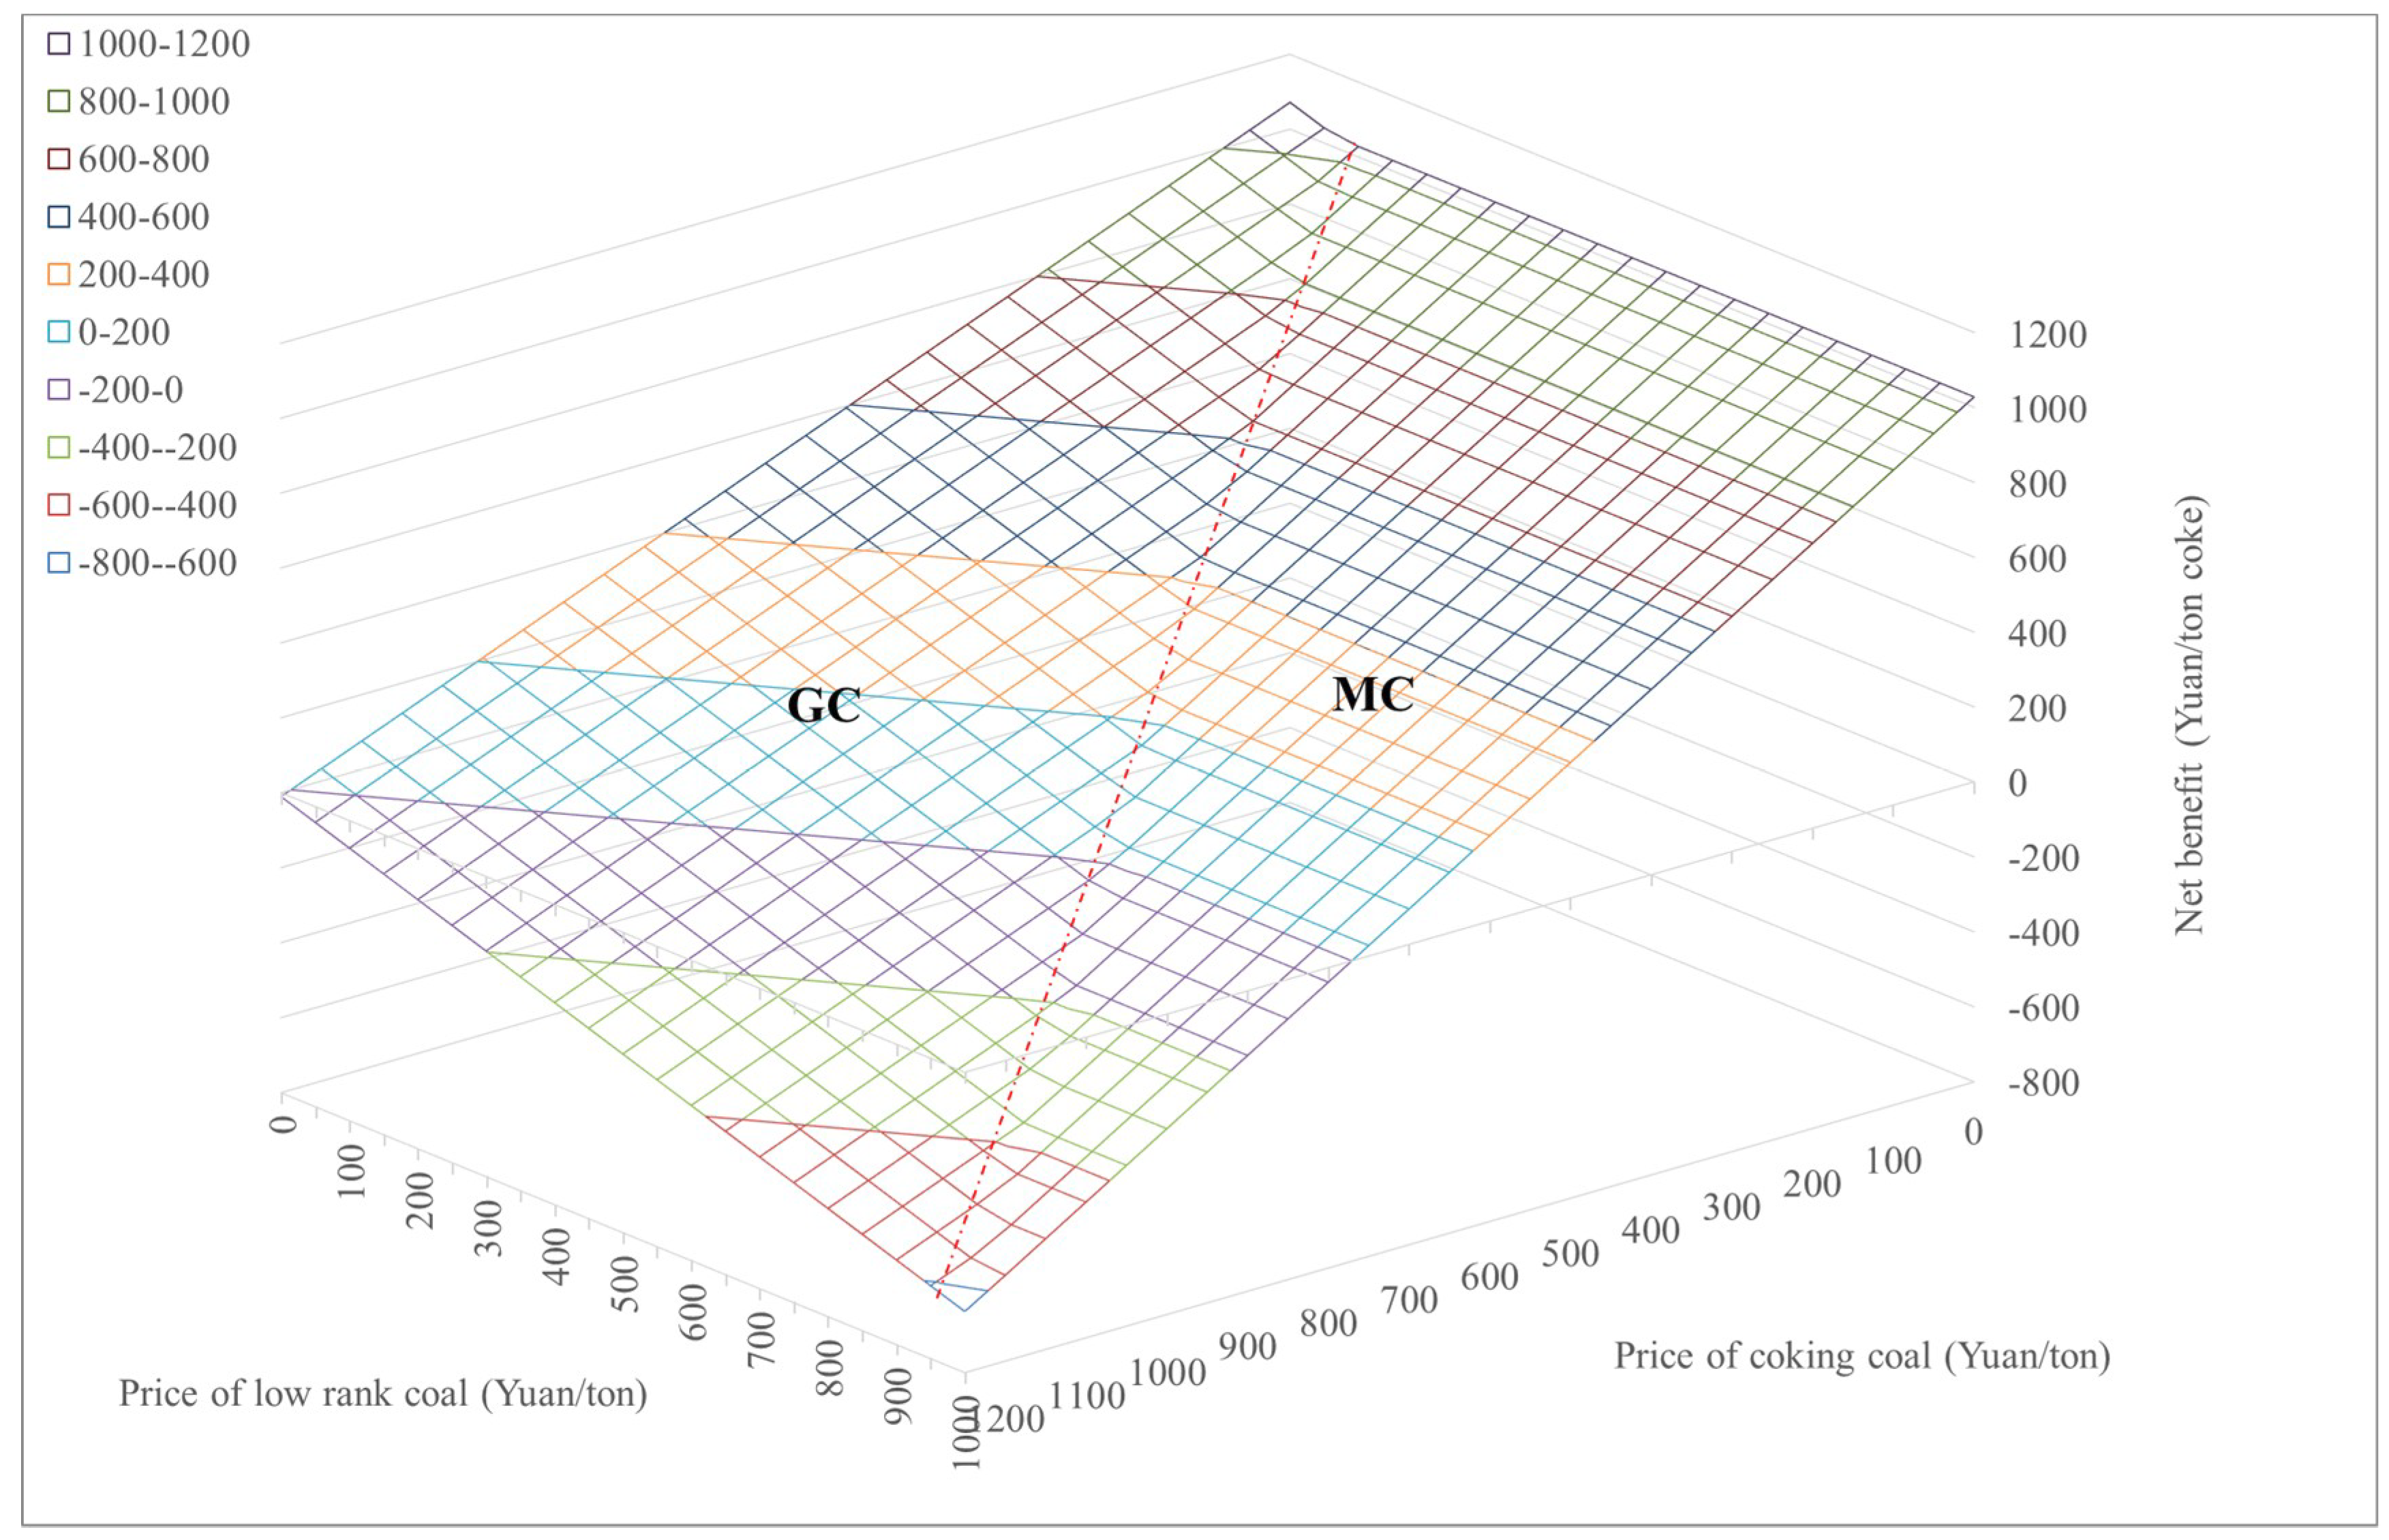
3.2. Sensitive Study of Economic Analysis

The results of the economic analysis largely depended on the prices of the products. For the above four technical pathways, the prices of cokes and raw coals were important parameters affecting the net benefit of each technical pathway.
If the price of raw coal and other conditions remain the same, the selection of the optimal technical pathway for different metallurgical and gaseous coke prices is shown in Figure 3. If the price of gasification coke is less than 900 Yuan/ton (127.66 USD/ton), and the price of metallurgical coke is less than 1200 Yuan/ton (170.21 USD/ton), the production of gasification coke coupled with a chemical process such as F-T will have the largest net benefit. If the price of metallurgical coke is higher than 1200 Yuan/ton (170.21 USD/ton), and, consequently, 300 Yuan/ton (42.55 USD/ton) higher than the price of gasification coke, the production of metallurgical coke will have a large net benefit. If the price of gasification coke is higher than 900 Yuan/ton (127.66 USD/ton), and not lower than the price of metallurgical coke by more than 300 Yuan/ton (42.55 USD/ton), the production of gasification coke will have a higher net benefit.
If the price of coke and other conditions remain unchanged, only the prices of coking coal and low-rank coal change, without considering the two chemical coke deep processing technical pathways (GC-M, GC-O, whose coal purchase costs were the same as GC pathways). The net benefit of the coke pathway is shown in Figure 4. It can be seen from Figure 4 that the net benefit of the two coke pathways has a significant impact on the prices of raw coals, and when the coal price reaches a certain level, the net benefits of both pathways will be negative. By fitting the red dashed line in Figure 4 an inequality can be obtained, which is shown as Equation (18):
B G C > B M C                         ( p c c > 1.34 × p l r c 113 ) .
For Equation (18), the unit is Yuan/ton. According to the exchange rate between the Yuan and the US dollar shown in Table 3, the equation for unit USD/ton can be obtained. That is, if the price of coking coal p c c is higher than ( 1.34 × p l r c 113 ) , the gasification coke pathway has more economic advantages. If the contrary, the coking coal technical pathway has more economic advantages.

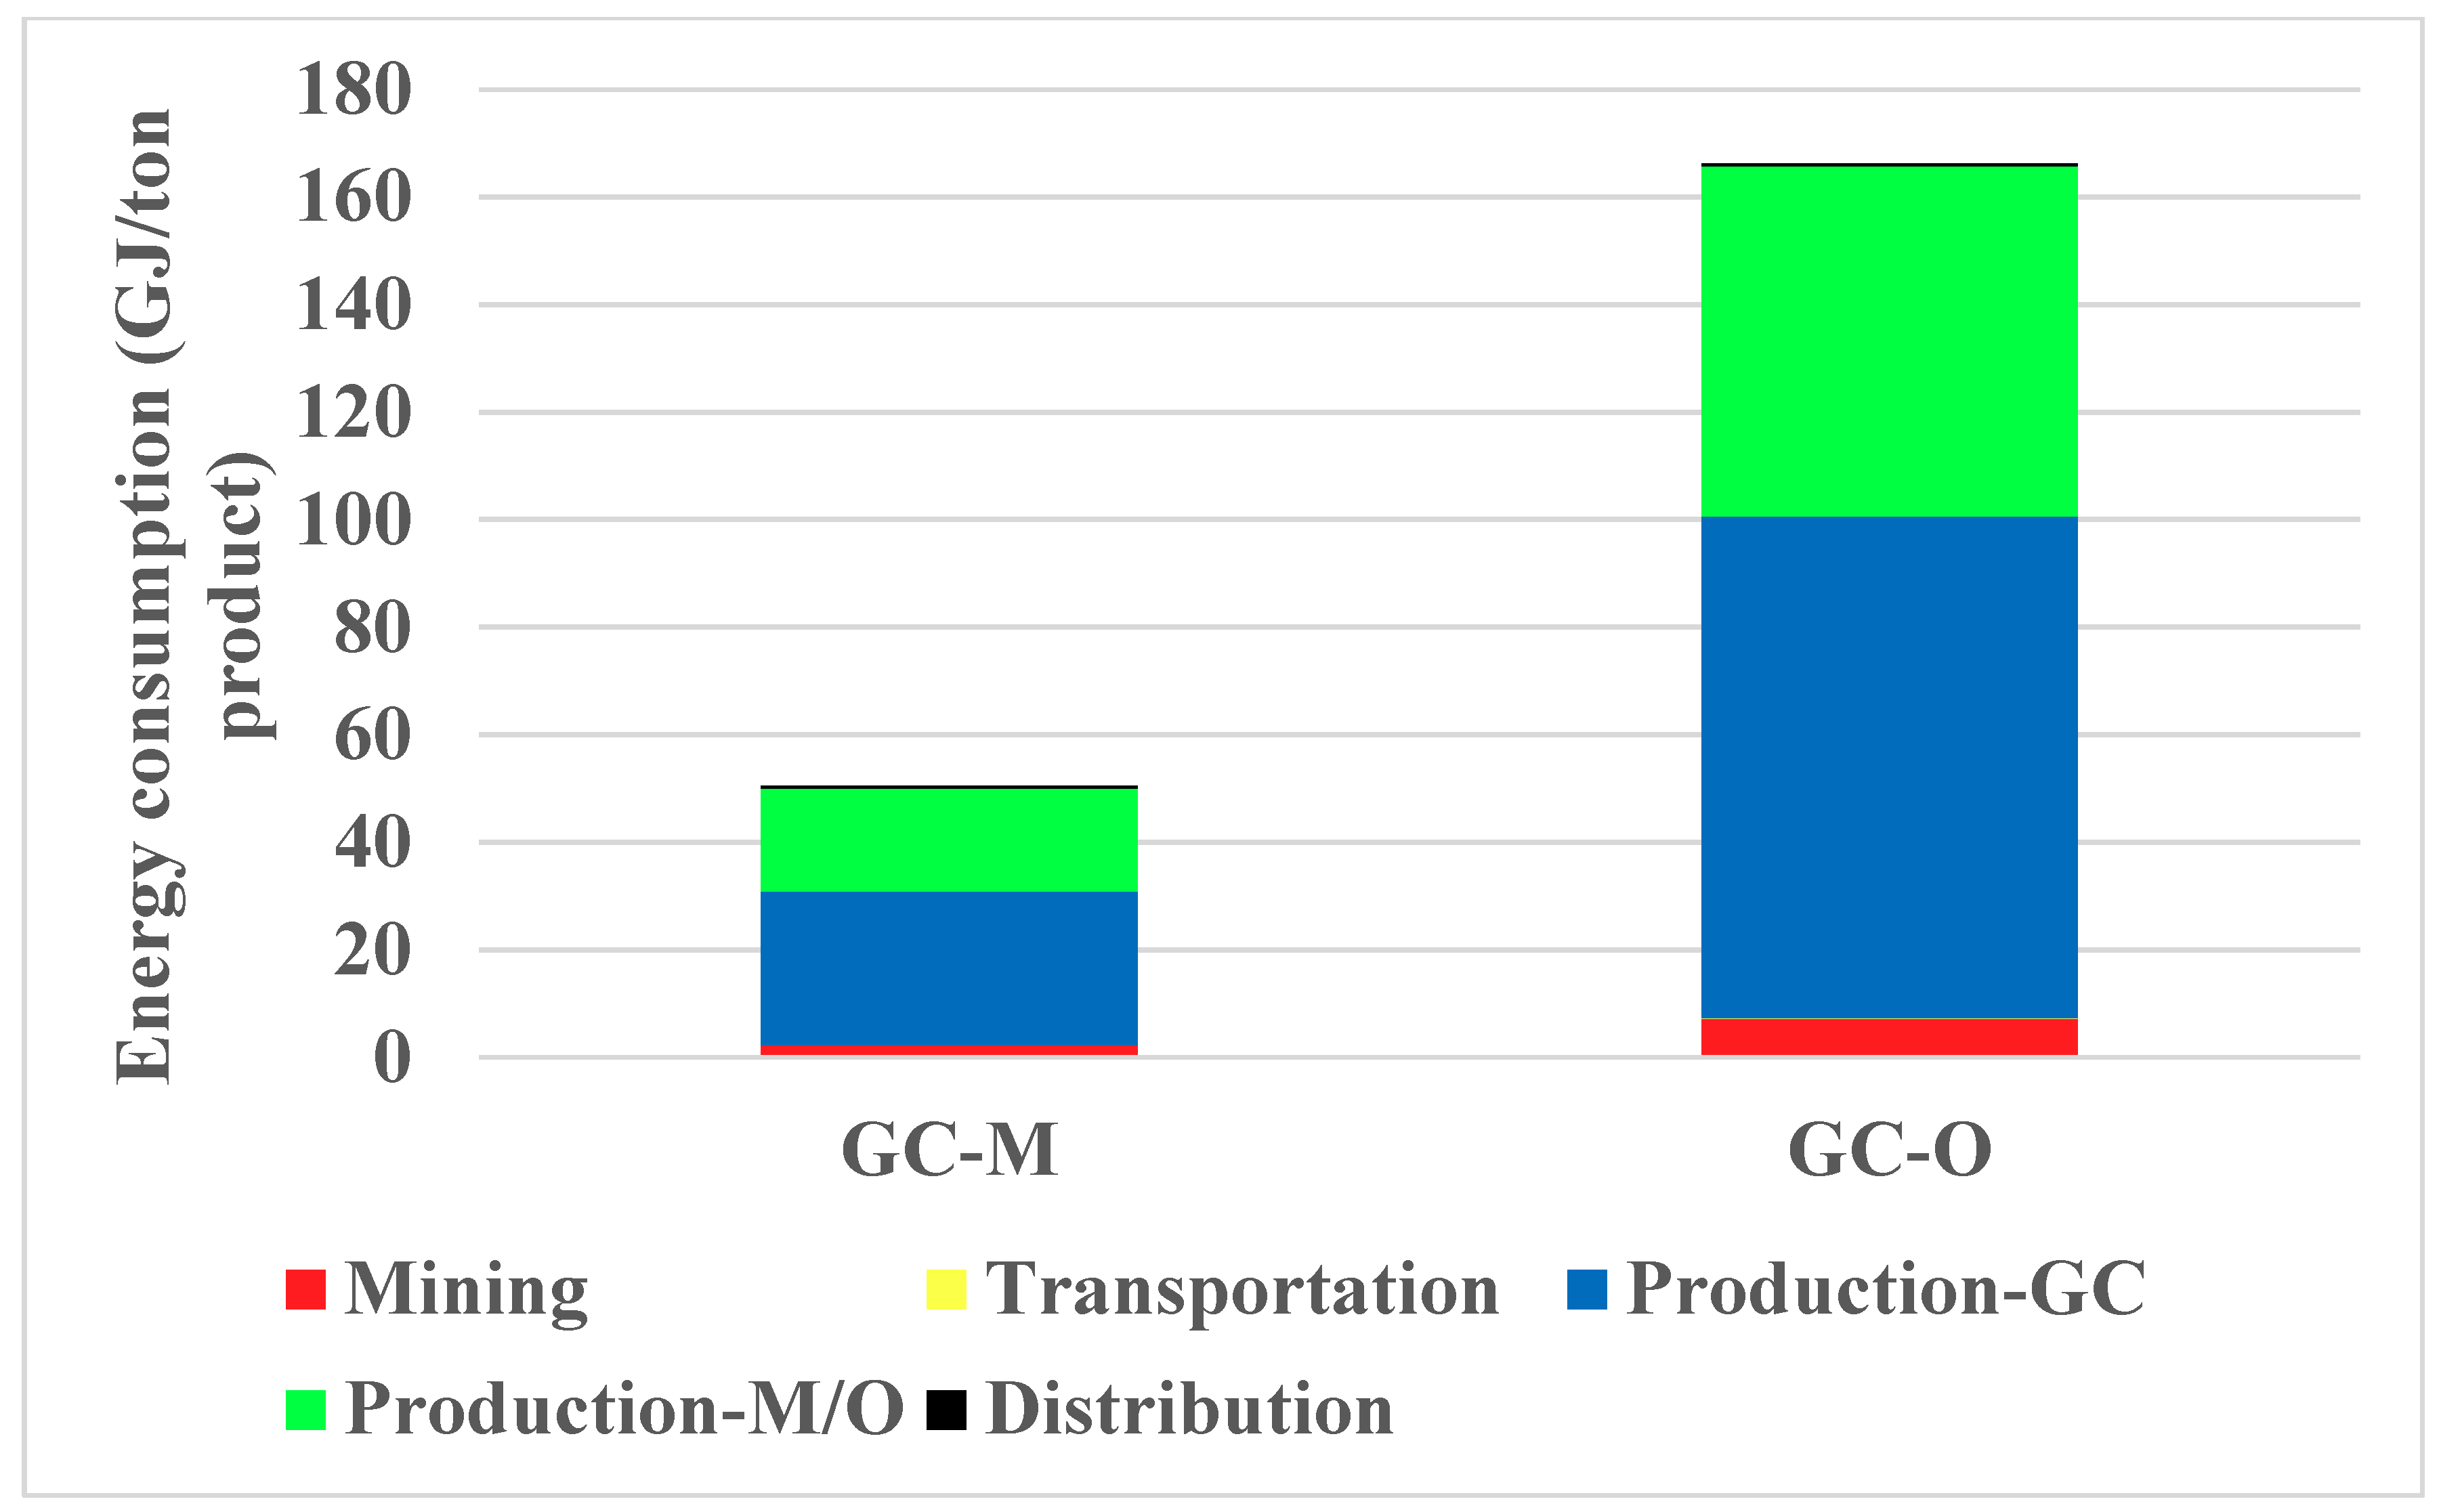
3.3. Life Cycle Energy Analysis

The life cycle energy consumptions of different technical pathways in two categories were analyzed and compared. Figure 5 shows the full life cycle energy consumptions of two coke technical pathways. According to Figure 5, of the four stages, the production phase accounted for the vast majority of the total energy consumption in the life cycle (about 90%). The energy consumption for raw coal mining, washing, and product transportation was relatively small, and the energy consumption for raw coal transportation can be ignored. The energy consumption of the coking pathway was about 25% higher than that of the metallurgical coke pathway, which was mainly because the coke yield of the gasification coke was lower than that of the metallurgical coke.
Figure 6 shows the life cycle energy consumptions of two gasification coke coupled chemical process technical pathways (GC-M and GC-O). To show the energy consumption of the production process more clearly, Figure 6 divides the production process into two parts: the gasification coke production process and the chemical production process. In Figure 6, of the five stages, the energy consumption of the gasification coke production phase accounted for about 56% of the total energy consumption, the chemical process energy consumption accounted for more than 37%, and the other process energy consumption was relatively small.
In terms of energy consumption of per ton of product, GC-O was much higher than GC-M. Since both methanol and F-T oil can be used as energy products, the energy consumption per unit of heat value of both fuels could be compared. Figure 7 shows the comparison of energy consumptions and efficiencies between the GC-M and GC-O pathways. According to Figure 7, the full life cycle energy efficiency of the GC-M technical pathway was about 31%, and that of the GC-O pathway was about 21%.

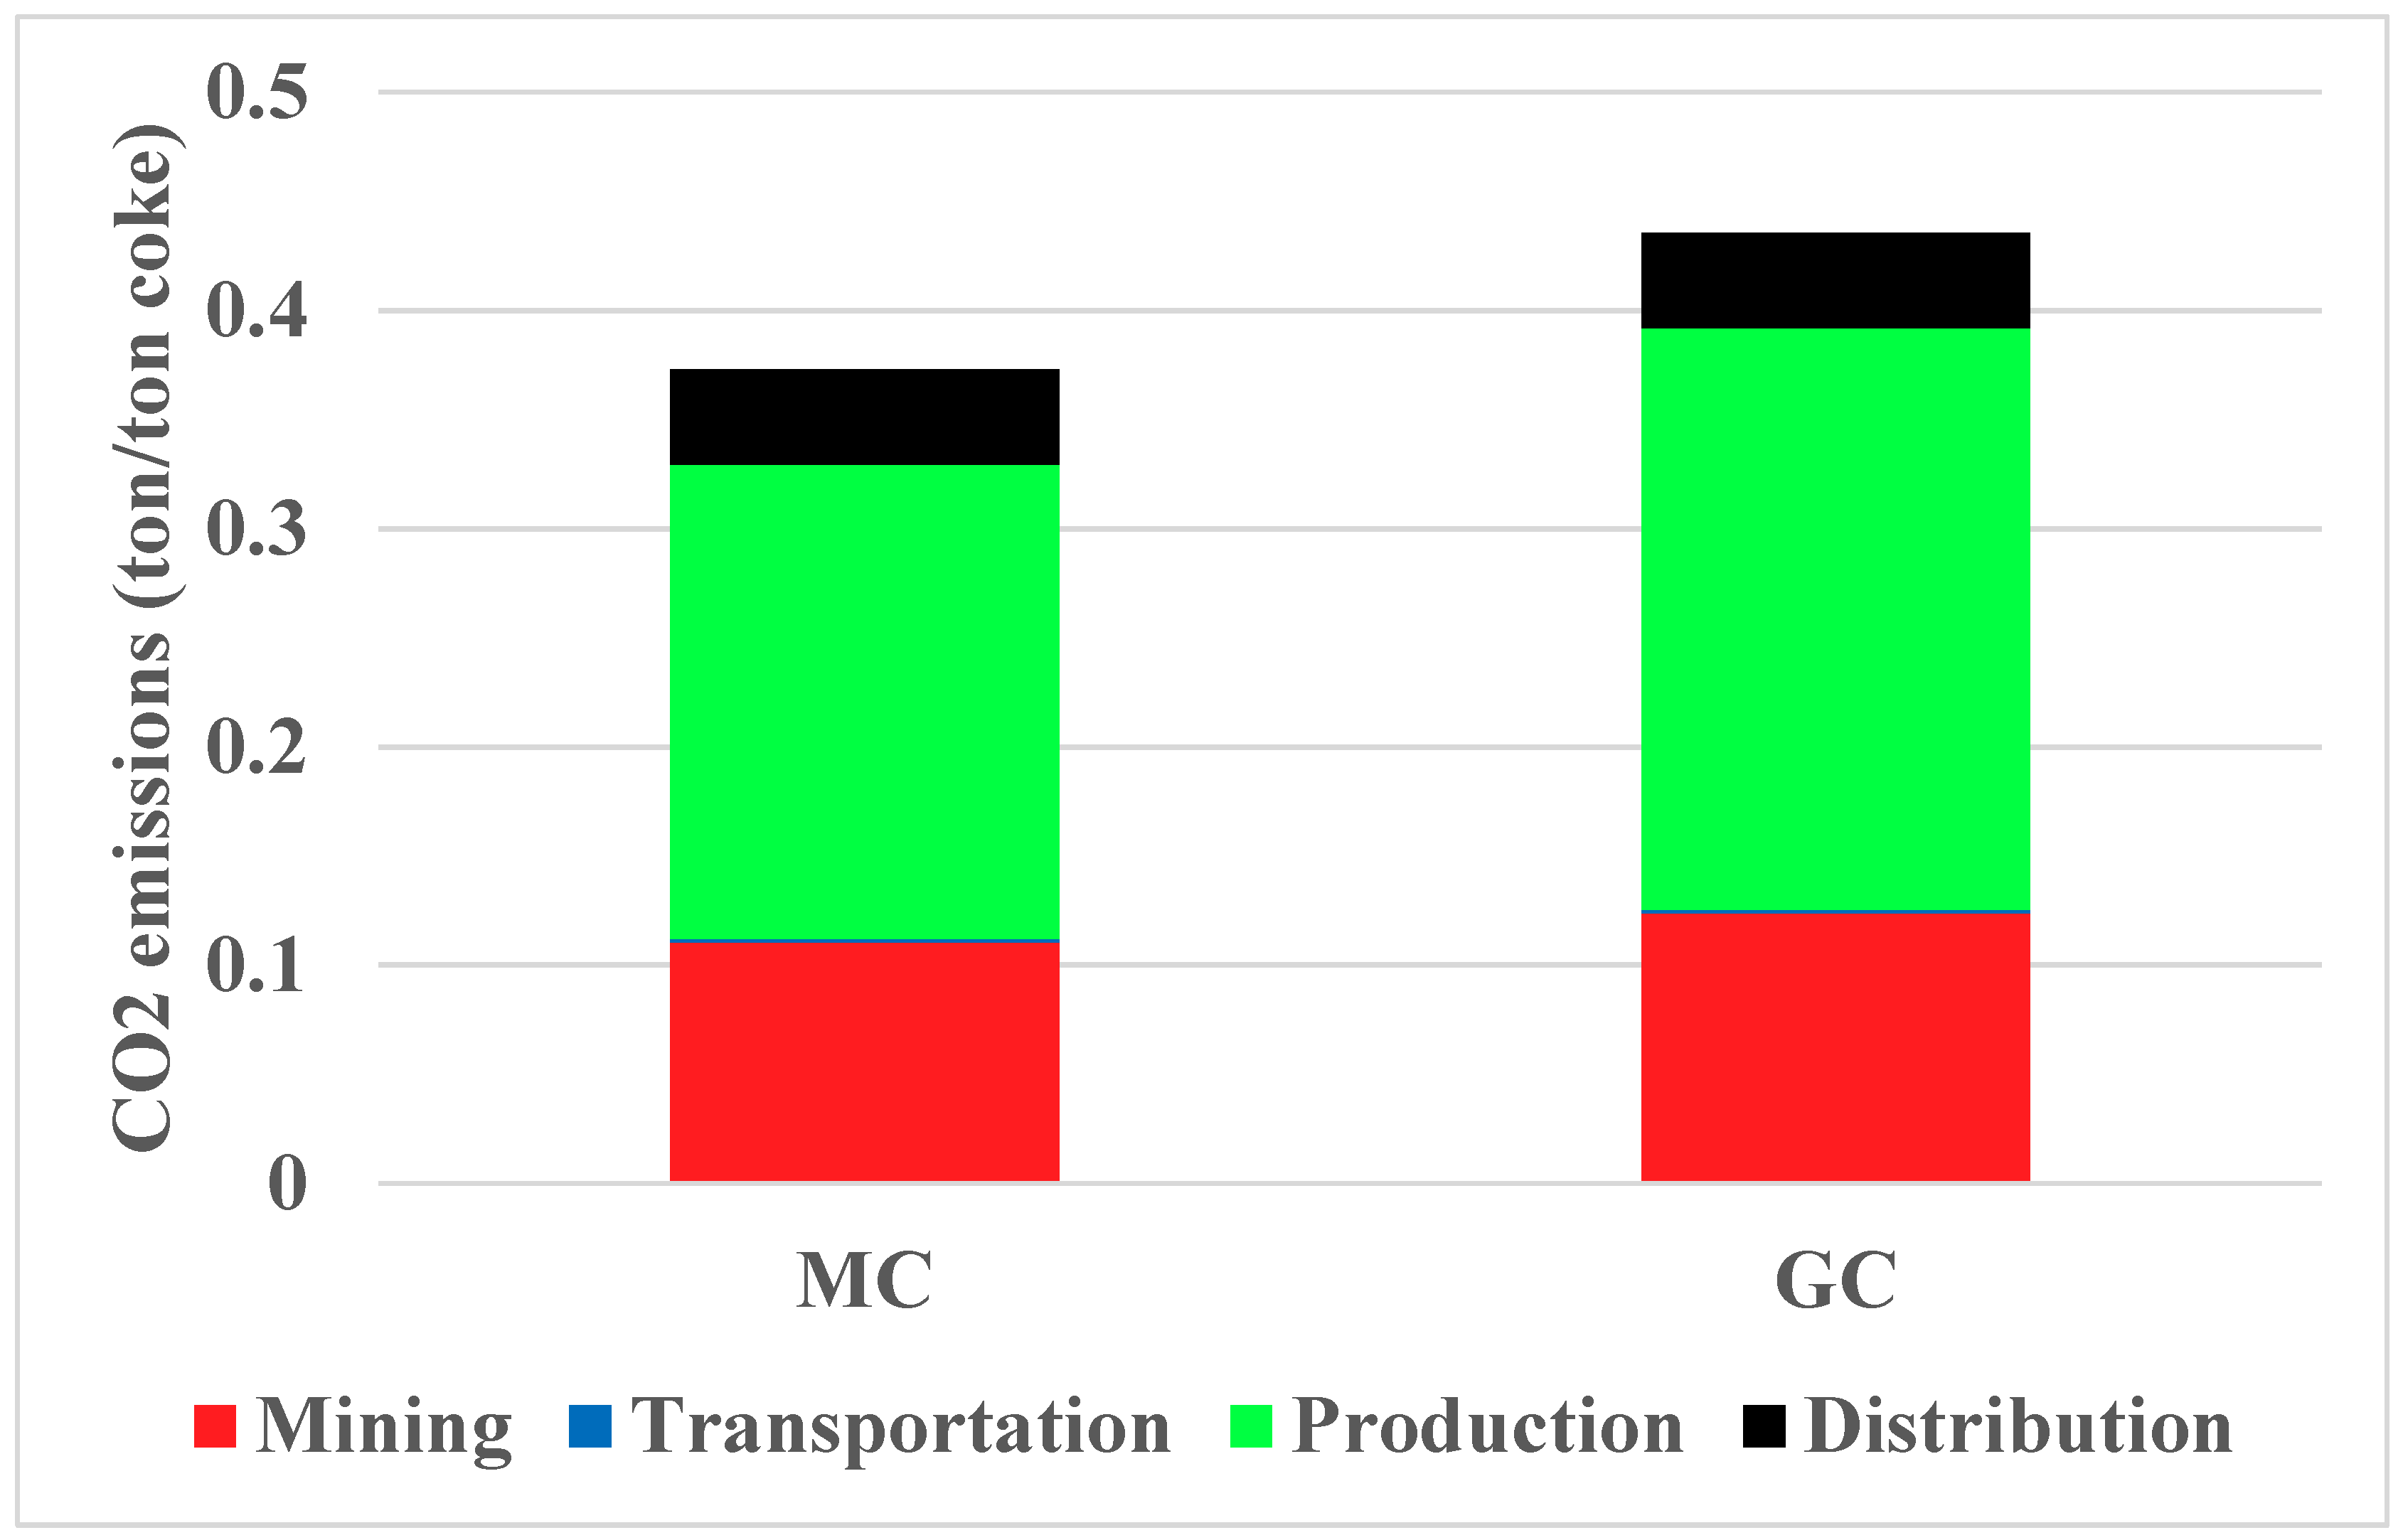
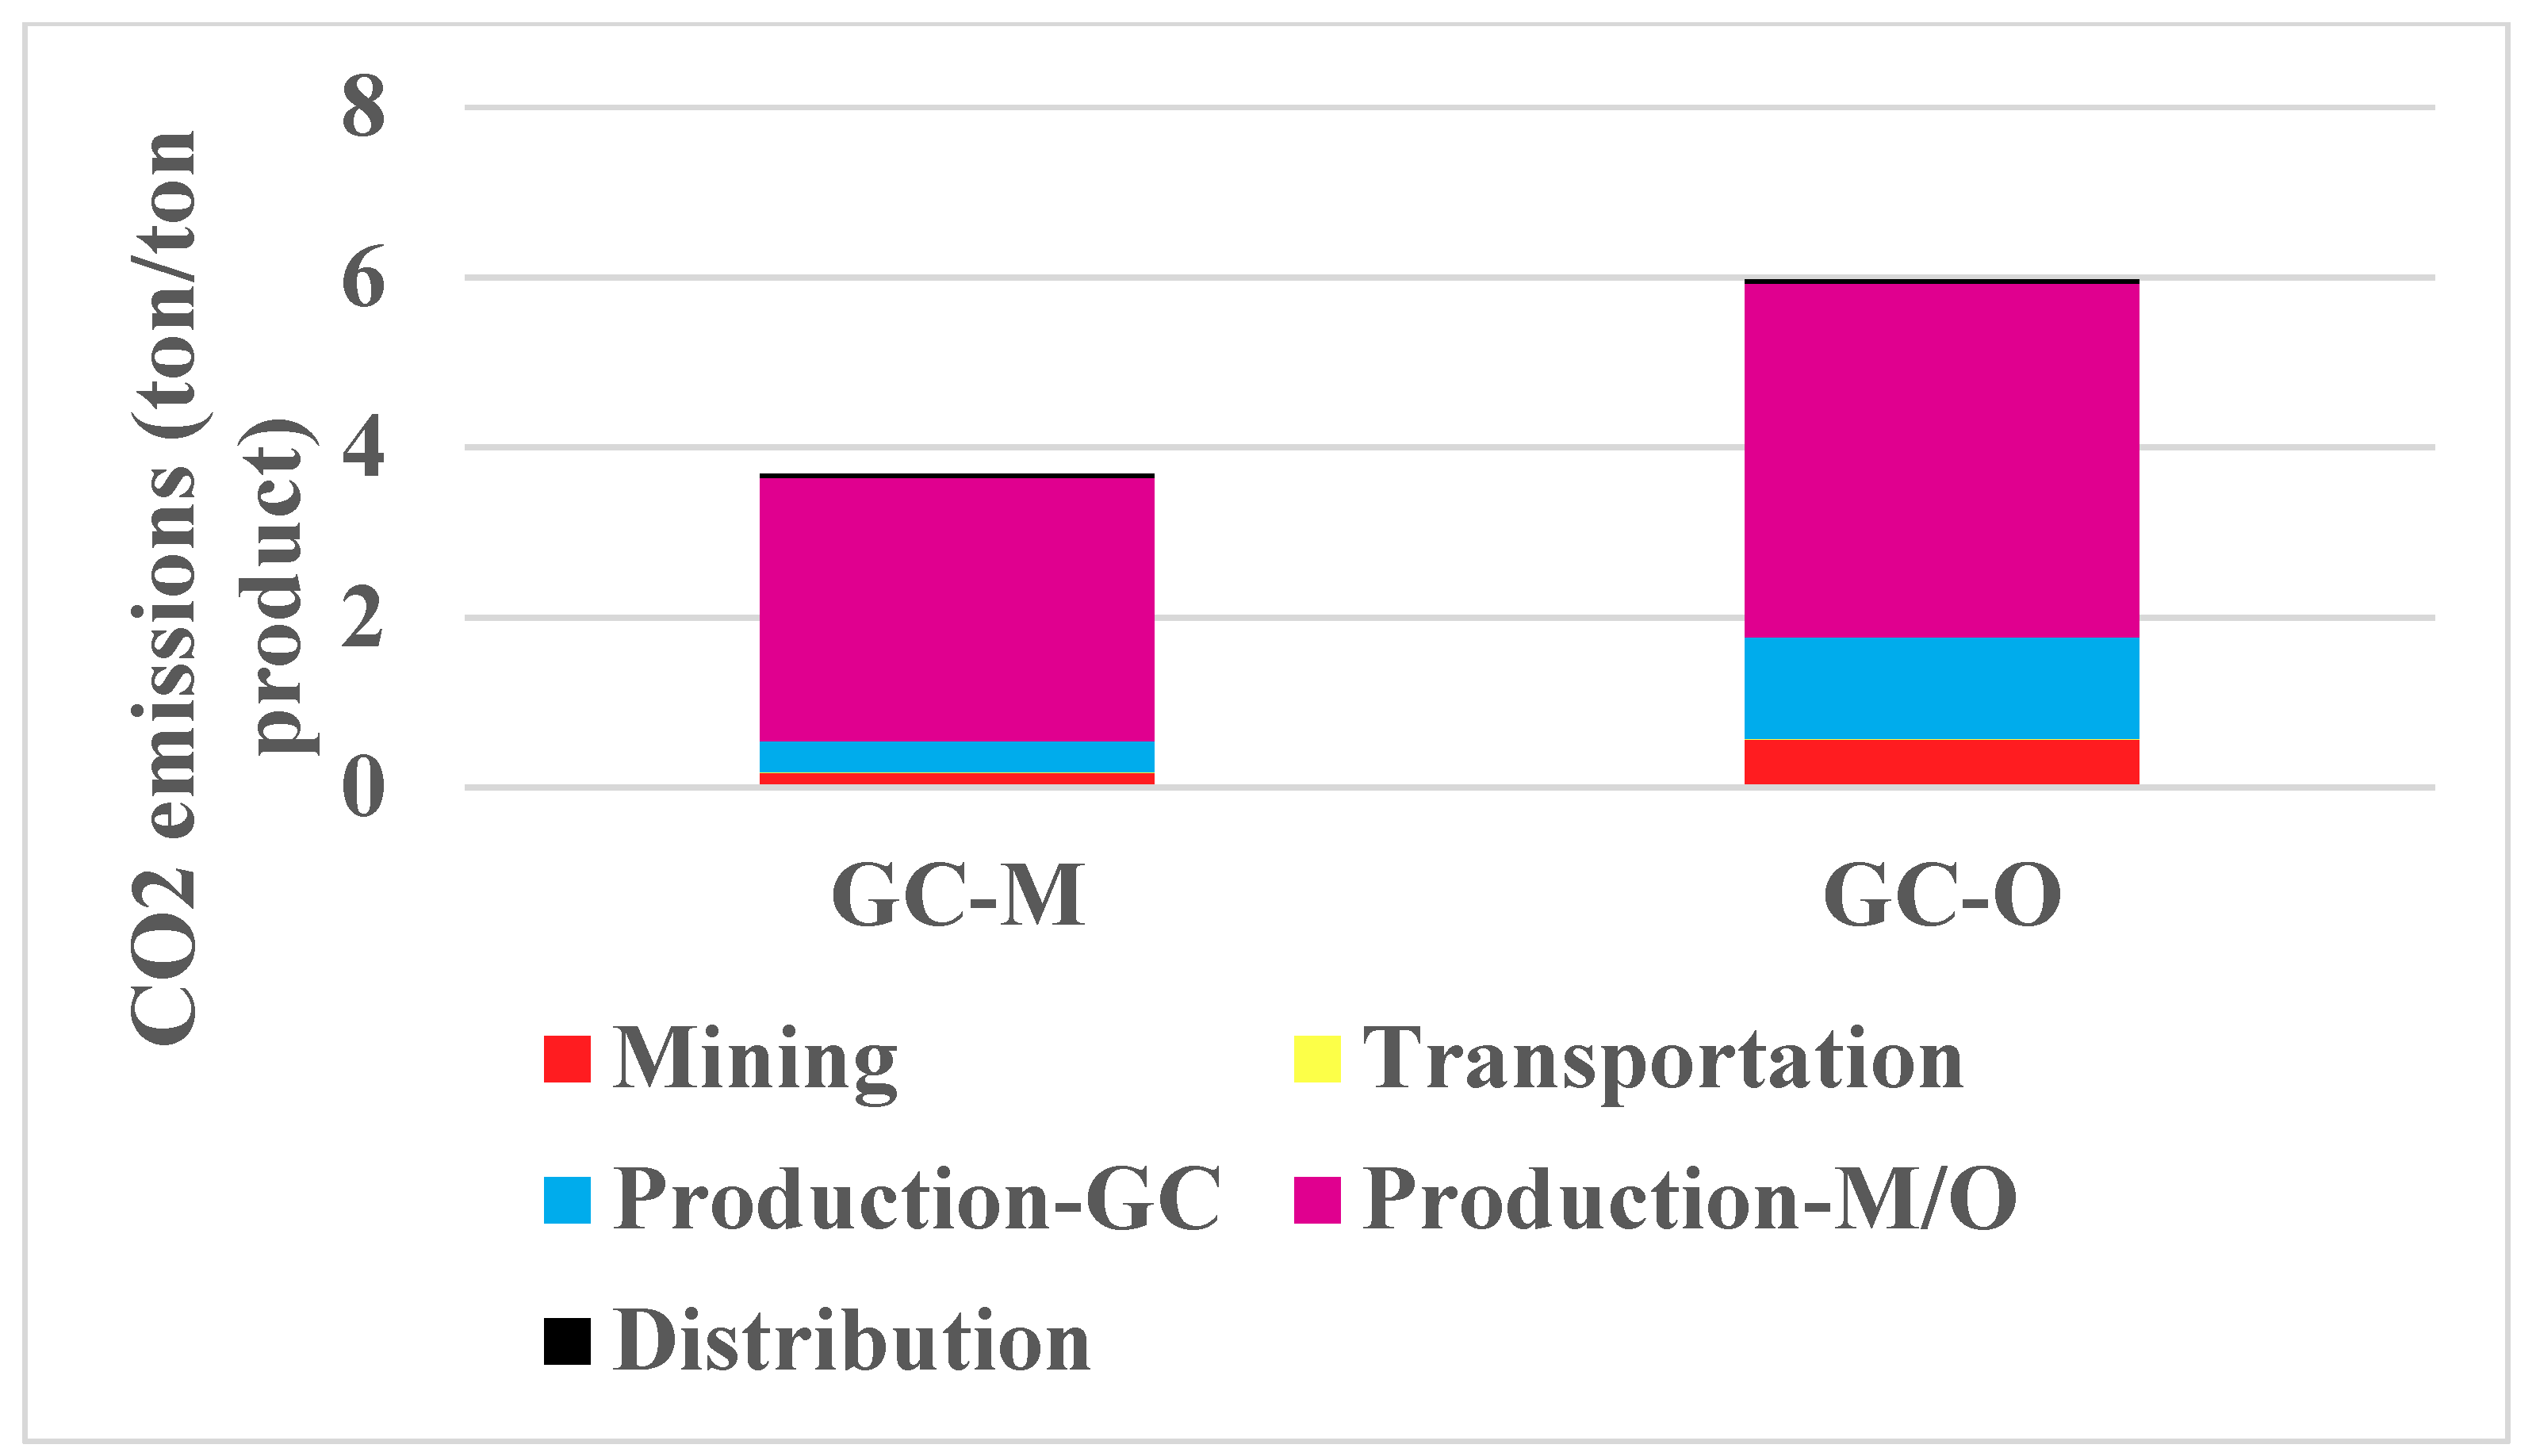
3.4. Life Cycle CO2 Emissions Analysis

Figure 8 shows the life cycle CO2 emissions of the two coke technical pathways. According to Figure 8, the CO2 emission of the metallurgical coke pathway over the life cycle was about 0.37 ton/ton coke, and the CO2 emission of the gasification coke pathway was about 17% higher than that of the metallurgical coke pathway. Of the four stages, the production stage emitted the most CO2, accounting for about 60% of the total emissions; followed by the CO2 emissions from the raw coal mining and washing stage, which accounted for less than 30% of the total CO2 emissions; and regarding the product transportation, because of the amount of CO2 emitted by diesel combustion, the CO2 emitted during the product transportation accounted for about 10% of the total emissions.
Figure 9 shows the life cycle CO2 emissions of two gasification coke coupled chemical technical pathways (GC-M and GC-O). According to Figure 9, the CO2 emissions of GC-M and GC-O over the entire life cycle were about 3.68 ton/ton methanol and 6.97 ton/ton F-T oil, respectively. Of the five stages, the subsequent chemical production stage of gasification coke emitted the most CO2, followed by the gasification coke production stage, and the raw coal mining and washing stage, and the other two stages emitted less.

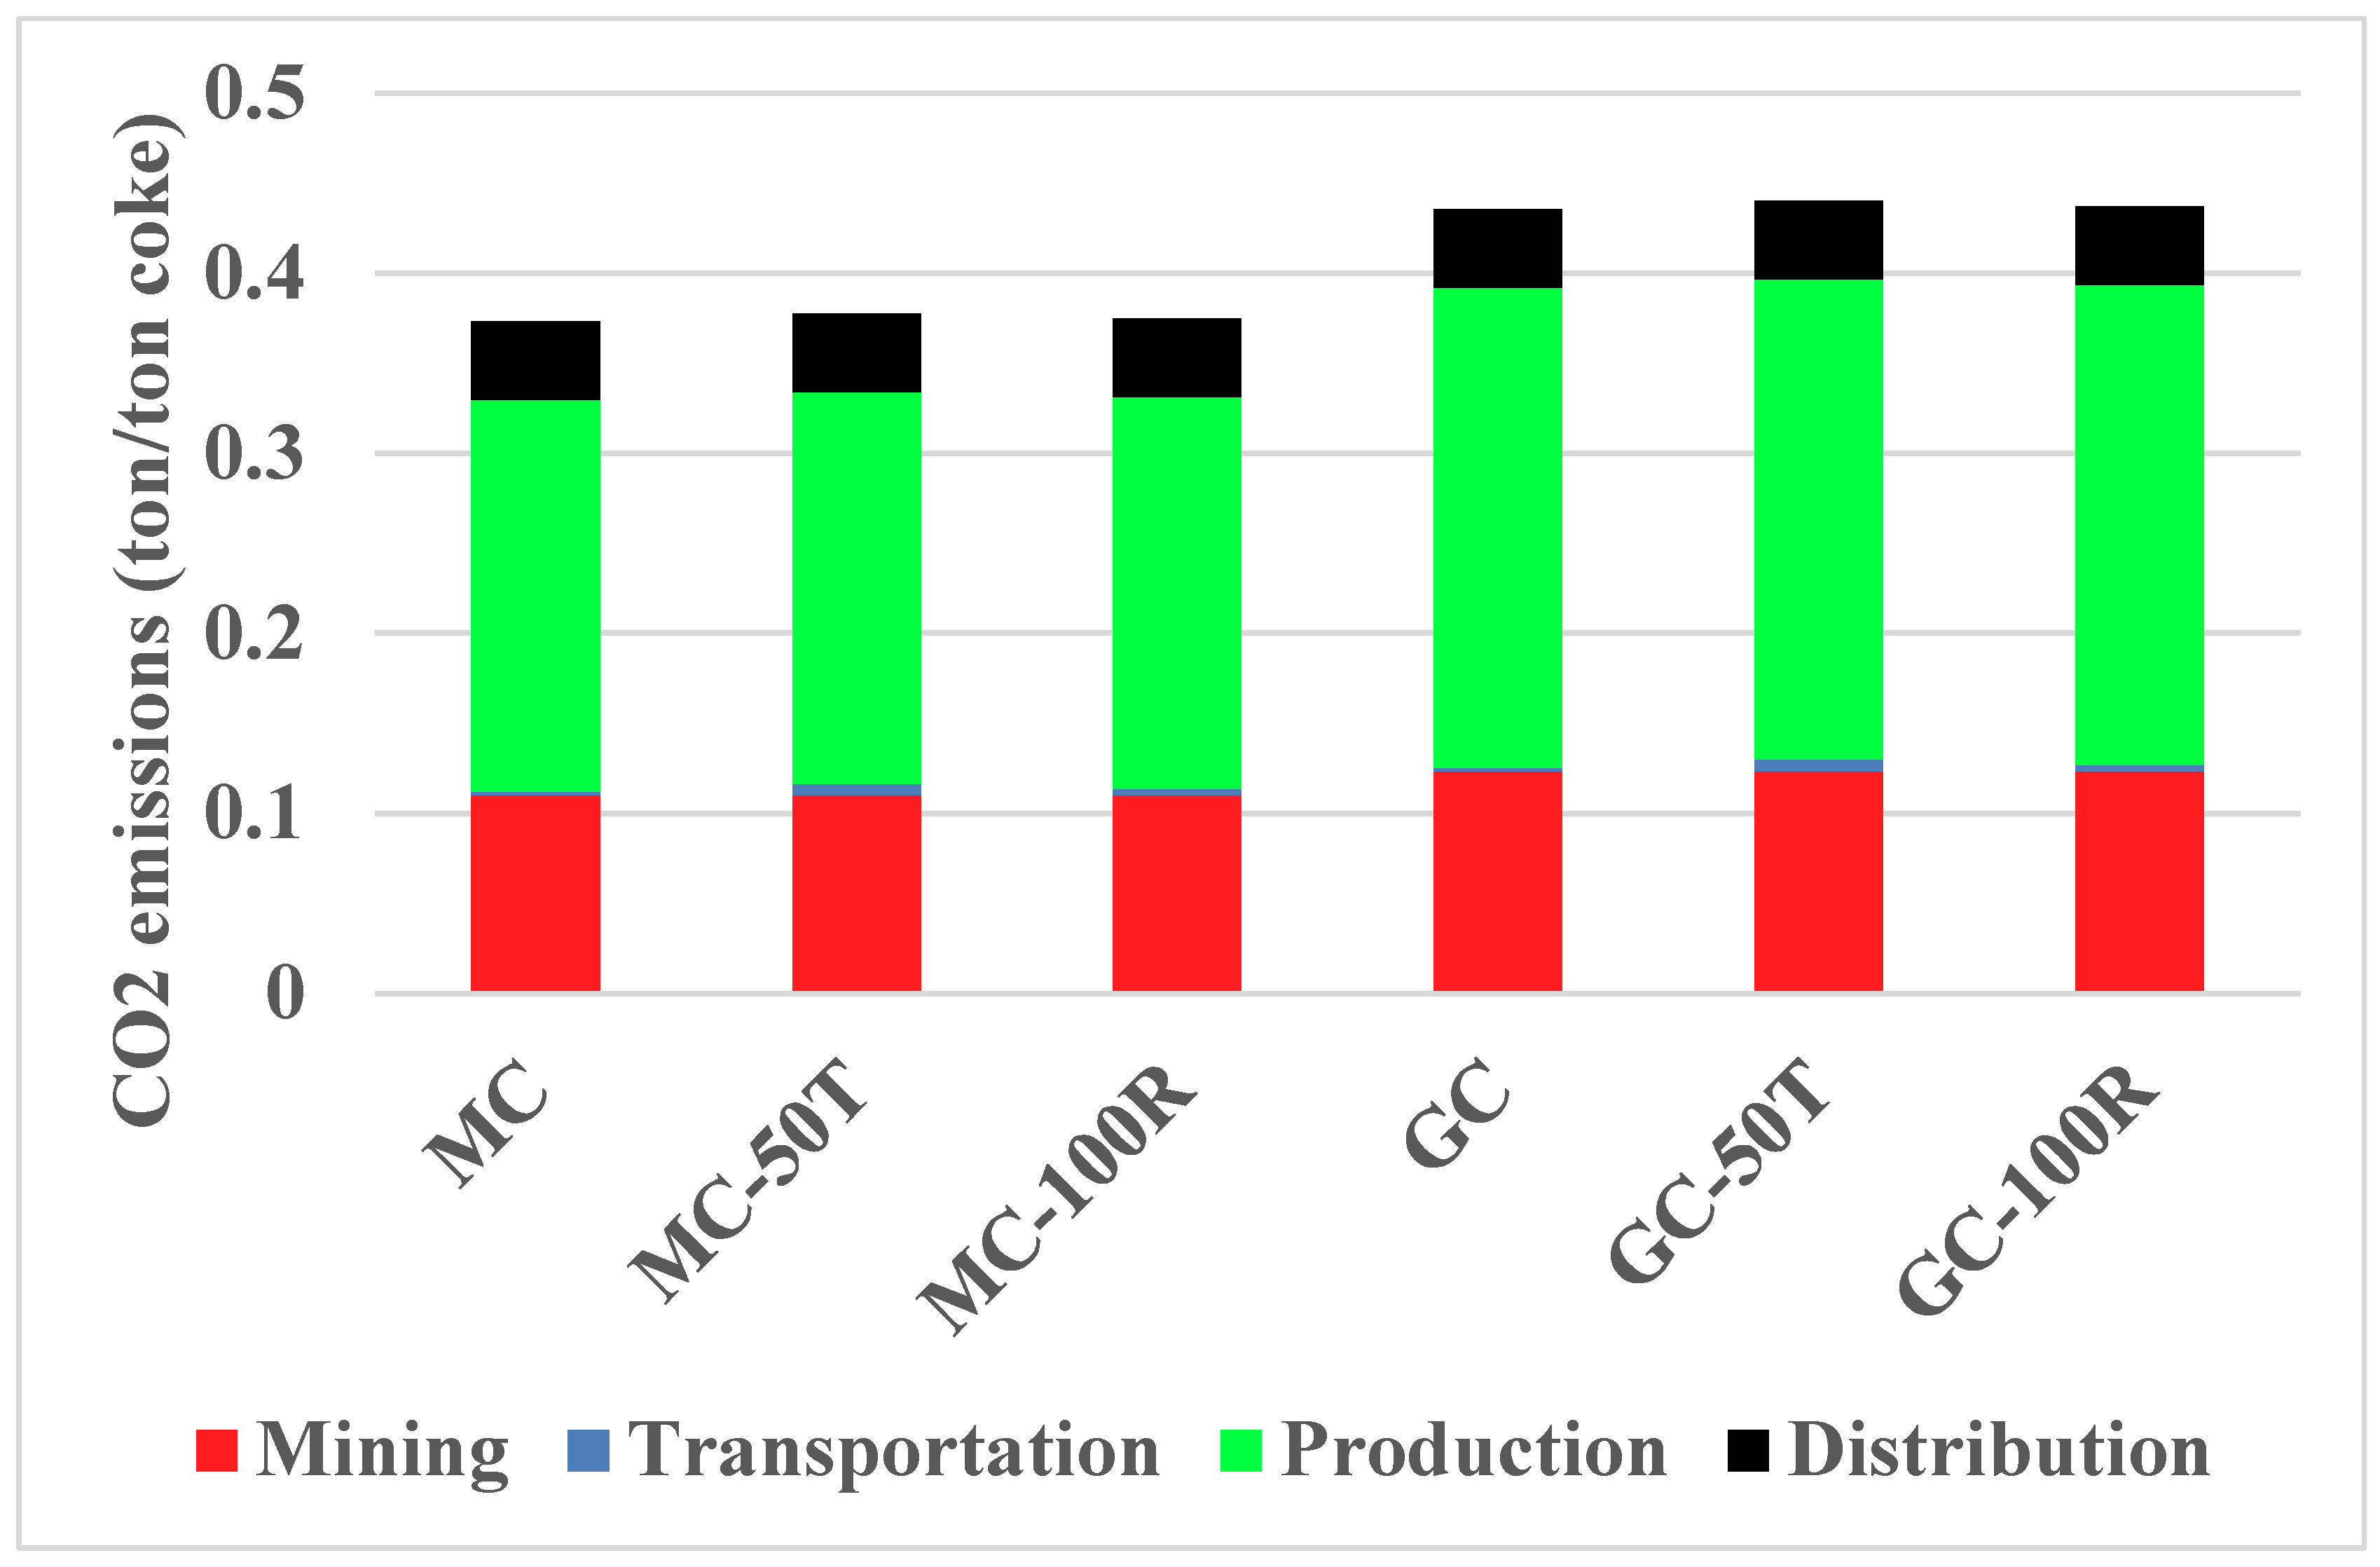
3.5. Comparative Analysis of Different Coal Transportation Modes and Distances

In China, in addition to railway transportation, coal can generally be transported by truck. In this section, we analyze and compare the economic benefits, energy consumption, and CO2 emissions of different coal transportation vehicles and different transportation distances. Since the two gasification coke-derived technical pathways (GC-M and GC-O) are both continuations of the gasification coke technical pathway, this section compares and analyzes only the two coking technology pathways. The comparative technical pathway is shown in Table 6, where MC and GC technical pathways use 50-km railway transportation, 50 T represents 50-km truck transportation, and 100 R represents 100-km railway transportation.
As can be seen from Figure 10, different coal transportation methods had basically no effect on economic benefits. After the transportation distance was increased from 50 km to 100 km, the net economic income decreased somewhat, to roughly RMB 30/ton. The gasification coke pathway had a greater impact than the metallurgical coke pathway.
It can be seen from Figure 11 that different coal transportation methods and transportation distances had little effect on the total energy consumption of the whole life cycle, because the energy consumption of the coal transportation part accounted for a small proportion. From a numerical point of view, the energy consumption of truck distribution was about three times that of truck mining.
It can be seen from Figure 12 that the effect of transportation distance on CO2 emissions throughout the life cycle was very small, because the CO2 emissions of the coal railway transportation part were very small. For the same 50-km transportation distance, the CO2 emissions of truck transportation were more than four times those of railway transportation.

4. Conclusions

In conclusion, life cycle analyses of coal coking technical pathways were studied, focusing on analyzing the economic benefits, energy consumptions, and CO2 emissions. The gasification coke and its derived technical pathways were based on excess coke production capacity and the use of low-rank coal. The gasification coke technical pathway was compared with that of metallurgical coke, and the technical pathways of gasification coke integrated with chemical productions were also discussed. The main conclusions include:
(1)
According to the economic benefit analysis, utilizing excess coke production capacity, replacing some high-quality coking coal with low-cost and low-rank coal, producing gasification coke, and using it in chemical production will have additional economic benefits.
(2)
The economic benefits of each technical pathway depend on the prices of cokes and coals, and this paper gives specific optimized price conditions.
(3)
Compared with metallurgical coke, gasification coke production would increase the energy consumption and CO2 emissions, because of the lower coke yield.
(4)
Generally speaking, using gasification coke to produce F-T oils has higher economic benefits than using it to produce methanol, but has low energy efficiency and high carbon emissions.
(5)
Different coal transportation modes (railway transportation or truck transportation) and transportation distances have little effect on economic benefits, energy consumption, and CO2 emissions throughout the life cycle.
In the actual coke production process, coal tar, coke oven gas, and other by-products have good deep chemical processing potential. For example, CO, H2, and other coke oven gas can be used to produce chemical products. Modern coking enterprises also have such integrated system production cases. Production of gasification coke can produce more by-products, such as tar and coke oven gas, which has more potential for economic benefits. In order to analyze the feasibility, advantages, and disadvantages of gasification coke production in this paper, no research was conducted on the deep chemical processing of these by-products.

Author Contributions

Conceptualization, G.W. and J.Y.; Data curation, Y.L. and D.G.; Formal analysis, Y.L.; Funding acquisition, Y.L. and G.W.; Investigation, Y.L., G.W. and D.G.; Methodology, Y.L. and G.W.; Software, Z.L. and H.Z.; Supervision, G.W.; Validation, Z.L., J.Y. and H.Z.; Visualization, Z.L. and H.Z.; Writing—original draft, Y.L., Z.L. and D.G.; Writing—review & editing, G.W. and J.Y. All authors have read and agreed to the published version of the manuscript.

Funding

This research was funded by by National Key R&D Program of China (2016YFB0600401).

Conflicts of Interest

The authors declare that they have no known competing financial interests or personal relationships that could have appeared to influence the work reported in this paper.

References

  1. National Bureau of Statistics of the Statistics of the People’s Republic of China. China Energy Statistics Yearbook of 2018; China Statistics Press: Beijing, China, 2019.
  2. Peng, S.P.; Zhang, B.; Wang, T. Coal Resources and Water Resources; Science Press: Beijing, China, 2014. [Google Scholar]
  3. Inner Mongolia Meifang Coal Coking Co., Ltd. Final Science and Technology Report on the New Technology Development of Gasification Coke Preparation from High Proportion Low Rank Coal High Temperature Pyrolysis; Ministry of Science and Technology: Wuhai, China, 2019.
  4. Athaley, A.; Annam, P.; Saha, B.; Ierapetritou, M. Techno-economic and life cycle analysis of different types of hydrolysis process for the production of p-Xylene. Comput. Chem. Eng. 2019, 121, 685–695. [Google Scholar] [CrossRef]
  5. Agarski, B.; Nikolić, V.; Kamberović, Ž.; Anđić, Z.; Kosec, B.; Budak, I. Comparative life cycle assessment of Ni-based catalyst synthesis processes. J. Clean. Prod. 2017, 162, 7–15. [Google Scholar] [CrossRef]
  6. Zhang, Y.; Cao, C.; Zhang, C.; Zhang, Z.; Liu, X.; Yang, Z.; Zhu, M.; Meng, B.; Xu, J.; Han, Y.-F. The study of structure-performance relationship of iron catalyst during a full life cycle for CO2 hydrogenation. J. Catal. 2019, 378, 51–62. [Google Scholar] [CrossRef]
  7. Collotta, M.; Champagne, P.; Tomasoni, G.; Alberti, M.; Busi, L.; Mabee, W. Critical indicators of sustainability for biofuels: An analysis through a life cycle sustainabilty assessment perspective. Renew. Sustain. Energy Rev. 2019, 115, 109358. [Google Scholar] [CrossRef]
  8. Dasan, Y.K.; Lam, M.-K.; Yusup, S.; Lim, J.W.; Lee, K.T. Life cycle evaluation of microalgae biofuels production: Effect of cultivation system on energy, carbon emission and cost balance analysis. Sci. Total Environ. 2019, 688, 112–128. [Google Scholar] [CrossRef] [PubMed]
  9. Mayer, F.D.; Brondani, M.; Carrillo, M.C.V.; Hoffmann, R.; Lora, E.E.S. Revisiting energy efficiency, renewability, and sustainability indicators in biofuels life cycle: Analysis and standardization proposal. J. Clean. Prod. 2020, 252, 119850. [Google Scholar] [CrossRef]
  10. Li, R.; Zhang, H.; Wang, H.; Tu, Q.; Wang, X. Integrated hybrid life cycle assessment and contribution analysis for CO2 emission and energy consumption of a concentrated solar power plant in China. Energy 2019, 174, 310–322. [Google Scholar] [CrossRef]
  11. Mateus, R.; Silva, S.M.; Almeida, M. Environmental and cost life cycle analysis of the impact of using solar systems in energy renovation of Southern European single-family buildings. Renew. Energy 2019, 137, 82–92. [Google Scholar] [CrossRef]
  12. Huang, Y.-F.; Gan, X.-J.; Chiueh, P.-T. Life cycle assessment and net energy analysis of offshore wind power systems. Renew. Energy 2017, 102, 98–106. [Google Scholar] [CrossRef]
  13. Nian, V.; Liu, Y.; Zhong, S. Life cycle cost-benefit analysis of offshore wind energy under the climatic conditions in Southeast Asia–Setting the bottom-line for deployment. Appl. Energy 2019, 233, 1003–1014. [Google Scholar] [CrossRef]
  14. Chai, L.; Liao, X.; Yang, L.; Yan, X. Assessing life cycle water use and pollution of coal-fired power generation in China using input-output analysis. Appl. Energy 2018, 231, 951–958. [Google Scholar] [CrossRef]
  15. Zhu, Y.; Liang, J.; Yang, Q.; Zhou, H.; Peng, K. Water use of a biomass direct-combustion power generation system in China: A combination of life cycle assessment and water footprint analysis. Renew. Sustain. Energy Rev. 2019, 115. [Google Scholar] [CrossRef]
  16. Korre, A.; Durucan, S.; Nie, Z. Life cycle environmental impact assessment of coupled underground coal gasification and CO2 capture and storage: Alternative end uses for the UCG product gases. Int. J. Greenh. Gas Control. 2019, 91, 102836. [Google Scholar] [CrossRef]
  17. Tang, Y.; You, F. Life cycle environmental and economic analysis of pulverized coal oxy-fuel combustion combining with calcium looping process or chemical looping air separation. J. Clean. Prod. 2018, 181, 271–292. [Google Scholar] [CrossRef]
  18. Wang, N.; Shen, R.; Wen, Z.; De Clercq, D. Life cycle energy efficiency evaluation for coal development and utilization. Energy 2019, 179, 1–11. [Google Scholar] [CrossRef]
  19. Gao, D.; Qiu, X.; Zheng, X.; Zhang, Y. Life cycle analysis of coal-based synthetic natural gas for heat supply and electricity generation in China. Chem. Eng. Res. Des. 2018, 131, 709–722. [Google Scholar] [CrossRef]
  20. Man, Y.; Han, Y.; Hu, Y.; Yang, S.; Yang, S. Synthetic natural gas as an alternative to coal for power generation in China: Life cycle analysis of haze pollution, greenhouse gas emission, and resource consumption. J. Clean. Prod. 2018, 172, 2503–2512. [Google Scholar] [CrossRef]
  21. Gao, D.; Qiu, X.; Zhang, Y.; Liu, P. Life cycle analysis of coal based methanol-to-olefins processes in China. Comput. Chem. Eng. 2018, 109, 112–118. [Google Scholar] [CrossRef]
  22. Li, C.; Bai, H.; Lu, Y.; Bian, J.; Dong, Y.; Xu, H. Life-cycle assessment for coal-based methanol production in China. J. Clean. Prod. 2018, 188, 1004–1017. [Google Scholar] [CrossRef]
  23. Li, J.; Ma, X.; Liu, H.; Zhang, X. Life cycle assessment and economic analysis of methanol production from coke oven gas compared with coal and natural gas routes. J. Clean. Prod. 2018, 185, 299–308. [Google Scholar] [CrossRef]
  24. Shen, Q.; Song, X.H.; Mao, F.; Sun, N.; Wen, X.; Wei, W. Carbon reduction potential and cost evaluation of different mitigation approaches in China’s coal to olefin Industry. J. Environ. Sci. 2020, 90, 352–363. [Google Scholar] [CrossRef]
  25. Ye, L.; Xie, F.; Hong, J.; Yang, D.; Ma, X.; Li, X.-Z. Environmental burden mitigation potential of oil field gas-assisted coal-to-olefin production. Energy 2018, 157, 1015–1024. [Google Scholar] [CrossRef]
  26. Ou, X.; Xiaoyu, Y.; Zhang, X. Life-cycle energy consumption and greenhouse gas emissions for electricity generation and supply in China. Appl. Energy 2011, 88, 289–297. [Google Scholar] [CrossRef]
  27. Ou, X.; Yan, X.; Zhang, X.; Liu, Z. Life-cycle analysis on energy consumption and GHG emission intensities of alternative vehicle fuels in China. Appl. Energy 2012, 90, 218–224. [Google Scholar] [CrossRef]
  28. Qin, Z.; Zhai, G.; Wu, X.; Yu, Y.; Zhang, Z. Carbon footprint evaluation of coal-to-methanol chain with the hierarchical attribution management and life cycle assessment. Energy Convers. Manag. 2016, 124, 168–179. [Google Scholar] [CrossRef]
  29. Li, S.; Gao, L.; Jin, H. Life cycle energy use and GHG emission assessment of coal-based SNG and power cogeneration technology in China. Energy Convers. Manag. 2016, 112, 91–100. [Google Scholar] [CrossRef]
  30. Bai, X.Y.; Pei, X.F.; Wang, Y. Technical and economic analysis of coking enterprise’s transformation and production of gasification coke. Coal Qual. Technol. 2016, 8, 16–20. [Google Scholar]
  31. Li, D.S. Analysis of the Adjustment the Product Structure of the Independent Coking Enterprises to Turn Losses into Gains. Coal Chem. Ind. 2015, 43, 1–6. (In Chinese) [Google Scholar]
  32. National Bureau of Statistics. Methanol Prices in Late October Fell 8.6% Month-On-Month. 2019. Available online: http://www.meitanwang.com/meitan/bd/1237347.html/ (accessed on 18 December 2019).
  33. National Development and Reform Commission of the People’s Republic of China. Domestic Refined Oil Prices Are Raised in Accordance with the Mechanism. 2019. Available online: https://www.ndrc.gov.cn/xwdt/xwfb/201912/t20191202_1207337.html/ (accessed on 18 December 2019). (In Chinese)
  34. Inner Mongolia Development and reform commission. Notice on Reducing General Industrial and Commercial Electricity Prices in Western Inner Mongolia. 2019. Available online: http://fgw.nmg.gov.cn/fggz/jggl_14670/201906/t20190611_152552.html/ (accessed on 18 December 2019). (In Chinese)
  35. National Development and Reform Commission of the People’s Republic of China. The Railway Transporting Price for the Goods of All Types. 2019. Available online: http://www.ndrc.gov.cn/xxgk/zcfb/tz/201712/t20171226_962626.html/ (accessed on 18 December 2019). (In Chinese)
  36. Taiyuan Engineering Consulting Company. Feasibility Study Report of 600000 Tons/Year Coking Project in Inner Mongolia; Taiyuan Engineering Consulting Company: Taiyuan, China, 2005. [Google Scholar]
  37. Tang, H. New Technology of Modern Coal Chemical Industry; Chemical Industry Press: Beijing, China, 2016. [Google Scholar]
  38. Gao, D.; Ye, C.; Ren, X.; Zhang, Y. Life cycle analysis of direct and indirect coal liquefaction for vehicle power in China. Fuel Process. Technol. 2018, 169, 42–49. [Google Scholar] [CrossRef]
  39. The People’s Bank of China. The Central Parity of the RMB Exchange Rate against the US dollar. Available online: http://www.pbc.gov.cn/rmyh/108976/109428/index.html (accessed on 7 June 2020).
  40. Wang, Q.Y. 2018 Energy Data; Energy Foundation: Beijing, China, 2019. [Google Scholar]
  41. China State Railway Group Co., Ltd. Statistical Bulletin 2018. 2019. Available online: http://www.ndrc.gov.cn/xxgk/zcfb/tz/201712/t20171226_962626.html/ (accessed on 18 December 2019). (In Chinese)
  42. China Electricity Council. 2018 National Power Industry Statistics. 2019. Available online: http://www.cec.org.cn/guihuayutongji/tongjxinxi/niandushuju/2019-01-22/188396.html/ (accessed on 18 December 2019). (In Chinese).
  43. The First National Pollution Source Census: Leading Group Office. Sewage Discharge Handbook of Industrial Pollution Source Production in the First National Census of Pollution Sources; The First National Pollution Source Census: Leading Group Office: Beijing, China, 2009. [Google Scholar]
  44. Xie, K.C. Clean and Efficient Coal Conversion; Science Press: Beijing, China, 2014. [Google Scholar]
Figure 1. Four coal-coking-related research pathways.
Sustainability 12 04884 g001
Figure 2. Economic analyses of four coke-derived technical pathways.
Sustainability 12 04884 g002
Figure 3. Sensitivity analyses of two coke price changes.
Sustainability 12 04884 g003
Figure 4. Sensitivity analyses of two coal price changes.
Sustainability 12 04884 g004
Figure 5. Comparison of energy consumptions between the MC and GC pathways.
Sustainability 12 04884 g005
Figure 6. Comparison of energy consumptions between the GC-M and GC-O pathways.
Sustainability 12 04884 g006
Figure 7. Comparison of energy consumptions and efficiencies between the GC-M and GC-O pathways.
Sustainability 12 04884 g007
Figure 8. Comparison of CO2 emissions between the MC and GC pathways.
Sustainability 12 04884 g008
Figure 9. Comparison of CO2 emissions between the GC-M and GC-O pathways.
Sustainability 12 04884 g009
Figure 10. Economic comparison of different coal transportation modes and distances.
Sustainability 12 04884 g010
Figure 11. Energy consumption comparison of different coal transportation modes and distances.
Sustainability 12 04884 g011
Figure 12. CO2 emission comparison of different coal transportation modes and distances.
Sustainability 12 04884 g012
Table 1. Coal-coking-related research pathways.
AbbreviationMiningTransportationProductionDistribution
MCCoking coal miningRailway transportationCoal cokingTruck long delivery to Steelmaking
GCCoking coal and Low-rank coal miningRailway transportationCoal cokingTruck long delivery to chemical
GC-MCoking coal and Low-rank coal miningRailway transportationCoal coking and methanol synthesisTanker Truck long delivery to chemical
GC-OCoking coal and Low-rank coal miningRailway transportationCoal coking and F-T synthesisTanker Truck long delivery to fuel station
Table 2. Input and output of typical metallurgical coking and gasification coking processes.
TypeMetallurgical CokingGasification Coking
Coal as fire100% coking coal58% coking coal + 42% low-rank coal
Coke yield75%67%
Tar yield3.15%4.07%
Crude benzene yield0.95%1.24%
Coke oven gas production340 m3/t451 m3/t
Table 3. Key parameters for the economic analysis.
ParameterValueUnitSource
Price of coking coal670Yuan/tonRef. [31]
Price of low-rank coal (Long flame coal)240Yuan/tonRef. [31]
Price of metallurgical coke850Yuan/tonRef. [30]
Price of gasification coke730Yuan/tonRef. [30]
Price of tar1800Yuan/tonRef. [30]
Price of crude benzene4000Yuan/tonRef. [30]
Price of coke oven gas0.5Yuan/Nm3Ref. [30]
Average price of methanol2080Yuan/tonRef. [32]
Average diesel price7500Yuan/tonRef. [33]
Average gasoline price8500Yuan/tonRef. [33]
Industrial electricity price 0.4744Yuan/kWhRef. [34]
Railway transport price a (coal)16.3Yuan/tonRef. [35]
Railway transport price b (coal)0.098Yuan/ton/kmRef. [35]
One-off total capital cost of coal coking224Yuan/(ton/year)Ref. [36]
One-off total capital cost of methanol synthesis5500Yuan/(ton/year)Ref. [37]
One-off total capital cost of F-T synthesis15,800Yuan/(ton/year)Ref. [38]
Exchange rate between Yuan and US dollar7.05Yuan/USDRef. [39]
Table 4. Main parameters in life cycle energy analysis.
Item ValueUnitReference
Average power consumption of coal mining and washing25.8kWh/tonRef. [40]
Average energy consumption in the process of coal mining and washing30.5kgce/tonRef. [40]
Average energy consumption in the process of steel production890kgce/tonRef. [40]
Average energy consumption in the process of cement production135kgce/tonRef. [40]
Average energy consumption for railway transportation4.11gce/ton/kmRef. [41]
Average loss ratio of power transmission and distribution6.21%-Ref. [42]
Average coal consumption of coal-fired power generation industry308gce/kWhRef. [42]
Electricity consumption for coke production43kWh/tonRef. [37]
Energy consumption of methanol synthesis1.4GJ/tonRef. [21]
Energy efficiency of F-T synthesis42%-Ref. [38]
Table 5. Main parameters used to calculate direct CO2 emissions.
ParameterValueUnitSource
Average CO2 emissions from coal mining and washing64kg/tonRef. [21]
Average CO2 emissions from electric industry627g/kWhRef. [21]
Average CO2 emissions from coal combustion2.71ton/tceRef. [38]
Average CO2 emissions from diesel production0.51kg/LRef. [43]
Average CO2 emissions from diesel combustion2.57kg/LRef. [43]
CO2 emissions from metallurgical coke production0.15ton/tonRef. [44]
CO2 emissions from methanol synthesis3ton/tonRef. [21]
CO2 emissions from F-T synthesis4.79ton/tonRef. [38]
Table 6. Coal-coking-related research pathways.
AbbreviationMiningTransportationProductionDistribution
MCCoking coal mining50 km railway transportationCoal cokingTruck long delivery to Steelmaking
MC-50TCoking coal mining50 km truck transportationCoal cokingTruck long delivery to Steelmaking
MC-100RCoking coal mining100 km railway transportationCoal cokingTruck long delivery to Steelmaking
GCCoking coal and Low-rank coal mining50 km railway transportationCoal cokingTruck long delivery to chemical
GC-50TCoking coal and Low-rank coal mining50 km Truck transportationCoal cokingTruck long delivery to chemical
GC-100RCoking coal and Low-rank coal mining100 km railway transportationCoal cokingTruck long delivery to chemical

