Article

Job Satisfaction and Problems among Academic Staff in Higher Education

Department of Organization and Management, Institute of Economy and Informatics, Silesian University of Technology, Akademicka 2A, 44-100 Gliwice, Poland
*
Author to whom correspondence should be addressed.
Sustainability 2020, 12(12), 4865; https://doi.org/10.3390/su12124865
Submission received: 21 May 2020 / Revised: 5 June 2020 / Accepted: 12 June 2020 / Published: 15 June 2020

Abstract

:
The role of a scientist in society is undoubtedly extremely important. This thesis was particularly confirmed by the global events of the beginning of the third decade of the 21st century, when the spread of the COVID-19 virus revealed the helplessness of humanity in the face of a pandemic. Only intensive scientific work, having an interdisciplinary character, gives hope to stop the development of the spread of the virus. It turned out that it is scientists who are necessary to reduce mortality and morbidity, as well as the negative effects of a pandemic on the economy and public health. In this regard, it is worth discussing whether the scientific work of scientists is satisfying for them? Nowadays, the scientist is demanded for immediate effects of scientific research, implementation of inventions tailored to the emerging needs, and quick solutions to the problems of a dynamically changing society. However, along with the growing social expectations towards researchers, is their work increasingly appreciated? The aim of this article is getting to assess the level of satisfaction with scientific work among researchers and to identify the factors that influence its level. The article presents the results of research conducted on a random sample of 763 academics from Poland. The conducted scientific studies have established that: (1) The level of satisfaction of researchers concerning their own scientific work depends on employment conditions, as well as the social significance of the research carried out, (2) the level of satisfaction from work is closely correlated with the scientific opportunities of researchers (that is, the possibility of academic and didactic work, contact with students and co-workers) and negatively correlated with the necessity to carry out administrative work, and (3) the majority of Polish researchers are proud of their scientific achievements and treat their profession as a passion or vocation.

1. Introduction

Scientific work is an important process that influences the level of development of the society. Both education and scientific research are closely linked to human development as an individual and as a society, and even humanity. It is, unfortunately, a long-term process, which means that the results of the carried-out research start to appear a long time after it was initiated. In this aspect, science becomes an investment in the new generations and in their comfort of life, knowledge, and development of personal skills. Often, the fact that the research results do not translate into immediate profits makes their assessment difficult, and the associated lack of proper recognition of scientific work that cannot yet be put into practice is discouraging when it comes to treating it as something more than an occasional occupation. High satisfaction coming from scientific work can serve as an additional motivation that subsequently translates into achievements.
The source literature indicates that satisfaction with work is a pleasant or positive emotional state resulting from the assessment of one’s own achievements at work [1,2]. Satisfaction with work is a sign of how the employees perceive their work, assessing it through effectiveness, the opportunity to use their resources and abilities, and the feeling of fulfillment from the performed job [3,4]. The same applies to scientific work.
The aim of this article is getting to assess the level of satisfaction with scientific work among Polish researchers and to identify the factors that influence its level. The research was preceded by an analysis of the literature concerning the knowledge on the discussed issues. The presented research has as a context a wide review of literature on the situation in other European countries and around the world. In this part, the scientific career paths, mostly in European countries, were compared, and remunerations of researchers from different countries and different academic degrees were identified.
This article pays particular attention to the concept of satisfaction with scientific work; in particular, the satisfaction of researchers and the factors influencing it. The results of global research on the issues concerning satisfaction with scientific work and problems associated with it are presented.

2. Literature Review

2.1. Career Paths in Higher Education

In the various countries of the world, there are various career paths in higher education. Some of them are similar to each other, but some are organized according to different models. The academic carrier structure is characterized by different principles for organizing academic careers, which show distinct national variation. While traditional academic career structures remain strong, they differ between types of institution and between countries.
Higher education pays a unique role in the society. Demand for highly skilled, socially engaged people is both increasing and changing. By 2025, half of the existing jobs in European Union countries are projected to require high-level qualifications. In the market, there exists a high-skill gap. Nowadays, driven by technology, jobs are more flexible and complex than before. Without higher education institutions and systems that are effective in education, research, and innovation and are connected to their societies, Europe cannot respond to these challenges. The Modernization Agenda for Higher Education has provided strategic direction for EU and Member states activities to [5]:
  • Build evidence about what works in higher education (in education, research, innovation, and the design of systems) through studies, expert groups, and analysis and monitoring of benchmarks and indicators.
  • Support cooperation, mutual learning, and targeted policy advice between governments and authorities responsible for higher education.
  • Strengthen the capacity and outputs of higher education institutions by funding innovative cooperation projects between institutions and their partners (Erasmus+, Horizon 2020) and, through European Structural and Investment Funds (ESIF), investment in infrastructure, facilities, skills, and innovation projects. European Investment Bank projects have also supported investment in higher education infrastructure, including through the European Fund for Strategic Investments (EFSI).
  • Support international mobility of students, staff, and researchers as a way for them to develop their experience and skills (Erasmus+ and Marie Skłodowska-Curie Actions).
  • Strengthen collaboration between higher education, research, and business.
However, we should also mention that higher education cannot be regarded as a growth industry as automatically as three or four decades ago. What was taken for granted while seeking academic employment in the long post-war period of expansion of higher education does not have to be the case anymore. The ever-expanding higher education and research systems used to be a “growth industry” for three centuries—but this feature does not have to be a defining one for the future. Some countries, such as Poland and several other Central European economies, face significant contraction in student numbers, leading inevitably to the contraction of university-based academic professions [6,7,8]. The rules of the game of entering the academic profession and of the progression in academic careers may be expected to be fundamentally different in the times of stagnation (or even contraction) from those that held on so far in the ever-expanding European systems [9,10,11].
Academic careers take place within a complex web of formal and informal rules and regulations, norms, and expectations, as well as cultural features of international, national, societal, institutional, professional, and disciplinary character [12,13,14,15,16]. Academic career systems are important means to achieve national policy goals for education, research, and innovation based on a diverse range of achievement criteria and pay scales. Academic career systems are also vital to attract talented students and PhDs for research and teaching positions through entailing a predictable future as permanent staff members. Academic career systems are commonly designed to select the most promising young academics from a pool of national and international applicants for permanent employment. In addition, academic career systems should contribute to retaining excellent staff members and motivating them to enhance their performance in teaching, supervision, research in the academic disciplines and professions, and other duties through promising opportunities for career advancement and progressive pay [17].
Academic staff may be fragmented and segmented along lines like employment status, rank, type of main activity (research, teaching, management), age, and gender [18]. Indeed, as society and knowledge production become more complex and specialized, demands on higher education institutions diversify and increase, and so too do the forms of academic staff and the tasks that they are required to perform [18].
Two main functions of the academic staff categories are teaching and research. Within universities, the combination of teaching and research is often understood as an essential and complementary characteristic of the institution. Academic staff are equally likely to be engaged in transmitting knowledge through teaching as in producing new knowledge through research. Through being taught by people active in research in their subjects, students are taught in an environment where they are learning from the current practical research experience of their tutors. Research may equally well be stimulated through the process of discussing aspects with students and considering their questions and ideas [19].
It needs to be mentioned that academic staff are a heterogeneous group in European higher education [19]. The simple vertical ladder of the grades, such as Lecturer, Senior Lecturer, Reader (within the UK), and Professor, is well recognized and understood.
We may distinguish between two main career advancement systems: The competition model and the promotion model [20]. In the competition model, those aspiring to climb the ladder must apply for a limited number of vacant positions in competition with other applicants, while in the promotion model, those who fulfill a specified list of achievements in teaching and research can be promoted to a higher position based on an evaluation of their performance.
The competition for available positions at every career stage has been the traditional model in most European countries (apart from the UK), while the promotion model has been the traditional career system in the USA [21].
While the EU average for staff under 35 is 23.5%, four Member States (Greece, Spain, Italy, and Slovenia) plus Switzerland have fewer than 10% of their academic staff population within this age group. On the other hand, in Germany, Luxembourg, and Turkey, young academics represent a rather substantial proportion of the academic staff body (between around 40% and 55%). In most countries, the largest share of academic staff is concentrated in the 35–49 age group—the group that represents, depending on the country, between around one third and half of all academics [19].
A very important term connected with the academic carrier path, especially in English-speaking countries, is tenure [22]. Tenure is an indefinite academic appointment that can be terminated only for cause or under extraordinary circumstances, such as financial exigency or program discontinuation [23]. Tenure is a means of defending the principle of academic freedom, which holds that it is beneficial for society in the long run if scholars are free to hold and examine a variety of views. The modern conception of tenure in US higher education originated with the American Association of University Professors’ (AAUP) 1940 Statement of Principles on Academic Freedom and Tenure. According to this document [24], the precise terms and conditions of every appointment should be stated in writing and be in the possession of both the institution and teacher before the appointment is consummated. Beginning with the appointment to the rank of full-time instructor or a higher rank, the probationary period should not exceed seven years, including, within this period, full-time service in all institutions of higher education; but this is subject to the proviso that when, after a term of probationary service of more than three years in one or more institutions, a teacher is called to another institution, it may be agreed in writing that the new appointment is for a probationary period of not more than four years, even though, thereby, the person’s total probationary period in the academic profession is extended beyond the normal maximum of seven years. Notice should be given at least one year prior to the expiration of the probationary period if the teacher is not to continue in service after the expiration of that period. During the probationary period, a teacher should have the academic freedom that all other members of the faculty have. Termination for cause of a continuous appointment or the dismissal for cause of a teacher previous to the expiration of a term appointment should, if possible, be considered by both a faculty committee and the governing board of the institution. In all cases where the facts are in dispute, the accused teacher should be informed before the hearing in writing of the charges and should have the opportunity to be heard in his or her own defense by all bodies that pass judgment upon the case. The teacher should be permitted to be accompanied by an advisor of his or her own choosing who may act as counsel. There should be a full stenographic record of the hearing available to the parties concerned. In the hearing of charges of incompetence, the testimony should include that of teachers and other scholars, either from the teacher’s own or from other institutions. Teachers on continuous appointment who are dismissed for reasons not involving moral turpitude should receive their salaries for at least a year from the date of notification of dismissal whether or not they are continued in their duties at the institution. Termination of a continuous appointment because of financial exigency should be demonstrably bona fide.
The tenure track system in USA universities permits entry into the academic profession as an assistant professor and to have a clearly defined path for promotion up the ranks, with rigorous evaluations at several stages, and typically the award of tenure (permanent appointment) after promotion to associate professor on the sixth year. However, the proportion of tenure-track positions has declined substantially to less than half of new appointments [25].
Another very important term used in many academic carrier systems is habilitation (Poland, Germany, Austria, France, etc.). Habilitation defines the qualification to conduct self-contained university teaching and is the key for access to a professorship in many European countries. Despite all changes implemented in the European higher education systems during the Bologna Process, it is the highest qualification level issued through the process of a university examination, and remains a core concept of scientific careers in these countries [26].
The degree is conferred for a habilitation thesis based on independent scholarship, which was reviewed by and successfully defended before an academic committee in a process similar to that of a doctoral dissertation. In some countries, a habilitation degree is a required formal qualification to independently teach and examine a designated subject at the university level. The term “habilitation” is derived from the Medieval Latin “habilitare”—to make suitable or to fit. The degree developed in Germany in the seventeenth century [27].
A habilitation thesis can be either cumulative (based on previous research, be it articles or monographs) or monographic, i.e., a specific, unpublished thesis, which then tends to be very long. While cumulative habilitations are predominant in some fields (such as medicine), they have been, since about a century ago, almost unheard of in others (such as law). In some countries, it is possible to get a professorship without habilitation, if the search committee attests the candidate to have qualifications equaling those of a habilitation and the higher ranking bodies approve of that.
Academic careers are becoming more versatile and involve a wide range of different criteria to develop, although scientific recognition, especially through internationally visible publications, is still the core of the academic career that defines academic trajectories. Interviewees report a widespread trend that might imply a departure from a career model based on a limited number of milestones (often associated with various academic “rites of passage”) toward a new pattern that was called by one of them “cumulative promotion” [14].
In Poland, for many years, there has been a debate about the possibility of habilitation in the academic system. Similar debates occur in other countries with this degree because it is not present in many other countries, especially in English-speaking countries. For example, in 2004, the habilitation was the subject of a major political debate in Germany. The former Federal Minister for Education and Science wanted to abolish the system of the habilitation and replace it with the alternative concept of the junior professor: A researcher should first be employed for up to six years as a “junior professor” (a non-tenured position roughly equivalent to assistant professor in the United States) and so prove his or her suitability for holding a tenured professorship [28]. Most candidates qualify for a university professorship in Germany by means of the habilitation process. Traditionally, habilitation generally includes the production of a habilitation treatise and an examination process that establishes the ability to teach in an academic subject, but it is now is obtained rather by a cumulative mode [29].
Academic staff also differs according to teaching workload. In Table 1, there is a comparison of minimum time that academics should allocate to teaching. In particular, teaching workload is commonly defined according to academic staff categories, with a tendency to impose less teaching on senior academics, compared to junior and middle-rank staff or staff outside the main academic career path. In most countries, rather higher-ranked staff has fewer teaching working hours. Only Germany and Croatia show a different profile, with regulations imposing a higher number of teaching hours to staff in higher ranks than to staff in lower ranks [19].
In England, universities are generally relatively autonomous self-governing institutions with their own charters and governing councils. The institutions, however, receive public funding to varying degrees for teaching and research activities.
From 2006/2007, higher education institutions in England charged tuition fees for teaching, with most charging the maximum permitted fee of 3000 GBP and offering bursaries or scholarships to attract students in the profiles sought. As higher education institutions compete for students and in a market that has tuition fees, the need to offer an integrated high-quality student experience has been highlighted [30].
This increasing and variant breadth of purposes between higher education institutions (HEIs) requires the emergence, recognition, and reward of new roles and career pathways that have descriptive criteria equal in standard and status to the traditional academic roles, but appropriate to the new variant demands. The UK’s academic career model has been described as a probation-on-the-job model. This model is based on an early entry into a post-PhD lectureship, which is given on the condition of a two- to three-year probationary period, which is converted into a permanent contract period if the candidate has fulfilled a set of predefined criteria. This is in contrast to the tenure-track model, which offers the prospect of a tenured higher-level position. Tenure (in the US sense) was abolished by the Conservative government of Margaret Thatcher in 1988. There are still “permanent” or “open-ended” (as distinct from fixed-term) posts, but the protections from redundancy have all but disappeared in most UK universities [17].
Another interesting problem is connected to differences in the academic carrier in various disciplines. The main problems connected to inter-discipline differentiation in the academic carrier path are presented in the Table 2.
Comparative studies have shown that conditions of academic work are heavily dependent on national higher education traditions and type of institution. In universities, combined teaching and research positions far outnumber teaching-only positions, while in the non-university institutions, teaching-oriented positions are typically in the majority [16]. In addition to variation across institutional categories, the time that staff use for research, teaching, and other duties varies substantially between different academic ranks, individual staff members, and across countries [31].
In addition, academic careers and criteria for advancement differ largely across disciplines [32]. Studies of academic career systems point out that research achievements are essential for advancement in the natural sciences, and also depend largely upon research facilities and research groups. PhD students in the natural sciences often coordinate exercises in the laboratories, but teach courses to a much lesser extent. On another note, medicine is characterized by a stronger division between clinical work and basic research, which paves the way for four different careers and advancement criteria: Clinical doctors, professors doing basic research, researchers active in industry research, and a research career in the natural sciences (life sciences) [17].
National differences in the aggregate time used for teaching and research in the university sector are likely to be a combination of differences in institutional expectations of their staff, which partly depends on available funding, professional norms, and the proportion of staff in the different academic positions [17]. Typically, full professors formally devote more of their time to research than lower-level staff members [33].
As part of the strategy leading to the launch of the European Research Area, the Commission launched a process of public consultation and released a series of recommendations to EU Member States concerning the rights and duties of researchers and their employers. At the end of the process, the Commission drafted the European Charter for Researchers and the Code of Conduct for the Recruitment of Researchers [34].
In Europe, the most common recruitment method involves a selection process of candidates responding to a public vacancy. The higher education institutions themselves principally govern this process with substantial, but not necessarily total, autonomy and independence (see the Glossary for the full definition of “public vacancy”). In many cases, restrictions in the way the vacancy needs to be made public, or the qualifications, provenance, and general profile of members sitting on the selection committee, frame the autonomy of higher education institutions, while guaranteeing a harmonized approach in the recruitment of academic staff across the system [19].
We can say that academic structures have become more similar across countries. In the university sector, the PhD is becoming a mandatory requirement for entrance into the academic profession, a postdoc position (or phase) is becoming a common step on the academic ladder, and tenure-track positions have been introduced in more and more countries, however on a small scale.
In addition, there is nowadays an increasing tendency to inflate the academic carrier. In addition to a doctoral degree and experience from teaching and supervision, one or two postdoc periods along with requirements for international publications as well as research managerial experience seem to have become the new rite of passage for achieving tenured positions. At an individual level, more is at stake with regard to what it takes to become a full member of the profession or a principal investigator [35].
In all countries, there are ongoing discussions about how academic career structures, skills, and working conditions can be differentiated and adapted to new challenges in terms of high-quality requirements and relevance in research and teaching [17]. The academic carrier is not static; it also develops and changes [36]. In many countries, in the last years, academic carrier paths and academy functioning have been changed permanently.
We can divide compensation of the academic staff into monetary and non-monetary aspects—according to human resource management theory. Monetary and non-monetary aspects of compensation are important drivers of mobility of human resources. Wage differentials across countries impact the willingness of researchers to become mobile. The literature argues that highly educated workers (if becoming mobile) end up where they are valued most [37].
According to country and university, academic staff can obtain many other non-salary remunerations and perks. For example, in English-speaking countries, such possible benefits are used [38]: Retirement, medical insurance, dental insurance, disability, tuition, social security, unemployment, group life, worker’s compensation, and sabbatical.
In most European countries, there are top-level regulations defining policy for sabbatical leave in academia. Most commonly, regulations refer to paid leave, but in some systems, unpaid leave is also covered.
When considering the duration and the frequency of paid sabbatical leave, existing regulations can be grouped into two main clusters. In the first cluster, covering most regulatory frameworks, academics are eligible to take up to one year every five to seven years. In most other systems, the frequency is comparable, but the maximum duration is only around half a year (either six months or one semester, depending on how regulations are formulated).
In several higher education systems with regulations on paid sabbatical leave, the main purpose of such leave can be both research and professional development other than research (e.g., in the Czech Republic, Greece, Spain, Croatia, Lithuania, Austria, Romania, Slovenia, and Serbia). In some other systems, regulations are more restrictive, limiting paid sabbatical leave either to research (e.g., Germany, Latvia, Luxembourg, Poland, and Turkey) or to professional development other than research (e.g., Estonia and Portugal). In contrast, there are systems allowing academics to take paid sabbatical leave not only for research or professional development other than research, but also for other activities (e.g., France, Italy, and Cyprus) [19].
The patterns of remuneration of academic staff also differ in various fields of science. According to the mentioned European Union report [37]:
  • Among universities, wages are lower in physics and economics than in engineering. Specifically, researchers in engineering also earn more in additional posts than in other disciplines.
  • Remuneration of research positions in economics more frequently depends on law and/or individual negotiation than in physics (with engineering being an intermediary case), and wage increases are more often related to performance, but also to seniority, in economics than in other disciplines. In engineering, by contrast, pre-determined wage scales are a more important determinant of wage levels than in other disciplines.
  • In engineering, research and teaching bonuses are granted more frequently on a performance basis, and among research institutions working in physics, teaching and function bonuses are rarer than in institutions working in other disciplines. Furthermore, the share of income received from bonuses is significantly higher in universities teaching economics than in other universities.
In physics, fewer permanent positions and fewer positions that offer the opportunity to continue a career as a full professor are offered to candidates, and teaching loads are also smaller. In economics, on the other hand, although many temporary positions are also offered, these are often associated with the possibility of continuing the career path to full professor.
It is worth noting that the current situation related to conducting student education remotely imposes various additional requirements on researchers. It also develops lecturers’ skills in using remote education tools and makes one think about the role of digitization on academics’ satisfaction. This topic is already taken up in some publications [38,39,40]. However, the need for remote education also raises many humorous events. A. Minello [41,42] cites such examples. Even the authors themselves had many such situations when a neighbor’s mower may prevent remote lectures.

2.2. Job Satisfaction of Academic Staff

Job satisfaction is a term widely used in management science in the field of human resource management. There are many different definitions of job satisfaction. The selection of the most used definitions is shown in Table 3.
The concept of “job satisfaction” is a global and multidimensional construct perceived by many researchers [55,56,57,58,59,60], mainly those who focus on the protection of the existential dimension of humans in the context of protecting their health and efficiency at work [61].
The importance of job satisfaction especially emerges to surface if one has in mind the many negative consequences of job dissatisfaction, such as a lack of loyalty, increased absenteeism, increased number of accidents, etc. [2,62]. Organizations should be guided by human values. Such organizations will be oriented towards treating workers fairly and with respect [63]. In such cases, the assessment of job satisfaction may serve as a good indicator of employee effectiveness. High levels of job satisfaction may be a sign of a good emotional and mental state of employees [3,4,64].
In addition, the behavior of workers, depending on their level of job satisfaction, will affect the functioning and activities of the organization’s business. From this, it can be concluded that job satisfaction will result in positive behavior and vice versa—dissatisfaction with the work will result in negative behavior of employees. Job satisfaction may serve as an indicator of organizational activities. Through job satisfaction evaluation, different levels of satisfaction in different organizational units can be defined, but, in turn, can serve as a good indication regarding in which organizational unit changes that would boost performance should be made [54].
Job satisfaction research is dominated by studies of extrinsic motivators, in a large part because these factors are, or appear to be, easier to measure. In at least some cases, job satisfaction theorists focus predominantly on intrinsic motivation and satisfaction. This is especially the case for fields where workers have made career choices that obviously do not maximize their direct economic self-interest [65].
According to many research works [66,67,68,69,70,71,72,73], there are some imported factors that influence job satisfaction. Among them, we can mention [54]: The manager’s concern for people, job design (scope, depth, interest, perceived value), compensation (external and internal consistency), working conditions, social relationships, perceived long-range opportunities, perceived opportunities elsewhere, levels of aspiration and need achievement, gender, salary of the work, and stress at work.
M. Armstrong distinguishes the following factors of job satisfaction: Relatively high wages, a fair system of wages, real promotion opportunities, mindful and active management, an appropriate degree of social integration at work, interesting and varied tasks, and a high degree of control over the pace and methods of work [48].
Monitoring of job satisfaction is very essential to the continuing growth of educational systems around the world. Identifying the success and failure of an institution can be measured by job satisfaction level among its employees because of the great effect caused by this satisfaction upon the performance of employees, which will reflect positively or negatively on the quality of the institution’s services, so successful organizations seek to focus on achieving job satisfaction among employees so that they feel institutional belonging, which results in the loyalty and dedication of employees to achieving its objectives. Job satisfaction of faculty of higher education institutions is an essential motivation for the advancement of the educational systems of these institutions towards achieving efficiency and effectiveness in the processes of learning and education. It also reinforces psychological stability for employees, which, in turn, reflects positively on the efficiency in completing the work and the achievement of psychological, social, and professional poise when faculty members do their various roles in academic institutions [74].
Numerous studies on scholars about work performance [75,76,77,78] showed that the people who were most satisfied with their work were characterized by creativity, innovation of ideas, and the initiation of breakthrough solutions in scientific projects. On the other hand, the researcher, who was dissatisfied with his work, was irritated and tense, which contributed to inefficiency and had a negative impact on the didactic process.
Research conducted by R. Abouserie in 1996 [79] confirmed a statistically significant negative correlation between stress and job satisfaction among scientists. This means that the satisfaction with scientific work decreases with the increase of the stress factor. The organizational culture has an equally significant impact on employee satisfaction, which has a positive impact on leadership behavior, which is one of the sources of professional satisfaction [80].
The research carried out in 2014 among Chinese researchers has also shown that the following factors have influenced academic work satisfaction [81]: (1) Level of remuneration, (2) promotion at work, and (3) organizational order.
Other studies [82,83,84,85] revealed that job satisfaction (or lack thereof) was significantly related to job performance, quality of life, and occupational burnout. Research has shown that long-term effectiveness in scientific work is associated with the presence of a well-organized workplace. Some of the research results showed that the satisfaction of academic staff was dependent only on the conditions in the current employee institution and the internship spent there, but no relation was found between the level of satisfaction and the total time spent by the employees on didactic work in higher education [86].
Research in Australia has shown that, despite frequent satisfaction with working conditions and many indicated sources of stress, a small number of researchers are looking for employment outside the higher education sector [87]. According to the research of many authors [88,89,90,91,92], dissatisfaction with work does not have to be a permanent factor, but it may change when employees get new motivations for action, for example, by receiving mental support in the work environment. The strengthening of the psychosocial resources of researchers can be helpful in the effectiveness of their work.
Another important factor affecting the effectiveness of scientific work is organizational support at the workplace, which reflects the extent to which employees believe that their scientific unit appreciates their personal resources and will take care of their development [93,94,95,96]. Secondly, it helps to create a lasting scientific and didactic team attached to its scientific unit. This contributes to the intensification of the accomplishment of scientific and didactic goals that are set for employees of individuals. Significant factors associated with this goal are job satisfaction, level of performance, and commitment to the development of science.
The results of research conducted by T. Oshagbemi [97] at the end of the twentieth century in Great Britain also allowed the identification of the relationship between the scientific position occupied by the employee and the level of their satisfaction. Based on these results, it can be assumed that professional promotion outweighed the stressful impact associated with increasing responsibility and responsibilities. This indicated that the level of satisfaction of scientists increased along with the rank of the position held. Other studies by the same author [98] also revealed that the age of the researcher also influenced the level of their satisfaction (the older the employee, the greater their satisfaction).
Research conducted at US universities [99] showed that productivity and job satisfaction decrease as wage disparity increases. On the other hand, it is possible to cite the results of research conducted at Scottish universities [100], which showed that the level of job satisfaction of researchers results more from the prestige and respect related to the performed profession than from earnings and opportunities for promotion.
In many countries, authors conduct research about job satisfaction as viewed by academic staff. There can be many factors influencing job satisfaction among academic staff. Some of them are selected in the Table 4.
Extensive research has shown that teachers are generally satisfied with the aspects of their work that relate to didactic work. However, it should be added that they can be dissatisfied with other factors that accompany the teacher’s work, such as: Working conditions, interpersonal relations, and remuneration [103,104,105].
The research reveals strong relationships between institutional variables and satisfaction, thus providing support of the hypothesis. The finding that those who are working in top-ranked departments and/or in private institutions tend to have higher levels of both professional and job satisfaction is rather striking [64,106,107].
Hesli has found that the likelihood of finding happiness with both the department and one’s work within the profession is likely to be higher if one seeks and receives employment in a highly rated department and at a private rather than a publicly funded institution. Obviously, not everyone can work in a top-ranked department or in a private institution, but these departments are fostering higher levels of satisfaction. In addition, symbolic rewards are important for job satisfaction. Being nominated for awards is associated with higher levels of satisfaction with one’s position and one’s colleagues; it is also associated with higher levels of professional satisfaction. Spreading the rewards around might be one way of creating a larger pool of satisfied workers [64].
Attending more conferences likewise leads to increase of job satisfaction in academia. Publishing also leads to greater levels of professional satisfaction (or higher professional satisfaction leads to greater productivity in terms of publications). Clearly, professional satisfaction increases with increased participation in the discipline through publications and conference attendance. This relationship is robust. Publications represent achievement, which is a motivator that leads to increased satisfaction. If we turn the causal arrow the other way, the finding ties in with the established notion that increased satisfaction improves productivity [64].
There are also many researches work from non-European perspectives. For example, Bataineh has done research about job satisfaction among faculty members in Jordanian universities. According to his research, the satisfaction with jobs of Jordanian academics is on the following levels (five-point scale was used) [108]:
  • Relationship with the work colleagues—3.52;
  • Work conditions and nature—3.46;
  • Relationship with the direct executive—3.18;
  • Social status and work security—2.98;
  • Salary and promotion—2.46.
He also found that the higher-ranked academic staff has a better job satisfaction level (for example, 3.62 for full professors, 3.25 for lecturers, and 2.86 for research assistants) [108].
Loquias and Sana, on the basis of research in the Philippines, have found that the factors significantly associated with job satisfaction are the work environment variables, perceived institutional support, and stress. These suggest that educational leaders have the capacity to improve job satisfaction by altering the organizational environment and to, hopefully, indirectly alter or influence the inner state of the individuals that make up the organization. If the institution aims to increase job satisfaction among its faculty, it could increase the support it provides to its faculty’s endeavors, reduce stress, provide competitive salaries and benefits, and initiate more democratic governance processes [101].
In the management of staff motivation in higher education systems, the school administrator (Vice-chancellor, Provost, Rector, Principal, etc.) should opt for self-imposed rather than other-imposed discipline. This approach is more conducive to the maintenance of staff motivation as a mechanism in staff management. Nigerian authors have found that the gross absence of self-imposed discipline among chief executives of higher education institutions resulting in financial mismanagement, nepotism, and other fraudulent practices has continued to worsen the plight of higher education in Nigeria. The Nigerian higher educational administrators and managers must be good motivational managers. A good staff manager in the higher education system needs to be eclectic in motivational management and should use the techniques of reinforcement, tasks to staff, discipline, transparency, and functionalism [109].
Assessing the level of job satisfaction among faculty at the University of Najran by Al-Smadi has found that the general job satisfaction among faculty at the University of Najran is moderate with a mean of 3.62. The two domains of psychological and social satisfaction and interpersonal communication are the highest domains, with high levels and means 3.82 and 3.80, respectively. There is also a large disparity in main salaries between various scientific degrees of faculty, resulting in the feeling of dissatisfaction with salaries and financial support to some extent among some faculty [74].
The lack of dependence between the gender of the researcher and the level of overall job satisfaction is confirmed by the results of many studies [100,110,111]. In turn, M.E. Ward and P.J. Sloane [100] noticed the difference between the sexes in that women are more satisfied with the received remuneration than men. The latter derive satisfaction from the stability of employment and promotion prospects.
Still other studies [112] indicate that men under 36 years of age show greater job satisfaction than women, but after exceeding this age limit, the proportions change. In addition, Al-Sadi identified a gender gap in job satisfaction. In Saudi Arabia, there are significant differences in the level of job satisfaction of faculty due to the gender variable, which are in favor of males for all domains of job satisfaction except for the domain of “salaries and financial support”, which showed no statistically significant differences—this may due to the university’s dependence on a pre-determined ladder of salaries for all faculty, prepared by the Ministry of Higher Education in Saudi Arabia [113]. Other studies from Arabic-speaking countries confirm this supposition [113,114]. This means that in Arabic-speaking countries, there may be a problem with women’s job satisfaction among academics.
In Poland, extensive research on the satisfaction with scientific work has not been carried out. Literary reports are generally limited only to local research or attempts to generalize it. However, there are some interesting examples of this kind of research that are worth mentioning.
An example of Polish achievements in this field is the studies on the satisfaction of university employees carried out in Poznań [115]. They showed that academic teachers and service employees are characterized by a higher than average level of satisfaction with their work than people working, for example, in administration. The factor that positively influenced the satisfaction of the academic staff was the feeling that their work enjoyed recognition, while negative influences—as in the case of international surveys [116]—were caused by the excessive burden of didactic and administrative duties.
According to research carried out at Poznań Economic University (UEP) in 2012 [115], academic teachers identify time-consuming teaching duties as the most important factor that negatively affects the assessment of job satisfaction. Similar results were obtained Hesli and Lee [101] in research conducted at universities in the United States. The results of their research indicate that a large load of didactic work reduces professional satisfaction.
Some of the studies revealed that the level of satisfaction of Polish researchers increases along with seniority. However, these reports omit the aspect related to the direct impact of the work of a university employee, for example, on their health, which could have been a significant factor differentiating Polish and foreign researchers [115].
In subsequent surveys [117], the high dissatisfaction of researchers with the remuneration received was indicated. According to the respondents, the lack of satisfaction with earnings was manifested by the necessity of taking up a few full-time jobs, which could be related to the sense of excessive fatigue. In addition, the authors of the study observed that over half of the respondents experienced difficulties related to research at universities and pointed to the adverse impact of their additional paid work on their academic and didactic achievements.
According to Kurek’s research, among the situational factors, a special role is played by factors in the area of interpersonal relationships. Factors highlighted in this area concern not only employee relationships with supervisors and peers, and with students in the case of academics, but also the management styles of superiors and feedback. Her study confirmed the impact of three of the five factors highlighted in the area of interpersonal relationships on the overall level of job satisfaction. The study has shown that positive relationships between employees and their superiors and colleagues, as well as receiving feedback on their work, influence the job satisfaction of academics [118].
The next Polish research about job satisfaction among academic staff was done in 2017 in Poznań Economic University [119]. The teaching staff of the UEP definitely likes to teach students. One of the most important results was that up to 95.7% of respondents definitely agreed or rather agreed with the statement: I like to teach students. Only a few PhD students and tutors rather disagreed with this statement. In the case of the PhD students, this may be the result of their mostly small didactic experience or other expectations regarding this profession. Most of the respondents also agreed with the statement that teaching students is an important and valuable activity (89.7% definitely or rather agreed). To sum up the above answers, one can draw the conclusion that most academic teachers and PhD students are satisfied with didactic work at the university. Academic teachers are convinced of value of their didactic work; however, they have doubts about whether their friends also appreciate it. Perhaps this state of affairs results from the fact that, despite the fact that academic teaching is a widely respected profession, their earnings are not as high as, for example, the earnings of doctors.

3. Hypotheses

The presented overview of selected research proves that the significance of analysis of satisfaction factors concerning scientific work is of great scientific importance, as they translate directly into the effectiveness of scientific work. The initial overview of literature allowed the indication of a research gap in terms of satisfaction with scientific work, therefore, it was necessary to conduct research in this scope. Thanks to the identified cognitive and research needs, the main objective of the discussed research was proposed: The assessment of the level of satisfaction with scientific work among Polish researchers and the identification of factors that influence it.
In the prepared research, such factors as the demographic data of the studied researchers (age, level of education, years worked in the academic field, etc.), conditions of work (position, job, remuneration), and professional psychosocial factors (including stress) that may be associated with satisfaction with work were taken into account. The development of the research results focuses not only on the analysis of the influence of the mentioned aspects on the satisfaction with work, but also defines the level of perceived stress when pursuing academic degrees. Therefore, three working hypotheses were proposed:
Hypothesis 1 (H1).
The level of satisfaction of researchers concerning their own scientific work depends on employment conditions (that is, remuneration level, stability of employment), as well as the social significance of the research carried out.
Hypothesis 2 (H2).
The level of satisfaction with scientific work is closely correlated with the professional opportunities of researchers (that is, the opportunity for teaching and scientific work, contact with students and co-workers) and negatively correlated with the necessity of carrying out administrative work.
Hypothesis 3 (H3).
The majority of researchers are proud of their scientific achievements and treat their profession as a passion or vocation.

4. Materials and Methods

The concept of the research assumes the division of the research process into five stages. In the first stage, the research was focused on the analysis of the factors of satisfaction with professional work, particularly paying attention to researchers. It will cover the wide array of literature describing the research carried out in this scope. Here, the focus was put on major factors influencing the perceived satisfaction with scientific work (the influence of which is both positive and negative), as well as on basic problems of researchers, the level of perceived stress, and its influence on the health of the researchers.
The second stage covers, therefore, a development and verification of the research (diagnostic) tool, the objective of which was to verify the working theories and provide a general image of the problems of Polish researchers as compared with the literature. In the analysis of the discussed issue, our own research tool was used, which was developed on the basis of diagnostic tools that were previously used in some studies [120]. These tools, however, were used as an inspiration to develop our own questionnaire, which was the basis for collecting data during the third stage.
The analysis tools reflect the assumptions of the so-called theory of adaptation to work [66], which is the two-factor verification of the professional satisfaction level. The starting point was, therefore, an assumption indicating that satisfaction with work is influenced by the level of adjustment of the employee’s competences (measured by way of academic degree) to the set requirements (scientific, didactic, and administrative loads), as well as by the level of meeting the employee’s needs, which is influenced by the system of material and non-material rewards.
In this context, during the third stage of research, the issues indicated in the working theories were analyzed. The third stage of research covers our own study on the basis of the methodology described below and with the use of the constructed diagnostic tool, and its effect was a database of features describing both of the discussed issues.
The research questionnaire was shared with 10,000 randomly chosen academics holding at least a PhD degree. A total of 763 researchers took part in the research, which significantly exceeded the minimal size for a random sample, defined at the level of 589 questionnaires (for the assumed level of a maximum sample, statistical error amounts to ±4% with a confidence interval p = 0.95). Not all questionnaires were analyzed due to present non-systemic errors (lack of data, errors in the logic of provided answers); therefore, in the end, 712 questionnaires were analyzed. The research was carried out in Poland in November and December 2017.
Apart from the mentioned tools for substantive assessment of the studied phenomena, the research makes use of a statistical analysis method that presents the correlations resulting from the conducted research. The analysis of the collected data consisted of the establishment of a database, initial organizing, and then proper statistical analysis. The stage of data ordering consisted of random and systemic error elimination. In some cases, the studied persons incorrectly understood the question or did not read the request in the questionnaire in full.
The summary of the collected data was about statistical analysis, both one-dimensional (in the form of traditional or item-descriptive analysis) as well as two-dimensional (in the form of analysis of dependencies of pairs of studied characteristics), and even a multidimensional one with the use of correspondence analysis for taxonomic distances (in the case of features of quality), regression analysis (in the case of quantitative variables), and factor analysis to group the obtained factors.
The descriptive statistical analysis concerning quantity advantages was mostly about obtaining, for example, such measures as arithmetic mean (xsr), standard deviation (SD) and median (Me), coefficient of variation (Vx), and minimum (min) and maximum values (max).
In the case of variables of normal distribution, to compare two average values in the studied independent groups, the t-Student test was used to first determine the uniformity of variations (with the use of the Fisher–Snedecor test). To compare two groups with variations of distribution other than normal (and they were in the majority), the U test was used (Mann–Whitney). In the case of non-uniform variations of features characterized by normal distribution, the C test was used (Cochran–Cox). The comparative analysis of three or more independent groups of distribution other than normal was made with the use of the analysis of variance (ANOVA) test of Kruskal–Wallis, while in the case of non-uniformity of variable variations of normal distribution, the tests were carried out with independent variation estimation. The significance of differences between structure indicators was verified with Chi-squared test. The presence of normality of the distribution of the studied variables was verified with the Shapiro–Wilk test.
When verifying statistical hypotheses, the statistical tests were used, taking into account significance at the level of α ≤ 0.05. At the same time, it was indicated that p probability of making an error of type I is not greater than 0.05, and even sometimes 0.001. In the correlation analysis, the linear Pearson correlation coefficients (rxy), Spearman’s ranks (rs), and t-Student significance test for correlation coefficients were used. All calculations were made with the use of MS Excel 2010 and STATISTICA 12.0. software.
The fourth stage of research was about the analysis of the collected data to verify the formulated working theories. Then, a summary was prepared and a discussion on the said issues in the context of previously cited literature examples was made.
It must be clearly emphasized that the research being carried out did not aim to assess or discuss the levels, standards, or attributes of Polish universities or of employees employed there, but were aimed at making an assessment of the level of satisfaction with scientific work on the basis of the selected research sample of Polish researchers. The proposed analysis can be, therefore, a starting point for further discussion and a trigger for wider research, as well as an incentive for participation for potential respondents. At the same time, it should not be treated as an attempt to assess or an attempt to be a reference for current or proposed changes in the Polish higher education system. The presented results are of demonstrative nature and should be used by Polish researchers for the purposes of development and stimulation of academic achievements by increasing the prestige of and satisfaction with scientific work and decreasing the risk of negative factors caused by this profession that can be a passion, a vocation, and a service for society.

5. Results of Our Research

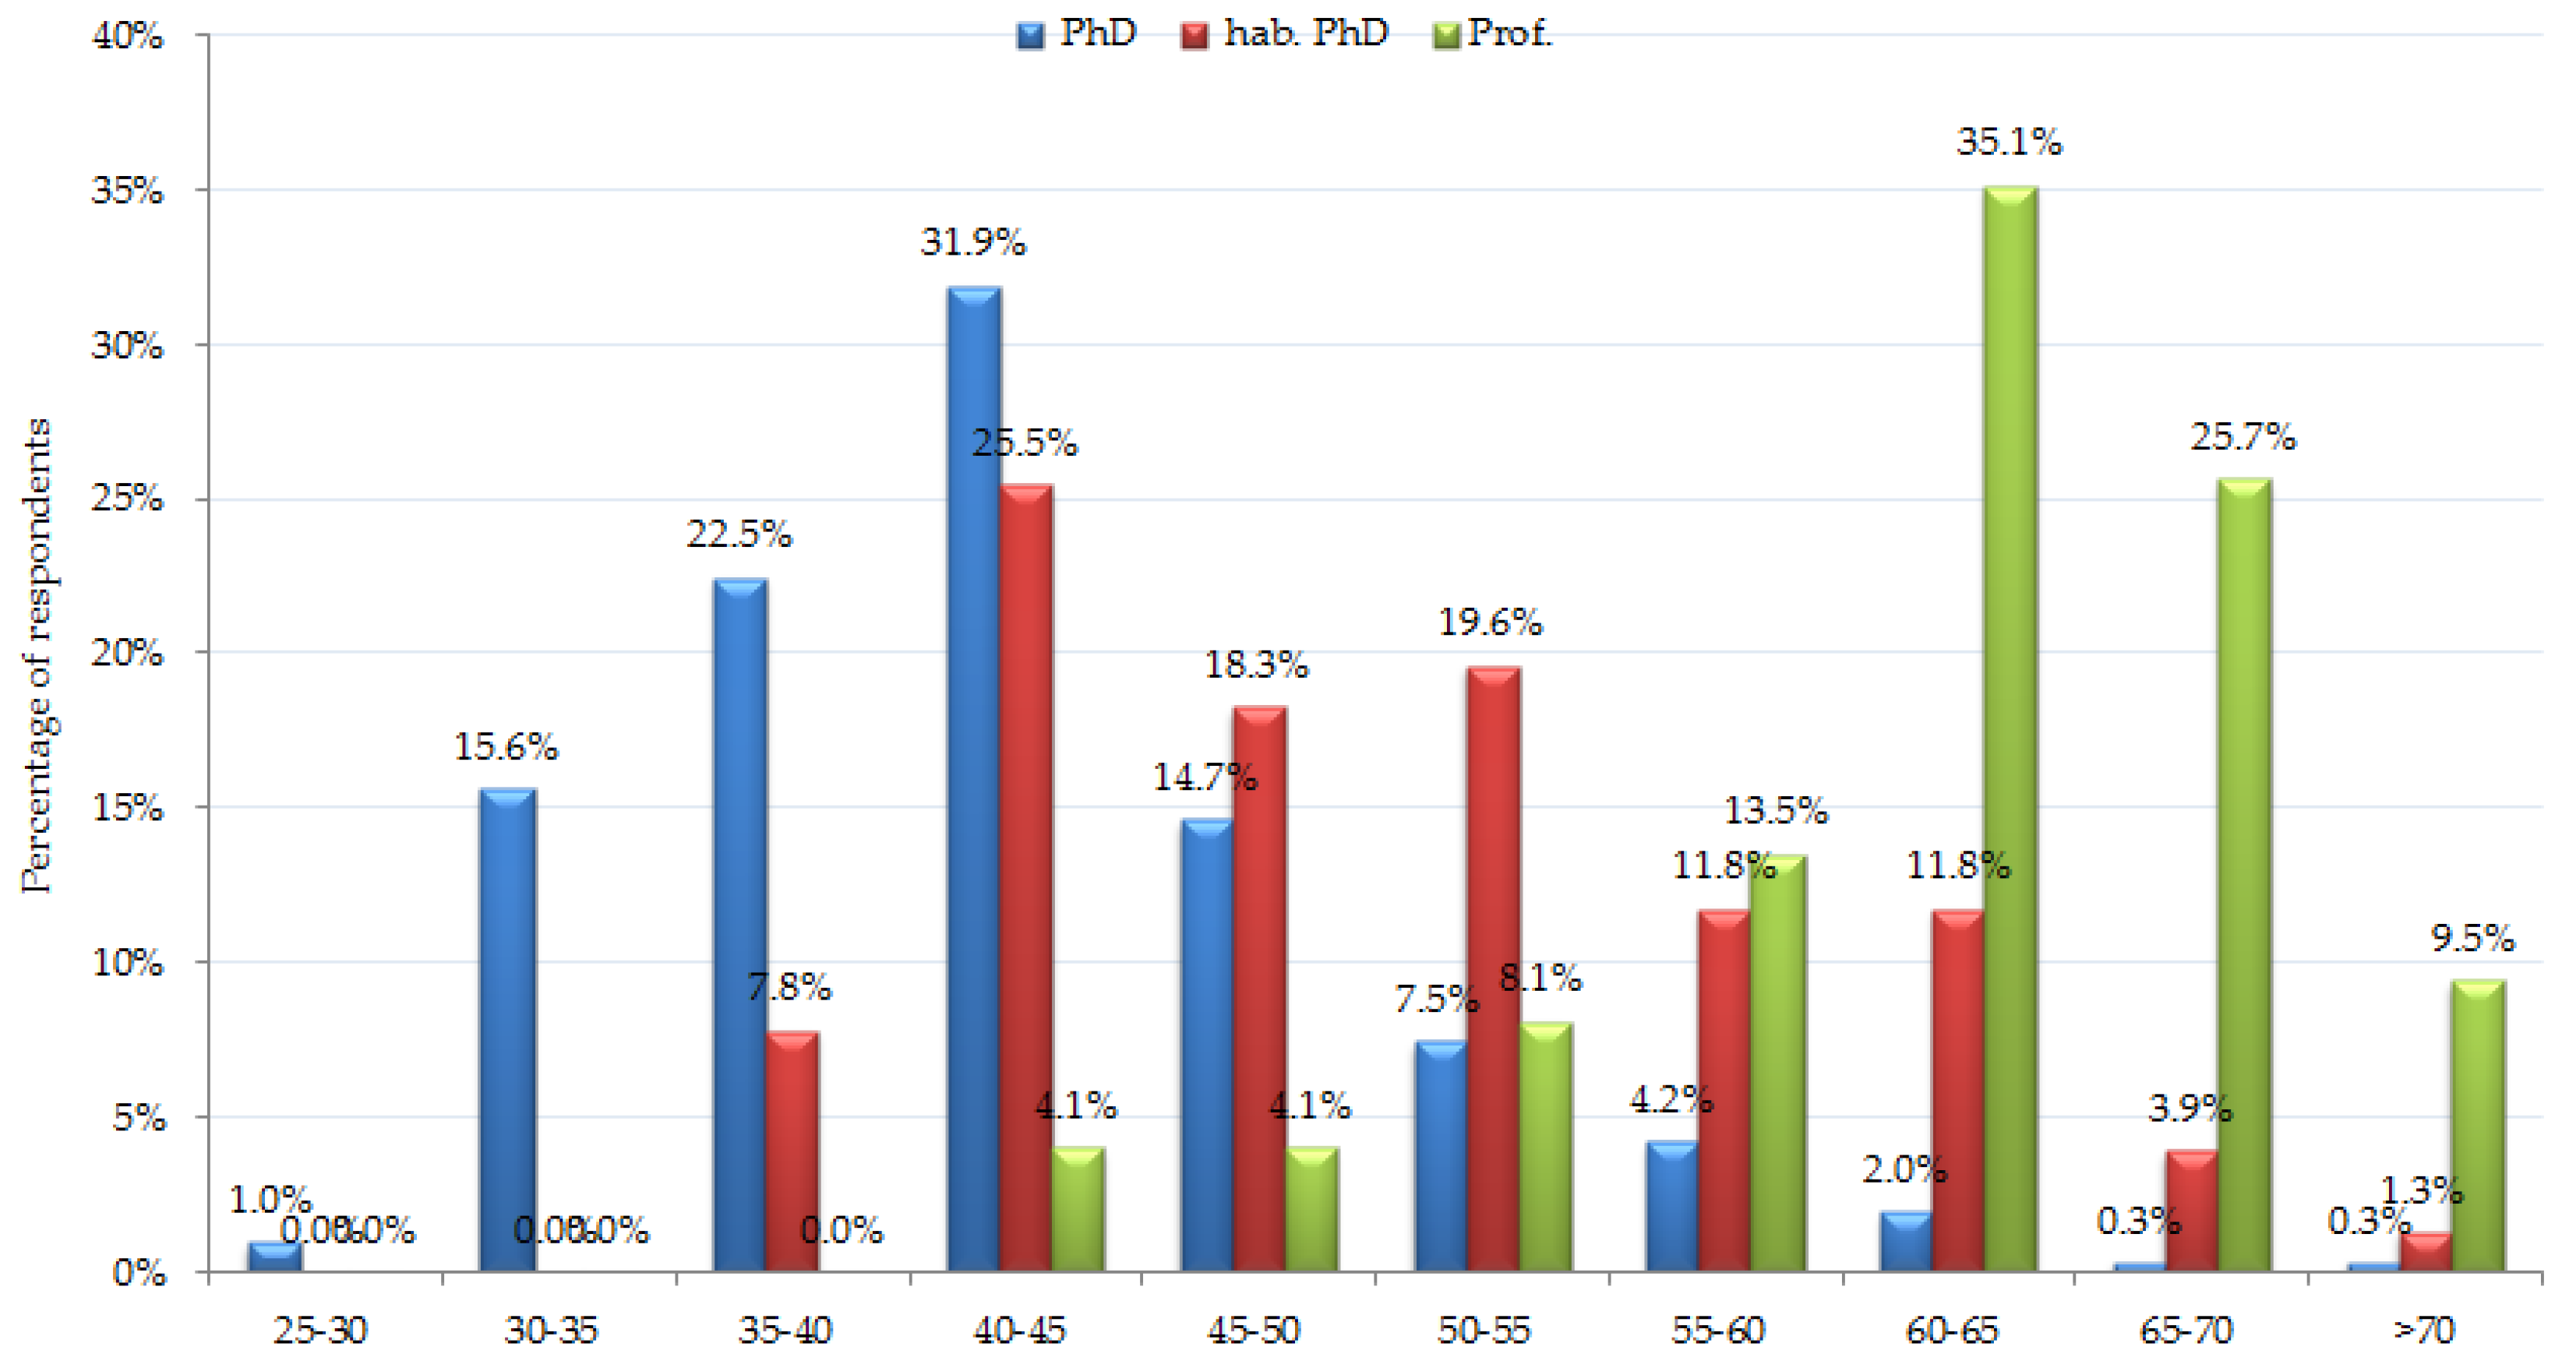
The analysis of the collected data concerned 712 respondents, including doctors, habilitated doctors, and professors who, at the time, carried out research (academic year 2018/2018) at Polish universities. Thus, the research covered 416 doctors, 193 habilitated doctors, and 103 professors. The age structure of the respondents points to a domination of people aged 40–45 years—every fourth respondent was within this age range. The remaining age categories were represented by slightly smaller groups. None of the respondents were above 75 years old, and the smallest age group was of researchers aged 25–30 years (0.6%).
The age structure of respondents is varied. It is evident that it differs among researchers of different academic degrees and holding the title of professor. Figure 1 proves this dependency and, at the same time, presents an interesting phenomenon of different dissymmetries of age among doctors and professors. It can be observed that in the age structure of employees holding a PhD, a right-side dissymmetry of distribution of age categories with dominance in the range of 40–45 years (31.9%) is present, while professors are characterized by left-side dissymmetry with a dominance in the range of 60–65 years (35.1%).
The given results, however, should not be identified with the age at which the degree or title was granted, as Figure 1 does not present the time that passed since the degree or title was granted. However, taking these periods into account makes it possible to assess estimated age when the subsequent degrees will be awarded. On average, the respondents were 31–36 years old when they were granted their PhDs, 42–47 years old when they were granted habilitated PhDs, and 50–55 years old when they were given the title of professor. At the moment the respondents participated in the study, on average, 8.6 ± 6.2 years had passed from the moment the respondents were granted their last degree or title (hence, the present time shift towards the presented age ranges in Figure 1).
An interesting distribution of results concerning the job seniority of the respondents was also noticed. The majority of respondents (every third one) had work experience in the range of 10–20 years in academics. Higher periods of job seniority were scarce. What is interesting is the significant percentage of persons with the highest job seniority (more than 40 years of scientific work)—it was as much as 14.5% of respondents, which can indicate a high percentage of still-active researchers of older generations (in the retirement age) who were classified into one category (persons of job seniority of more than 40 years).
Due to the lack of comparative possibilities when it comes to age, job seniority, and the types of represented academic fields, the research does not include (important) academic parameters, such as number of publications, points obtained for the published works, or the Hirsch coefficient value, meaning a summary of the Impact Factor of the published articles. Comparison of these results among researchers of various age groups would be pointless due to the different assessment criteria of the past and of today.
What was analyzed, however, was the current place of work of the respondents. So, a majority of respondents (46.8%) were researchers in Polish universities (multi-profile ones). Then, there were the employees of universities of technology (12.9%), agriculture universities (11.1%), economic universities (9.5%), and universities of pedagogy (5.9%). The remaining universities’ profiles were represented by less than 5% of respondents. It is not a surprising distribution of workplaces of respondents, as multidepartment universities that offer education in many disciplines employ a majority of the general population of active researchers. The research takes no account of researchers employed only in enterprises or non-academic institutions.
Moreover, the structure of respondents when grouped into represented fields of study presents a domination of economic studies (27.3%), followed by humanities (14.0%), agriculture and forest studies (12.5%), biology studies (10.7%), social studies (9.8%), technical studies (9.3%), and medical studies (5.7%). The remaining fields of study were represented by less than 5% of respondents.
The issue of employment analyzed in the research concerned both the form of employment as well as employment conditions of Polish researchers. Among the researchers, there were 58.9% assistant professors, 19.5% associate professors, and 11.1% full professors; every tenth one held another position (senior lecturer, assistant, etc.).
In the case of functional positions, the majority of the respondents (almost two in three) did not play any managerial function at the university (64.8%). Every tenth respondent (10.4%) was a manager of the unit, and 8.9% were responsible for a department. A total of 3.9% were managers or directors (or possibly deputy directors) of the institute. A total of 5.2% of the respondents were deans or deputy deans, while 0.9% of the respondents were chancellors or vice-chancellors. The remaining percentage (in total, 5.8%) occupied varied positions (plenipotentiary, coordinators, etc.).
Among the respondents, there were also some pensioners (0.2%), but due to their low representation (<5 persons), they were not included in subsequent analyses. Such a low percentage of respondents did not generally influence the average results of particular opinions, but some variables were rounded up; for example, age or remuneration (also including the amount of pension).
The analysis of the duration of employment agreements presents a domination of agreements for indefinite periods of time (59.1%). This means, however, that 40.9% were not permanently employed. A total of 14.5% of the respondents had agreements for definite periods that amounted to at least five years. Employment for periods from two to five years concerned 9.9% of the respondents, and 16.5% signed agreements for a period shorter than two years.
For a majority of the respondents, the work at the university is their only place of employment—this was confirmed by 78.6% of respondents, while every fifth respondent (20.6%) was employed somewhere else outside the university. A total of 2.5% of respondents indicated as many as three places of employment. One respondent indicated work in four places, but none of these activities were associated with a full-time job (0.1%). When interpreting the obtained results, one must note that the research concerns only those researchers who are employed at Polish universities and not all research workers. Thus, they do not take into account researchers holding academic degrees that are hired outside universities.
As was mentioned before, every fifth researcher has additional employment outside the work at the university. The results indicate that 20.1% of them have contracts for specific work assigned by another university, while 46.3% implement orders not related to scientific work (working outside higher education). At the same time, orders for specific work are carried by two-thirds of those undertaking additional employment (66.4%). A total of 11.2% of the respondents that have a position at the university were also employed part-time (usually outside the university), while 22.4% of those undertaking additional employment had two full-time positions (yet, usually, the other full-time employment was not associated with the work for the university).

5.1. Factors Influencing the Satisfaction with Academic Work

Respondents were asked about one of the key issues for the discussed topic, which is the assessment of the influence of selected factors on the satisfaction with scientific work. This was done in several ways. The first way was to evaluate the meaning of factors, formulated on the basis of literature, that influence the general satisfaction with scientific work. The respondents could assess the mentioned factors in the following way:
  • Negatively, as a disadvantage/weak point or significant disadvantage/weak point;
  • Neutrally/indifferently/without any influence on satisfaction;
  • Positively, as an advantage/strong point or significant advantage/strong point.
A list of key factors that could influence the satisfaction with scientific work prepared based on the literature was assessed. Respondents also had the possibility to independently define their own satisfaction factors. This option was used by 72 respondents. The obtained results were subject to statistical analysis, which made it possible not only to define the size of fractions of indicated assessments of particular factors, but also made it possible to categorize them.
Among the negative factors were those for which the percentage of negative ratings was significantly higher than the percentage of positive ratings. Among the positive factors were, of course, the factors with the majority of positive ratings. The third group is composed of factors that could not be unambiguously rated (that is, the obtained percentages of assessments are comparable within ±5%).
The results of selection and assessment of particular factors made it possible to define three groups of factors that have varied influence on the level of satisfaction with scientific work. The first group consists of factors assessed as weak points or disadvantages of the scientific work being carried out.
The first negative factor is the necessary administrative work, which was unambiguously defined as a disadvantage or significant disadvantage of scientific work by 67.1% of respondents, as compared with 2.5% who consider it an advantage. It is, therefore, a direct indication of excess of bureaucratic forms of scientific work as an issue that hinders implementation of scientific tasks.
The other negative factor is the phenomenon of “single full-time position”, meaning the necessity to work only within one full-time position. This obligation was assessed negatively by 33.1% of respondents, while 23.3% considered it to be justified (Figure 2). The differences that were present among respondents undertaking one or more than one employment are interesting. Among respondents that did not undertake additional employment (no orders for specific work, no full-time or part-time position) was a slight majority of those who were against it, seeing it as a disadvantage (54%), as compared to 46% of them who considered it an advantage. Among those who were undertaking additional employment, as much as 77% stated that this is a negative factor of scientific work.
The second group of factors (neutral ones) consists of two attributes of scientific work. The first factor of ambiguous assessment was the manner in which supervisors appreciated the work (manner of awarding researchers). This element of scientific work was perceived by 31.9% as a disadvantage or significant disadvantage that decreases satisfaction of work, as compared with 30.8% of those who assessed it positively. A majority of respondents considered it to be a neutral factor. It seems that the assessment of the manner of awarding the employees depends on the rules of awarding at particular universities and abiding by them.
Similarly to in the case of received remuneration for the work for the university—it was assessed as a disadvantage or significant disadvantage by 34.1% of the respondents, while 36.1% considered it an advantage or significant advantage. It is interesting that 29.8% of respondents claimed that the amount of remuneration does not matter in the context of satisfaction with scientific work. This issue is discussed further in the paper.
The third group of factors are the ones positively influencing the satisfaction with scientific work. The first one is the period of employment (period of the employment agreement of the respondents). A total of 42.8% of respondents claimed that the period of employment is an advantage or significant advantage, while 18.0% stated that it is a disadvantage or significant disadvantage. For 39.2%, this factor was not of huge importance. It is worth noting that 78% of respondents considering employment period as an advantage or significant advantage signed an employment agreement for an indefinite period, and the next 10% for a definite period (at least five years), which confirms that the employment period may be a significant factor of satisfaction with scientific work when it ensures a stability of employment, where the researcher does not have to worry about a new employment agreement, thus having creditworthiness (this was underlined in the comments numerous times).
The respondents were also asked about the importance of stability of employment as a set of factors that maintains comfort of work. It was confirmed that it was a significant factor of satisfaction with working at a university. A total of 58.6% of respondents identified it as an advantage, while 10.7% claimed that it is a disadvantage. A total of 30.8% of respondents did not associate stability of employment with satisfaction with scientific work.
The possibility to maintain relations with supervisors was another positively assessed element—43.3% of respondents considered it an advantage or significant advantage, as compared with 13.1% who considered it a disadvantage. The highest percentage was observed among those who considered this factor as neutral—the relations with supervisors are of no importance for satisfaction with scientific work for 43.7% of respondents.
The possibility of strengthening relations with co-workers was positively assessed by 56.9% of the respondents. Only 6.6% considered it a disadvantage, but more than every third respondent (36.6%) considered this factor neutral.
Assigned classes for students were an advantage or significant advantage for 47.5% of respondents, and only 17.1% were unhappy about it. More than every third respondent (35.4%) answered that it is of no importance when assessing the satisfaction with scientific work.
The possibility to conduct classes was an advantage or significant advantage for 63.2% of respondents, and only 9.3% claimed that this was a factor that negatively influences the level of satisfaction with scientific work. For 27.5%, this was a neutral factor.
In addition, free time (in between classes and during summer holidays) was considered an advantage by 61.7% of academics. Only 5.5% were not happy with the time devoted to work. For every third respondent (32.9%), it was of no importance in the context of satisfaction with scientific work. Many comments were left considering free time, as the majority of respondents said that the requirements imposed on them during subsequent academic degrees completely reduce their free time, and it is impossible to have some time for oneself. The respondents’ feedback indicates that they have an opportunity to use free time should they agree to abandon efforts concerning subsequent academic degrees, which is possible only when participating in relations of interdependence that informally omit the rules that are binding for all workers.
The possibility of establishing relations with students was an advantage for 65.4% of respondents. It is, therefore, a result similar to the one concerning the possibility of conducting classes. However, the percentage considering it a disadvantage differs, as only 2.9% respondents negatively assessed the possibility of contact with students.
The possibility of participating in conferences, symposiums, and seminars was a significant advantage for 68.3% of respondents, and only 3.4% claimed otherwise. A vast minority (28.4%) considered it a neutral factor influencing satisfaction with work.
The factor that was considered the most positively influential on the satisfaction of scientific work was the possibility to carry out research and scientific work, understood as writing articles, books, and reviews, carrying out research, etc. This was the viewpoint of 70.2% of respondents, and only 3.9% considered it a disadvantage. Every fourth respondent (25.8%) claimed that scientific work does not influence the satisfaction with work at the university in any way.
When analyzing the obtained results, it is worth paying attention not only to the direction of influence (positive or negative), but also to the percentage of people who consider a given factor neutral, which leads to its complementation up to 100%, which signifies the strength of factor influence. On this basis, a measure of the particular factors influencing strength, Swi, was proposed.
S w i = I P o s I N e g I N e u t
where:
  • IPos—percentage of responses indicating a positive influence of a given factor;
  • INeg—percentage of responses indicating a negative influence of a given factor;
  • INeut—percentage of responses indicating a neutral influence of a given factor.
The analysis of the strength of influence allows us to state that the possibility of carrying out research work influences the satisfaction with scientific work the most (Sw = 2.9; Table 5); next come the possibility of conducting classes (Sw = 2.6) and the possibility of participating in conferences and seminars (Sw = 2.5). The weakest influence can be observed in the case of relations with supervisors (Sw = 1.3) and the necessity of working within one full-time position (Sw = 1.3). Thus, it can be seen that the neutral factors influencing the satisfaction level have the weakest influence strength at the same time (of course, from an arithmetic point of view). Very important is the strong influence of some of the factors that negatively and neutrally influence the level of satisfaction. The administrative work, even though it is considered a factor that negatively influences the satisfaction of scientific work, has a high influence strength at the level of Sw = 2.3 at the same time. The same applies to remuneration level. Even though it was rated as neutral, its influence strength is Swi = 2.4. Next comes the second factor of negative influence—manner of rewarding employees (Swi = 1.7).
It was also noted that there are no significant differences in the assessment of factors’ influences between persons holding different academic degrees. This applies both to the percentages of positive and negative influence and to the strength of influence. However, one can notice slightly different needs among the doctors, habilitated doctors, and professors. The most significant need in this scope considers the level of remuneration. The strongest influence of this factor was observed in the case of habilitated doctors, then doctors. The weakest influence strength could be observed in the case of professors. A similar situation occurs in the case of free time and period of employment. It is also worth noting that, as much as the level of remuneration in the case of doctors is considered a disadvantage, the majority of habilitated doctors and professors consider it an advantage. In the cases of other factors, no significant differences between answers from academics holding different academic degrees could be observed.

5.2. Opinions about Researchers’ Own Scientific Work

What was also studied was the opinion of Polish researchers on their own scientific work and associated problems. The respondents were asked to assess the provided opinions towards their own situation. They could agree or disagree with a given statement or agree only partially. The scope of topics of proposed statements and opinions was wide and general, and contained the same number of negative and positive statements.
The respondents were asked, among other things, whether they agree with the statement that their scientific work is not only work but also a passion (vocation). It turned out that one’s own scientific work is considered a passion by 95.5% of respondents. The vocational character of the research work was indicated by 58.4% of academics, and more than every third (36.1%) at least partially considers their work to be a passion and a vocation. Only 5.5% of the respondents did not agree with this statement. It is worth adding that the results obtained according to different academic degrees are comparable with the general results coming from all the respondents (Figure 3).
In this context, the respondents were also asked whether they can imagine doing something professionally from different working in academia. Only 15.4% felt the need to undertake another job. Almost 40% of respondents could not imagine other professional work, while the remaining percentage of 44.9% agreed only partially, not excluding the possibility of changing their work under certain conditions.
In addition, the perception of the importance of one’s own work for the society was assessed. As many as 95.4% of respondents were certain that scientific work is beneficial for the society, yet more than half (52.6%) agree only partially, and 42.7% were certain of that fact. A total of 4.6% of respondents felt that their own scientific work lacks value (meaning a little more than the sample error).
The feeling of meaningfulness towards one’s own work is associated with pride and satisfaction with one’s own scientific achievements. A total of 37.6% of respondents were proud and satisfied with their achievements, and 55.8% of respondents were partially satisfied and proud. Only 6.6% were not proud of their achievements.
A majority of respondents identified with their university and were ready to defend its name (91.6%)—more than every second respondent (57.4%) was certain of that, and every third (34.2%) had certain limitations towards this statement. Interesting is also the fact that 8.4% of respondents did not identify with the university that they work for.
A way to verify this statement was an opinion about whether the respondent would recommend studying at their university to their friends and family. A similarly high percentage of positive statements or statements that would agree partially was obtained. A total of 49.4% would definitely recommend their department or university, and 42.1% would recommend it to a certain degree (partially). Similarly to in the case of identifying with one’s own university, 8.5% of respondents would not recommend their own university/department to their family or friends as a place to study, which equals the level of lack of identification with their own university that was stated by 8.5% of respondents.
Interesting are also the opinions of the respondents concerning the planned changes at the universities. These changes were very general on purpose, yet were present in many forms, as this question was aimed to convey the opinion associated with important changes introduced by state authorities. A total of 88.4% of respondents said yes when asked if they are worried about the planned changes in higher education, while a half (39.4%) were worried only partially (in some aspects), and the remaining respondents (49.0%) were afraid of all the planned changes in higher education.
In the case of the statement “I understand the meaning behind the administrative work that I have to do”, a majority of respondents (as many as 91%) did not agree with it or were partially of a different opinion. Only 9.0% understood the meaning behind the administrative work they do. The low results concerning the understanding of the meaning behind administrative work converge with the results on the same subject in the context of the influence of administrative work on the satisfaction with scientific work.
Another important issue discussed during the research was the presence of pathologies related to the work at the university. This issue covered, among other things, nepotism, office politics, and academic corruption, as well as the use of ghostwriters to publish scientific works. Unfortunately, the presence of such issues was confirmed by 83.4% of the respondents, while 40.0% considered them to be incidental, and 43.5% had no doubts about them. A lack of such practices was confirmed by only 11.6% of respondents.
Sadly, every tenth respondent (10.5%) agrees that they face tasks at the university that are inconsistent with their values (conscience). A total of 27.7% of respondents are faced with tasks that are contrary to their values from time to time, while 61.8% did not see any discordance against the assigned task and the binding moral and ethical rules.
What is surprising is the opinion of the respondents on the issue associated with the previous question. Even though a majority of respondents (55.1%) conduct classes in the field in which they are competent, every third respondent (30.3%) admits that they are only partially confident, and 14.6% of respondents claim that they are unprepared for this task.
A total of 71.9% of academics agreed with the statement that the ban on having another full-time job is unfair. A total of 42.9% agreed with this statement completely, while 29.0% of respondents claimed that this is only partially true, and that this ban is unfair only partially. The ban on a second full-time job is understandable for 28.0% of respondents, which is a result only slightly higher than the one obtained when asked about the validity of prohibition of another full-time job (23.3%) that was a part of another stage of this study.
Despite the lack of acceptance of the prohibition of another full-time job expressed by the majority of respondents, a majority of respondents also agreed with the statement that working at the university does not limit them when it comes to attaining work–life balance. A total of 30.8% agreed with the above statement, while 44.8% agreed with this statement partially. Nevertheless, every fourth respondent (24.3%) was convinced that it is the other way round—every fourth researcher claimed that the manner of work performance negatively influences their personal lives. Nevertheless, every twentieth respondent (5.4%) would like to change their profession and find another job. A total of 31.1% of respondents did not rule out the possibility of partial changes. The remaining percentage (63.4%) did not even consider such a change.

5.3. Level of Job Satisfaction

What was also assessed was the general level of job satisfaction of Polish researchers participating in the study. They could rate particular factors on a scale from 1 to 10. The obtained results were subject to descriptive analysis, which indicated that general assessment of job satisfaction was at the level of 6.84 ± 1.91. It is, therefore, a result above the average, which, for this scale, amounts to 5.5. When trying to explain what gave this result, respondents were asked to rate particular attributes of scientific work. As a result, it was established that one of the features that scored the lowest in terms of job satisfaction is the level of remuneration (4.92 ± 2.41). From among the three used forms of work at a university (that is, teaching, administration, and research and scientific works), the lowest satisfaction came from administrative work (2.9 ± 2.09), which is a confirmation of the results obtained before in this area. Then, the satisfaction coming from teaching was rated at the level of 6.81 ± 2.29. The highest rated was research work (7.31 ± 2.11; Figure 4).
In addition, other aspects of scientific work were assessed. Among them were those rated above average, that is:
  • Cooperation with students (7.46 ± 1.73);
  • Work autonomy (6.86 ± 2.44);
  • Level of teaching (6.63 ± 1.87);
  • Prestige of the university or department (6.29 ± 2.08).
Other aspects were rated on the level below average (for the adopted scale), although they were not that different from the average. Among them, we can list:
  • Work organization (5.46 ± 2.49);
  • Work control (5.12 ± 2.40);
  • Work of secretariats, offices (4.94 ± 2.83);
  • Rules for conducting research (help from the university in conducting academic research) (4.69 ± 2.34).
Analysis of differences’ significance between average ratings in subgroups (in the context of academic degrees) for particular attributes of scientific work was made with the use of ANOVA variation analysis. Thanks to this, it was indicated that a half of the assessed attributes were rated differently by doctors, habilitated doctors, and professors (p < 0.05). Statistically important differences were noticed in the case of general satisfaction with scientific work (p < 0.001), as well as the assessment of cooperation with students (p = 0.001), assessment of the university’s prestige (p = 0.004), assessment of the work control (p = 0.028), and assessment of autonomy in carrying out one’s own research (p = 0.008). Despite the fact that the remuneration level for particular academic degree subgroups is significantly different (p < 0.001), the assessment of its influence on the job satisfaction in particular subgroups was not significantly different (p = 0.226) (Table 6).
However, the analysis of all three groups does not show significant differences in pairs of particular subgroups, which may be an important information. Analysis of differences’ significance was also enriched with the analysis of ratings of particular attributes in public and private universities, as well as for different types of habilitation (Table 6). The results of this analysis made it possible to observe significant differences between the average rating of general job satisfaction for all academic degrees and titles (p < 0.01).
Using the descriptive analysis of the obtained ratings (Table 7), one can state that the level of one’s own satisfaction with scientific work is differently assessed by doctors (6.51 ± 1.96), habilitated doctors (6.99 ± 1.73), and professors (7.88 ± 1.65).
When analyzing the satisfaction ratings from particular elements that have influence on the general satisfaction with scientific work in the studied subgroups, a significantly different rates were noted in the cases of assessments concerning the remuneration of doctors and professors (p = 0.004). Satisfaction with remuneration for doctors is 4.67 ± 2.36, and for professors, it is 5.61 ± 2.61. Habilitated doctors are intermediately satisfied with their remuneration (5.07 ± 2.34).
In turn, when it comes to the assessment of satisfaction with teaching, significant differences can be noted between habilitated doctors and professors (p = 0.012). Professors are much more satisfied with the possibility of teaching (7.24 ± 2.06) than habilitated doctors (6.46 ± 2.24).
The differences of assessments of satisfaction with research work in other subgroups are also interesting. Significant differences were present among doctors and habilitated doctors (p = 0.012) and between doctors and professors (p = 0.006). Those with doctoral degrees rated the possibility of research work lower (7.02 ± 2.24) than habilitated doctors (7.61 ± 1.91) and professors (7.87 ± 1.77). Among the results for the two last groups, there are no statistically significant differences (p = 0.455).
Interesting is the satisfaction coming from work with students. This satisfaction was rated the lowest by habilitated doctors (7.16 ± 1.63), whose average rate is significantly lower than the assessment of doctors (7.62 ± 1.76) (p < 0.001). In turn, when it comes to the satisfaction with the teaching level, significant differences can be noted between doctors and professors (p = 0.008). Professors rate the teaching level higher (7.07 ± 1.90) than doctors (6.48 ± 1.89).
In the case of the assessment of satisfaction of university prestige where the respondents work, significant differences were noted between professors and the two remaining subgroups, that is, doctors (p < 0.001) and habilitated doctors (p < 0.001). Professors rate the prestige of their universities higher, at the level of 7.16 ± 1.90, while doctors rate it at the level of 6.08 ± 2.06. Habilitated doctors are in the middle with the rating at the level of 6.24 ± 2.11. Similarly, in the case of satisfaction with work control, the assessment of professors is significantly higher (6.01 ± 2.52) than in other groups, as doctors rated satisfaction with this element at the level of 4.89 ± 2.41, while habilitated doctors rated it at the level of 5.12 ± 2.21. Similarly, the autonomy of scientific work was rated the lowest by doctors (6.53 ± 2.54), and significantly higher by professors (7.57 ± 2.21). Intermediate rates were given by habilitated doctors (7.16 ± 2.23). The level of differences between the average rates can be explained by statistically significant difference between the results of doctors and other subgroups of respondents (p < 0.02).
Satisfaction with work organization at the university received the highest notes from professors (6.23 ± 2.59)—it is a significantly higher rating (p < 0.05) than the one observed with the doctors (5.21 ± 2.44) and habilitated doctors (5.54 ± 2.47).
What can be noticed is the significantly lower satisfaction of doctors (p = 0.024) concerning the rules for carrying out research work at the university (4.46 ± 2.33) as compared with the satisfaction of habilitated doctors (4.99 ± 2.23), who rated this aspect the highest (slightly higher than professors, who gave a rate at the level of 4.97 ± 2.51).
When dividing respondents according to the manner of being awarded their habilitated doctor degree, it was noted that statistically significant differences concern people who were awarded this degree abroad. This applies to, for example, satisfaction with teaching, which was rated higher by habilitated doctors who were granted their degree abroad (8.57) than those who were awarded in Poland (6.34 ÷ 6.44). Differences were noted also in the case of assessment of satisfaction with rules for carrying out academic research (p = 0.035) and of cooperation with students (p = 0.027). In both cases, higher rates were given by academics who were habilitated abroad.
Thus, the level of satisfaction with scientific work can be assessed according to Table 8. The average rating of general satisfaction with scientific work is 6.84 ± 1.91, while every second respondent gave a rating at the level of 7 or more, and every fourth at the level of 8 or more. In general, the satisfaction level was around 7, on a scale from 1 to 10. A quite low variability of this phenomenon in the studied group of academics (27.95%) was noticed. In the case of general assessment of satisfaction with the level of received remuneration, an average rate amounting to 4.92 ± 2.41 was obtained. It is, therefore, a rate below average (in the adopted scale of 5.5). In general, the respondents gave a rating of 5, even though every fourth respondent rated their remuneration at 3 or less. In this case, variability of this phenomenon was twice as high as in the case of assessment of general satisfaction (48.95%). Assessment of satisfaction with scientific work, teaching, and administrative work was varied, but between scientific work and teaching, the differences were small (±1 point). Usually, satisfaction with teaching and scientific work was given the rating of 8. Other conclusions must be drawn in the case of administrative work, which is characterized by a high differentiation among ratings. In this case, the dominant rate was the lowest possible one, meaning 1 point.
The work of secretariats of institutions, departments, and units was assessed at the level of 4.94 ± 2.83, meaning below the average of possible rating. Differentiation of ratings in this aspect of satisfaction was rated at the level of 57.40%. It is worth noting that multiple cases of rating gradation for particular aspects of scientific work in line with subsequent academic degrees suggest the presence of dependencies between a degree and the assessment of particular attributes of scientific practice. It can be the assessment of the level of teaching, as well as of the prestige of the university and of the autonomy of work that indicates (yet unconfirmed in terms of quantity) a positive dependency, as well as of the level of stress and diseases that is characterized by negative dependency.
Assessment of other aspects of scientific work is described in the Table 9. The studied academics rated the satisfaction of cooperation with students quite high (7.46 ± 1.73). The dominant group gave a rating of 8. What was also noted was the lowest variability of assessments as compared with other analyzed features (23.18%). Slightly lower rates, as compared with cooperation with students, were given to the level of teaching at the departments or the universities. It was 6.63 ± 1.87. The ratings at the level of 8 dominated. A similar result was obtained when analyzing the average level of satisfaction with prestige of the department or of the university—it amounted to 6.29 ± 2.08. Here, we can observe the highest volatility of results. Assessment of satisfaction with scientific work control stayed at an average level of 5.12 ± 2.40. The dominant rating is also 5. What is surprising is the assessment of autonomy of research work, which amounts to 6.86 ± 2.44, which, of course, is an average result between the varied assessments of doctors, habilitated doctors, and professors. Satisfaction with organization of scientific work was assessed at an average level (5.46 ± 2.49), and the dominating rating was 5. Slightly lower rates were given to the rules for carrying out the research (4.69 ± 2.34), but, in this case, the variability of this factor is the highest (49.93%).
The respondents could also select other factors and fill in the list of partial factors. The notes left in the comments were varied, but from among the most often mentioned factors influencing the level of satisfaction of scientific work are:
  • Low remuneration with exceeded work load;
  • Necessity to devote one’s free time to scientific work;
  • Instability of employment at the university (lack of employment security, lack of employment safety, lack of creditworthiness, and lack of possibility of developing family life);
  • Lack of link between the achievements (in teaching, research, and organizational work) with the level of remuneration;
  • Nepotism, mobbing, relations of interdependence based on connections and not on achievements, promotion of employees not grounded in these employees’ achievements.
  • Possibility of personal accomplishments and scientific development.
The analysis also took into account the assessment of correlation of studied ratings. Dependencies noted between the features are varied. When analyzing the strength and direction of correlations and the level of significance of the correlation coefficient (p < 0.05), it was noted that there is a significant (p = 0.019) yet moderate linear correlation (r = 0.306) between the average remuneration and the level of satisfaction with scientific work. This correlation is positive, which means that along with the increase of remuneration, the satisfaction with scientific work also increases. This result is confirmed by correlation between the assessment of general satisfaction with scientific work together with the assessment of satisfaction with remuneration (r = 0.469; p < 0.001).
Even greater dependency is present between the assessment of general satisfaction with scientific work and the satisfaction with teaching (r = 0.729; p < 0.001), as well as satisfaction with scientific work (r = 0.480; p < 0.001), assessment of work organization (r = 0.599; p < 0.001), and rules concerning research (r = 0.571; p < 0.001). All identified correlations are positive, which means that the higher assessment of each variable is accompanied with a higher assessment of general scientific work. Significant dependencies were observed between general assessment of the satisfaction with scientific work, the assessment of secretariat (r = 0.514; p < 0.001), and the level of teaching (r = 0.496; p < 0.001), as well as autonomy of work (r = 0.427; p < 0.001). The high correlation of all partial factors (apart from one) with the assessment of the general satisfaction with scientific work is a proof of the significant role of the mentioned partial factors when explaining the manner of assessment of scientific work. One factor that was not significantly correlated was the assessment of work control (r = 0.178; p = 0.177).
Unfortunately, some of the partial factors were also correlated with each other, which means that they can explain the same area of variability of reference measurement that is the general assessment of satisfaction with scientific work.
Additionally, an assessment of the influence of particular intercorrelated features with the general assessment of satisfaction with scientific work was made. By calculating the determination coefficient for the obtained correlation coefficients and standardizing them for the purpose of a limited list of explaining variables, the level at which each of the variables explains the observed variability of general satisfaction was obtained. Thus, it can be indicated that the greatest influence on the perceived satisfaction with scientific work is from teaching and contact with students, which is a result partially convergent with the previously obtained feedback, as, so far, the scientific work was the highest rated among the respondents. However, factor analysis also proves that both factors—teaching and research—play an important role in the perception of satisfaction with scientific work.
It is worth noting that, in this approach, the most influential characteristics are the level of remuneration and then the possibility of research work. Moreover, a huge significance of the research work and the level of teaching assessment at the university employing the researcher as well as assessment of work organization and possibility of teaching can be noticed. These factors significantly influence the general assessment of the satisfaction with scientific work.
Effect size as a quantitative measure of the magnitude of a phenomenon has been included here in the form of correlation analysis measures and the significance of differences between the means. It is worth noting that the analyzed groups agree on many issues, although, in the case of overall job satisfaction, the calculations showed significant differences. This is particularly posed by the ANOVA analysis, which is designed to analyze the differences between more than two groups.

5.4. Salary of a Researcher

The respondents were asked again about their remuneration. This time, however, they were not asked about the level of satisfaction with the received remuneration nor about its role in the general satisfaction with scientific work. They were asked about the value of their basic monthly net income in PLN.
The descriptive analysis allowed us to state that the average basic remuneration of a researcher amounts to 4372.28 ± 1920.03 PLN (6181 PLN gross), meaning around 1048.51 ± 460.44 EUR or 1285.96 ± 564.72 USD (the values of remuneration were calculated using EUR and USD exchange rates as on the day of the research (1 EUR = 4.17 PLN, 1 USD = 3.40 PLN); the country’s average as of 2018 was 3530 PLN net and 4973 PLN gross). This is, therefore, 24% more than the country’s average. Unfortunately, the given information was too general to be used as a reference; that is why the analysis was enriched with the average remuneration values for particular subgroups.
The first division concerns academic degrees. In accordance with Table 7, it was stated that:
  • Doctors employed at the universities receive average remuneration at the level of 3434.78 ± 1002.48 PLN (4832 PLN gross) (meaning 823.69 ± 240.40 EUR);
  • Habilitated doctors receive, on average, 5154.93 ± 1450.34 PLN (7303 PLN gross) (meaning 1236.19 ± 347.80 EUR);
  • Professors earn, on average, 7015.63 ± 2126.61 PLN (9972 PLN gross) (meaning 1682.40 ± 509.98 EUR).
The remuneration as compared with different age ranges was also analyzed. The rate of average remuneration increases with the age of the respondents. This phenomenon is almost linear, thanks to which we know that, with every five-year period, the average remuneration of a researcher increases by approximately 520.40 PLN. The average monthly net remuneration increases until the age of 40 approximately by 800 PLN every five years, and then, until the age of 65, the increase rate is slower and amounts 300 PLN every five years. After turning 65, the remuneration of the employed researchers increases, on average, by approximately 1000 PLN every five years. It results mostly from the retirement age and from the rights to pension, which is often accompanied by a position at the university.
The research indicated that the average net remuneration for particular positions is as follows:
  • Assistant (holding a PhD degree)— 3000.00 ± 800.00 PLN, meaning around 719 EUR;
  • Senior lecturer—3357.16 ± 951.19 PLN, meaning around 805 EUR,
  • Assistant professor—3788.08 ± 1220.58 PLN, meaning around 908 EUR,
  • Associate professor—5652.63 ± 1412.47 PLN, meaning around 1355 EUR,
  • Full professor—7020.83 ± 3145.34 PLN, meaning around 1684 EUR.

6. Discussions and Conclusions

When summing up the key issues associated with the satisfaction with scientific work, several interesting conclusions may be drawn up that helped to develop and perform the research on this issue. First, several selected literature references must be quoted that summarize the discussed issues [61].
In Poland, research on satisfaction of employees of universities was carried out, among others, at Poznań University of Economics and Business, where it was indicated that university teachers and servicing staff are characterized by higher than the average level of satisfaction with work than people working, for example, in administration. The factor that positively influences the satisfaction of academic staff was the feeling that their work is appreciated, while a factor that has a negative influence (similarly to in the case of international research [116]) was the excessive load of teaching and administrative tasks. Moreover, it was indicated that the level of satisfaction increases together with the job seniority [91]. In this research, however, the aspect associated with the direct influence on the health of the researcher was omitted.
When analyzing the issue of general satisfaction with work (without the focus on scientific work) it was noted that the factors that influence the satisfaction with work are, for example, sex, level of remuneration, stress at work, and many years’ experience in teaching [69]. Satisfaction with work is associated with one’s own psychological resources: The perception of one’s own effectiveness, hope, optimism, and resilience to stress [73]. The research indicates that satisfaction with work based on using personality resources translates into the decrease of professional burnout at work, as well as of the general levels of stress and depression symptoms [69]. The difference in remuneration may also be a reason for dissatisfaction with performed work; the productivity and satisfaction decrease together with the increase of disproportion among remunerations [99]. On the other hand, one can also quote results of other research that indicated that the level of satisfaction of researchers results, first of all, from the prestige and respect associated with this profession, rather than from the remuneration and promotion possibility [72].
Another factor that is of importance in the case of satisfaction is time. Research carried out in more than two thousand English institutions dealing with higher education indicates a negative dependency between the number of hours worked and the satisfaction with work. The same source also states that the time spent on research has a positive influence on the general satisfaction with work, as opposed to administrative work.
To discuss the issues analyzed in the research carried out by the authors among Polish researchers, one can propose several conclusions that verify the proposed working hypothesis. The statistical analysis of the performed research allowed us to state that:
  • The level of satisfaction of researchers concerning their own scientific work depends on employment conditions (that is, remuneration level, stability of employment), as well as the social significance of the research carried out (H1).
  • The level of satisfaction from work is closely correlated with the scientific opportunities of researchers (that is, the possibility of academic and didactic work, contact with students and co-workers) and negatively correlated with the necessity to carry out administrative work (H2).
  • The majority of Polish researchers are proud of their scientific achievements and treat their profession as a passion or vocation (H3).
Among the factors that influenced the level of satisfaction with scientific work, one can distinguish the following factors:
  • Negative (weak points or disadvantages of scientific work), meaning: The necessity to carry out administrative work and the lack of possibility to work at more than one full-time position.
  • Neutral (ambiguous), meaning the manner in which the work is appreciated by the supervisors and the amount of received remuneration.
  • Positive (advantages), meaning the possibility to carry out research and scientific work, understood as writing articles, books, and reviews and to carry out research, the possibility of teaching, the possibility of participating in conferences, symposiums, and seminars, the possibility of being employed for an indefinite period (stability of employment), the possibility of maintaining relations with supervisors, the possibility of strengthening the relations with co-workers, assigned classes, free time (between classes and during holidays), and the possibility of establishing relations with students.
Unfortunately, most often, the factors were indicated as opportunities that are not fully used by the employers; therefore, this is a mismatch of requirements in the set ranges. This refers particularly to free time, which is usually used for other types of paid employment due to the insufficient remuneration at the university, or for research works, which are supposed to increase the chances of another academic degree or a promotion. These are usually works carried out outside the university (at home, in the library, etc.).
Being awarded another academic degree is associated with evident financial improvement (as, on average, with each academic degree, the basic (net) remuneration increases by approximately 2 thousand PLN or 480 EUR), as with the increase of the level of perceived respect coming from the environment. Unfortunately, more than every second person also noticed deterioration of health, which they associate with negative factors of participation in the scientific procedure that will give them the next academic degree. This is the standing of more than every fourth respondent (27.8%), and nearly the same number (28.3%) only partially explain the deterioration of health by citing the difficulties of attaining the next academic degree.
As many as 95.5% of researchers claim that their scientific work is not only their work, but also their passion (their vocation). Almost 40% of respondents cannot imagine any other professional work, while the remaining percentage of 44.9% agree only partially, not excluding the possibility of changing their work under certain conditions. A total of 95.4% of respondents claimed that their research work is beneficial for the society, while a majority (52.6%) agreed only partially. The feeling of meaningfulness towards one’s own work is associated with pride and satisfaction with one’s own scientific achievements. A total of 37.6% of respondents are proud and satisfied of their achievements, and 55.8% of respondents are partially satisfied and proud.
The general assessment of the satisfaction with scientific work (rated on a scale from 1 to 10) was defined at the level 6.84 ± 1.91. One of the features that scored the lowest in terms of job satisfaction is the level of remuneration (4.92 ± 2.41). From among the three used forms of work at a university (that is, teaching, administration, and research and scientific works), the lowest satisfaction came from administrative work (2.9 ± 2.09). Then, the satisfaction coming from teaching was rated at the level of 6.81 ± 2.29. The highest rated was scientific and research work (7.31 ± 2.11).
To summarize the obtained results of literature and empirical research conducted among randomly chosen Polish researchers in a representative research sample, it can be stated that satisfaction with scientific work in Poland is quite high, paying attention to the lack of adjustment in the scope of remuneration and job stability. It seems that this results from the approach and values of researchers in Poland. This is evident thanks to the fact that the research work is something more than just work; it is defined as a mission (vocation), which is a source of pride and satisfaction that can be beneficial for the society. It does not seem probable that it will not serve the development of science in Poland, as the next generations may not be willing to carry out research work idealistically (as a vocation) to serve the society. The lack of proper recognition of scientific work, imposing further administrative duties, and increasing the work load without the increase of remuneration for the additional work can lead to the decrease of the research level in Poland. What is important is also the introduction of unconsidered changes by particular universities, which aim directly at the employees (for example, differentiation between universities in the amount of tax-deductible expenses). Such pathologies as office politics, corruption in the form of academic titles, nepotism, and unfair research practices (using administrative workers as ghostwriters) noticed at many Polish universities are other downsides that discourage the researchers from taking up diligent scientific work and teaching. Therefore, it seems that the activities taken up to increase both the prestige of researchers and recognition of teaching, research, and scientific work are necessary.

Author Contributions

Conceptualization, A.R.S. and R.W.; methodology, A.R.S. and R.W.; software, A.R.S. and R.W.; validation, A.R.S. and R.W.; formal analysis, A.R.S. and R.W.; investigation, A.R.S. and R.W.; resources, A.R.S. and R.W.; data curation, A.R.S. and R.W.; writing—original draft preparation, A.R.S. and R.W.; writing—review and editing, A.R.S.; visualization, A.R.S. and R.W.; supervision, A.R.S. and R.W.; project administration, A.R.S.; funding acquisition, A.R.S. All authors have read and agreed to the published version of the manuscript.

Funding

This research received funding from the National Science Center in Poland.

Acknowledgments

This paper was published as part of the research project “A business model for health resort enterprises” No. 2017/25/B/HS4/00301, supervised and financed by the National Science Center in Poland and as part of statutory research No. 13/010/BK_20/0042 at the Silesian University of Technology, Faculty of Organization and Management.

Conflicts of Interest

The authors declare no conflict of interest. The funders had no role in the design of the study; in the collection. analyses. or interpretation of data; in the writing of the manuscript. or in the decision to publish the results.

References

  1. Winefield, A.H.; Jarrett, R.J. Occupational stress in university staff. Int. J. Stress Manag. 2001, 8, 285–298. [Google Scholar] [CrossRef]
  2. Shen, X.; Yang, Y.L.; Wang, Y.; Liu, L.; Wang, S.; Wang, L. The association between occupational stress and depressive symptoms and the mediating role of psychological capital among Chinese university teachers: A cross-sectional study. BMC Psychiatry 2014, 14, 329. [Google Scholar] [CrossRef] [Green Version]
  3. Christen, M.; Iyer, G.; Soberman, D. Job satisfaction, job performance, and effort: A reexamination using agency theory. J. Mark. 2006, 70, 137–150. [Google Scholar] [CrossRef]
  4. Hirschfeld, R.R. Does revising the intrinsic and extrinsic subscales of the Minnesota satisfaction questionnaire short form make a difference? Educ. Psychol. Meas. 2000, 60, 255–270. [Google Scholar] [CrossRef]
  5. European Commision. Communication from the commission to the European Parliament. In The Council, the European Economic and Social Committee and the Committee of the Regions on a Renewed EU Agenda for Higher Education; European Commision: Brussels, Belgium, 2017. [Google Scholar]
  6. Kwiek, M. Knowledge Production in European Universities. States, Markets, and Academic Entrepreneurialism; Peter Lang: Frankfurt, Germany; New York, NY, USA, 2013. [Google Scholar]
  7. Kwiek, M. From system expansion to system contraction: Access to higher education in Poland. Comp. Educ. Rev. 2013, 3, 553–576. [Google Scholar] [CrossRef] [Green Version]
  8. Kwiek, M. Changing higher education policies: From the deinstitutionalization to the reinstitutionalization of the research mission in Polish universities. Sci. Public Policy 2012, 5, 641–654. [Google Scholar] [CrossRef] [Green Version]
  9. Kwiek, M. Structural changes in the Polish higher education system (1990–2010): A synthetic view. Eur. J. High. Educ. 2014, 3, 266–280. [Google Scholar] [CrossRef] [Green Version]
  10. Kwiek, M.; Antonowicz, D. Academic work, working conditions and job satisfaction. In The Work Situation, the Views and the Activities of the Academic Profession: Findings of a Questionnaire Survey in Twelve European Countries; Teichler, U., Hohle, E.A., Eds.; Springer: Dordrecht, The Netherlands, 2013; pp. 37–54. [Google Scholar]
  11. Kwiek, M.; Kurkiewicz, A. The Modernisation of European Universities: Cross-National, Academic Perspectives; Peter Lang: Frankfurt, Germany; New York, NY, USA, 2012. [Google Scholar]
  12. Afonso, A. Varieties of Academic Labor Markets in Europe. Political Sci. Politics 2016, 4, 516–821. [Google Scholar] [CrossRef]
  13. Boer, H.; File, J.; Huisman, J.; Seeber, M.; Vukasovic, M.; Westerheijden, D.F. Policy Analysis of Structural Reforms in Higher Education: Prosesses and Outcomes; Palgrave Studies in Global Higher Education; Springer: Dordrecht, The Netherlands, 2017. [Google Scholar]
  14. Kwiek, M.; Antonowicz, D. The Changing Paths in Academic Careers in European Universities: Minor Steps and Majore Milestones. In Academic Work and Careers in Europe: Trends, Challenges, Perspectives; Fumasoli, T., Goastellec, G., Kehm, B., Eds.; Springer: Dordrecht, The Netherlands, 2015. [Google Scholar]
  15. Kyvik, S. The Dynamic of Change in Higher Education. Expansion and Contraction in an Organisational Field; Springer: Dordrecht, The Netherlands, 2009. [Google Scholar]
  16. Kyvik, S.; Lepori, B. The Research Mission of Higher Education Institutions outside the University Sector: Striving for Differentiation; Springer: Dordrecht, The Netherlands, 2010. [Google Scholar]
  17. Frølich, N.; Wendt, K.K.; Reymert, I.; Tellmann, S.M.; Elken, M.; Kyvik, S.; Vabø, A.; Larsen, E. Academic Career Structures in Europe: Perspectives from Norway, Denmark, Sweden, Finland, The Netherlands, Austria and the UK; NIFU: Oslo, Norway, 2018. [Google Scholar]
  18. Locke, W. Changing Governance and Management in Higher Education. In The Changing Academy–The Changing Academic Profession in International Comparative Perspective 2; Springer Science & Business Media: Berlin, Germany, 2011. [Google Scholar]
  19. European Commission. Modernisation of Higher Education in Europe: Academic Staff; European Commission: Brussels, Belgium, 2017.
  20. Olsen, T.B.; Kyvik, S.; Hovdhaugen, E. The Promotion to Full Professor—Through Competition or by Individual Competence? Tert. Educ. Manag. 2005, 4, 299–316. [Google Scholar] [CrossRef]
  21. Altbach, P.G. Building an academic career. A Twenty first century challenge. In Young Faculty in the Twenty First Century: International Perspectives; Yudkevich, M., Altbach, P.G., Rumbley, L.E., Eds.; SUNY Press: New York, NY, USA, 2015; pp. 5–20. [Google Scholar]
  22. Henningsson, M.; Jörnesten, A.; Geschwind, L. Translating tenure track into Swedish tensions when implementing an academic career system. Stud. High. Educ. 2018, 43, 1215–1226. [Google Scholar] [CrossRef]
  23. Brechelmacher, A.; Park, E.; Ates, G.; Campbell, D.F.J. The rocky road to tenure—Career paths in academia. In Academic Work and Careers in Europe: Trends, Challenges, Perspectives; Fumasoli, T., Goastellec, G., Kehm, B., Eds.; Springer: Dordrecht, The Netherlands, 2015. [Google Scholar]
  24. 1940 Statement of Principles on Academic Freedom and Tenure. Available online: https://www.aaup.org/report/1940-statement-principles-academic-freedom-and-tenure (accessed on 6 May 2018).
  25. Schuster, J.H.; Finkelstein, M.J. The American Faculty: The Restructuring of Academic Work and Careers; The Johns Hopkins University Press: Baltimore, MD, USA, 2006. [Google Scholar]
  26. Weineck, S.B.; Koelblinger, D.; Kiesslich, T. Medizinische Habilitation im deutschsprachigen Raum [Medical habilitation in German-speaking countries]. Der. Chirurg. 2015, 4, 355–365. [Google Scholar] [CrossRef] [PubMed]
  27. Fleck, C. Sociology in Austria; Palgrave Macmillan: London, UK, 2015. [Google Scholar]
  28. German Debate about the Habilitation. Available online: http://www.liquisearch.com/habilitation/german_debate_about_the_habilitation (accessed on 6 May 2018).
  29. The Path to Peofessorship. Available online: https://www.research-in-germany.org/en/jobs-and-careers/info-for-postdocs-and-junior-researchers/career-paths/path-to-professorship.html (accessed on 6 May 2018).
  30. Strike, T. Evolution in Academic Career Structures in English Universities. 2018. Available online: https://www.google.pl/url?sa=t&rct=j&q=&esrc=s&source=web&cd=1&cad=rja&uact=8&ved=0ahUKEwi_uL7H1fHaAhVywqYKHQwdDQoQFggrMAA&url=http%3A%2F%2Fsearch.oecd.org%2Feducation%2Fimhe%2F35322758.pdf&usg=AOvVaw0_PKRKVOMvsRWODqAqr0tt (accessed on 6 May 2018).
  31. Altbach, P.G.; Reisberg, L.; Yudkevich, M.; Androushchak, G.; Pacheco, I.F. Paying the Professoriate: A Global Comparison of Compensation and Contracts; Routledge: New York, NY, USA, 2012. [Google Scholar]
  32. Fumasoli, T.; Goastellec, G.; Kehm, B. Academic Careers and work in Europe: Trends, challenges, perspectives. In Academic Work and Careers in Europe: Trends, Challenges, Perspectives; Fumasoli, T., Goastellec, G., Kehm, B., Eds.; Springer: Dordrecht, The Netherlands, 2015. [Google Scholar]
  33. Bentley, P.J.; Kyvik, S. Academic work from a comparative perspective: A survey of faculty working time across 13 countries. High. Educ. 2012, 63, 529–547. [Google Scholar] [CrossRef]
  34. European Commission. The European Charter for Researchers. In The Code of Conduct for the Recruitment of Researchers; European Commission: Brussels, Belgium, 2005. [Google Scholar]
  35. Vabø, A.; Ramberg, I. Arbeidsvilkår i Norsk Forskning; NIFU: Oslo, Norway, 2009. [Google Scholar]
  36. Holmberg, D.; Hallonsten, O. Policy Reform and academic drift: Research mission and institutional legitimacy in the development of the Swedish higher education system 1977–2012. Eur. J. Educ. 2015, 2, 181–196. [Google Scholar] [CrossRef] [Green Version]
  37. European Commission. Support for Continued Data Collection and Analysis Concerning Mobility Patterns and Career Paths of Researchers; Remuneration—Cross-Country Report (WP4); European Commission: Brussels, Belgium, 2013.
  38. Czaja, S.J.; Charness, N.; Fisk, A.D.; Hertzog, C.H.; Nair, S.N.; Rogers, W.A.; Sharit, J. Factors predicting the use of technology: Findings from the Center for Research and Education on Aging and Technology Enhancement (CREATE). Psychol. Aging 2006, 21, 333. [Google Scholar] [CrossRef] [PubMed] [Green Version]
  39. Moret-Tatay, C.; Beneyto-Arrojo, M.J.; Gutierrez, E.; Boot, W.R.; Charness, N. A Spanish Adaptation of the Computer and Mobile Device Proficiency Questionnaires (CPQ and MDPQ) for Older Adults. Front. Psychol. 2019, 10, 1165. [Google Scholar] [CrossRef]
  40. Moret-Tatay, C.; Murphy, M. Aging in the digital era. Front. Psychol. 2019, 10, 1815. [Google Scholar] [CrossRef]
  41. Minello, A. The pandemic and the female academic. Nature 2020. [Google Scholar] [CrossRef]
  42. American Association of University Professors. Available online: https://www.eui.eu/Documents/MWP/AcademicCareers/Countries/USA/AAUPSalaries.pdf (accessed on 6 May 2018).
  43. Hoppock, R. Job Satisfaction; Harper and Brothers: New York, NY, USA, 1935. [Google Scholar]
  44. Vroom, V.H. Work and Motivation; John Wiley and Sons: New York, NY, USA, 1964. [Google Scholar]
  45. Davis, K.; Nestrom, J.W. Human Behavior at Work: Organizational Behavior, 7th ed.; McGraw Hill: New York, NY, USA, 1989. [Google Scholar]
  46. Statt, D. The Routledge Dictionary of Business Management, 3rd ed.; Routledge Publishing: Detroit, MI, USA, 2004. [Google Scholar]
  47. Mullins, J.L. Management and Organizational Behavior, 7th ed.; Pearson Education Limited: Essex, UK, 2007. [Google Scholar]
  48. Armstrong, M. A Handbook of Human Resource Management Practice, 10th ed.; Kogan Page: London, UK, 1985. [Google Scholar]
  49. Kaliski, B.S. Encyclopedia of Business and Finance, 2nd ed.; Thompson Gale: Detroit, MI, USA, 2007. [Google Scholar]
  50. George, J.M.; Jones, G.R. Understanding and Managing Organizational Behavior, 5th ed.; Pearson/Prentice Hall: Upper Saddle River, NJ, USA, 2008. [Google Scholar]
  51. Aziri, B. Menaxhimi i burimeve njerëzore. In Satisfaksioni nga Puna dhe Motivimi i Punëtorëve; Tringa Design: Gostivar, North Macedonia, 2008. [Google Scholar]
  52. Robbins, S.P. Organizational Behavior; Pearson: London, UK, 2010. [Google Scholar]
  53. Aziri, B. Job satisfaction a literature review. Manag. Res. Pract. 2011, 3, 77–86. [Google Scholar]
  54. Austin, A.W.; Wissmann, T.; von Kanel, R. Stress and hemostasis: An update. Semin. Thromb. Hemost. 2013, 39, 902–912. [Google Scholar] [CrossRef] [Green Version]
  55. Nella, D.; Panagopoulou, E.; Galanis, N.; Montgomery, A.; Benos, A. Consequences of Job Insecurity on the Psychological and Physical Health of Greek Civil Servants. Biomed. Res. Int. 2015, 673, 623. [Google Scholar] [CrossRef] [PubMed]
  56. Pan, B.; Shen, X.; Liu, L.; Yang, Y.; Wang, L. Factors Associated with Job Satisfaction among University Teachers in Northeastern Region of China: A Cross-Sectional Study. Int. J. Environ. Res. Public Health 2015, 12, 12761–12775. [Google Scholar] [CrossRef] [PubMed] [Green Version]
  57. Punnett, L.; Warren, N.; Henning, R.; Nóbregę, S.; Cherniack, M. CPH-NEW Research Team. Participatory ergonomics as a model for integrated programs to prevent chronic disease. J. Occup. Environ. Med. 2013, 55, 19–24. [Google Scholar] [CrossRef] [PubMed]
  58. Roberts, R.K.; Grubb, P.L. The consequences of nursing stress and need for integrated solutions. Rehabil. Nurs. 2014, 39, 62–69. [Google Scholar] [CrossRef] [PubMed] [Green Version]
  59. Usop, A.M.; Askandar, D.K.; Langguyuan-Kadtong, M. Work performance and job satisfaction among teachers. Int. J. Humanit. Soc. Sci. 2013, 3, 245–252. [Google Scholar]
  60. Ogłodek, E.; Szromek, A. Satysfakcja z pracy naukowej—Przegląd badań. Zesz. Nauk. Politech. Śląskiej Ser. Organ. Zarządzanie 2017, 105, 293–306. [Google Scholar]
  61. Sun, W.; Wu, H.; Wang, L. Occupational stress and its related factors among university teachers in China. Occup. Health 2011, 53, 280–286. [Google Scholar] [CrossRef] [Green Version]
  62. Ge, C.; Fu, J.; Chang, Y.; Wang, L. Factors associated with job satisfaction among Chinese community health workers: A cross-sectional study. BMC Public Health 2011, 11, 884. [Google Scholar] [CrossRef] [Green Version]
  63. Borowska-Pietrzak, A. Dezagregacja czynników w modelu poczucia satysfakcji zawodowej. Nauk. Zarządzaniu 2014, 18, 9–22. [Google Scholar] [CrossRef] [Green Version]
  64. Bozeman, B.; Gaughan, M. Job Satisfaction among University faculty: Individual, Work, and Insitutional Determinants. J. High. Educ. 2011, 82, 154–186. [Google Scholar] [CrossRef]
  65. Kerr, J.L.; Dattilo, J.; O’Sullivan, D. Use of recreation activities as positive coping with chronic stress and mental health outcomes associated with unemployment of people with disabilities. Work 2012, 43, 279–292. [Google Scholar] [CrossRef]
  66. Qayyum, A. Job satisfaction of university teachers across the demographics. Bull. Educ. Res. 2013, 35, 1–15. [Google Scholar]
  67. Clark, A.; Oswald, A.; Warr, P. Is job satisfaction U-shaped in age? J. Occup. Organ. Psychol. 1996, 69, 57–81. [Google Scholar] [CrossRef] [Green Version]
  68. Luthans, F.; Avey, J.B.; Patera, J.L. Experimental analysis of a web-based training intervention to develop positive psychological capital. AMLE 2008, 7, 209–221. [Google Scholar] [CrossRef] [Green Version]
  69. Tugade, M.M.; Fredrickson, B.L.; Barrett, L.F. Psychological resilience and positive emotional granularity: Examining the benefits of positive emotions on coping and health. J. Pers. 2004, 72, 1161–1190. [Google Scholar] [CrossRef]
  70. Yuan, L.; Xie, C.; Xie, F.S. An investigation and analysis of the teachers job satisfaction in higher education. J. Educ. Sci. Hunan Norm. Univ. 2006, 3, 103–106. [Google Scholar]
  71. Oshagbemi, T. Personal correlates of job satisfaction: Empirical evidence from UK universities. Int. J. Soc. Econ. 2003, 30, 1210–1232. [Google Scholar] [CrossRef]
  72. Voltmer, E.; Rosta, J.; Siegrist, J.; Aasland, O.G. Job stress and job satisfaction of physicians in private practice: Comparison of German and Norwegian physicians. Int. Arch. Occup. Environ. Health 2012, 85, 819–828. [Google Scholar] [CrossRef]
  73. Al-Smadi, M.S.; Qblan, Y.M. Assessment of Job Satisfaction among Faculty Members and its Relationship with Some Variables in Najran University. J. Educ. Prac. 2015, 6, 117–124. [Google Scholar]
  74. Du, P.; Lai, M.H.; Lo, L.N.K. Analysis of job satisfaction of university professors from nine Chinese universities. Front. Educ. China 2010, 5, 430–449. [Google Scholar] [CrossRef]
  75. Fogarty, L.; Kim, Y.M.; Juon, H.S.; Tappis, H.; Noh, J.W.; Zainullah, P.; Rozario, A. Job satisfaction and retention of health-care providers in Afghanistan and Malawi. Hum. Resour. Health 2014, 12, 1–7. [Google Scholar]
  76. Fu, J.; Sun, W.; Wang, Y.; Wang, L. Improving job satisfaction of Chinese doctors: The positive effects of perceived organizational support and psychological capital. Public Health 2013, 127, 946–951. [Google Scholar] [CrossRef]
  77. Tam, V.W.Y.; Zeng, S.X. Employee job satisfaction in engineering firms. Eng. Constr. Archit. Manag. 2014, 21, 353–368. [Google Scholar] [CrossRef]
  78. Abouserie, R. Stress, Coping Strategies and Job Satisfaction in University Academic Staff. Educ. Psychol. 1996, 1, 49–56. [Google Scholar] [CrossRef]
  79. Tsai, Y. Relationship between Organizational Culture, Leadership Behavior and Job Satisfaction. BMC Health Serv. Res. 2011, 11, 98. [Google Scholar] [CrossRef] [PubMed] [Green Version]
  80. Guan, X.; Sun, T.; Hou, Y.; Zhao, L.; Luan, Y.Z.; Fan, L.H. The relationship between job performance and perceived organizational support in faculty members at Chinese universities: A questionnaire Survey. BMC Med. Educ. 2014, 14, 1–7. [Google Scholar] [CrossRef] [PubMed] [Green Version]
  81. Fiabane, E.; Giorgi, I.; Musian, D.; Sguazzin, C.; Argentero, P. Occupational stress and job satisfaction of healthcare staff in rehabilitation units. Med. Lav. 2012, 103, 482–492. [Google Scholar] [PubMed]
  82. Nojani, M.I.; Arjmandnia, A.A.; Afrooz, G.A.; Rajabi, M. The study on relationship between organizational justice and job satisfaction in teachers working in general, special and gifted education systems. Procedia Soc. Behav. Sci. 2012, 46, 2900–2905. [Google Scholar] [CrossRef] [Green Version]
  83. Sharp, T.P. Job satisfaction among psychiatric registered nurses in New England. J. Psychiatr. Ment. Health Nurs. 2008, 15, 374–378. [Google Scholar] [CrossRef]
  84. Shen, Y.; Jackson, T.; Ding, C.; Yuan, D.H.; Zhao, L.; Dou, Y.L.; Zhang, Q.L. Linking perceived organizational support with employee work outcomes in a Chinese context: Organizational identification as a mediator. Eur. Manag. J. 2012, 32, 406–412. [Google Scholar] [CrossRef]
  85. Oshagbemi, T. Is length of service related to the level of job satisfaction? Int. J. Soc. Econ. 2000, 27, 213–226. [Google Scholar] [CrossRef]
  86. Bellamy, S.; Morley, C.; Watty, K. Why Business Academics Remain in Australian Universities Despite Deteriorating Working Conditions and Reduced Job Satisfaction: An intellectual puzzle. J. High. Educ. Policy Manag. 2003, 25, 13–28. [Google Scholar] [CrossRef] [Green Version]
  87. Li, J.; Yang, W.J.; Cheng, Y.W.; Siegrist, J.; Cho, S.I. Effort-reward imbalance at work and job dissatisfaction in Chinese healthcare workers: A validation study. Int. Arch. Occup. Environ. Health 2005, 78, 198–204. [Google Scholar] [CrossRef] [PubMed]
  88. Liu, L.; Chang, Y.; Fu, J.; Wang, J.N.; Wang, L. The mediating role of psychological capital on the association between occupational stress and depressive symptoms among Chinese physicians: A cross-sectional study. BMC Public Health 2012, 12, 1–12. [Google Scholar] [CrossRef] [Green Version]
  89. Rahimnia, F.; Mazidi, A.K.; Mohammadzadeh, Z. Emotional mediators of psychological capital on well-being: The role of stress, anxiety and depression. Manag. Sci. Lett. 2013, 3, 913–926. [Google Scholar] [CrossRef]
  90. Siegrist, J.; Starke, D.; Chandola, T.; Godin, I.; Marmot, M.; Niedhammeret, I.; Peter, R. The measurement of effort-reward imbalance at work: European comparisons. Soc. Sci. Med. 2004, 58, 1483–1499. [Google Scholar] [CrossRef]
  91. Wang, Y.; Chang, Y.; Fu, J.L.; Wang, L. Work-family conflict and burnout among Chinese female nurses: The mediating effect of psychological capital. BMC Public Health 2012, 12, 1–13. [Google Scholar] [CrossRef] [Green Version]
  92. Jasperse, M.; Herst, P.; Dungey, G. Evaluating stress, burnout and job satisfaction in New Zealand radiation oncology departments. Eur. J. Cancer Care 2014, 23, 82–88. [Google Scholar] [CrossRef] [PubMed]
  93. Mahan, P.L.; Mahan, M.P.; Park, N.J.; Shelton, C.; Brown, K.C.; Weaver, M.T. Work environment stressors, social support, anxiety, and depression among secondary school teachers. AAOHN J. 2010, 58, 197–205. [Google Scholar] [CrossRef] [Green Version]
  94. Pignata, S.; Winefield, A.H. Stress-reduction Interventions in an Australian University: A Case Study. Stress Health 2015, 31, 24–34. [Google Scholar] [CrossRef]
  95. Strydom, L.; Nortjé, N.; Beukes, R.; Esterhuyse, K.; van der Westhuizen, J. Job satisfaction amongst teachers at special needs schools. S. Afr. J. Educ. 2012, 32, 255–266. [Google Scholar] [CrossRef]
  96. Oshagbemi, T. The influence of rank on the job satisfaction of organizational members. J. Manag. Psychol. 1997, 12, 511–519. [Google Scholar] [CrossRef]
  97. Oshagbemi, T. How satisfied are academics with their primary tasks of teaching, research and administration and management? Int. J. High. Educ. 2000, 1, 124–136. [Google Scholar] [CrossRef]
  98. Pfeffer, J.; Langton, N. The Effect of Wage Dispersion on Satisfaction, Productivity and Working Collaboratively: Evidence from College and University Faculty. Adm. Sci. Q. 1993, 38, 382–407. [Google Scholar] [CrossRef]
  99. Ward, M.E.; Sloane, P.J. Non-Pecuniary advantages versus pecuniary disadvantages. Job satisfaction among male and female academics in Scottish universities. Scott. J. Political Econ. 2000, 47, 273–304. [Google Scholar] [CrossRef]
  100. Loquias, M.M.; Sana, E.A. Job satisfaction among Faculty Member in the Colleges of Pharmacy in Metro Manila, Philippines. Int. J. Pharm. Teach. Pract. 2013, 4, 787–792. [Google Scholar]
  101. Hesli, V.L.; Lee, J.M. Job Satisfaction in Academia: Why Are Some Faculty Members Happier than Others? Political Sci. Politics 2013, 46, 339–354. [Google Scholar] [CrossRef] [Green Version]
  102. Collie, R.J.; Shapka, J.D.; Perry, N.E. School Climate and Social-Emotional Learning: Predicting Teacher Stress, Job Satisfaction, and Teaching Efficacy. J. Educ. Psychol. 2012, 104, 1189–1204. [Google Scholar] [CrossRef] [Green Version]
  103. Ahammed, S. Does Teaching Contribute to One’s Wellbeing: An Examination of the Relationship between Teaching Satisfaction and Life Satisfaction among University Teachers. Transform. Dialogues Teach. Learn. J. 2011, 14, 12–19. [Google Scholar]
  104. Lancy, F.J.; Sheehan, B.A. Job satisfaction among academic staff: An international perspective. High. Educ. 1997, 34, 305–322. [Google Scholar]
  105. Ethington, C.A.; Smart, J.C.; Zeltman, M.L. Institutional and Departmental Satisfaction of Women Faculty. Res. High. Educ. 1989, 30, 261–271. [Google Scholar] [CrossRef]
  106. Sabharwal, M.; Corley, E.A. Faculty Job Satisfaction across Gender and Discipline. Soc. Sci. J. 2009, 46, 539–556. [Google Scholar] [CrossRef]
  107. Bataineh, O.T. The Level of Job Satisfaction Among the Faculty Members of Colleges of Education at Jordanian Universities. Can. Soc. Sci. 2014, 10, 1–8. [Google Scholar]
  108. Nosike, A.N.; Oguzor, N.S. Motivating the Nigerian academic and non-academic staff for sustainable higher education: Insights for policy options. Perspect. Innov. Econ. Bus. 2011, 1, 62–65. [Google Scholar] [CrossRef] [Green Version]
  109. Bigle, F.L. Examinating the burnout of academics in relation to job satisfaction and other factors. Soc. Behav. Personal. Int. J. 2006, 34, 1151–1160. [Google Scholar]
  110. Ssesanga, K.; Garrett, R.M. Job satisfaction of University academics: Perspectives from Uganda. High. Educ. 2005, 50, 30–56. [Google Scholar] [CrossRef] [Green Version]
  111. Sloane, P.J.; Ward, E.W. Cohort effects and job satisfaction of academics. Appl. Econ. Lett. 2001, 8, 787–791. [Google Scholar] [CrossRef]
  112. Al-Sheikh, M.; Shareef, A. Job satisfaction and its relationship to some demographic variables among teachers. J. Islamic Sci. Ser. Humanit. Stud. 2008, 1, 1–13. [Google Scholar]
  113. Rewaili, N. Job Satisfaction among Public Schools Principals in the Region of North Borders—Field Study; Unpublished MA; King Abdul-Aziz University, College of Education: Jeddah, Saudi Arabia, 2009. [Google Scholar]
  114. Szwarc, K.; Białowąs, S.; Buttler, D. Badanie Satysfakcji Pracowników Uniwersytetu Ekonomicznego w Poznaniu; Raport; Uniwersytet Ekonomiczny: Poznań, Poland, 2012. [Google Scholar]
  115. Bexley, E.; Richard, J.; Arkoudis, S. The Australian Academic Profession in Transition: Addressing the Challenge of Reconceptualising Academic Work and Regenerating the Academic Workforce; Commissioned report prepared for the Department of Education, Employment and Workplace Relations; University of Melbourne: Melbourne, Australia, 2011. [Google Scholar]
  116. Rybińska, K.; Chorążuk, J.; Sirojć, Z. Pracownicy naukowo-dydaktyczni o pracy w szkolnictwie wyższym. Zesz. Nauk. Uczel. Warsz. im. Marii Skłodowskiej-Curie 2013, 4, 67–108. [Google Scholar]
  117. Kurek, D. Relacje interpersonalne a satysfakcja z pracy pracowników naukowo-dydaktycznych Akademii Obrony Narodowej. Zesz. Nauk. AON 2014, 2, 292–323. [Google Scholar] [CrossRef]
  118. Metelski, A. Satysfakcja z pracy dydaktycznej nauczycieli akademickich oraz doktorantów. Studia Oecon. Posnan. 2017, 5, 86–99. [Google Scholar] [CrossRef]
  119. Cohen, S.; Kamarck, T.; Mermelstein, R. A Global Measure of Perceived Stress. J. Health Soc. Behav. 1983, 24, 385–396. [Google Scholar] [CrossRef] [PubMed]
  120. Stevens, P.A. The job satisfaction of English academics and their intentions to quit academe. Natl. Inst. Econ. Soc. Res. Discuss. Pap. 2005, 262, 1–40. [Google Scholar]
Figure 1. Age structure of respondents divided into degrees and titles (PhD/hab., PhD/Prof.). Source: Own study.
Sustainability 12 04865 g001
Figure 2. The percentage of responses for particular influence factors. Source: Own study.
Sustainability 12 04865 g002
Figure 3. Academics’ feedback. Source: Own study.
Sustainability 12 04865 g003
Figure 4. The level of satisfaction with scientific work attributes. Source: Own study.
Sustainability 12 04865 g004
Table 1. Minimum time that academics should allocate to teaching and/or teaching-related activities.
CountryCharacteristic
BelgiumStaff with the civil servant status: 16 h per week
GermanyBetween four and eight “units” per week, depending on the staff category (a teaching unit = at least 45 min)
Estonia6 h per week (all full-time academic staff)
SpainCareer civil servants: Teaching activity corresponding to 24 ECTS (European Credit Transfer and Accumulation System) per year (approximately 8 h per week) + 6 tutoring hours per week (variations possible, depending on both professional status and research activity)
FranceBetween 128 and 384 h per year, depending on the staff category
CroatiaBetween 150 and 300 normative hours per year, depending on the staff category
ItaliaProfessors: At least 350 h per year; research staff: Up to 350 h per year
HungaryBetween 8 and 12 h per week, depending on the staff category
PolandBetween 120 and 540 h per year, depending on the staff category
PortugalStaff at universities: 6 h per week (maximum set at 9 h per week); staff at polytechnics: 6 h per week (maximum set at 12 h per week)
RomaniaBetween 7 and 11 h per week, depending on the staff category
SloveniaStaff at universities: Between 5 and 10 h per week, depending on the staff category; staff at vocational colleges: Between 16 and 20 h per week, depending on the staff category.
Source: [19].
Table 2. Differences in academic carrier path between disciplines.
DisciplineCarrier Path Characteristic
EconomicsAcademic careers in economics tend to be more structured and organized than in other disciplines. The existence of international job markets and agreed criteria as to the quality of academic work help young researchers get a clear picture of the steps to be undertaken in order to start and progress along the academic career in this discipline.
LawBecoming an academic may not be the first option for young lawyers. Even legal scholars often maintain their practitioner activity. Seen in an international perspective, an academic career in law will require researchers to adjust to the specificities, including language, of different national systems.
HistoryPursuing an international career in history presents some specific challenges. Academic markets in this discipline are still very much national and segmented according to the field of specialization. This page helps you to spot opportunities while, at the same time, elaborating on the specific features of an academic career in history.
Political and Social SciencesThere are an increasing number of opportunities in the academic, and non-academic, market for political and social scientists. By linking to this page, you will get to know more about different features and options available in this market.
Source: Own work on the basis of [17].
Table 3. Selected job satisfaction definitions.
AuthorDefinition
Hoppock [43]Job satisfaction is any combination of psychological, physiological, and environmental circumstances that cause a person truthfully to say “I am satisfied with my job”. According to this approach, although job satisfaction is under the influence of many external factors, it remains something internal that has to do with the way the employee feels. That is, job satisfaction presents a set of factors that cause a feeling of satisfaction.
Vroom [44]Job satisfaction focuses on the role of the employee in the workplace. Thus, he defines job satisfaction as affective orientations on the part of individuals toward work roles which they are presently occupying
Davis [45] Job satisfaction has to do with the way people feel about their job and its various aspects. It has to do with the extent to which people like or dislike their job. That why job satisfaction and job dissatisfaction can appear in any given work situation.
Job satisfaction represents a combination of positive or negative feelings that workers have towards their work. Meanwhile, when a worker is employed in a business organization, this brings with it the needs, desires, and experiences that determine the expectations that he has dismissed. Job satisfaction represents the extent to which expectations are and match the real rewards. Job satisfaction is closely linked to that individual’s behavior in the work place.
Statt [46]Job satisfaction can also be defined as the extent to which a worker is content with the rewards he or she gets out of his or her job, particularly in terms of intrinsic motivation.
Mullins [47]Job satisfaction is a complex and multifaceted concept, which can mean different things to different people. Job satisfaction is usually linked with motivation, but the nature of this relationship is not clear. Satisfaction is not the same as motivation. Job satisfaction is more of an attitude, an internal state. It could, for example, be associated with a personal feeling of achievement, either quantitative or qualitative.
Armstrong [48]The term job satisfactions refers to the attitude and feelings people have about their work. Positive and favorable attitudes towards the job indicate job satisfaction. Negative and unfavorable attitudes towards the job indicate job dissatisfaction.
Kaliski [49]Job satisfaction is a worker’s sense of achievement and success on the job. It is generally perceived to be directly linked to productivity, as well as to personal well-being. Job satisfaction implies doing a job one enjoys, doing it well, and being rewarded for one’s efforts. Job satisfaction further implies enthusiasm and happiness with one’s work. Job satisfaction is the key ingredient that leads to recognition, income, promotion, and the achievement of other goals that lead to a feeling of fulfillment.
George [50]Job satisfaction is the collection of feelings and beliefs that people have about their current job. People’s levels of degrees of job satisfaction can range from extreme satisfaction to extreme dissatisfaction. In addition to having attitudes about their jobs as a whole, people can also have attitudes about various aspects of their jobs, such as the kind of work they do, their coworkers, supervisors or subordinates, and their pay.
Aziri [51,52]Job satisfaction represents a feeling that appears as a result of the perception that the job enables the material and psychological needs.
Robbins [53]Job satisfaction refers to an individual’s general attitude towards his or her job.
Aziri [54]Job satisfaction can be considered as one of the main factors when it comes to efficiency and effectiveness of business organizations. In fact, the new managerial paradigm, which insists that employees should be treated and considered primarily as human beings that have their own wants, needs, and personal desires, is a very good indicator for the importance of job satisfaction in contemporary companies. When analyzing job satisfaction, the logic that a satisfied employee is a happy employee and a happy employee is a successful employee is used.
Source: Own work.
Table 4. Selected job satisfaction factors.
Factors
  • Scholarship
  • The availability of competent graduate research assistants
  • Available computer hardware/software to meet research needs
  • The availability of a graduate program in the university
  • Availability of time to pursue scholarship
  • Support provided by the university for continuing studies
  • Institutional support for research
  • Collegiality
  • Opportunities for collaboration with scholars outside department
  • Opportunities for collaboration within department
  • Department’s reputation for excellence in scholarship
  • Mutual respect for others’ scholarly endeavors within department
  • Institutional assistance with seeking funding for research
  • The social interactions among faculty within the department outside of work
  • Supportive climate
  • Teaching environment
  • General support from department/division chair
  • The freedom to design courses as someone sees fit
  • General support for dean
  • The quality of students admitted into program
  • Institutional efforts in support of the career development of their faculty
  • Teaching workload
  • Salary is competitive with other schools
  • The courses someone is assigned to teach
  • Distribution of rewards (i.e., salary) based on merit
  • Resources available (research assistants, travel funds, etc.)
  • Promotion and tenure
  • Award nominations
  • Clear understanding of the teaching requirements needed for tenure/promotion
  • Professional recognition (editorial board member or professional association committee service)
  • The procedures used to evaluate a faculty member’s teaching effectiveness
  • Release from teaching
  • Clear understanding of the research requirements needed for tenure/promotion
  • Mentoring activity
  • Availability of a graduate program
  • Tolerance
  • The opportunity to mentor graduate students
  • Discrimination experience
  • The availability of competent graduate teaching assistants
Source: [64,101,102].
Table 5. Strength of influence of the influence factors.
Strength of Influence of the Influence FactorsValue of the Impact Indicator
Scientific work2.9
Possibility of teaching2.6
Possibility of participating in conferences2.5
The amount of received remuneration2.4
Administrative work2.3
Stability of employment2.3
Possibility of establishing relations with students2.2
Free time2.0
Assigned classes1.8
Possibility of strengthening the relations with co-workers1.7
The way of appreciation by the superior1.7
Period of employment1.6
One full-time position1.3
Possibility of maintaining relations with supervisors1.3
Source: Own study.
Table 6. The level of differences’ significance in subgroups of academic degrees.
Level of Differences Significance (ANOVA)Academic Degree
General job satisfactionp < 0.001
Remunerationp = 0.226
Teachingp = 0.147
Research workp = 0.171
Administrative workp = 0.259
Assessment of the secretariatp = 0.967
Assessment of the cooperation with studentsp = 0.001
Assessment of teaching levelp = 0.102
Assessment of the prestigep = 0.004
Assessment of work controlp = 0.028
Assessment of work autonomyp = 0.008
Assessment of work organizationp = 0.084
Assessment of research rulesp = 0.123
Source: Own study.
Table 7. The level of differences’ significance for subgroups resulting from academic degrees.
Level of Differences SignificanceAcademic Degree
PhD ⇔ hab. PhDhab. PhD Prof.PhD ⇔ Prof.
General satisfaction of scientific work0.0080.0010.001
Remuneration0.1450.0860.004
Teaching0.0520.0120.260
Research work0.0120.4550.006
Administrative work0.3580.2420.644
Assessment of the secretariat0.6230.6700.877
Assessment of the cooperation with students0.0010.3080.239
Assessment of teaching level0.3570.1130.018
Assessment of the prestige0.5640.0010.001
Assessment of work control0.3500.0070.001
Assessment of work autonomy0.0150.1670.001
Assessment of work organization0.2310.0390.002
Assessment of research rules0.0240.9180.125
Source: Own study.
Table 8. Level of satisfaction with scientific work (part 1).
Satisfaction with Scientific work Satisfaction Level of Scientific Work (on a Scale from 1 to 10)
General Satisfaction with Scientific WorkRemunerationTeachingResearch WorkAdministrative WorkAssessment of the Secretariat
Sample size (N)540540540540540540
Arithmetic mean (xsr)6.844.926.817.312.904.94
Standard deviation (SD)1.912.412.292.112.092.83
Lower quartile Q16.003.005.006.001.003.00
Median Q27.005.007.008.002.005.00
Upper quartile Q38.007.009.009.004.007.00
Dominant Do7.005.008.008.001.001.00
Minimum (MIN)1.001.001.001.001.001.00
Maximum (MAX)10.0010.0010.0010.0010.0010.00
Coefficient of variation (Vx)27.9548.9533.6528.9272.1357.40
Source: Own study.
Table 9. Level of satisfaction with scientific work (part 2).
Satisfaction with Scientific WorkSatisfaction Level of Scientific Work (on a Scale from 1 to 10)
Assessment of the Cooperation with StudentsAssessment of Teaching LevelAssessment of the PrestigeAssessment of Work ControlAssessment of Work AutonomyAssessment of Work OrganizationAssessment of Research Rules
Sample size (N)539539540539540539539
Arithmetic mean (xsr)7.466.636.295.126.865.464.69
Standard deviation (SD)1.731.872.082.402.442.492.34
Lower quartile Q17.005.005.003.005.003.003.00
Median Q28.007.006.005.007.005.005.00
Upper quartile Q39.008.008.007.009.007.007.00
Dominant Do8.008.00Multiple5.008.005.005.00
Minimum (MIN)1.001.001.001.001.001.001.00
Maximum (MAX)10.0010.0010.0010.0010.0010.0010.00
Coefficient of variation (Vx)23.1828.2433.0546.8135.5145.6649.93
Source: Own study.

