Migration Intentions of Romanian Engineering Students


Abstract
1. Introduction
- Diagnose Romanian technical university students regarding their migration intentions, motivations, destinations, and duration (temporary vs. permanent).
- Predict the magnitude of migration in the polled population.
2. Materials and Methods
- Research objective 1 (RO1): To identify the motivations behind the intention of Romanian engineering students to migrate, as seen by the polled students.
- Research objective 2 (RO2): To measure the migration intentions of students in Romanian technical universities.
- Research objective 3 (RO3): To analyze the motivations for Romanian engineering students’ migration after graduation and to determine the length of the intended stay in the destination country (temporary vs. permanent migration).
- Research objective 4 (RO4): To identify the preferred destination countries for migration.
- Research objective 5 (RO5): To construct a predictive model concerning migration of the Romanian engineering students polled in the research.
3. Results
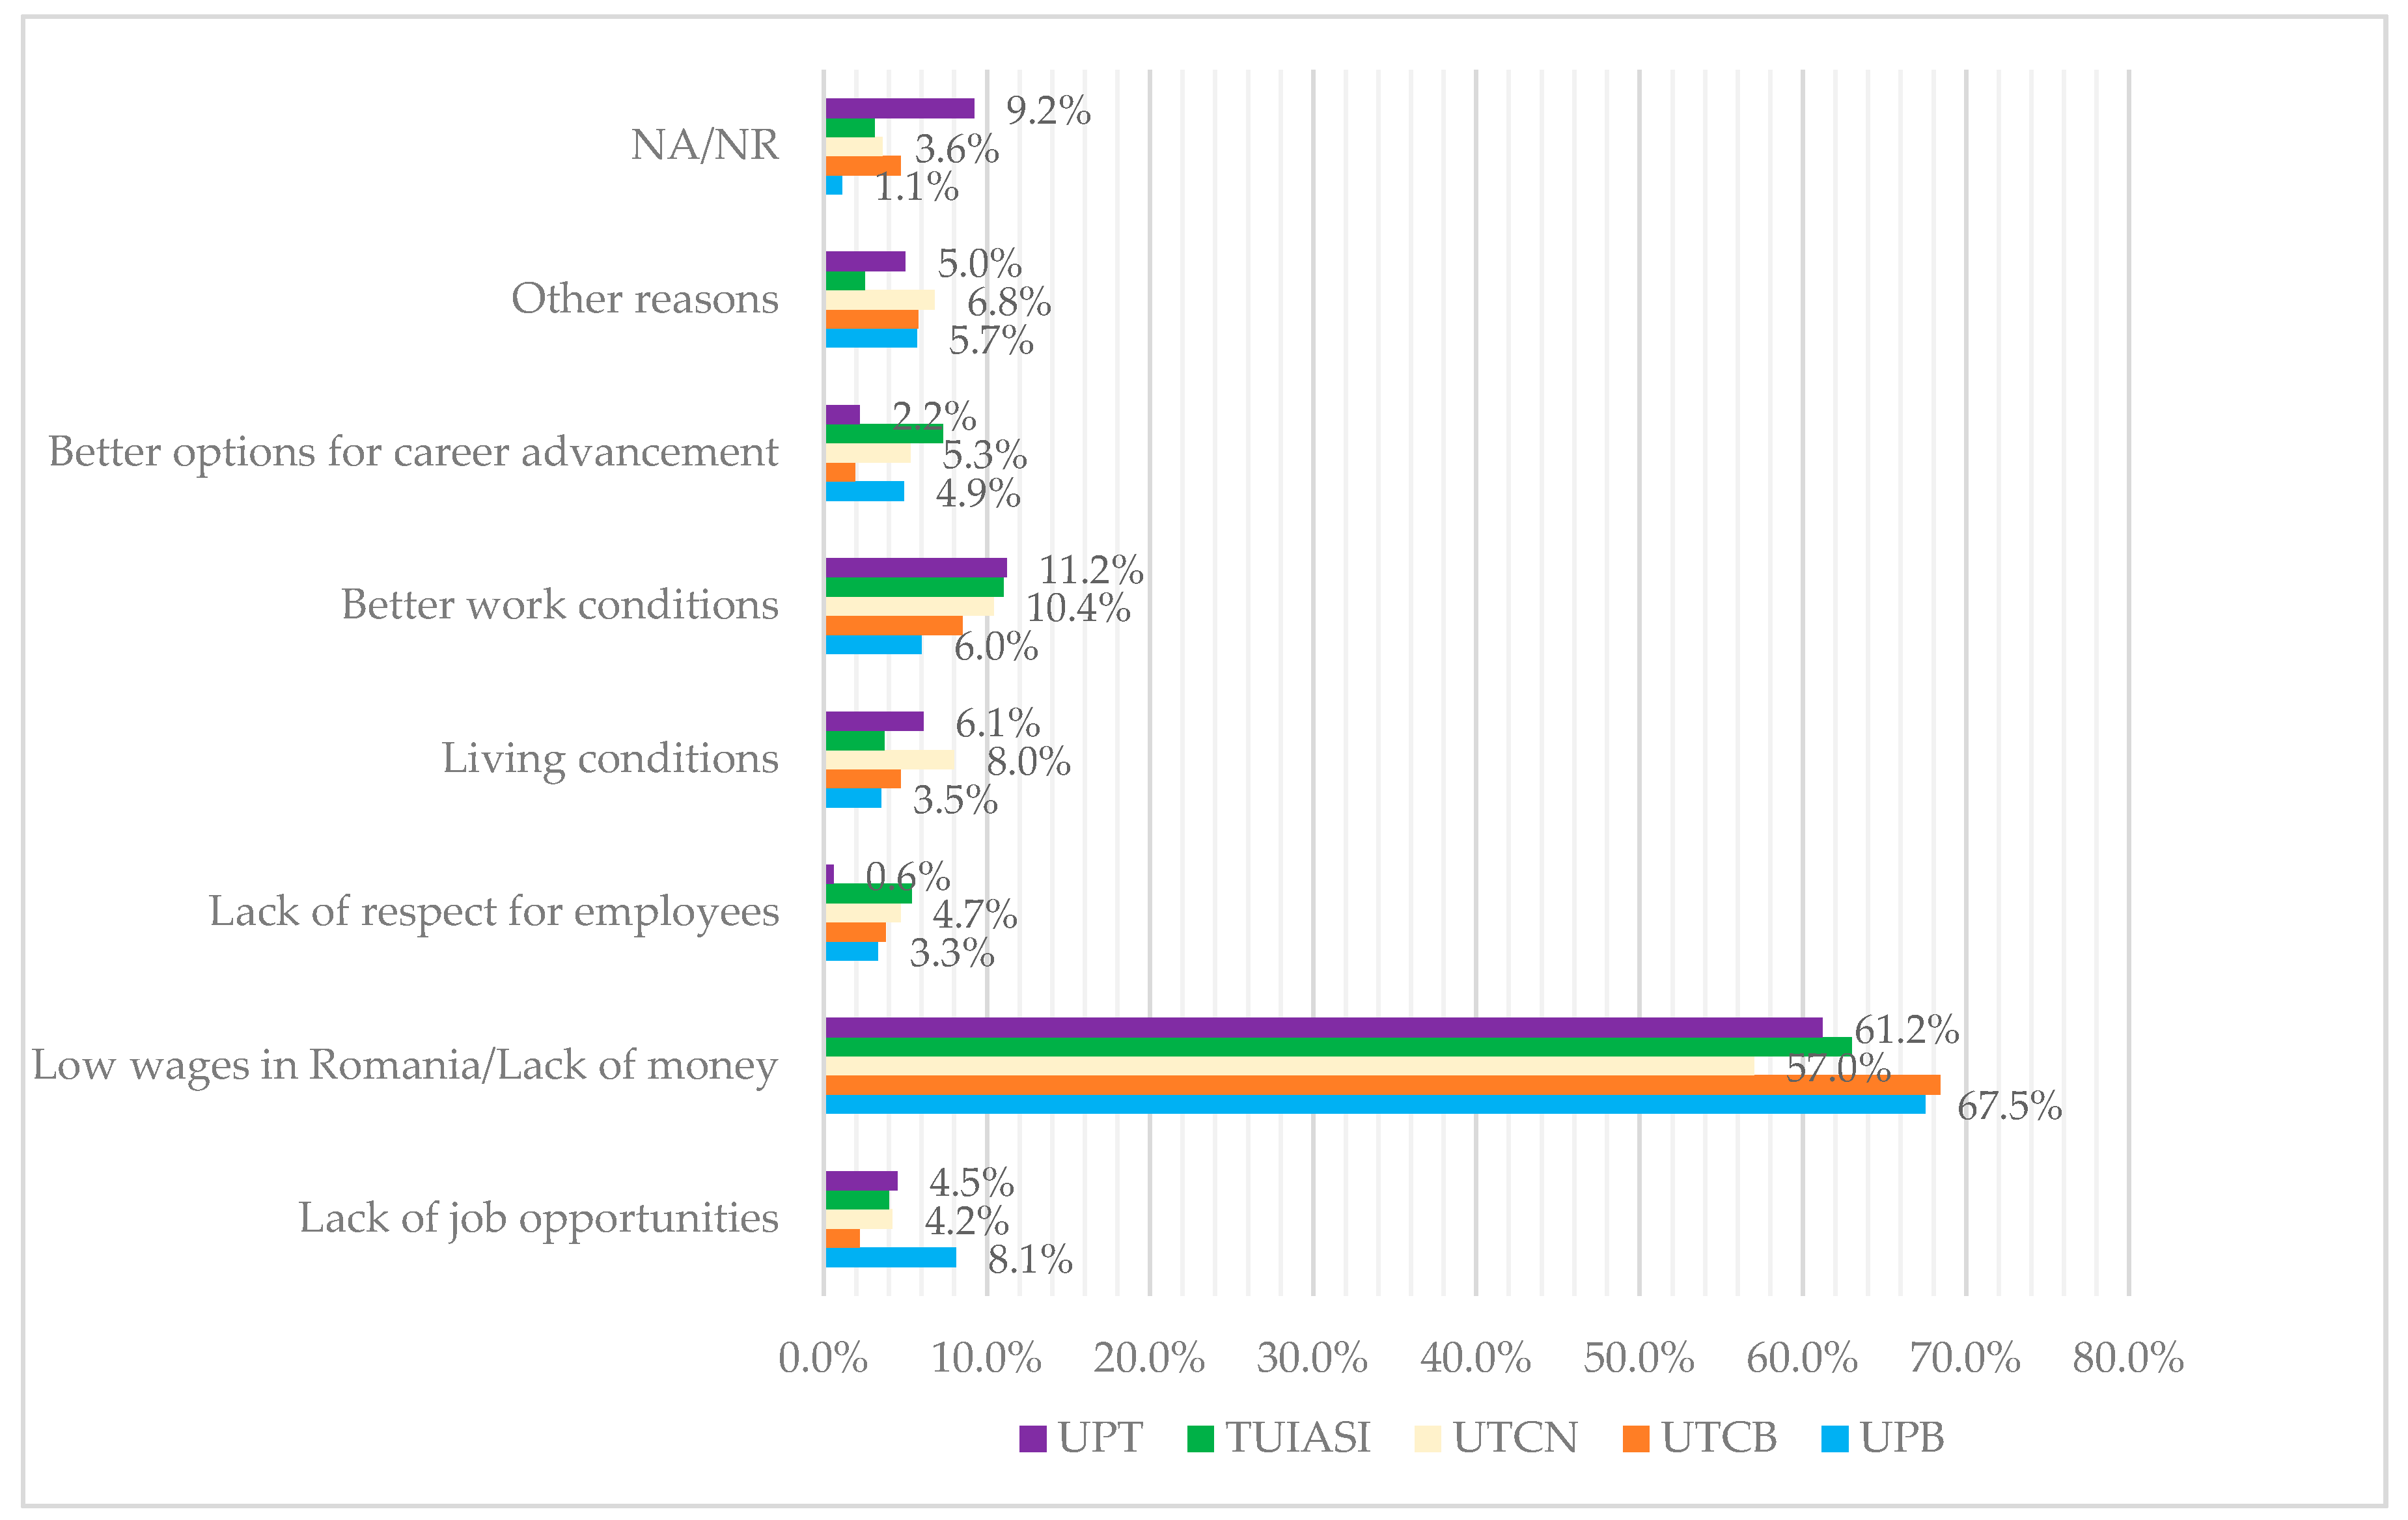
3.1. Motivations behind the Intention of Romanian Engineering Students to Migrate, as Seen by the Polled Students
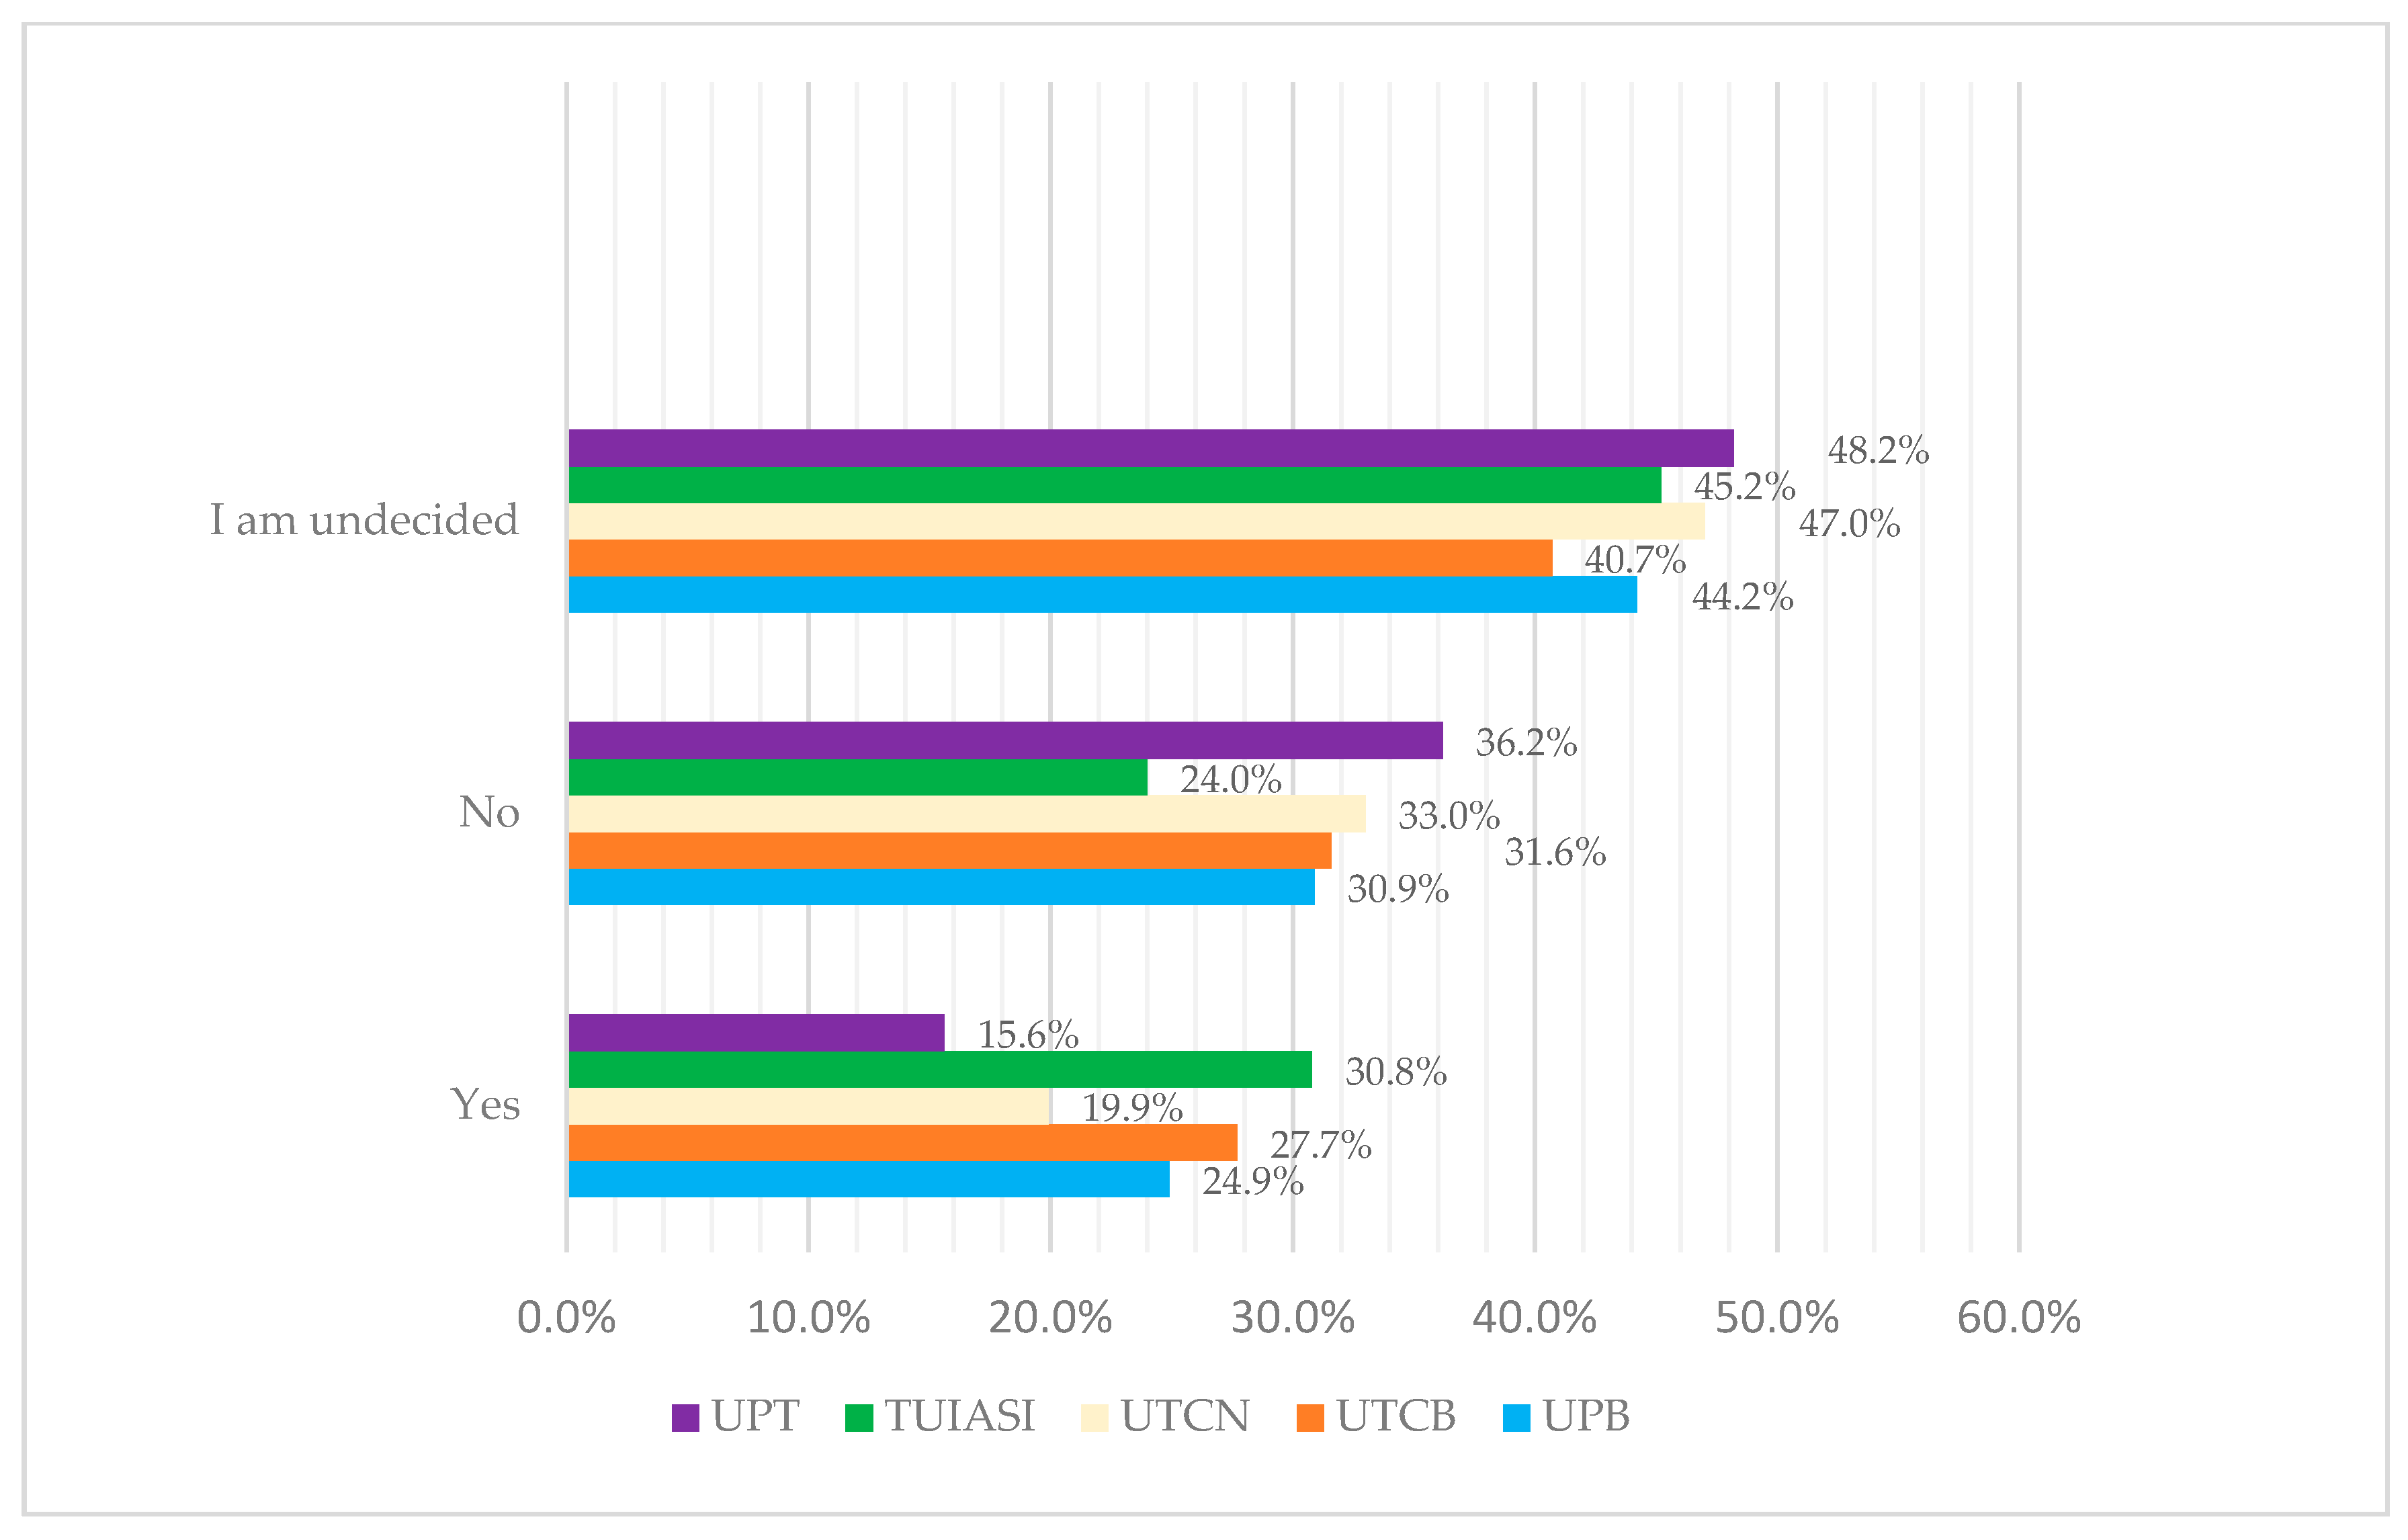
3.2. The Migration Intentions of Students in Romanian Technical Universities
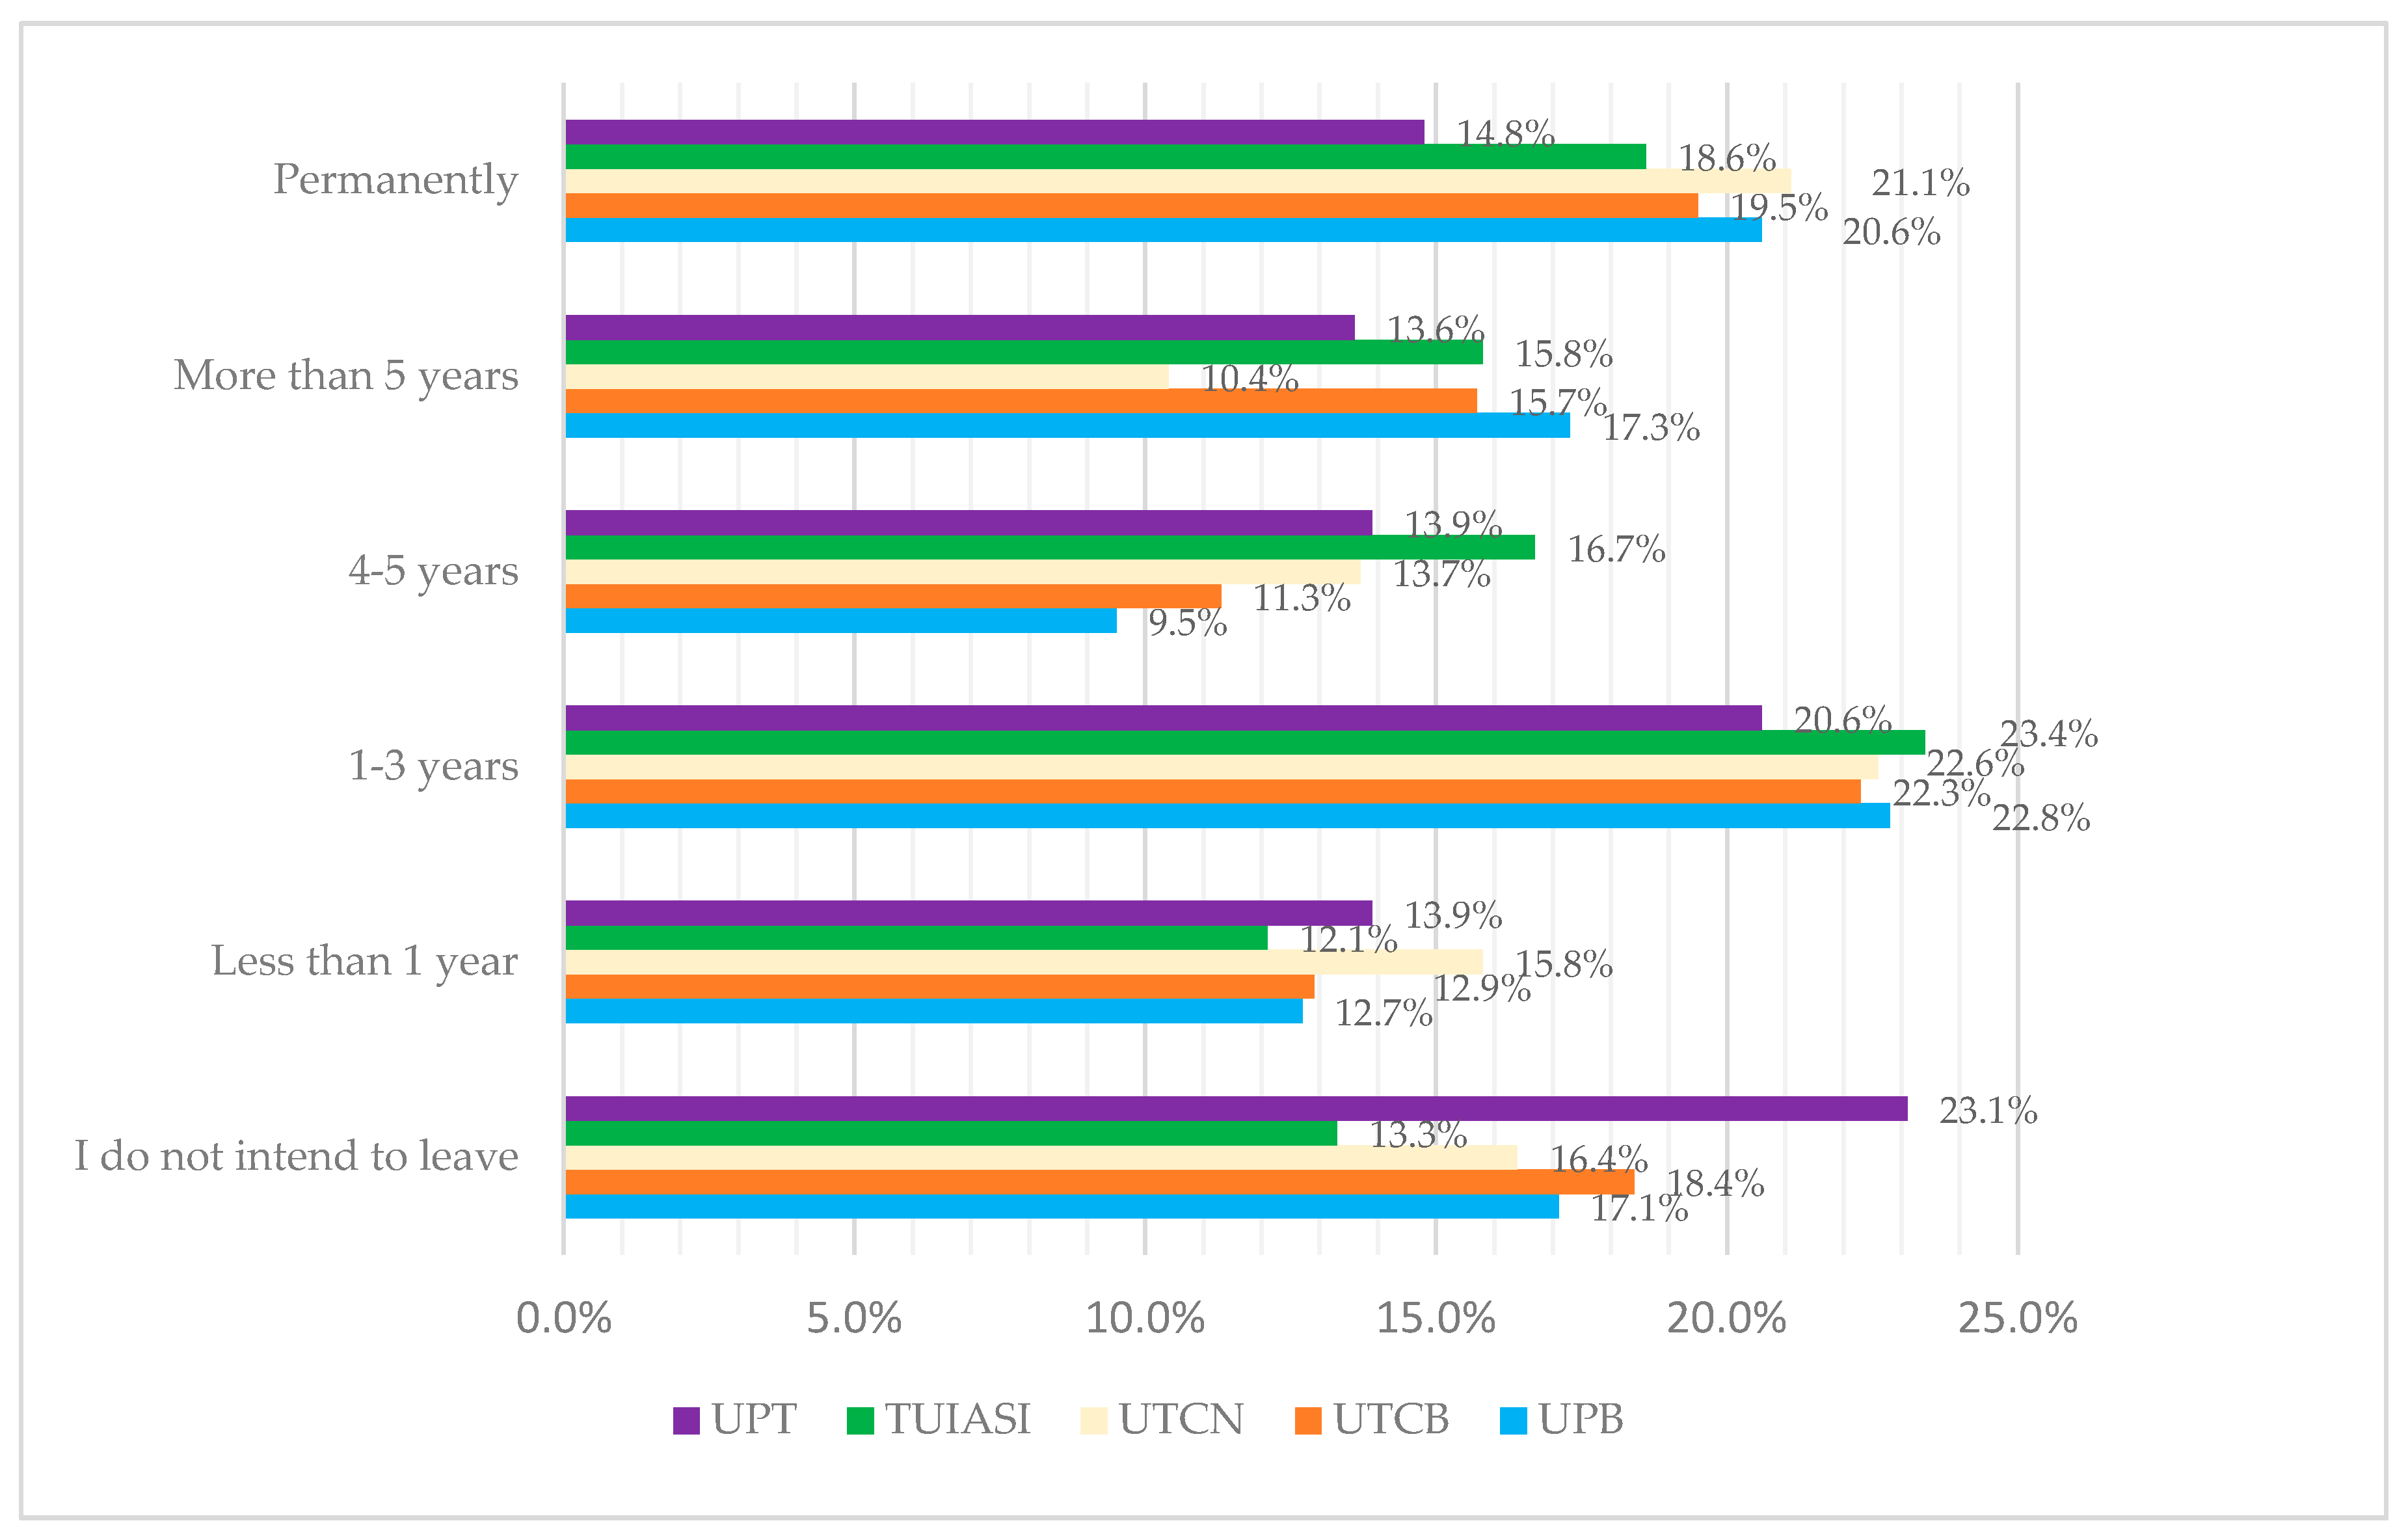
3.3. The Motivations for Romanian Engineering Students’ Migration after Graduation and the Length of the Intended Stay in the Destination Country (Temporary vs. Permanent Migration)
- Wages/income; 4.55 for UPB and TUIASI (the average for the whole sample was 4.51);
- Career opportunities; 4.41 for UPB (the average for the whole sample was 4.36);
- Desire to gain work experience/professional career (advancement); 4.24 in the case of UPB, UTCN, and TUIASI (the average for the whole sample was 4.20);
- Equipment and/or technological infrastructure; 4.28 in the case of UPB (the average for the whole sample was 4.20);
- Medical system; 4.20 in the case of UPT (the average for the whole sample was 4.12);
- Acquiring new experiences, adventure; 4.20 in the case of UTCB (the average for the whole sample was 4.11);
- Finding a job according to the skills/qualification acquired; 4.22 in the case of UPB (the average for the whole sample was 4.10);
- Corruption; 3.93 in the case of UTCB (the average for the whole sample was 3.83);
- Political environment; 3.72 in the case of UTCB (the average for the whole sample was 3.66);
- Quality of the education system; 3.78 in the case of UPB (the average for the whole sample was 3.60);
- Economic growth prospects of the country of destination; 3.61 in the case of UTCN (the average for the whole sample was 3.44);
- Family reasons (meeting with family, to follow spouse/parents, etc.); 2.93 in the case of UPT (the average for the whole sample was 2.72).
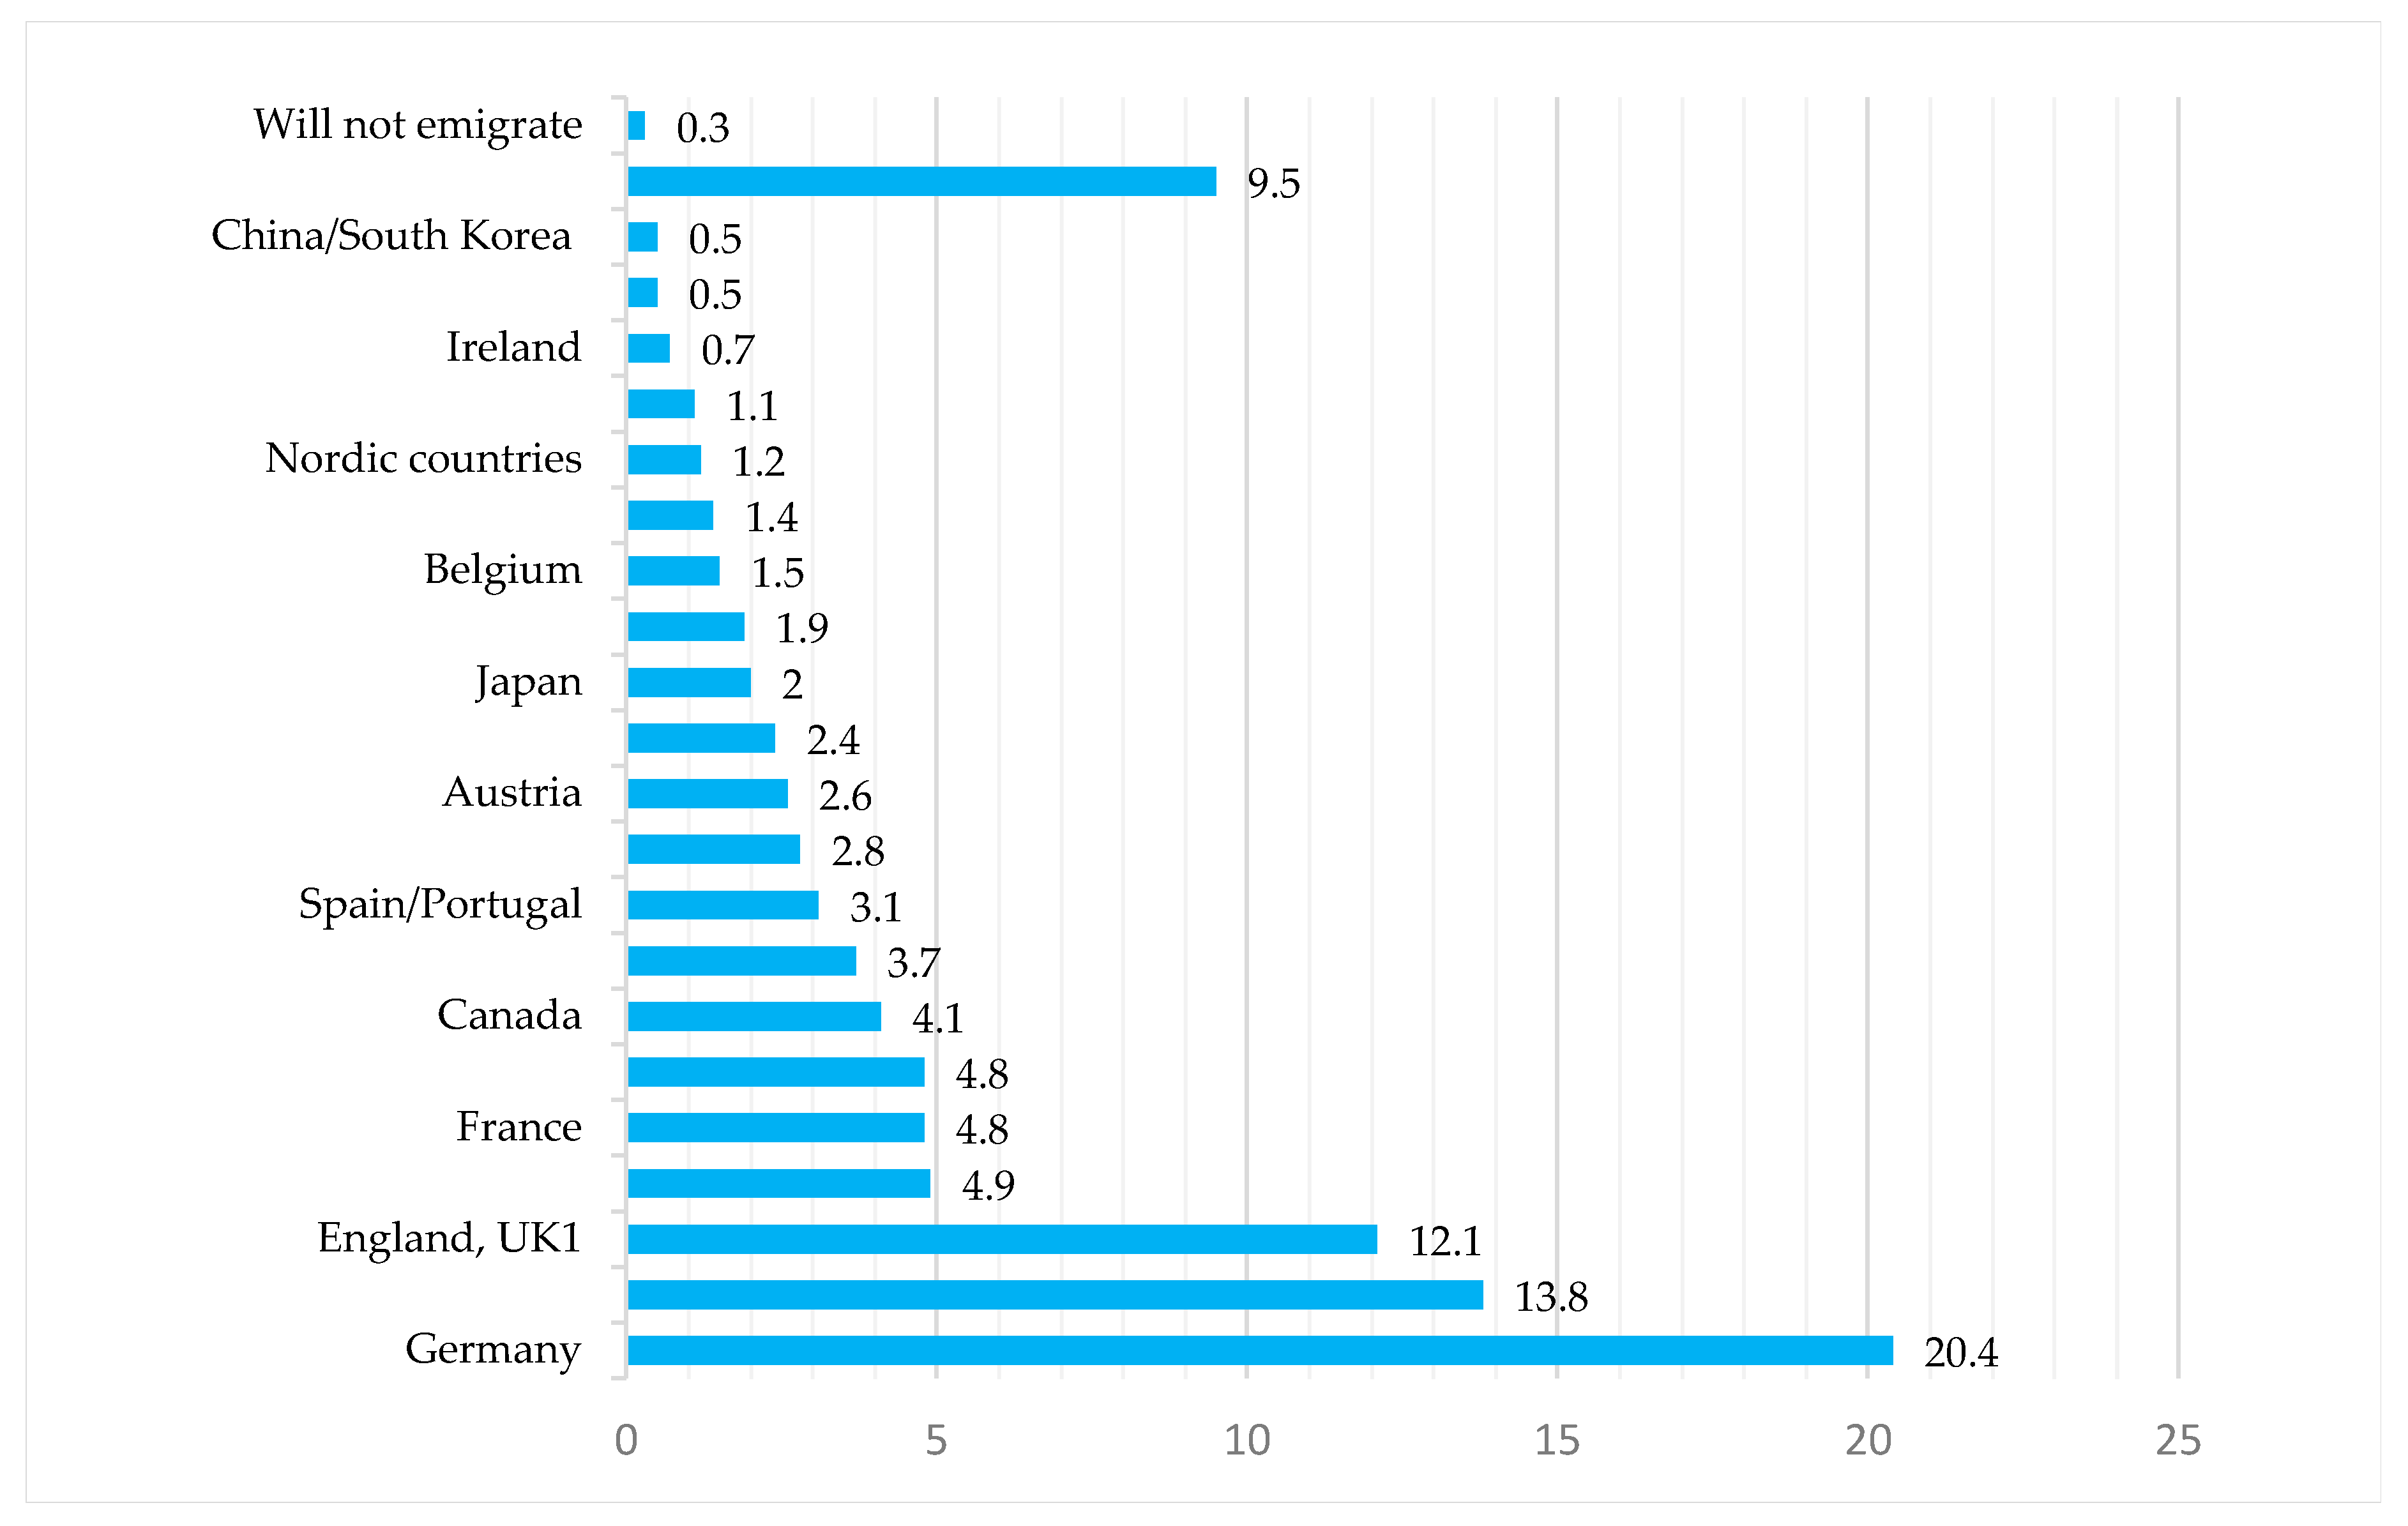
3.4. The Preferred Destination Countries for Migration
- Intermediate group I consists of the following countries: Netherlands (4.9%), France (4.8%), Switzerland (4.8%), and Canada (4.1%);
- Intermediate group II consists of the following countries: Norway (3.7%) and Spain/Portugal (3.1%);
- Intermediate group III consists of the following countries: Sweden (2.8%), Austria (2.6%), Denmark (2.4%), Japan (2%), Italy (1.9%), Belgium (1.5%), Australia/New Zealand (1.4%), Nordic countries (1.2%), and Dubai, the United Arab Emirates, and Saudi Arabia (1.1%).
- Western Europe (55%) represents an intra-EU migration, Romania being part of it since 2007. We could say that, according to EU freedoms, the choice of a new living and workplace is not an emigration per se, but merely a movement within the “larger country”;
- The North American continent (USA and Canada) (17.1%), an overseas mirage, is branded as immigration-friendly for many Europeans, with visa lotteries and campaigns targeting skilled labor;
- The United Kingdom (12.1%) has played an important role throughout modern history in the Balkans and has the aura of a center vs. periphery. The Brexit negotiations brought forth discussions regarding life/work opportunities in the UK and it became obvious that many Romanians chose this country as an emigration destination and applied for permanent residence. At the time of Brexit, official statistics in the UK showed that more than 400,000 Romanians permanently lived in the UK, this being the second largest non-British group (after Polish people) [37,40].
3.5. Constructing a Predictive Model Concerning the Migration of Romanian Engineering Students Comprised in the Research
3.5.1. Discussion for the Response Variant Not Likely
3.5.2. Discussion for the Response Variant Somewhat Likely
4. Discussion and Conclusions
Author Contributions
Funding
Conflicts of Interest
Appendix A

| Main Topic | Authors/Year | Geographic Focus | Population/Students/Specializations | Research Focus | Method |
|---|---|---|---|---|---|
| Holistic approach | World Bank report 2019 [7] | 47 countries in Europe and Central Asia (ECA) | Students/recent graduates/highly skilled workers as part of the general population | Trends by countries and regions, impact on economy | Descriptive statistics |
| OECD Report 2019 Talent abroad [8] | Romania | Recent graduates as part of the general, highly skilled migrant population | Trends, directions of migration/residence, diaspora, and return migration | Descriptive statistics | |
| EU report on the movement of skilled labor [9] | EU countries & focused case studies (Germany, Spain, Baltic states, Ireland, Poland, Bulgaria & Romania) | Recent graduates as part of the general, highly skilled migrant population, special focus on ICT and health sectors | Main flows of movement, driving factors for migratory flows, movers’ choices, policies | Eurostat data, prior EU surveys, case studies | |
| Black et al., 2010 [12] | Europe& focused case studies (Eastern European, Poland, Bulgaria, Romania) | General population, recent graduates as part of the population | Flows, return migration, policies | Mixed method, surveys, policy analysis | |
| Ferro, 2004 [39] | Romania | Highly skilled workers (students included) | Reasons, strategies, barriers, evaluation of experience | Survey | |
| ESPON, 2019 [46] | EU | General population | Flows, geographic representation of centers/peripheries | Descriptive statistics, case studies | |
| Predictability of migration and/or analysis of the whole process: intention-preparation-action (behavior) | Van Dalen and Henkens [47] | Netherlands | General movers population, students as a segment | predictors of emigration intentions for native-born Dutch; intentions & subsequent behavior | 2-step Emigration survey |
| Migali and Scipioni, 2018 [11] | global | General population (youth as part of the general cohort) | desire to move abroad, actual plans, and preparations, demographic and socio-economic drivers | Descriptive analysis, data from the Gallup World Poll survey for the period 2010–2015 | |
| Suciu et al., 2017 [16] | Romania | Medical Students | emigration intentions and preparation, incentives/barriers | Self administered questionnaire (3years) | |
| Docquier et al., 2014 [34] | Global (OECD countries as well as Persian Gulf countries, the Russian Federation, and South Africa | General population, college graduates included | potential vs. actual migration, sending vs. receiving countries | two-stage empirical analysis, data from Gallup polls | |
| Herz et al., 2019, [29] | Europe | Youth/students | Determinants of migration intentions: macro, individual, family, and networks | descriptive analysis, multiple logistic regression analysis, prior data (survey) | |
| Van Mol, 2016 [30] | Europe (EU) | Youth | Migration aspirations, influencing factors | data from the Flash Eurobarometer 395 (European Youth 2014), descriptive analysis | |
| Fouarge et al. [48] | Germany | youth | Personality traits, migration intentions, cultural distance | survey | |
| Balan and Olteanu, 2017 [18] | Romania, EU | general population | Globalization forces as drivers for migration | literature review analysis | |
| Carling and Schewe, 2018 [6] | global | general population | Migration aspirations, ability and capabilities | survey | |
| Reasons or motives to migrate | Hemming et al. [27]/2018 | European countries (survey in Germany, Hungary, Luxembourg, Norway, Romania, Spain) | Youth | Main flows of movement for future physicians driving factors (motives) and actual plans | multi-methods design: macro analysis on the national level with individual qualitative and quantitative analysis of mobile youth (micro-data from online survey+ interviews) |
| Dohlman et al. [15] | Global | Physicians and medical students | Maslow’s theory | Literature review, data mining | |
| Sandu&Tufis, 2018 [1] | New and Old member states of the EU | Youth | intentions, motivations, intensity, self-assessment of migration motivations and behavior | Multi-country comparative analysis, data from YMOBILITY survey | |
| Ciarniene and Kumpikaite, 2011, [28] | Lithuania | Students | reasons for migration, motivations for country selection | logical analysis, survey | |
| Plopeanu et al., 2018 [3] | Romania | Students in economics | motivations for migration, attitudes, and beliefs | survey, descriptive statistics | |
| Hemming et al., 2015 [49] | 9 EU countries (Germany, Ireland, Italy, Latvia, Romania, Slovakia, Spain, Sweden, UK) | Non-student youth | key drivers and barriers for migration, duration, reasons | survey, cluster analysis | |
| Wazir et al., 2017 [26] | Malaysia | Engineering students | intentions to migrate, motivations, destinations | survey | |
| Iacob, 2018 [5] | Romania | Highly skilled workers | brain drain, motives for migration, corruption as motive | survey | |
| Directions and (i)reversibility of migration flows | Anghel et al., 2016 [10] | Romania | General population, youth, physicians | Historical approach on migration from Romania 1945-date | Literature review, descriptive statistics |
| Fassman et al., 2014 [2] | Old and new EU states (focus on Austria) | General population | push-and-pull-driven migration patterns | Descriptive statistics, official data | |
| OECD, 2013 [20] | Baltic states, Poland, Romania | General population | flows, (i)reversibility of migration, diaspora policies | Descriptive statistics, official data | |
| Policies for encouraging migration vs. cohesion policies in the European Union | Lăzărescu et al., 2017 [17] | Romania | Highly skilled workers, recent graduates, R&D, medicine, ICT | Impact of emigration, incentives/barriers for migration | analysis of legislative measures, survey, interviews, focus group |
| Boc [19] | EU | General population | (need for) cohesion policies | Descriptive statistics, policy analysis | |
| Actual experiences of expat highly skilled workers in the destination country with respect to a variety of realities | Emilsson and Mozetič, 2019 [13] | Sweden, Romania, Latvia | Highly skilled youth | Career trajectories, de-skilling, migration outcomes | semi-structured interviews, case studies |
| Fischer–Souan, 2019 [37] | SEE countries, EU | Highly skilled and lower-skilled workers | Migration motivations, perceptions on the outcomes individual and | in-depth interviews | |
| Demireva and Quassoli, 2019 [21] | EU | Migrant workers | structural barriers preventing migrants from realizing their human capital potential | rich qualitative data in the research project | |
| Tanis, 2020 [22] | Germany | Migrant workers | Location choices of immigrants in Germany | descriptive statistics, analysis | |
| Phung et al., 2020 [50] | UK | Eastern European migrants | Experiences with health services | narrative synthesis from relevant publication | |
| Identity-building and perceptions | Van Mol, 2019 [23] | EU | Students | European identity | Survey |
| King et al., 2018 [14] | EU | Migrants and refugees | Historical approach on migration flows | Official statistics, policy analysis |
Appendix B
| Model Fitting Information | ||||
|---|---|---|---|---|
| Model | Model Fitting Criteria | Likelihood Ratio Tests | ||
| −2 Log Likelihood | Chi-Square | df | Sig. | |
| Intercept Only | 3653.705 | |||
| Final | 3303.041 | 350.664 | 58 | 0.000 |
Appendix C
| Goodness-of-Fit | |||
|---|---|---|---|
| Chi-Square | df | Sig. | |
| Pearson | 3281.969 | 3312 | 0.641 |
| Deviance | 3231.249 | 3312 | 0.839 |
Appendix D
| Pseudo R-Square | |
|---|---|
| Cox and Snell | 0.179 |
| Nagelkerke | 0.203 |
| McFadden | 0.093 |
References
- Sandu, D.; Tufiș, P. Spheres of Life in Youth Migration Processes: A Multicountry and Multilevel Approach, Section in the Research Report of H2020 Project YMOBILITY, Youth Mobility: Maximizing Opportunities for Individuals, Labour Markets and Regions in EUROPE, 2015–2018. 2018. Available online: https://www.academia.edu/38394901/Spheres_of_Life_in_Youth_Migration_Processes_a_Multicountry_and_Multilevel_Approach (accessed on 20 April 2020).
- Fassmann, H.; Kohlbacher, J.; Reeger, U. The re-emergence of European East-West migration—The Austrian example. Cent. East. Eur. Migr. Rev. 2014, 3, 1–21. [Google Scholar]
- Plopeanu, A.P.; Homocianu, D.; Mihaila, A.A.; Crisan, E.L.; Bodea, G.; Bratu, R.D.; Airinei, D. Exploring the Influence of Personal Motivations, Beliefs and Attitudes on Students’ Post-Graduation Migration Intentions: Evidence from Three Major Romanian Universities. Appl. Sci. 2018, 8, 2121. [Google Scholar] [CrossRef]
- Williams, A.M.; Jephcote, C.; Janta, H.; Li, G. The migration intentions of young adults in Europe: A comparative, multilevel analysis. Popul. Space Place 2017, e2123. [Google Scholar] [CrossRef]
- Iacob, R. Brain Drain Phenomenon in Romania: What Comes in Line after Corruption? Rom. J. Commun. Public Relat. 2018, 20, 53–78. [Google Scholar]
- Carling, J.; Schewel, K. Revisiting aspiration and ability in international migration. J. Ethn. Migr. Stud. 2018, 44, 945–963. [Google Scholar] [CrossRef]
- World Bank. Migration and Brain Drain. (English). In Europe and Central Asia Economic Update; World Bank Group: Washington, DC, USA, 2019; Available online: http://documents.worldbank.org/curated/en/657051570692065211/World-Bank-ECA-Economic-Update-Fall-2019 (accessed on 20 April 2020).
- OECD. Talent Abroad: A Review of Romanian Emigrants; OECD Publishing: Paris, France, 2019. [Google Scholar] [CrossRef]
- Publications Office of the European Union. Study on the Movement of Skilled Labour: Final Report; Publications Office of the European Union: Luxembourg, 2018; ISBN 9789279934735. Available online: https://ec.europa.eu/social/main.jsp?catId=738&langId=en&pubId=8156&furtherPubs=yes (accessed on 20 April 2020).
- Anghel, R.; Botezat, A.; Coșciug, A.; Manafi, I.; Roman, M. International Migration, Return Migration, and Their Effects: A Comprehensive Review on the Romanian Case. IZA Discuss. Pap. 2016, 10445. Available online: https://ssrn.com/abstract=2895293 (accessed on 22 April 2020).
- Migali, S.; Scipioni, M.A. Global Analysis of Intentions to Migrate; European Commission: Rome, Italy, 2018; Available online: https://ec.europa.eu/jrc/sites/jrcsh/files/technical_report_on_gallup_v7_finalpubsy.pdf (accessed on 22 April 2020).
- Black, R.; Engbersen, G.; Okolski, M.; Pantiru, C. (Eds.) A Continent Moving West? EU Enlargement and Labour Migration from Central and Eastern Europe; Amsterdam University Press: Amsterdam, The Netherlands, 2018. [Google Scholar]
- Emilsson, H.; Mozetič, K. Intra-EU youth mobility, human capital, and career outcomes: The case of young high-skilled Latvians and Romanians in Sweden. J. Ethn. Migr. Stud. 2019. [Google Scholar] [CrossRef]
- King, R.; Okólski, M. Diverse, Fragile and Fragmented. The New Map of European Migration. Cent. East. Eur. Migr. Rev. 2018, 1–24. [Google Scholar] [CrossRef]
- Dohlman, L.; DiMeglio, M.; Hajj, J.; Laudanski, K. Global Brain Drain: How Can the Maslow Theory of Motivation Improve Our Understanding of Physician Migration? Int. J. Environ. Res. Public Health 2019, 16, 1182. [Google Scholar] [CrossRef]
- Suciu, ŞM.; Popescu, C.A.; Ciumageanu, M.D.; Buzoianu, A.D. Physician migration at its roots: A study on the emigration preferences and plans among medical students in Romania. Hum. Resour. Health 2017, 15, 6. [Google Scholar] [CrossRef]
- Lăzărescu, L.; Hambderger, A.; Șerbănică, C.; Prisăcariu, R.M. Emigrația Forței de Muncă Înalt Calificate din România. O Analiză a Domeniilor Cercetare—Dezvoltare, Medicină și Tehnologia Informației și Comunicațiilor, Raport de Cercetare; Asociaţia Română pentru Promovarea Sănătăţii: Bucuresti, Romania, 2017; Available online: http://eminet.cdcdi.ro/sites/default/files/arps/images/projects/Emigratia%20fortei%20de%20munca%20inalt%20calificate.pdf (accessed on 24 April 2020).
- Bălan, M.; Olteanu, C. Brain Drain in The Globalization Era: The Case of Romania. In Annals of ‘Constantin Brancusi’ University of Targu-Jiu. Economy Series; University of Târgu Jiu: Targu-Jiu, Romania, 2017; Issue 3; pp. 26–35. [Google Scholar]
- Boc, E. Brain Drain in the EU: Local and Regional Public Policies and Good Practices. Transylv. Rev. Adm. Sci. 2020, 23–39. [Google Scholar] [CrossRef]
- OECD. Coping with Emigration in Baltic and East European Countries; OECD Publishing: Paris, France, 2013; Available online: http://dx.doi.org/10.1787/9789264204928-en (accessed on 24 April 2020).
- Demireva, N.; Quassoli, F. The Lived Experiences of Migration: An Introduction. Soc. Incl. 2019, 7, 1–6. [Google Scholar] [CrossRef]
- Tanis, K. Regional distribution and location choices of immigrants in Germany. Reg. Stud. 2020, 54, 483–494. [Google Scholar] [CrossRef]
- Van Mol, C. Intra-European student mobility and the different meanings of ‘Europe’. Acta Sociol. 2019, 1–17. [Google Scholar] [CrossRef]
- Visvizi, A.; Pachocka, M.; Lytras, M.D. Managing International Migration: Rethinking Transaction Costs, Red Tape, and Their Impact’. Int. Migr. 2019, 57, 271–279. [Google Scholar] [CrossRef]
- National Academy of Engineering. Understanding the Educational and Career Pathways of Engineers; The National Academies Press: Washington, DC, USA, 2018. [Google Scholar] [CrossRef]
- Wazir, F.; Jani, R.; Othman, A.; Shahabudin, M. Factors Influencing the Intention To Migrate Among Engineering Students In Malaysia: An Exploratory Study. In Proceedings of the International Business Management Conference (IBMC 2017), Kedah, Malaysia, 3–4 December 2017; pp. 220–228, ISBN 978-967-14841-4-2. [Google Scholar]
- Hemming, K.; Schlimbach, T.; Tilmann, F.; Nienaber, B.; Roman, M.; Skrobanek, J. Structural framework conditions and individual motivations for youth-mobility: A macro-micro level approach for different European country-types. Migr. Lett. 2018, 16, 45–59, ISSN 1741-8992. Available online: https://journals.tplondon.com/index.php/ml/article/view/621 (accessed on 21 April 2020). [CrossRef]
- Ciarniene, R.; Kumpikaite, V. International Labour Migration: Students Viewpoint. Inz. Ekon. Eng. Econ. 2011, 22, 527–533. [Google Scholar] [CrossRef][Green Version]
- Herz, A.; Chorne, L.D.; Catalan, C.D.; Altissimo, A.; Carignani, S.S. Are you mobile, too? The role played by social networks in the intention to move abroad among youth in Europe. Migr. Lett. 2018, 16, 93–104, ISSN 1741-8992. Available online: https://journals.tplondon.com/index.php/ml/article/view/622/579 (accessed on 21 April 2020). [CrossRef]
- Van Mol, C. Migration aspirations of European youth in times of crisis. J. Youth Stud. 2016, 19, 1303–1320. [Google Scholar] [CrossRef]
- European Commission. Education and Training Monitor 2018, Romania; European Commission: Luxembourg, 2018; Volume 2. [Google Scholar]
- Dahlman, C.; Anderson, T. Korea and the Knowledge-Based Economy: Making the Transition; World Bank: Washington, DC, USA; OECD: Washington, DC, USA, 2000; Available online: https://openknowledge.worldbank.org/handle/10986/13845 (accessed on 3 May 2020).
- Sustainable Development Goals—Overview. Available online: https://ec.europa.eu/eurostat/web/sdi/overview (accessed on 3 May 2020).
- Docquier, F.; Giovanni, P.; Ruyssen, I. The cross-country determinants of potential and actual migration. Int. Migr. Rev. 2014, 48, S37–S99. [Google Scholar] [CrossRef]
- ARUT Students . Available online: https://www.aruteh.ro/en/education/arut-students (accessed on 21 April 2020).
- România Educată. Available online: http://www.romaniaeducata.eu/ (accessed on 21 April 2020).
- Fischer-Souan, M. Between ‘Labour Migration’ and ‘New European Mobilities’: Motivations for Migration of Southern and Eastern Europeans in the EU. Soc. Incl. 2019, 7, 7–17. [Google Scholar] [CrossRef]
- Hosmer, D.W., Jr.; Lemeshow, S.; Sturdivant, R.X. Applied Logistic Regression, 3rd ed.; Wiley: New York, NY, USA, 2013. [Google Scholar]
- Ferro, A. Brain Drain and the Academic and the Intellectual Labour Market in South East Europe. En UNESCO CEPES 2004, 23, 275–305. [Google Scholar]
- Românii au devenit a doua minoritate în Marea Britanie. Regatul Unit, destinaţie favorită pentru cei care aleg să emigreze. Available online: https://www.mediafax.ro/life-inedit/romanii-au-devenit-a-doua-minoritate-in-marea-britanie-regatul-unit-destinatie-favorita-pentru-cei-care-aleg-sa-emigreze-17232501 (accessed on 21 April 2020).
- Lutz, W.; Amran, G.; Belanger, A.; Conte, A.; Gailey, N.; Ghio, D.; Grapsa, E.; Jensen, K.; Loichinger, E.; Marois, G.; et al. Demographic Scenarios for the EU, EUR 29739 EN; Publications Office of the European Union: Luxembourg, 2019; ISBN 978-92-76-03216-8 (online), 978-92-76-03215-1 (print), 978-92-76-07876-0 (ePub). [Google Scholar] [CrossRef]
- De Grip, A.; Fouarge, D.; Sauermann, J. What affects international migration of European science and engineering graduates? Econ. Innov. N. Technol. 2010, 19, 407–421. [Google Scholar] [CrossRef]
- Romanian Ministry of Labour and Social Justice, Posibile abordări ale politicilor la nivel U.E. și național în perspectiva Președinției române a Consiliului Uniunii Europene (Consiliul U.E.). Available online: http://www.mmuncii.ro/j33/images/Documente/MMPS/Rapoarte_si_studii_MMPS/DPOCM/2018_-_Posibile_abordri_ale_politicilor_la_nivel_UE_Etapa_2.pdf (accessed on 21 May 2020).
- Vlad, I.V. Strategia de Dezvoltare a României în Următorii 20 de Ani: SINTEZĂ; Editura Academiei Române: Bucharest, Romania, 2017. [Google Scholar]
- Șerban, M.; Croitoru, A. Do Return Migration Policies Matter? A typology of young Romanian returnees’ attitudes towards return policies. Soc. Chang. Rev. Sciendo 2018, 16, 9–34. [Google Scholar] [CrossRef]
- ESPON. Addressing Labour Migration Challenges in Europe. Posted on 5 June 2019; By Espon; In Policy Briefs. Available online: https://www.espon.eu/sites/default/files/attachments/ESPON%20Policy%20Brief%2C%20Labour%20migration%20challenges.pdf (accessed on 5 April 2020).
- Van Dalen, H.P.; Henkens, K. Explaining Emigration Intentions and Behaviour in the Netherlands, 2005–2010. Popul. Stud. 2013, 67, 225–241. [Google Scholar] [CrossRef]
- Fouarge, D.; Merve Nezihe, Ö; Seegers, P. Personality Traits, Migration Intentions, and Cultural Distance. IZA Discuss. Pap. 2019, 12444. Available online: https://ssrn.com/abstract=3415790 (accessed on 5 April 2020). [CrossRef]
- Hemming, K.; Tillmann, F.; Reißig, B. Mapping Mobility—Pathways, Institutions and Structural Effects of Youth Mobility. European Research Project. Available online: http://move-project.eu/fileadmin/move/downloads/MOVE_D2_4.pdf (accessed on 21 April 2020).
- Phung, V.; Asghar, Z.; Matiti, M. Understanding how Eastern European migrants use and experience UK health services: A systematic scoping review. BMC Health Serv. Res. 2020, 20, 173. [Google Scholar] [CrossRef]


| Author/Country | Sample/Population Number of Respondents | Analyzed Migration Intention/Question | Analytical Method |
|---|---|---|---|
| Hemming et al. [27]/European countries (survey in Germany, Hungary, Luxembourg, Norway, Romania, Spain) | Youth/Online survey: N = 5499 Qualitative interview: N = 152 | Influence of the country-type characteristics on the macro-level corresponding with individual motivations for intra-European youth mobility | Multi-methods design: Macro analysis on the national level with individual qualitative and quantitative analysis of mobile youth (micro-data from online survey+ interviews). |
| Dohlman et al. [15]/Global | Physicians and medical students/19 articles excerpted from PubMed, Web of Science, EBSCO MEDLINE, Google Scholar databases | Codification of questionnaires asking for motives to emigrate according to Maslow’s theory: basic food and shelter needs, physical and financial security, a need for social belonging, desire to improve educational or professional opportunities (self-esteem), and self-actualization | Literature review, data mining |
| Sandu and Tufis, 2018 [1]/New and Old member states of the EU | Youth/N = 12,708, weighted data | Intentions, motivations, intensity, self-assessment of migration motivations and behavior; 17 reasons for the first migration reduced to five latent dimensions: job, personal communities, education, lifestyle, personal problems | Multi-country comparative analysis, data from YMOBILITY survey |
| Ciarniene and Kumpikaite, 2011 [28]/Lithuania | Students/N = 220 | Reasons for migration: economic, political, socio-demographic, cultural, demographical | Logical analysis, survey |
| Plopeanu et al., 2018 [3]/Romania | Students in economics, three universities (Iasi, Cluj-Napoca, Sibiu)/N = 3051 | Variables influencing the likelihood to migrate after graduation: personal fulfilment through migration (personal value recognition), degree of individual freedom, level of religiosity, previous educational performance, parental role models, and migration experiences abroad | Survey, descriptive statistics |
| Wazir et al., 2017 [26]/Malaysia | Engineering students, public and private universities/N = 227 | Pull factors: employment opportunities, career advancement, salary, employment benefits, and safer and lower crime rate in destination countries | Survey |
| Iacob, 2018 [5]/Romania | Highly skilled workers/N = 370 | Potential brain drain reasons: economic factors (economic instability, unsatisfying salary level in Romania, impossibility to find a work position to correspond to the professional skills in Romania, infrastructure); socio-political factors (political instability, legislative instability, corruption, status of the education system, status of the sanitary system, reunification with family already established abroad, social pressure, Romanian life style), and organizational factors (limited number of carrier opportunities, leadership at the work place in Romania, the interaction with co-workers in Romania). | Survey |
| Suciu et al., 2017 [16]/Romania | Medical student graduates of a Romanian university/N = 957 | Pull factors: higher wage abroad, better living and working condition abroad, disappointment with the Romania healthcare system, gaining living and working experience abroad, personal reason (my partner wants to work/is working abroad), more professional opportunities, shortage of residency opportunities in the chosen specialty in Romania, and lack of job vacancies in the chosen specialty in Romania | Survey |
| Herz et al., 2019 [29]/Europe | Youth/N = 5499 | Influence of (1) macro-structures, (2) individual, (3) family/household, and (4) social networks on migration intentions | Descriptive analysis, multiple logistic regression analysis, prior data (survey) |
| Van Mol, 2016 [30]/EU (28 states) | Youth/N = 13,437 | Analysis of individual and contextual factors related to migration aspirations (mainly economic) | Survey, descriptive analysis |
| Frequency | Percent | Valid Percent | Cumulative Percent | |
|---|---|---|---|---|
| Politehnica University of Bucharest (UPB) | 369 | 20.7 | 20.7 | 20.7 |
| Technical University of Civil Engineering of Bucharest (UTCB) | 364 | 20.4 | 20.4 | 41.1 |
| Technical University of Cluj-Napoca (UTCN) | 337 | 18.9 | 18.9 | 60.0 |
| Gheorghe Asachi Technical University of Iasi (TUIASI) | 354 | 19.9 | 19.9 | 79.9 |
| Politehnica University Timisoara (UPT) | 359 | 20.1 | 20.1 | 100.0 |
| Total | 1782 | 100.0 | 100.0 |
| University | Total | ||||||
|---|---|---|---|---|---|---|---|
| UPB | UTCB | UTCN | TUIASI | UPT | |||
| To what extent are you determined to migrate? | Very little extent | 23.8% | 23.1% | 22.3% | 15.8% | 30.6% | 23.2% |
| Little extent | 18.7% | 21.4% | 25.9% | 20.9% | 20.6% | 21.4% | |
| Some extent | 31.2% | 31.0% | 32.1% | 35.6% | 34.5% | 32.9% | |
| Large extent | 17.1% | 14.0% | 11.3% | 16.1% | 10.6% | 13.9% | |
| Very large extent | 9.2% | 10.4% | 8.3% | 11.6% | 3.6% | 8.6% | |
| Total | 100.0% | 100.0% | 100.0% | 100.0% | 100.0% | 100.0% | |
| Do You Have at Least One Family Member who already Emigrated? | |||||
|---|---|---|---|---|---|
| Frequency | Percent | Valid Percent | Cumulative Percent | ||
| Valid | Yes | 1146 | 64.3 | 64.3 | 64.3 |
| No | 636 | 35.7 | 35.7 | 100.0 | |
| Total | 1782 | 99.9 | 100.0 | ||
| Missing | System | 1 | 0.1 | ||
| Total | 1783 | 100.0 | |||
| Correlations | |||
|---|---|---|---|
| Do You Intend to Work Abroad after Graduation? | Do You Have at Least one Family Member who has already Emigrated? | ||
| Do you intend to work abroad after graduation? | Pearson Correlation | 1 | 0.115 ** |
| Sig. (2-tailed) | 0.000 | ||
| N | 980 | 980 | |
| Do you have at least one family member who has already emigrated? | Pearson Correlation | 0.115 ** | 1 |
| Sig. (2-tailed) | 0.000 | ||
| N | 980 | 1782 | |
| Migration Reasons (Live and Work Abroad) | To What Extent Are You Determined to Leave Romania? | |
|---|---|---|
| 1. Quality of the education system | Correlation Coefficient | 0.228 ** |
| Sig. (2-tailed) | 0.000 | |
| Number of respondents | 1782 | |
| 2. Finding a job corresponding to the acquired skills/qualification | Correlation Coefficient | 0.266 ** |
| Sig. (2-tailed) | 0.000 | |
| Number of respondents | 1782 | |
| 3. Wages/Income | Pearson Correlation | 0.160 ** |
| Sig. (2-tailed) | 0.000 | |
| N | 1782 | |
| 4. Career opportunities | Correlation Coefficient | 0.256 ** |
| Sig. (2-tailed) | 0.000 | |
| Number of respondents | 1782 | |
| 5. Medical system | Correlation Coefficient | 0.144 ** |
| Sig. (2-tailed) | 0.000 | |
| Number of respondents | 1782 | |
| 6. Political environment | Correlation Coefficient | 0.133 ** |
| Sig. (2-tailed) | 0.000 | |
| Number of respondents | 1782 | |
| 7. Family reasons | Correlation Coefficient | −0.052 * |
| Sig. (2-tailed) | 0.027 | |
| Number of respondents | 1782 | |
| 8. Prospects for economic growth of the destination country | Correlation Coefficient | 0.173 ** |
| Sig. (2-tailed) | 0.000 | |
| Number of respondents | 1782 | |
| 9. Desire to gain work experience, professional career (advancement) | Correlation Coefficient | 0.197 ** |
| Sig. (2-tailed) | 0.000 | |
| Number of respondents | 1782 | |
| 10. Equipment/technological infrastructure | Correlation Coefficient | 0.208 ** |
| Sig. (2-tailed) | 0.000 | |
| Number of respondents | 1782 | |
| 11. Corruption | Correlation Coefficient | 0.111 ** |
| Sig. (2-tailed) | 0.000 | |
| Number of respondents de | 1782 | |
| 12. Acquiring new experiences, adventure | Correlation Coefficient | 0.214 ** |
| Sig. (2-tailed) | 0.000 | |
| Number of respondents | 1782 | |
| 13. Do you have at least one family member who has already emigrated? | Correlation Coefficient | 0.123 ** |
| Sig. (2-tailed) | 0.000 | |
| Number of respondents | 1782 | |
| 14. How would you describe your current personal situation from a material-financial point of view? | Correlation Coefficient | −0.094 ** |
| Sig. (2-tailed) | 0.000 | |
| Number of respondents | 1782 | |
| Case Processing Summary | |||
|---|---|---|---|
| N | Marginal Percentage | ||
| 1. Decision to migrate | Not likely | 795 | 44.6% |
| Somewhat likely | 586 | 32.9% | |
| likely | 401 | 22.5% | |
| 2. Quality of the educational system | Very little extent | 121 | 6.8% |
| Little extent | 213 | 12.0% | |
| Some extent | 449 | 25.2% | |
| Large extent | 471 | 26.4% | |
| Very large extent | 528 | 29.6% | |
| 3. Finding a job according to the acquired skills/qualification | Very little extent | 56 | 3.1% |
| Little extent | 63 | 3.5% | |
| Some extent | 303 | 17.0% | |
| Large extent | 581 | 32.6% | |
| Very large extent | 779 | 43.7% | |
| 4. Wages/Income | Very little extent | 35 | 2.0% |
| Little extent | 30 | 1.7% | |
| Some extent | 141 | 7.9% | |
| Large extent | 366 | 20.5% | |
| Very large extent | 1210 | 67.9% | |
| 5. Career opportunities | Very little extent | 32 | 1.8% |
| Little extent | 36 | 2.0% | |
| Some extent | 212 | 11.9% | |
| Large extent | 488 | 27.4% | |
| Very large extent | 1014 | 56.9% | |
| 6. Medical system | Very little extent | 45 | 2.5% |
| Little extent | 99 | 5.6% | |
| Some extent | 321 | 18.0% | |
| Large extent | 447 | 25.1% | |
| Very large extent | 870 | 48.8% | |
| 7. Political system | Very little extent | 150 | 8.4% |
| Little extent | 167 | 9.4% | |
| Some extent | 489 | 27.4% | |
| Large extent | 313 | 17.6% | |
| Very large extent | 663 | 37.2% | |
| 8. Family reasons | Very little extent | 531 | 29.8% |
| Little extent | 290 | 16.3% | |
| Some extent | 404 | 22.7% | |
| Large extent | 268 | 15.0% | |
| Very large extent | 289 | 16.2% | |
| 9. Economic growth prospects of the destination country | Very little extent | 173 | 9.7% |
| Little extent | 214 | 12.0% | |
| Some extent | 500 | 28.1% | |
| Large extent | 439 | 24.6% | |
| Very large extent | 456 | 25.6% | |
| 10. Desire to accumulate work experiences, professional career (advancement) | Very little extent | 40 | 2.2% |
| Little extent | 56 | 3.1% | |
| Some extent | 277 | 15.5% | |
| Large extent | 539 | 30.2% | |
| Very large extent | 870 | 48.8% | |
| 11. Equipment and/or technological infrastructure | Very little extent | 36 | 2.0% |
| Little extent | 56 | 3.1% | |
| Some extent | 305 | 17.1% | |
| Large extent | 503 | 28.2% | |
| Very large extent | 882 | 49.5% | |
| 12. Corruption | Very little extent | 174 | 9.8% |
| Little extent | 160 | 9.0% | |
| Some extent | 311 | 17.5% | |
| Large extent | 288 | 16.2% | |
| Very large extent | 849 | 47.6% | |
| 13. New experiences (adventure) | Very little extent | 44 | 2.5% |
| Little extent | 79 | 4.4% | |
| Some extent | 343 | 19.2% | |
| Large extent | 494 | 27.7% | |
| Very large extent | 822 | 46.1% | |
| 14. Do you have at least one family member who has already emigrated? | No | 636 | 35.7% |
| Yes | 1146 | 64.3% | |
| 15. How would you describe your current personal situation from a material-financial point of view? | Very poor | 54 | 3.0% |
| poor | 114 | 6.4% | |
| fair | 705 | 39.6% | |
| good | 767 | 43.0% | |
| Very good | 142 | 8.0% | |
| Valid | 1782 | 100.0% | |
| Missing | 0 | ||
| Total | 1782 | ||
| Subpopulation | 1686 a | ||
| Step Summary | ||||||
|---|---|---|---|---|---|---|
| Model | Action | Effect(s) | Model Fitting Criteria | Effect Selection Tests | ||
| −2 Log Likelihood | Chi-Square a | df | Sig. | |||
| 0 | Entered | Intercept | 3653.705 | |||
| 1 | Entered | Finding a job according to the acquired skills/qualification | 3511.901 | 141.803 | 8 | 0.000 |
| 2 | Entered | Equipment and/or technological infrastructure | 3466.312 | 45.590 | 8 | 0.000 |
| 3 | Entered | Quality of the educational system | 3427.946 | 38.366 | 8 | 0.000 |
| 4 | Entered | At least one family member emigrated | 3405.074 | 22.872 | 2 | 0.000 |
| 5 | Entered | Family reasons (re-unification with family, to follow a spouse, parents, etc.) | 3375.420 | 29.653 | 8 | 0.000 |
| 6 | Entered | New experiences, adventure | 3346.561 | 28.859 | 8 | 0.000 |
| 7 | Entered | Current personal material-financial situation | 3320.418 | 26.143 | 8 | 0.001 |
| 8 | Entered | Economic growth prospects of the destination country | 3303.041 | 17.378 | 8 | 0.026 |
| Likelihood Ratio Tests | ||||
|---|---|---|---|---|
| Effect | Model Fitting Criteria | Likelihood Ratio Tests | ||
| −2 Log Likelihood of Reduced Model | Chi-Square | df | Sig. | |
| Intercept | 3303.041 a | 0.000 | 0 | |
| 1. Quality of the education system | 3336.830 | 33.790 | 8 | 0.000 |
| 2. Finding a job according to the acquired skills/qualifications | 3346.747 | 43.706 | 8 | 0.000 |
| 3. Family reasons (re-unification with the family, following a spouse, parents, etc.) | 3335.242 | 32.201 | 8 | 0.000 |
| 4. Economic growth prospects of the destination country | 3320.418 | 17.378 | 8 | 0.026 |
| 5. Equipment and/or technological infrastructure | 3326.955 | 23.914 | 8 | 0.002 |
| 6. New experiences, adventure | 3331.276 | 28.236 | 8 | 0.000 |
| 7. At least one family member emigrated | 3324.064 | 21.024 | 2 | 0.000 |
| 8. Current personal material-financial situation | 3329.559 | 26.519 | 8 | 0.001 |
| Decision to Migrate | B | Std. Error | Wald | df | Sig. | |
|---|---|---|---|---|---|---|
| Not likely | Intercept | −0.104 | 0.286 | 0.133 | 1 | 0.716 |
| Quality of the educational system = 1 | 1.240 | 0.370 | 11.229 | 1 | 0.001 | |
| Quality of the educational system = 2 | 0.793 | 0.261 | 9.224 | 1 | 0.002 | |
| Quality of the educational system = 3 | 0.508 | 0.198 | 6.594 | 1 | 0.010 | |
| Finding a job according to the acquired skills/competencies =1 | 2.126 | 0.678 | 9.819 | 1 | 0.002 | |
| Finding a job according to acquired skills/competencies = 2 | 1.665 | 0.505 | 10.854 | 1 | 0.001 | |
| Finding a job according to acquired skills/competencies = 3 | 0.933 | 0.229 | 16.518 | 1 | 0.000 | |
| Finding a job according to acquired skills/competencies = 4 | 0.451 | 0.168 | 7.210 | 1 | 0.007 | |
| Family reasons = 1 | −0.701 | 0.208 | 11.338 | 1 | 0.001 | |
| Family reasons = 2 | −0.713 | 0.237 | 9.085 | 1 | 0.003 | |
| Equipment and/or technological infrastructure = 2 | 1.171 | 0.567 | 4.259 | 1 | 0.039 | |
| Equipment and/or technological infrastructure = 3 | 0.550 | 0.233 | 5.560 | 1 | 0.018 | |
| New experiences, adventure = 2 | 1.126 | 0.413 | 7.416 | 1 | 0.006 | |
| New experiences, adventure = 3 | 0.674 | 0.207 | 10.571 | 1 | 0.001 | |
| At least one family member emigrated = 0 | 0.596 | 0.144 | 17.228 | 1 | 0.000 | |
| Current personal material-financial situation = 1 | −1.188 | 0.418 | 8.088 | 1 | 0.004 | |
| Somewhat likely | Quality of the educational system = 3 | 0.590 | 0.197 | 9.024 | 1 | 0.003 |
| Equipment and/or technological infrastructure = 3 | 0.521 | 0.234 | 4.957 | 1 | 0.026 | |
| Classification | ||||
|---|---|---|---|---|
| Observed | Predicted | |||
| Not Likely | Somewhat Likely | Likely | Percent Correct | |
| Not likely | 568 | 158 | 69 | 71.4% |
| Somewhat likely | 284 | 217 | 85 | 37.0% |
| Likely | 139 | 147 | 115 | 28.7% |
| Overall Percentage | 55.6% | 29.3% | 15.1% | 50.5% |
© 2020 by the authors. Licensee MDPI, Basel, Switzerland. This article is an open access article distributed under the terms and conditions of the Creative Commons Attribution (CC BY) license (http://creativecommons.org/licenses/by/4.0/).
Share and Cite
Gherheș, V.; Dragomir, G.-M.; Cernicova-Buca, M. Migration Intentions of Romanian Engineering Students. Sustainability 2020, 12, 4846. https://doi.org/10.3390/su12124846
Gherheș V, Dragomir G-M, Cernicova-Buca M. Migration Intentions of Romanian Engineering Students. Sustainability. 2020; 12(12):4846. https://doi.org/10.3390/su12124846
Chicago/Turabian StyleGherheș, Vasile, Gabriel-Mugurel Dragomir, and Mariana Cernicova-Buca. 2020. "Migration Intentions of Romanian Engineering Students" Sustainability 12, no. 12: 4846. https://doi.org/10.3390/su12124846
APA StyleGherheș, V., Dragomir, G.-M., & Cernicova-Buca, M. (2020). Migration Intentions of Romanian Engineering Students. Sustainability, 12(12), 4846. https://doi.org/10.3390/su12124846