Article

Exploring Carbon Neutral Potential in Urban Densification: A Precinct Perspective and Scenario Analysis

1
School of Energy and Power Engineering, Changsha University of Science and Technology, Changsha 410114, China
2
UniSA STEM, University of South Australia, Mawson Lakes, Adelaide 5095, Australia
*
Authors to whom correspondence should be addressed.
Sustainability 2020, 12(12), 4814; https://doi.org/10.3390/su12124814
Submission received: 30 April 2020 / Revised: 29 May 2020 / Accepted: 8 June 2020 / Published: 12 June 2020

Abstract

:
Decarbonising the urban built environment for reaching carbon neutrality is high on the agenda for many cities undergoing rapid expansion and densification. As an important urban form, precincts have been increasingly focused on as the context for urban redevelopment planning and at the forefront for trialling carbon reduction measures. However, due to interplays between the built forms and the occupancy, the carbon performance of a precinct is significantly affected by morphological variations, demographical changes, and renewable energy system deployment. Despite much research on the development of low-carbon precincts, there is limited analysis on aggregated effects of population growth, building energy efficiency, renewable energy penetration, and carbon reduction targets in relation to precinct carbon signature and carbon neutral potential for precinct redevelopment and decarbonisation planning. In this paper, an integrated carbon assessment model, including overall precinct carbon emissions and carbon offset contributed by precinct-scale renewable energy harvesting, is developed and applied to examine the lifecycle carbon signature of urban precincts. Using a case study on a residential precinct redevelopment, scenario analysis is employed to explore opportunities for decarbonising densification development and the carbon neutral potential. Results from scenario analysis indicate that redevelopment of buildings with higher-rated energy efficiency and increase of renewable energy penetration can have a long term positive impact on the carbon performance of urban precincts. Meanwhile, demographical factors in precinct evolution also have a strong influence on a precinct’s carbon neutral potential. Whilst population size exerts upward pressure on total carbon emissions, changes in family types and associated consumption behaviour, such as travelling, can make positive contributions to carbon reduction. The analysis also highlights the significance of embodied carbon to the total carbon signature and the carbon reduction potential of a precinct during densification, reinforcing the notion that “develop with less” is as important as carbon offsetting measures for decarbonising the precinct toward carbon neutrality.

1. Introduction

With the fast pace of spatial urbanisation and the expansion of urban population, most cities around the world, especially those in the Asia-Pacific region, have been continuously densified with expansion and redevelopment. As a trend, it is anticipated that globally the size of urban building stock will double by 2050 [1] to cater for soaring demand for housing, urban services, education, health, and transport facilities due to urban population growth, which has grown by 10% over the past decade [2,3].
Among many sustainability implications imposed by such a development, greenhouse gas (GHG) emissions (also known as carbon emissions) have become a major challenge for urban densification. Urban built forms contribute to over one third of total carbon emissions [4,5] and a staggering 71% of energy-related carbon emissions. Much of these can be attributed to residential buildings [3,6]. Significant proportions of such carbon footprint are consumption-based, including both the direct and the life-cycle carbon emissions associated with objects (e.g., buildings, equipment, infrastructure, space) and socio-economic activities (e.g., production, services, transport, lifestyle, and entertainment) within the geographical boundary of a city. These also encompass those emissions occurring outside the city boundary but related to (or ‘‘embodied’’ in) goods and services consumed by functions and residents inside the city [7]. As reported in the study by Wiedmann et al., commercial and public sectors are responsible for only one third of consumption-based carbon emissions, whilst the rest (close to two thirds) are contributed by households, attributed to buildings, electricity and transport as well as public and commercial services [8].
Despite the pressure exerted by urban (re)development on carbon footprint, studies have also shown that a negative correlation between urbanisation and carbon emissions can be obtained over time through positive planning and intervention strategies toward ‘‘decarbonising’’ urban systems with innovative technologies and regenerative development approaches [9,10]. Literature indicates that operational carbon associated with building energy consumption, embodied carbon from the building material production and construction activities as well as the carbon associated with travelling by residents for commuting are the three major emission sources for cities [8,11,12]. Decarbonisation aims to achieve a reduced, or even net zero, carbon signature by balancing those emission sources with carbon removal through offsetting measures. On the carbon reduction side, size of floor area, energy efficiency of appliances as well as climate rendition of building construction and use are key influencing factors for building energy demand and carbon performance [3,13]. Much of the effort for reducing energy intensity has been invested in improving building envelopes and passive design features with better insulation [14,15], double/triple glazing [16], orientation, and shading to enhance natural ventilation and improve lighting performance [17]. Scenario analysis on Xiamen City, China, indicates that annual operational energy associated carbon can be reduced by up to 3.15 million tCO2-e by increasing energy efficient design for new buildings and energy-saving retrofit for existing buildings [18]. However, coupled with a strong growth in total floor area, new or renovated buildings equipped with energy-efficient designs and technologies can also contribute significantly to the increase of material intensities and embodied carbon [19]. Alongside savings in operational carbon, reducing carbon embodied in construction materials and processes is now also considered as imperative and increasingly crucial for decarbonising urban development toward the net zero carbon goal [2,20].
Recent studies have also highlighted that carbon emissions, especially the emissions associated with household energy use and travelling behaviour, are closely linked with and strongly influenced by demographic characteristics, particularly household size, household composition, age groups, affluence/income levels, and education backgrounds [12,21,22,23]. Despite the pressure of population growth in urban densification on the carbon performance of cities, having properly managed population density and social urbanisation with improved low-carbon awareness and consumption behaviour can lead to positive outcomes of carbon reduction [24].
Better passive building designs and strategic planning for demographic changes are effective in mitigating carbon emissions related to energy demand and consumption behaviour, which largely make up scope 1 and scope 3 emissions of cities [8]. As a key mechanism to decarbonise electricity production, renewable-energy harvesting units (RHUs) such as solar photovoltaic (PV), solar water heaters (SWHs), and small-scale wind turbine systems, have found wide application as an affordable way to offset the scope 2 emissions from direct electricity use by households. There is abundant literature on carbon benefits from the deployment of solar-energy harvesting units (SHUs), e.g., solar PV and SWHs. Recent studies indicate that an increased coverage of roof-top SHU deployment not only ensures fulfilling energy demand with cleaner energy supply [25,26] but also provides viable carbon payback [27]. Moreover, renewable energy integrated hybrid power systems can also improve energy resilience as well as balance the energy supply and demand for a maximum of economic and carbon benefits [28]. Although SHUs are attributable to an emission-free electricity production, the systems are not entirely carbon-free throughout their life cycles when it comes to energy consumed and carbon emissions embodied in the manufacturing, maintenance, and recycling of the modules, which can account for 49.9 g CO2-eq/kWh [29]. Therefore, like carbon mitigation for buildings and consumption behaviour, both the benefits and burdens of SHUs for the carbon impact of urban densification need to be properly assessed and balanced in conjunction with the effects of other factors and measures for decarbonising urban built forms [20].
Considering physical, spatial, and functional complexities of urban built forms, carbon mitigation measures need to be targeted to the relevant urban settings. As a dominant urban form that encompasses place, people, and constructed objects at a meso-scale, ‘‘precinct’’ has been increasingly used as an ideal ‘‘spatial lens’’ for development planning and urban design purposes. A precinct can be defined as part of an urban area with definite geographical boundaries and certain functions that involve interplays of land, buildings, infrastructure (energy, transport, water, and waste), and occupants [5]. In the context of urban redevelopment and densification, a precinct can be treated as a single entity by urban planners and decision makers to analyse its morphological configuration, operations, and interactions with surrounding urban features and objects for examining and managing carbon signatures thus incurred in accordance with planning purposes [7]. Notwithstanding a growing body of literature on smart and sustainable city development toward decarbonising urban systems [30,31] extant research on the methodologies of precinct-level planning and intervention for low-carbon development is still scarce. Failing to consider buildings, occupants, and the precinct environment as a whole integrated system risks reaching biased or over-simplified solutions that have limited effects on reaching zero-carbon outcomes. Despite much research on the development of low-carbon precincts, there is limited analysis on aggregated effects of population growth, building energy efficiency, renewable energy penetration, and carbon reduction targets in relation to precinct carbon signature and carbon neutral potential for precinct redevelopment and decarbonisation planning. Therefore, to assess the carbon implications of an evolving precinct and explore potential for carbon reduction, it is vital to examine and address the following key questions for informing planning decisions:
  • How and to what extent will population increase with demographic changes affect the carbon signature of redeveloping a precinct?
  • What are operational, embodied, and travelling carbon implications for a precinct in relation to different redevelopment plans?
  • To what extent do energy-efficient buildings, particularly residential buildings, contribute to the total carbon reduction in precinct densification?
  • To what extent do renewable energies, particular SHUs, affect the total carbon reduction in precinct densification?
  • Can carbon neutrality be realistically achieved with an increased penetration rate of SHUs?
To this end, this paper presents an integrated carbon assessment model that captures factors of urban evolution (including demographic changes as well as redevelopment and renovation of built objects) and renewable energy penetration to support the evaluation of decarbonisation options on a precinct scale. A case example of precinct redevelopment for densification is also examined with scenario analysis to identify the impacts of building and demographic and renewable energy factors on the operational, embodied, and travelling carbon signatures as well as on the potential for reaching carbon neutrality.

2. Research Methodology and Modelling Tool

Over the years, a growing body of research has been conducted to study the impacts on energy consumption associated carbon emissions resulting from physical factors (e.g., energy efficiencies of buildings, appliances, and infrastructure) and occupant behaviour on precinct objects including buildings and infrastructure operations (e.g., comfort setting and operating schedules) as well as carbon offsetting contributed by renewable energy harvesting. These studies play a crucial role in delivering solutions for urban sustainability. However, a building is not an isolated system but an evolving subsystem closely linked to the behaviour of its occupants and the dynamics of the surrounding built environment in which it is situated and operated. Therefore, in this research, an integrated model considering renewable energy penetration and precinct evolutions (including demographic changes and redevelopment of precinct objects) is developed to support the carbon performance assessment and to examine the carbon neutral potential for planning precinct (re)development.

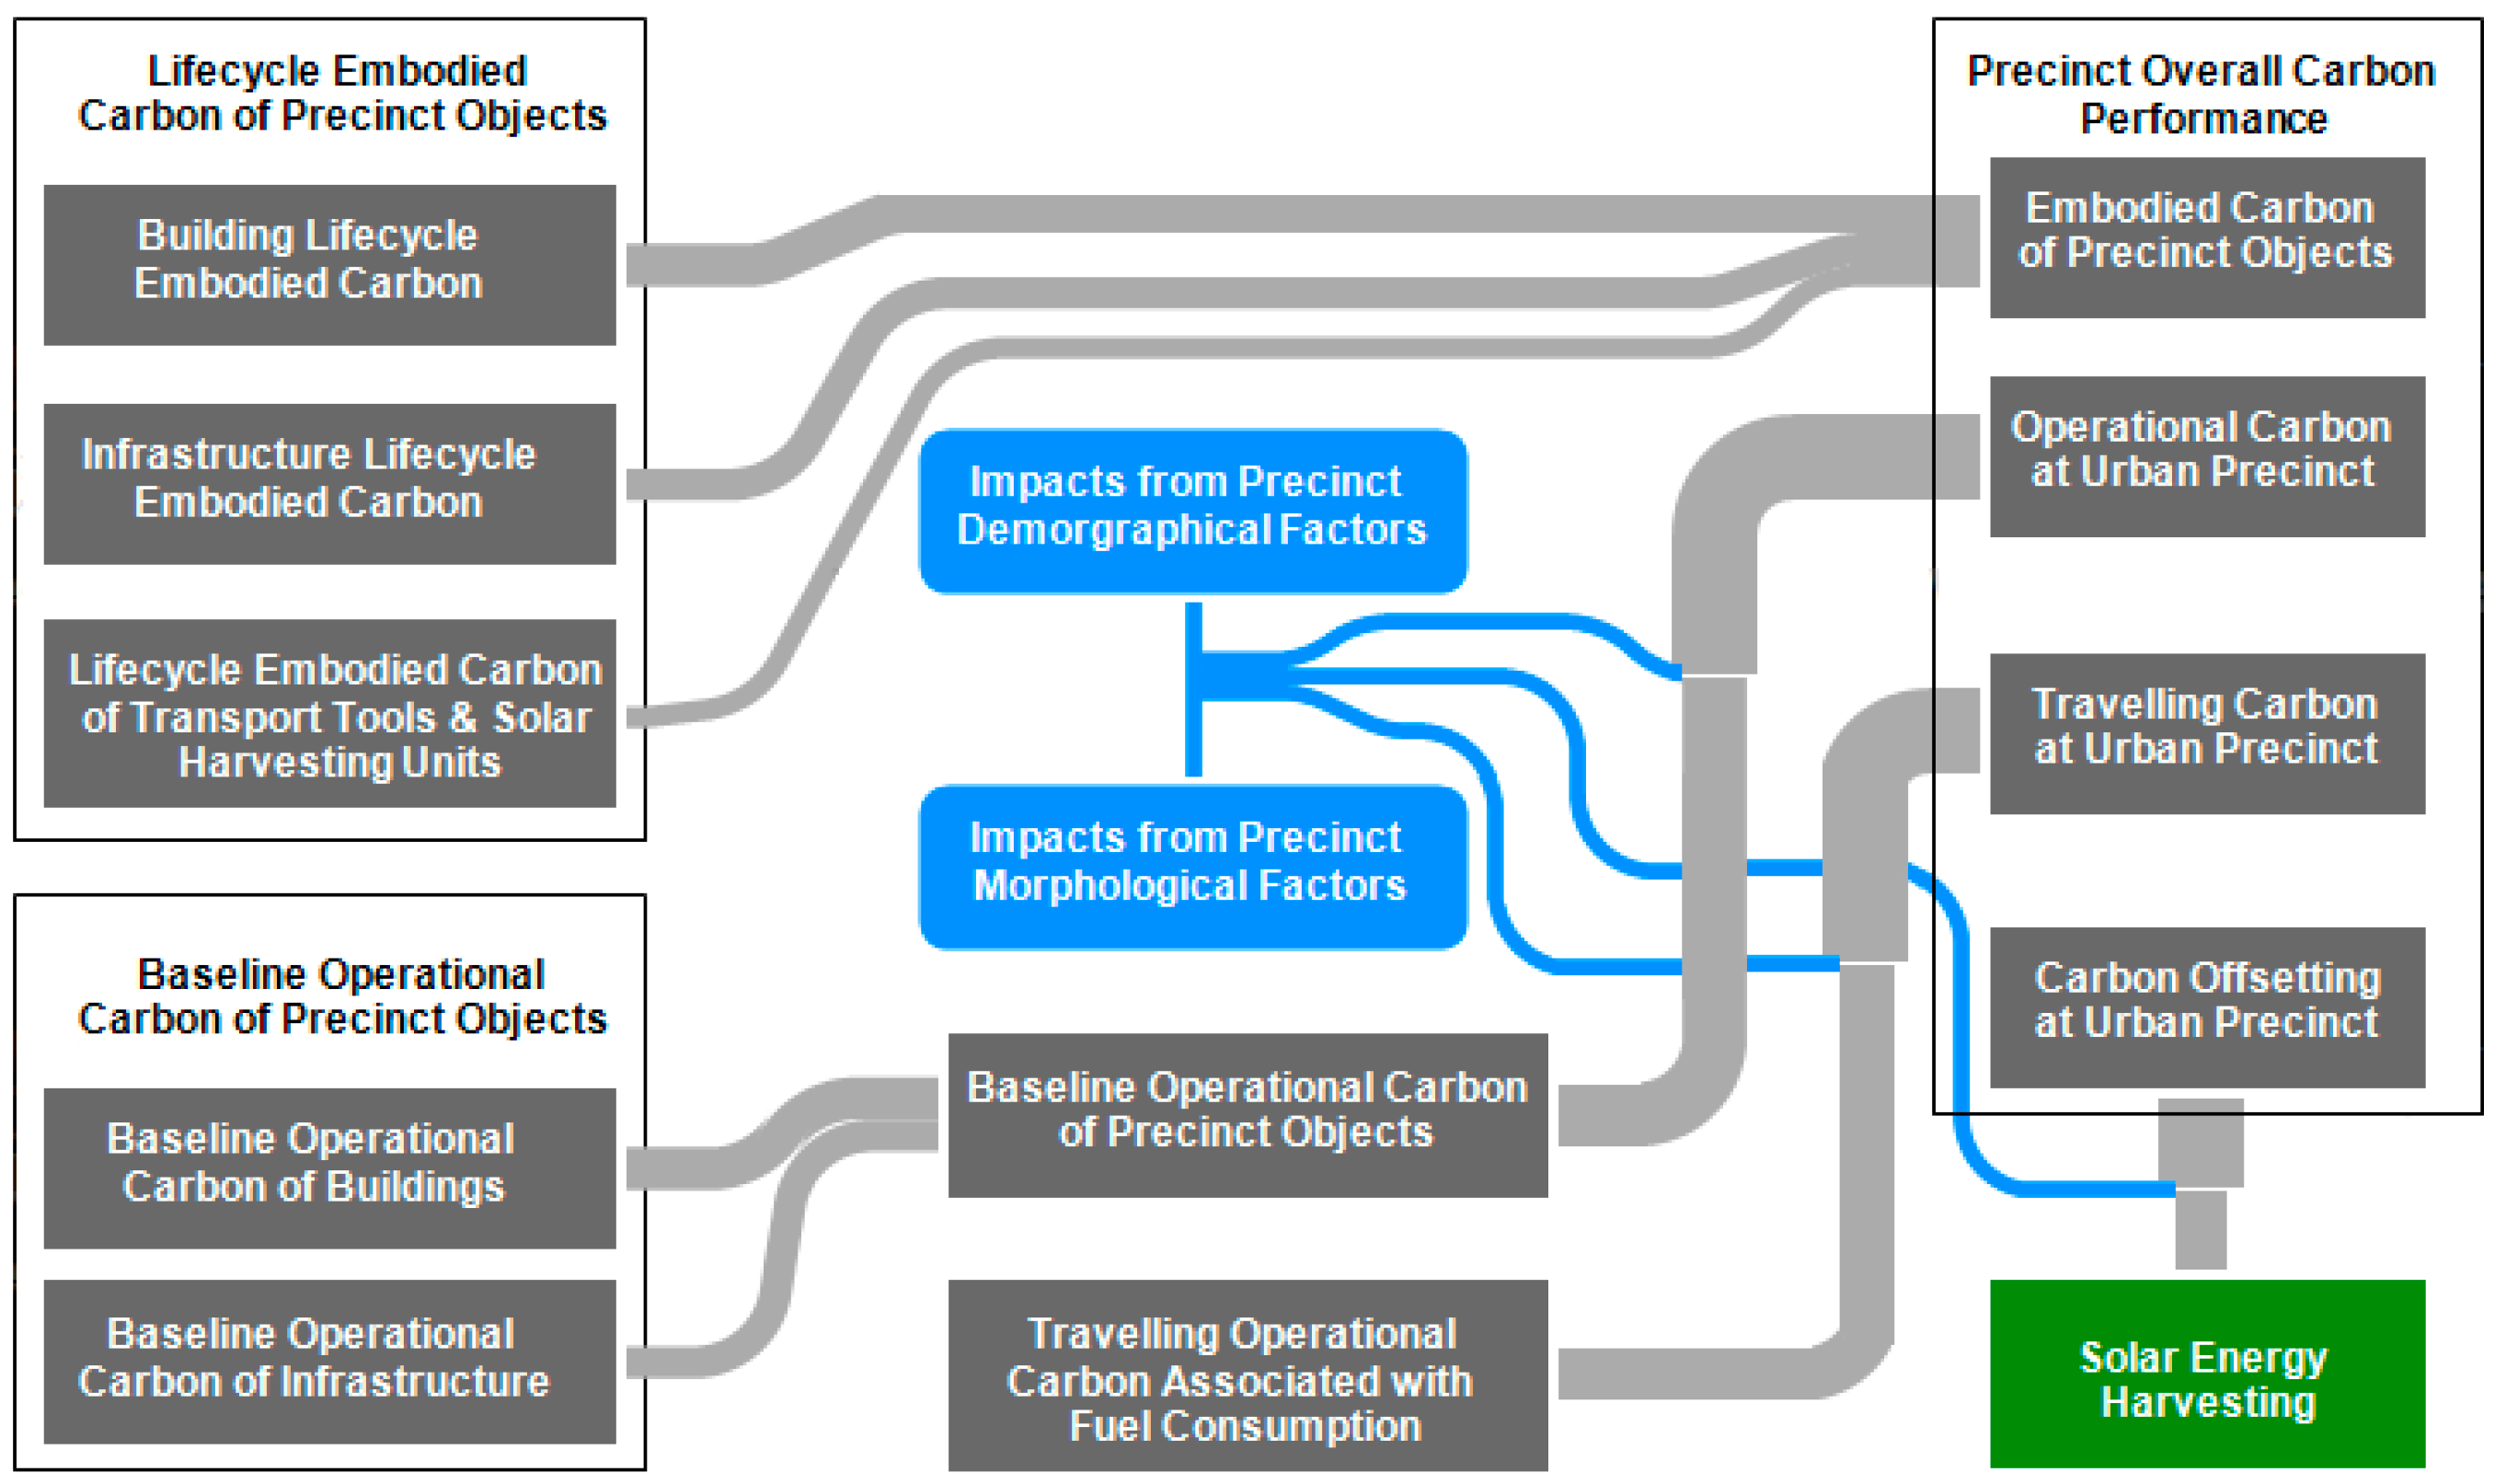
2.1. System Boundary Selection

As the urban precinct is ‘‘a system of many interconnected systems’’, a realistic, holistic, and accurate evaluation of its carbon neutrality can be achieved by integrating the embodied carbon of precinct objects and operational and travelling carbon associated with energy consumption by occupants’ activities (e.g., use of appliances, daily commuting for work/education, recreational travels, etc.) as well as the carbon offset contributed by RHUs. Therefore, the overall precinct carbon signature can be assessed with four distinct but inter-linked components: (1) total lifecycle carbon embodied in precinct objects, RHUs, and transport systems; (2) total carbon emissions associated with energy consumption for the operation of precinct objects; (3) total carbon emissions associated with travels of precinct occupants; and (4) total carbon offsetting contributed by renewable energy harvesting.
Based on these inputs, the precinct-level carbon assessment can be formulated and evaluated with an extended consideration of integrating embodied, operational and travelling carbon with the carbon offsetting. The boundary established for modelling and assessment of precinct carbon neutrality can then be illustrated as Figure 1 (where the carbon flow is coloured “grey”, impacts are coloured “blue”, and renewable energy harvesting is coloured “green”). Compared to the building-level assessment, precinct-level emissions should be modelled and evaluated at both temporal and spatial scales. With respect to the time scale, operational carbon varies over the lifespan of precincts due to changes in residential groups as well as the energy efficiency and recurring embodied carbon of precinct objects. At the spatial scale, morphology, location, and urban density are found to be the major influences on transport and operating associated carbon as well as SHU efficiency. Therefore, these factors, together with feasible deployment of solar PV and SWHs, are of particular interest for examining the carbon impacts of precinct (re)development.

2.2. Carbon Neutral Assessment and Performance Metrics

To support the identification of precinct carbon neutral potential in an evolutionary manner, a modelling strategy and a framework have been developed for scenario analysis and decision making based on previous work in this research [7,32]. As shown in Figure 2 (where the carbon flow is coloured “grey”, energy flow is coloured “orange”, cost flow is coloured “red”, renewable energy harvesting is coloured “green”, while the half coloured boxes means conversion of data types), the precinct-scale carbon assessment is underpinned by an integrated model that consists of four key phases. At Phase 1, carbon intensities for embodied, operational, and travel-related emissions are identified. The embodied intensity represented by kg CO2-e per square meter of floor area for each precinct object type is determined by the lifecycle carbon content of the main construction materials, the replacement cycle and waste ratio of building components, and carbon embodied in construction activities. The embodied carbon intensities of SHUs are derived from the lifecycle carbon of elements as well as related assembly and maintenance services, measured as kg CO2-e/kWp for PVs and kg CO2-e/each for SWHs. As for the embodied carbon of the transport systems, the intensity data is based on a previous study conducted in South Australia [33]. To determine operational carbon intensities, operational energy intensities of precinct objects of household types are firstly assessed and then converted by using local energy-to-carbon factors. Meanwhile, travel-related carbon intensities are calculated based on the annual travelling expenditure of each family type, average fuel cost, and the carbon factor of each fuel type (measured as kg CO2-e/dollar).
Phase 2 is developed to identify the baseline carbon emissions of the assessed precinct. In this stage, demographical factors (e.g., amount of each family type, age groups, income groups, etc.), energy efficiency of each precinct object type, and occupant lifestyle preferences (e.g., total floor area of each building type, schedule of appliances, travelling frequency and distance, etc.) are examined to support the calculation of the overall baseline carbon emissions of the precinct. Moreover, the baseline carbon offset is also calculated by converting renewable energy harvesting with the energy-to-carbon factor of local power production. Phase 3 is designed to improve the accuracy of precinct carbon assessment. At this stage, effects of precinct morphological factors (e.g., compactness, density, building orientation and obstruction angle, etc.) are incorporated to moderate the baseline carbon emissions of precinct objects and occupancy and carbon offset contributed by SHUs. The master plan of the precinct is also analysed to examine the strength of influencing factors such as urban density and solar potential. Phase 4 is established to assess the carbon neutrality of the precinct or to identify the potential if carbon neutrality has not yet been achieved. Here, the carbon neutral potential is examined through exploring scenarios by varying morphological, demographical and energy and time factors, together with sensitivity analysis.

2.3. Precinct Carbon Assessment Tool

Underpinned by the methods and framework discussed, the Precinct Carbon Assessment (PCA) tool is developed in this research to support the precinct lifecycle carbon modelling and carbon neutrality assessment. The PCA tool aims to provide both highly aggregated as well as more detailed assessments of the embodied and operational carbon of precinct objects, travel-related emissions of occupants, and carbon offset contributed by SHUs. In addition, the PCA tool can also be employed for building-level lifecycle carbon assessment (with the assumption of a “single-building precinct” as a special case). As shown in Figure 3 and Table 1, the PCA tool provides six main function modules, each with a drop-down menu to provide detailed modelling and dedicated assessment functions.
Targeted at different end-users, the input parameters of the PCA tool are structured for three modelling levels to satisfy the requirements of different assessment scenarios. The first level is developed to suit urban planners and government agencies for early-stage planning with limited construction details. Simulations at this level use highly aggregated data presented as energy/carbon intensity per square meter for each object type. The second level is designed for building and construction practitioners, where intensity data per square meter can be built up based on material usage as well as the units of use and the operating schedule for each appliance type. The third level allows modelling with more detailed inputs about precinct objects design and travel mode selection to support the examination of carbon neutral potential at precincts. In this study, the third level of modelling is employed for precinct carbon neutral assessment and scenario analysis.

3. Case Study and Scenarios

In this section, the PCA tool is applied to assess the carbon performance and identify the carbon neutral potential of a selected precinct redevelopment with different scenarios. The objective is to examine the influences of precinct-built forms, occupant demographics, deployment of SHUs, and a carbon neutral target on decarbonizing precinct redevelopment in relation to the five questions posed in Section 1.

3.1. Case Study Setting

The studied precinct is a typical outer residential suburb, which was selected by the local government to showcase cutting edge eco-friendly development and has a master plan based on sustainable principles. The precinct appears to be a desirable option due to three main factors: the energy-efficient redevelopment of precinct objects with high SHU penetration, all the dwellings are installed with in-home monitoring systems for data access, and it presents typical demographical features. Census data collected by the Australian Bureau of Statistics (ABS) in 2011 indicates that this 273-hectare precinct had a population size of 6244 living in 2072 detached single-storey houses and 32 detached two-storey townhouses [34]. The 2018 Census data indicates that the precinct population size experienced a significant increase to 8023 residents occupying 1494 detached single-storey houses and 1156 detached two-storey townhouses. In addition, there was a dramatic growth of PV penetration at the precinct from 2142.5 kWp in 2011 to 5610.5 kWp in 2018. To support the modelling and scenario analysis, the precinct families are classified into three different categories according to the demographical features. Characteristics of each family type are summarized in Table 2, and the operational and travelling carbon intensities of typical households from the three family types can be found in Appendix A (Table A1).
Considering both feasibility and low-carbon planning purposes, the key factors and their settings for possible redevelopment scenarios are:
  • Energy-efficient Buildings: the precinct is redeveloped with energy-efficient new buildings, assuming some of the current dwellings are replaced by new buildings with 7.5-star energy ratings. While compared to the old dwellings, new buildings have a greater floor area but a smaller lot of land since they are built as two-storey townhouses.
  • Renewable Energy Uptake: the deployment of SHUs is increased across the precinct. Rooftop PVs can be increased up to 50% coverage of the total building roof area and the take-up ratio of household SWHs may expand to reach 100% installation.
  • Eco-friendly Occupants: the demographics evolving with the precinct trend toward younger age groups and smaller-sized households, with relatively high educational backgrounds, more awareness of climate change, and a stronger tendency toward environmental friendly consumption behaviour.
  • Carbon Neutrality Target: this is to define the planning horizon/time frame for carbon reduction toward zero carbon. Currently, the European Union, the United Kingdom, and Australia have in place emission reduction targets for decarbonising industrial and economic activities by 2030. Meanwhile, many jurisdictions also have reaching carbon neutrality by 2050 as part of their policy position or pledge in relation to the Paris Agreement. Thus, there are two options for planning consideration, i.e., 2030 and 2050.
In this study, two scenarios are evaluated and compared with the ‘‘Baseline’’ as the precinct context in 2011, which are the following:
  • Scenario 1: (a) To satisfy the accommodation demand due to population growth, 27.90% of the existing detached houses were demolished, with each lot of land subdivided to redevelop two new townhouses; (b) considering the building types in the studied precinct and their roof styles, each new townhouse is assumed to be equipped with a 3.0 kWp PV system and a SWH; (c) Type 1 and Type 2 families increased while Type 3 families decreased with precinct evolution; and (d) the planning horizon for carbon neutrality is set at 10 years, from 2020 to 2030, representing an aspiring decarbonising target.
  • Scenario 2: Whilst the building redevelopment, renewable energy uptake and demographical changes are the same as those of Scenario 1, the planning horizon for carbon neutrality is extended by 30 years to 2050, representing a less radical push.
The intensities and factors involved in the simulations can be found in Appendix A (Table A2 and Table A3), with detailed profiles of each scenario found in Table 3. The scheme for the scenario design and analysis is illustrated as Figure 5.

3.2. Scenario Analysis

Simulations are conducted by using the PCA tool, with the results shown in Table 4. The comparison between different scenarios in relation to their carbon signature is summarized in Table 4. According to the results, the per capita annual net carbon signature of Scenario 1 goes up by 15.89% from that of the Baseline, despite having more energy-efficient new dwellings, an increased PV penetration by 161.87%, and the growth of SWH installation by 40.58%. This is mainly attributed to the rise of embodied carbon contributed by redevelopment of precinct objects and expansion of SHUs installed. While the annual net carbon per capita in Scenario 2 decreases by 8.72% compared to the Baseline, this is a result of a lower amortised embodied carbon of new dwellings over a longer period (i.e., 30 years). Further comparison between the Baseline and the two scenarios also indicated that a reduction of 11.69% per capita and 20.18% per household in operational carbon is achieved by having high energy efficiency new dwellings. However, the benefits of operational carbon reduction and carbon offsetting effects from expansion of SHU deployment appear far less significant when compared to the sizeable embodied carbon of the precinct objects annualized within a relatively short period (i.e., 10 years). Scenario 2 is found to have a greater potential (or the least gap) to reach carbon neutrality, which can be attributed to the long-term effects of new dwellings with more accumulated benefits of carbon offset from SHUs, operational carbon savings, and reduced travelling carbon. As both Scenario 1 and Scenario 2 incorporate 28.49% population growth, with anticipated demographic changes, this contributes to an increase of total travelling associated carbon and a slight decrease of per capita travelling carbon.
Figure 6 illustrates the breakdowns of precinct carbon profiles under the three different scenarios. Results indicate that operational carbon represents the largest proportion in the overall emissions of the precinct across all the scenarios. However, with the increase of SHU penetration and dwelling redevelopment, the precinct experienced a significant growth of embodied carbon in both Scenario 1 and Scenario 2.
Further breakdown of precinct embodied carbon shown in Figure 7 indicates that residential buildings are the major contributors to the embodied carbon. However, Scenario 1 and Scenario 2 show a higher embodied carbon associated with SHUs due to the higher deployment rate. As to the precinct operational carbon (shown in Figure 8), public buildings are the main contributors. This is a result of longer operating hours with more appliances required in this type of building. In light of the results from the analysis, it is reasonable to conclude that precinct evolution (in both built forms and demographics) and SHU deployment play essential roles in shaping the precinct carbon signature.
As discussed in the previous section, increasing SHU deployment represents a potent solution for precinct carbon reduction. To further examine the carbon neutral potential for Scenario 1 and Scenario 2, simulations are implemented by moderating the SHU penetration rate to test the feasibility of reaching carbon neutrality. The results are summarized in Table 5. Based on the space requirement for SHU deployment, carbon neutrality can be practically achieved in both scenarios as the required roof space for PV installations is less than 50% of the total roof areas in the precinct. The results indicate that in Scenario 1, 31.9% of total building roof areas are required for PV panels in order to deliver an offset for full carbon neutrality, while in Scenario 2 carbon neutrality can be achieved with only 23.4% of the total building roof areas covered with PV panels. Therefore, it can be concluded that increase SHU penetration is a feasible option for precinct carbon neutrality, particularly for achieving the carbon reduction target within a short time frame. Whilst aiming for reaching carbon neutrality within 10 years by 2030 (Scenario 1) does add upfront pressure for a higher coverage of PV panels, further analysis indicates that additional carbon savings of 438,108.1 tCO2-e in total can be accrued from 2030 to 2050 in comparison with Scenario 2.

3.3. Discussion

Based on the scenarios analysed in the case study, the following key observations are derived in relation to those precinct carbon assessment questions for informing planning decisions.
  • Impact of Population and Demographics: Although it is apparent that population factors do have considerable impact on the carbon performance of a precinct under redevelopment, effects of such influence are rather mixed. The expansion of population size during densification clearly imposes upward pressure on the total carbon emissions of the precinct. This leads to a whopping 48% rise in total precinct carbon in Scenario 1 compared with that of the Baseline, whereas the difference between the respective population sizes is just around 28%. The positive correlation between population growth and upsurge of carbon signature is attributable to extra demand for essential services and more consumption-related activities, represented by the significantly increased volumes of dwellings, travelling, public buildings and infrastructure. Meanwhile, the change in the precinct occupant profile (as represented by the variations in the family types), appears to have a damping effect, as indicated by a slight decrease of travelling carbon per capita from 1.39 tCO2-e/person (Baseline) to 1.34 tCO2-e/person (Scenario 1) as well as a similar drop in operational carbon per capita. Considering the pattern of change and the differences among those family types, it is postulated that a strategic planning for demographical changes with moderation on consumption behaviour of precinct occupants can produce positive results for carbon reduction. While this is consistent with the findings reported in some previous studies, more detailed and comprehensive scenario designs need to be explored for further in-depth analysis on impacts of occupant demographics and their consumption behaviour (both energy and other lifestyle-related consumption) on precinct carbon signature as well as decarbonisation opportunities.
  • Impact of Energy-efficient Dwellings: Having highly energy-efficient buildings, particularly residential buildings, has been widely promoted as essential for decarbonising urbanisation. The outcomes reported from the scenario analysis give the impression supportive to this notion, showing that the improvement in energy efficiency of new dwellings is correlated with a reduction of annual operational carbon for all residential building types (as shown in Figure 7) by about 20% in the carbon intensity per floor area. Despite such results, it is noteworthy that the effects of energy-efficient residential buildings also appear very limited when viewed at the whole precinct scale. As reflected in the scenarios, the contribution of residential buildings to the annual operational carbon related to all building types is 39% in the Baseline context and about 35% for Scenarios 1 and Scenario 2, which translates to a reduction of just 10.3%. Much of the benefit of having more energy-efficient new dwellings is counterbalanced by much higher carbon emissions attributable to public and commercial buildings, which also increase substantially coupled with population growth. This limited effect can also be related to the modest replacement rate for residential buildings during densification, assumed as around 28%; In this case, the ‘‘old’’, less energy-efficient dwellings still represent 55.7% of total buildings. Therefore, it indicates that the impact of introducing energy-efficient new residential buildings shall not be overstated, especially in the context of redeveloping an existing precinct (i.e., a ‘‘grey-field’’ type development) rather than constructing a completely new one (i.e., a ‘‘green-field’ type development).
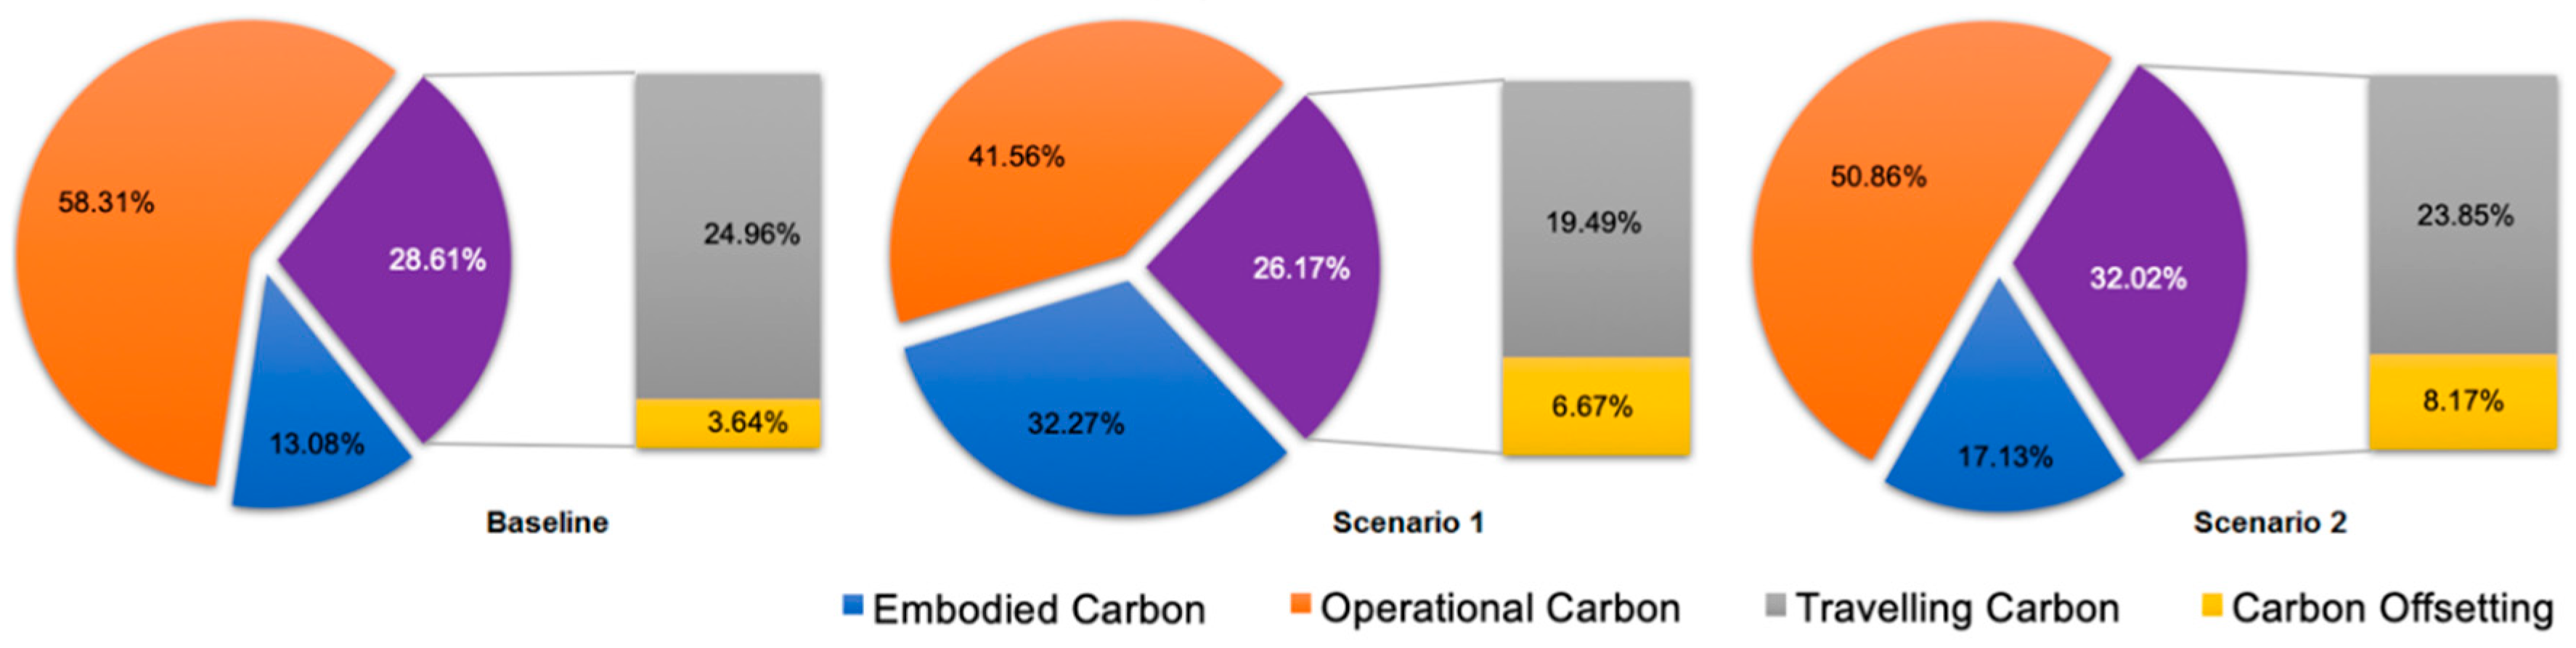
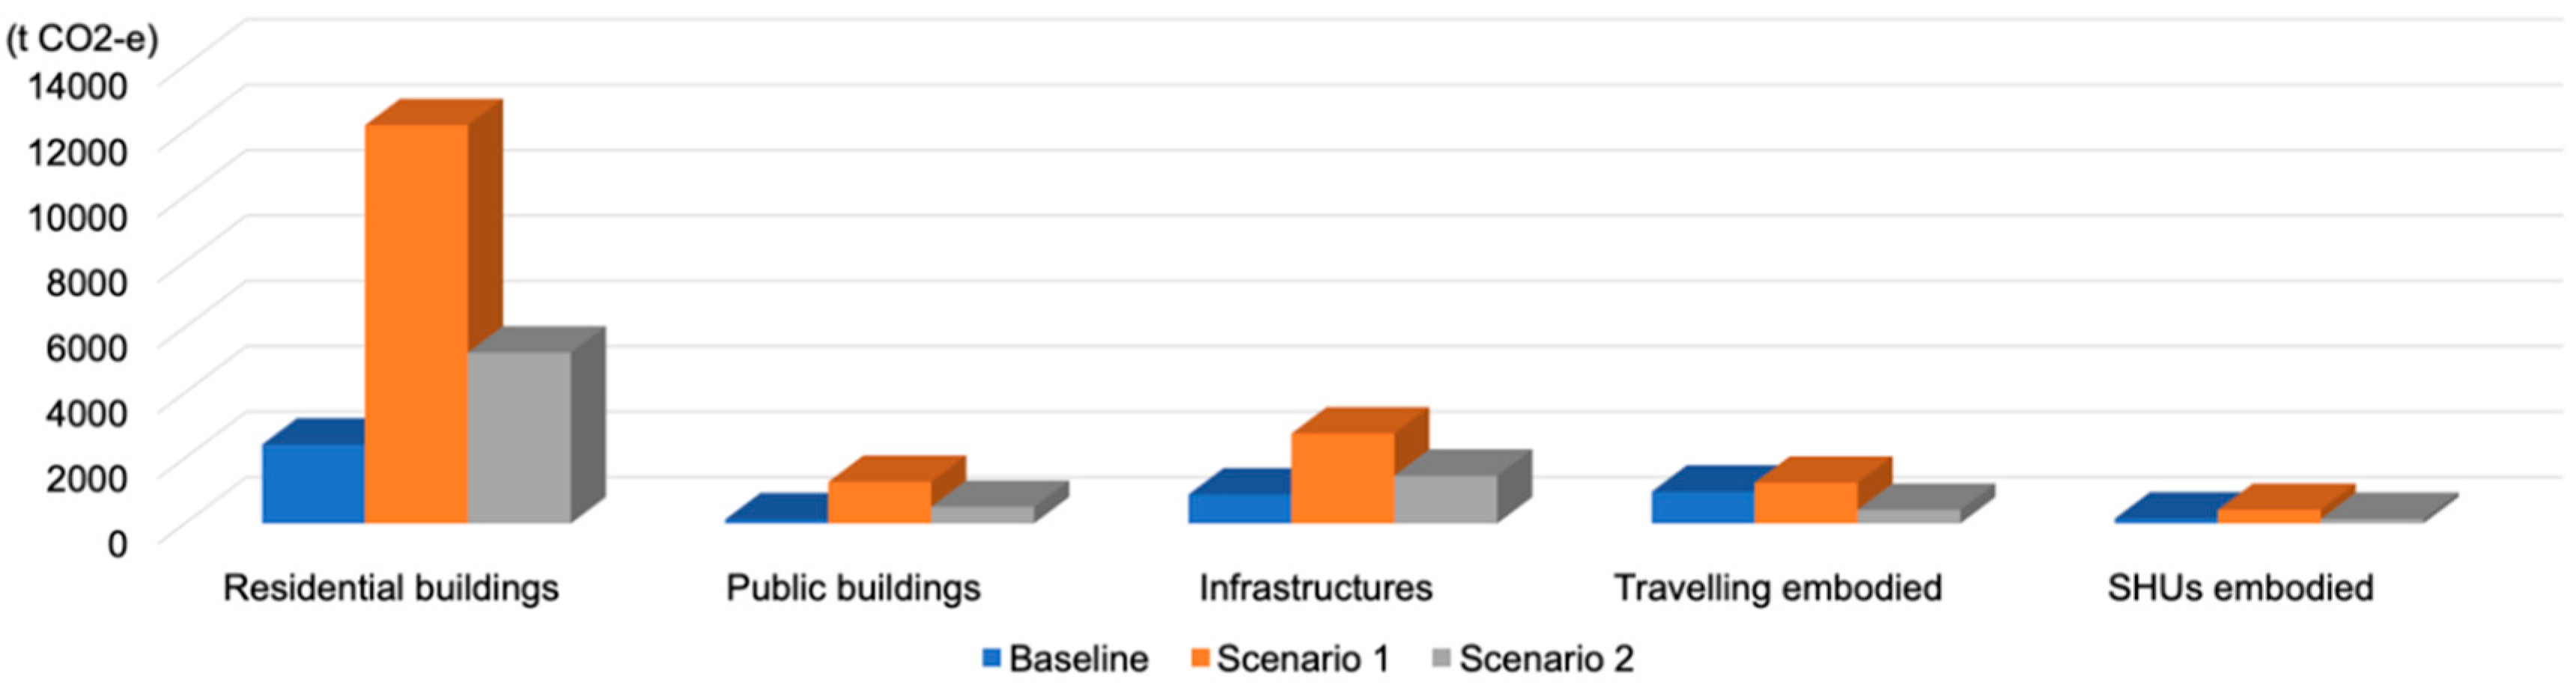
  • Contributions of Operational, Embodied, and Travelling Carbon Emissions: As the emphasis on reducing carbon has been primarily on improving operational systems, what is clearly demonstrated in this case study are the sizeable contributions by embodied and travelling emissions. For individual categories, the operational carbon of all precinct objects combined still accounts for the largest proportion across all scenarios (see Figure 5). However, such a dominance decreases when more (new) buildings and household consumption become energy/carbon efficient, reflected by the reduction of annual operational carbon on both the per capita and the per floor area basis. In the meantime, the influence of embodied carbon noticeably increases, which is particularly strong when the carbon reduction target is ambitious (i.e., having the depreciation of ‘‘capital carbon’’ fast-tracked by 2030, as indicated in Scenario 1). The increase of embodied carbon is positively correlated with the expansion of total floor area in the precinct due to densification but at a much higher pace. This suggests the material-intensive nature of urban densification, particularly with infrastructure expansion taken into consideration, even though the efficiency of operational systems is improved. Moreover, highlighted by the scenario analysis is the magnitude of travelling carbon, amounting to 20~25% of the total precinct carbon. In this case study, the travelling carbon calculation draws upon household expenses on transport due to limitations in data availability. Although it does not provide the same granularity of result analysis as using the frequency and the distance engaged for each travelling mode would, the advantage of this method is to signify the importance of using the perspective of “consumption behaviour”, especially the change in it, to examine the precinct carbon performance. For further in-depth analysis, it is advised to have the consumption lens refined and more embedded in the scenario design for investigating the carbon contributions of all emission categories. This will better inform planning decisions for intervention strategies.
  • Effects of Renewable Energy Harvesting: It is evident that implementation of rooftop PV and solar hot-water units has a profound impact on offsetting the carbon emissions to move the precinct’s net carbon profile in a positive direction. Whereas the uptake rate and the system capacity of SHUs initially set for the scenarios are effective for bringing down the total carbon, they are far from enough to enable the precinct to reach carbon neutrality within the set time frames until the coverage of SHU installation in the precinct is raised drastically, i.e., from 1.67% of the total roof area to 31.9% (for 2030) or 23.4% (for 2050). Moreover, the contribution of SHUs to the annual carbon reduction from that of the Baseline, as presented in Table 4, also appears modest on the per capita basis in comparison with the reduction achieved in operational carbon and travelling carbon combined. In addition, this case study also takes into account the embodied carbon of SHUs, increasing proportionally with the expansion of installation and the system capacity, which adds to the burden for carbon offsetting. All these results indicate that the role of SHUs, although important, requires a more balanced view, especially in conjunction with other factors for carbon reduction. Due to limitations in the data availability and the scope of case context, the scenario analysis does not include other precinct-based renewable energy system solutions, including implications of electric vehicles (which also affect travelling carbon) and “vehicle battery to grid” scenarios, as well as off-site carbon offsetting options. These need to be explored in future studies.
  • Decarbonisation and Carbon Neutral Potential: Overall, the scenario analysis in the case study demonstrates that a total carbon reduction can only be achieved through a combination of changes with eco-friendly demographics, higher building energy efficiency, much expanded uptake of SHUs, and a longer planning horizon. According to Table 2, compared with the Baseline, the total carbon per capita after offset is increased by 15.9% in Scenario 1, whilst reduced by 8.3% in Scenario 2. The similar comparisons based on per unit of floor area (m2), however, show 19% increase in Scenario 1 and 6% reduction in Scenario 2. Such differences reinforce two key messages: (1) embodied carbon can play a decisive role in defining the carbon position of a precinct, and (2) the growth in total floor area has a higher impact on carbon emissions than the growth in population size does. Therefore, to effectively decarbonise the densification of the precinct, it is essential to “develop with less”—less carbon intensity and less material intensity. That is, the planning strategies need to aim for decoupling development from expansion of floor area and from increase of carbon content in material use. Whilst offsetting total carbon emissions to reach the carbon neutral target appears attainable with SHUs, it does have practical implications and is subject to the scope of carbon components and the time frame to offset. Having both scope 1 (e.g., travelling carbon) and scope 3 (e.g., embodied carbon) emissions included in the carbon neutral target requires a radical deployment of renewable energy systems at the precinct level. This becomes more challenging when it is planned for achieving carbon neutrality within an ambitious time frame, e.g., by 2030, requiring an accelerated offset for a vast amount of carbon ‘‘sunk’’ in built forms (e.g., buildings and infrastructure) and in goods and services. Although a conservative plan for reaching carbon neutrality with SHUs, e.g., by 2050, appears relatively easier to implement, it is also worth considering the accumulated benefit from net carbon savings delivered by the faster offsetting measure when comparing the options.

4. Conclusions

Decarbonising the urban built environment for reaching carbon neutrality is high on the agenda for many cities undergoing rapid expansion and densification. As an important urban form, precincts have been increasingly focused on as the context for urban redevelopment planning and at the forefront for trialling carbon reduction measures. For a precinct, the dynamics of evolution, including morphological variations, demographical changes, and renewable energy penetration, have been found to be of significant impact on its carbon performance and carbon neutral potential. In this paper, an integrated modelling and assessment method is applied to examine the lifecycle carbon signature and identify the carbon neutral potential of urban precincts. By using a case study on a residential precinct redevelopment, scenario analysis is conducted to explore opportunities for decarbonising densification development in consideration of demographical and morphological changes, renewable energy penetration, and planning horizon settings. The results indicate that redevelopment of precinct buildings with higher energy efficiency and increase of renewable energy penetration can have a long-term positive impact on precinct carbon performance. Furthermore, demographical factors such as population and family types also have noticeable influence on the precinct’s carbon neutral potential. The analysis also highlights the significance of embodied carbon to the total carbon signature and the carbon reduction potential of a precinct during densification, reinforcing the notion that “develop with less” is as important as carbon offsetting measures for decarbonising the precinct toward carbon neutrality.
Based on the findings of this study, more detailed and comprehensive scenarios incorporating other factors, such as types of densification, evolution over time, hybrid renewable energy system solutions, and energy–water impacts, need to be developed and explored for further analysis on carbon reduction options and effects. In addition, due mainly to limitations in data availability and modelling assumptions, the scope of the scenario design in this paper does not have renewable energy storage systems, electric vehicle (EV) use, and EV batteries to grids, which attract increasing interest in recent research, included in the analysis. Therefore, recommendations for future studies can include further exploring carbon neutral potential with solar energy storage schemes and in-depth analysis of impacts resulting from dynamics of precinct morphology and demographics to inform an optimal planning for low-carbon (re)development of urban precincts.

Author Contributions

Conceptualization, B.H., K.X., and S.P.; methodology, B.H. and K.X.; software, B.H.; formal analysis, B.H. and K.X.; resources, B.H. and K.X.; data curation, B.H. and L.L.; writing—original draft preparation, B.H. and K.X.; writing—review and editing, B.H. and K.X.; project administration, S.P. and L.L.; funding acquisition, B.H., K.X., S.P., and L.L. All authors have read and agreed to the published version of the manuscript.

Funding

Funding that permitted this research was granted by the National Natural Science Foundation of China, grant number 51908064; Australia Cooperative Research Centre (CRC) for Low Carbon Living through the project “Integrated Carbon Metrics (ICM)”, grant number RP2007; Changsha University of Science and Technology by the program “International Collaborative Research Underpinning Double First-Class University Construction”, grant numbers 2018IC19 and 2019IC17.

Acknowledgments

The authors would like to acknowledge the National Natural Science Foundation of China, Australia Cooperative Research Centre (CRC) for Low Carbon Living, University of South Australia, and Changsha University of Science and Technology for the funding opportunities and financial support.

Conflicts of Interest

The authors declare no conflict of interest.

Appendix A

Table A1. Statistics of Household Costs on Travelling (based on survey and travelling diaries).
DescriptionFamily Type 1Family Type 2Family Type 3
Embodied Costs
  Purchase of motor vehicle $42.73 $53.40 $76.19
  Purchase of motorcycle $0.69 $0.67 $1.19
  Purchase of caravan $2.04 - $1.98
  Purchase of trailer $0.19 $0.38 -
  Crash repairs $1.60 $1.57 $1.46
  Tyrese and tubes $2.78 $2.40 $3.53
  Oils, lubricants, and additives $0.37 $0.87 $0.43
  Vehicle parts and accessories $3.78 $6.95 $3.30
  Vehicle servicing (including parts and labour) $19.77 $5.50 $16.86
Operational Costs
  Petrol $33.99 $35.58 $39.37
  Diesel fuel $1.86 $2.33 $3.57
  LPG and other gas fuels $0.36 $0.05 $2.38
  Rail fares $2.22 $2.97 $2.81
  Bus and tram fares $2.27 $2.92 $0.96
  Water transport fares $0.06 $0.40 $0.05
  Combined bus/tram/rail/water transport fares $1.54 $0.53 $0.74
  Taxi fares $4.98 $5.12 $1.43
  Air fares (excluding holiday) $2.04 $3.04 $1.25
Table A2. Carbon and Cost Factors of Fuel Types in 2011 (based on reference [35,36]).
Fuel TypeFuel Prices (National Average, A$/L)Carbon Factors of Fuels (kg CO2-e/L)
ULP1.502.26
Diesel1.552.73
LPG0.821.75
Jet fuel0.802.39
Other conversion factors
  Delivered—primary energy conversion factor1.44
  Electricity emission factor (tCO2/GJ)0.07
  Natural gas emission factor (tCO2-e/GJ)0.06
  Efficiency of solar water heaters80% of household demanding
  Water heating efficiency (MJ/L)0.03
Table A3. Carbon Intensities of Precinct Objects (based on references [5,37,38]).
Lifecycle Embodied Carbon Intensities
  Residential buildings (kg CO2-e/m2)ExistingNew development
    Detached houses5.05432.15
    Detached townhouses4.67411.94
  Public buildings (kg CO2-e/m2)
    Offices1.47539.5
    Healthcare1.31704.84
    Retail stores1.47536.28
    Schools/Education1.47521.80
  Infrastructure
    Road (kg CO2-e/m2)0.7545.24
    Driveway (kg CO2-e/m2)2.72163.02
    Footpath (kg CO2-e/m2)0.3420.28
    Pipe network (kg CO2-e/m)0.3319.85
    Electricity cable (kg CO2-e/m)2.08 × 10−41.23 × 10−3
    Water plant (overall)2.6% of total as-built CO2-e
    Electricity plant (overall)2.1% of total as-built CO2-e
    Gas plant (overall)2.1% of total as-built CO2-e
    Sewer (overall)2.2% of total as-built CO2-e
    Storm water (overall)1.9% of total as-built CO2-e
    PV system (kg CO2-e/kWp)663.19
    Solar water heating systems (kg CO2-e/each)303.28
Annual Operational Carbon Intensities
  Residential buildings (kg CO2-e/household)ExistingNew development
    Detached houses 3764.792002.17
    Detached townhouses3764.792002.17
  Public buildings (kg CO2-e/m2)
    Offices 73.8465.11
    Healthcare122.8993.79
    Retail stores258.45197.25
    Schools/Education24.6018.78

References

  1. Word Green Building Council (WGBC). Bringing Embodied Carbon Upfront. 2019. Available online: https://www.worldgbc.org/embodied-carbon (accessed on 10 April 2020).
  2. Ness, D. Growth in Floor Area: The Blind Spot in Cutting Carbon. Emerald Open Research. 2020. Available online: https://emeraldopenresearch.com/articles/2-2/v2#ref-81 (accessed on 10 April 2020).
  3. Global ABC; IEA; UNE. Global Status Report for Buildings and Construction: Towards A Zero Emissions, Efficient and Resilient Buildings and Construction Sector. Internal Energy Agency and UN Environ. Program. 2019. Available online: https://wedocs.unep.org/bitstream/handle/20.500.11822/30950/2019GSR.pdf?sequence=1&isAllowed=y (accessed on 10 April 2020).
  4. Gong, Y.; Song, D. Life Cycle Building Carbon Emissions Assessment and Driving Factors Decomposition Analysis Based on LMDI—A Case Study of Wuhan City in China. Sustainability 2015, 7, 16670–16686. [Google Scholar] [CrossRef] [Green Version]
  5. Huang, B.; Xing, K.; Pullen, S. Carbon assessment for urban precincts: Integrated model and case studies. Energy Build. 2017, 153, 111–125. [Google Scholar] [CrossRef]
  6. Rosenzweig, C.; Solecki, W.; Hammer, S.A.; Mehrotra, S. Cities lead the way in climate-change action. Nature 2010, 467, 909–911. [Google Scholar] [CrossRef] [PubMed]
  7. Xing, K.; Wiedmann, T.; Newton, P.; Huang, B.; Pullen, S. Development of Low-Carbon Urban Forms—Concepts, Tools and Scenario Analysis. In Decarbonising the Built Environment: Charting the Transition; Newton, P., Prasad, D., Sproul, A., White, S., Eds.; Palgrave: Singapore, 2019; Volume 12, pp. 227–244. [Google Scholar]
  8. Wiedmann, T.O.; Chen, G.; Barrett, J. The Concept of City Carbon Maps: A Case Study of Melbourne, Australia. J. Ind. Ecol. 2016, 20, 676–691. [Google Scholar] [CrossRef] [Green Version]
  9. Wigginton, N.S.; Fahrenkamp-Uppenbrink, J.; Wible, B.; Malakoff, D. Cities are the Future. Science 2016, 904, 1014. [Google Scholar] [CrossRef] [Green Version]
  10. Newton, P.; Pears, A.; Whiteman, J.; Astle, R. The Energy and Carbon Footprints of Urban Housing and Transport: Current Trends and Future Prospects. In Australia’s Unintended Cities; CSIRO Publishing: Collingwood, Australia, 2012; pp. 153–189. [Google Scholar]
  11. Newton, P.; Meyer, D.; Glackin, S. Becoming urban: Exploring the capacity for a suburban-to-urban transition in Australia’s low density cities. Sustainability 2017, 9, 1718. [Google Scholar] [CrossRef] [Green Version]
  12. Metz, D. Demographic determinants of daily travel demand. Transp. Policy 2012, 21, 20–25. [Google Scholar] [CrossRef] [Green Version]
  13. Roberts, M.; Haghdadi, N.; Bruce, A.; MacGill, I. Characteristics of Australian apartment electricity demand and its implications for low-carbon cities. Energy 2019, 180, 242–257. [Google Scholar] [CrossRef]
  14. Chen, S.; Zhang, G.; Xia, X.; Setun, S. A review of internal and external influencing factors on energy efficiency design of buildings. Energy Build. 2020, 216, 109944. [Google Scholar] [CrossRef]
  15. Wang, R.; Feng, W.; Lu, S. A three-stage optimization methodology for envelope design of passive house considering energy demand, thermal comfort and cost. Energy 2020, 1, 192. [Google Scholar] [CrossRef]
  16. Kibria, G.; Haroon, A.Y.; Nugegoda, D. Low-Carbon Development (LCD) Pathways in Australia, Bangladesh, China and India—A Review. J. Clim. Chang. 2018, 4, 49–61. [Google Scholar] [CrossRef]
  17. Robati, M.; Daly, D.; Kokogiannakis, G. A method of uncertainty analysis for whole-life embodied carbon emissions (CO2-e) of building materials of a net-zero energy building in Australia. J. Clean. Prod. 2019, 225, 541–553. [Google Scholar] [CrossRef]
  18. Huang, W.; Li, F.; Cui, S.; Huang, L.; Lin, J. Carbon Footprint and Carbon Emission Reduction of Urban Buildings: A Case in Xiamen City, China. Procedia Eng. 2017, 198, 1007–1017. [Google Scholar] [CrossRef]
  19. Karimpour, M.; Belusko, M.; Xing, K.; Boland, J.; Bruno, F. Impact of climate change on the design of energy efficient residential building envelopes. Energy Build. 2015, 87, 142–154. [Google Scholar] [CrossRef]
  20. Newton, P.; Tucker, S.N. Pathways to Decarbonising the Housing Sector: A Scenario Approach. Build. Res. Inf. 2011, 39, 34–50. [Google Scholar] [CrossRef]
  21. Zhu, Q.; Peng, X. The impacts of population change on carbon emissions in China during 1978–2008. Environ. Impact Assess. Rev. 2012, 36, 1–8. [Google Scholar] [CrossRef]
  22. Menz, T.; Welsch, H. Population aging and carbon emissions in OECD countries: Accounting for life-cycle and cohort effects. Energy Econ. 2012, 34, 842–849. [Google Scholar] [CrossRef]
  23. Miao, L. Examining the impact factors of urban residential energy consumption and CO2 emissions in China—Evidence from city-level data. Ecol. Indic. 2017, 73, 29–37. [Google Scholar] [CrossRef]
  24. Zhou, C.; Wang, S.; Wang, J. Examining the influence of urbanization on carbon dioxide emissions in the Yangtze River Delta, China: Kuzents curve relationship. Sci. Total Environ. 2019, 675, 472–482. [Google Scholar] [CrossRef]
  25. Korfiati, A.; Gkonos, C.; Veronesi, F.; Gaki, A.; Grassi, S.; Schenkel, R.; Volkwein, S.; Raubal, M.; Hurni, L. Estimation of the global solar energy potential and photovoltaic cost with the use of open data. Int. J. Sustain. Energy Plan. Manag. 2016, 9, 17–30. [Google Scholar]
  26. International Energy Agency. World Final Consumption. IEA, 2015. Available online: https://www.iea.org/Sankey/#?c=World&c=Finalconsumption (accessed on 5 July 2018).
  27. Bilir, L.; Yildirim, N. Photovoltaic system assessment for a school building. Int. J. Hydrogen Energy 2017, 42, 17856–17868. [Google Scholar] [CrossRef]
  28. Ou, T.C.; Hong, C.M. Dynamic operation and control of microgrid hybrid power systems. Energy 2014, 66, 314–323. [Google Scholar] [CrossRef]
  29. Nugent, D.; Sovacool, B.K. Assessing the lifecycle greenhouse gas emissions from solar PV and wind energy: A critical meta-survey. Energy Policy 2014, 65, 229–244. [Google Scholar] [CrossRef]
  30. Giest, S. Big data analytics for mitigating carbon emissions in smart cities: Opportunities and challenges. Eur. Plan. Stud. 2017, 25, 941–957. [Google Scholar] [CrossRef] [Green Version]
  31. Talari, S.; Shafie-khah, M.; Siano, P.; Loia, V.; Tommasetti, A.; Catalão, J.P. A Review of Smart Cities Based on the Internet of Things Concept. Energies 2017, 10, 421. [Google Scholar] [CrossRef] [Green Version]
  32. Huang, B.; Xing, K.; Pullen, S. Life-cycle energy modelling for urban precinct systems. J. Clean. Prod. 2017, 142, 3254–3268. [Google Scholar] [CrossRef]
  33. Perkins, A.; Hamnett, S.; Pullen, S.; Zito, R.; Trebilcock, D. Transport, Housing and Urban Form: The Life Cycle Energy Consumption and Emissions of City Centre Apartments Compared with Suburban Dwellings. Urban Policy Res. 2009, 27, 377–396. [Google Scholar] [CrossRef]
  34. Australian Bureau of Statistics. People and Communities. Canberra: Commonwealth of Australia. 2011. Available online: http://www.abs.gov.au/ (accessed on 19 August 2018).
  35. Intergovernmental Panel on Climate Change, Publications and Data. 2006. Available online: www.ipcc.ch/publications_and_data/publications_and_data.shtml (accessed on 23 March 2020).
  36. Australian Energy Update. Department of Industry and Science, Canberra. 2015. Available online: www.industry.gov.au/Office-of-the-Chief-Economist/Pages/default.aspx (accessed on 23 March 2020).
  37. Sherwani, A.; Usmani, J.; Goel, V. Life cycle assessment of solar PV based electricity generation systems: A review. Renew. Sustain. Energy Rev. 2010, 14, 540–544. [Google Scholar] [CrossRef]
  38. Battisti, R.; Corrado, A. Environmental assessment of solar thermal collectors with integrated water storage. J. Clean. Prod. 2005, 13, 1295–1300. [Google Scholar] [CrossRef]
Figure 1. System boundary for precinct carbon assessment.
Sustainability 12 04814 g001
Figure 2. A schematic representation of the precinct carbon assessment.
Sustainability 12 04814 g002
Figure 3. Modules of the Precinct Carbon Assessment (PCA) tool.
Sustainability 12 04814 g003
Figure 4. Simulation reporting of the PCA tool.
Sustainability 12 04814 g004
Figure 5. A schematic representation of the scenario analysis.
Sustainability 12 04814 g005
Figure 6. Breakdowns of precinct carbon emissions.
Sustainability 12 04814 g006
Figure 7. Precinct annual embodied carbon breakdown.
Sustainability 12 04814 g007
Figure 8. Precinct annual operational carbon breakdown.
Sustainability 12 04814 g008
Table 1. Menu items and functions of the PCA tool.
MenuFunctions
FileSimulation setting; Load databases; Open/Create/Save a project; Print results.
Precinct ProfilesPrecinct overview—information such as location, land size…; Residential profiles—edit demographical factors; Land use profiles—define precinct object types and land use; Precinct morphology—define precinct masterplan and identify inter-building effects.
Energy ProductionPresent conventional energy production profiles; Identify energy to carbon/cost factors; Present local solar path and assess precinct solar energy potential; Assess renewable energy harvesting, carbon offsetting, and cost saving.
Living RequirementsAssess water supply and waste processing related energy and carbon; indoor comfortable setting (e.g., temperatures, ventilations, etc.).
Objects InvestigatorEdit/build up overall embodied, operational, and travelling intensities; Calculate precinct baseline embodied, operational, and travelling energy and carbon; Present numeric results, charts, and figures.
Simulation and ReportingRun simulation and reporting with two options (as shown in Figure 4): NCOS format reporting, or custom reporting—report elements in numbers and figures based on user selections.
Table 2. Description of precinct family types.
Family TypeAge GroupHousehold SizeEducation QualificationEmployment and IncomesDwelling TypeLifestyle
135–50Coupled with young childrenMany achieving tertiary and postgraduateHigh employment with comfortable financial situationDetached housesLiving with close access to public facilities, high business travel rates, family-oriented vehicles.
225–34Single adultsLikely to be university educated and postgraduateHigh employment with medium incomesDetached townhouseCheaper living costs, heavy internet users, overseas holidays, less vehicle usage.
3Over 55Mostly retired-Part-time work with high incomesValuable detached housesHigh operational energy use, less travelling energy consumption.
Table 3. Profiles involved in modelling and scenario analysis.
Case Studied PrecinctBaseline in 2011Future (Scenario 1 and 2)
Population size62448023
  Employed full-time19922236
  Employed part-time9581352
  Employed casually68273
  Student30273768
  Unemployed199394
Household amount21042682
  Amount of Type 1 family216 (10.3%)1055 (39.3%)
  Amount of Type 2 family708 (33.7%)801 (29.9%)
  Amount of Type 3 family1180 (56.0%)826 (30.8%)
Building profiles
  Number of buildings21042682
    Detached houses (existing)20721494
    Detached townhouses (existing)3232
    Detached townhouses (new)01156
  Total floor area of buildings (m2)564,091.09706,586.38
    Residential buildings478,624.00600,004.00
    Public buildings 185,467.09106,582.38
Infrastructure profiles
    Total area of road (m2)370,237.20416,653.64
    Total area of driveway (m2)77,490.3298,778.06
    Total area of footpath (m2)108,842.50115,313.40
    Overall length of pipe network (m)75,904.9294,217.76
    Overall length of electricity cable (m)75,904.9294,217.76
    Other public facilities10.0–11.0% of precinct total as-built emissions
Solar-energy harvesting units (SHUs) penetration
    Take-up of solar water heaters (SWHs)
    (% of households)
11.7052.28
    Take-up of Solar photovoltaic systems
    (kWp)
2142.505610.50
1 Public buildings, including offices, healthcare facilities, retail stores, and schools, related to the precinct context are modelled on the basis of ‘‘as required’’ and have their total floor areas increased along with population growth.
Table 4. Scenario analysis and comparisons.
Annual Carbon Measure (in tCO2-e)Baseline in 2011Scenario 1Scenario 2
OverallPer CapitaOverallPer CapitaOverallPer Capita
Embodied4549.480.7317,857.702.237745.190.97
Operational20,284.673.2522,996.622.8722,996.622.87
Travelling8682.971.3910,785.451.3410,785.451.34
Carbon offsetting1267.760.203692.510.463692.250.46
Total net carbon32,249.365.1647,947.265.9837,835.024.71
Table 5. Results from the carbon neutral potential assessment.
MeasurementsScenario 1Scenario 2
Total roof area (maximum, m2)815,895.67815,895.67
Annual carbon offsetting of SHUs (tCO2-e)58,376.5343,143.82
Required take-up of household SWHs (%)100.0100.0
Penetration of PVs (kWp)106,610.078,148.0
Required total area for PV installation260,128.40190,681.12

