Assessment of Ecological Efficiency and Environmental Sustainability of the Minjiang-Source in China


Abstract
1. Introduction
2. Study Area, Indicators and Data
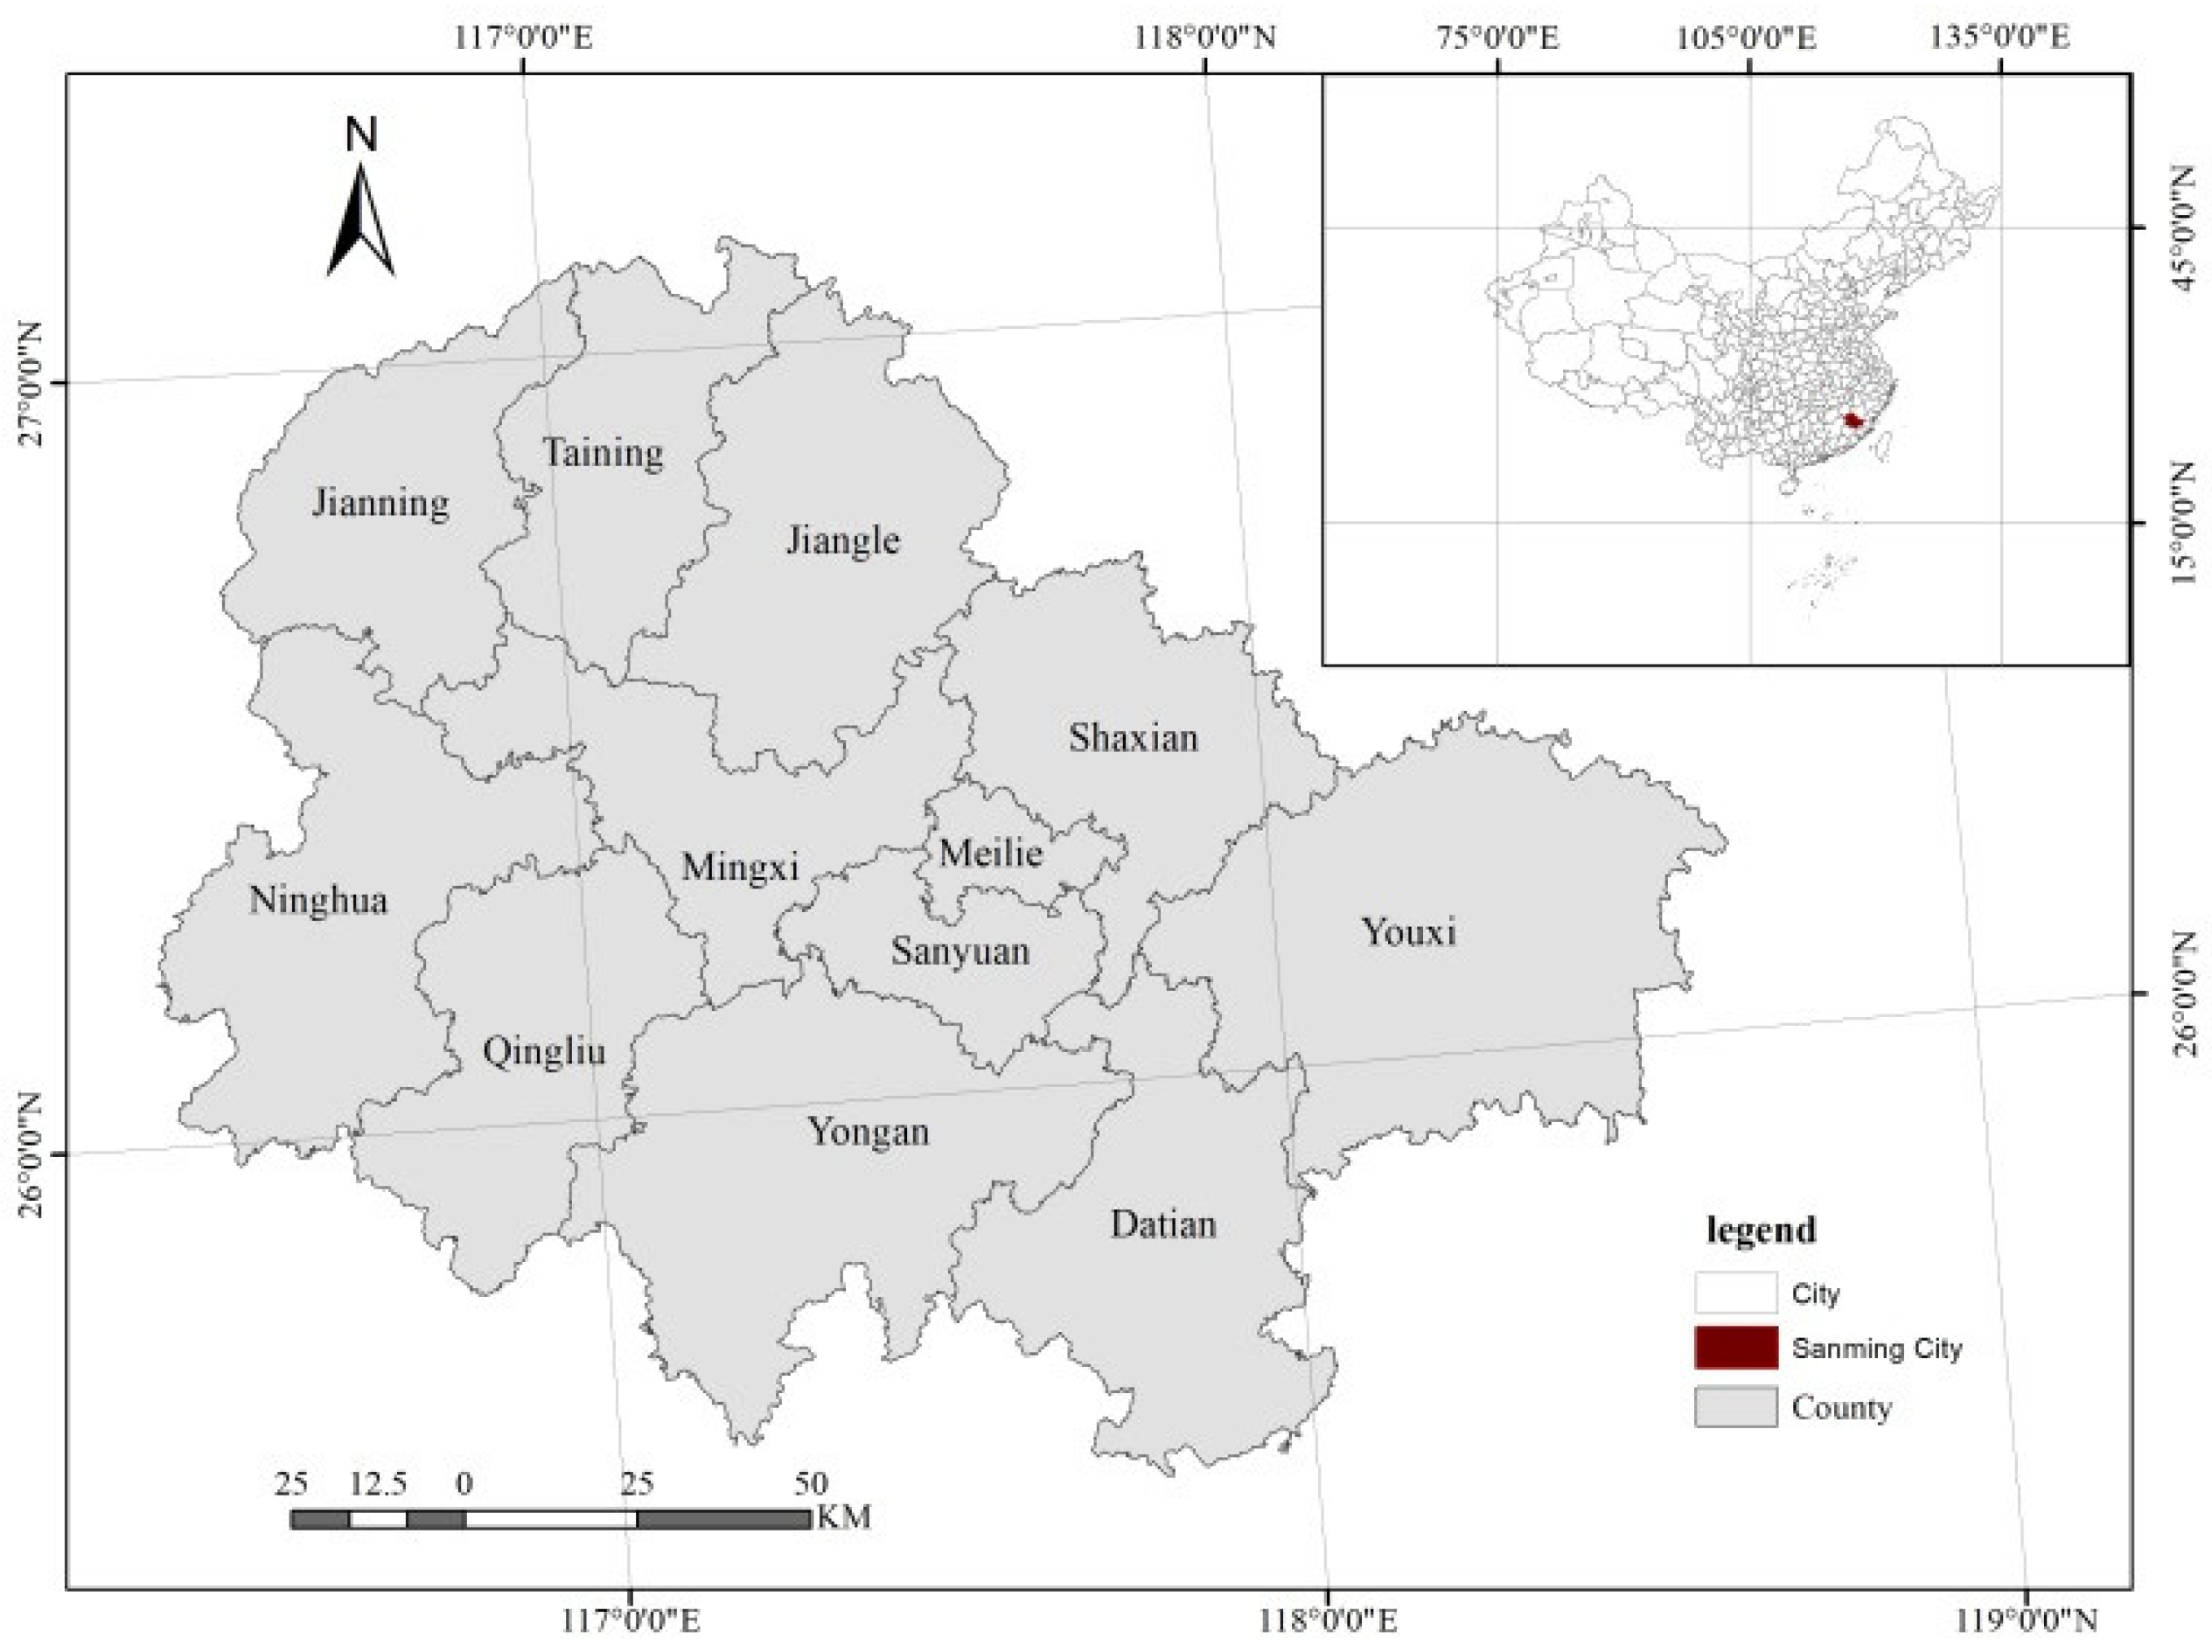
2.1. Study Area
2.2. Indicators and Data
2.2.1. Selection of Evaluation Indicators
2.2.2. Data
2.2.3. Data Preprocessing
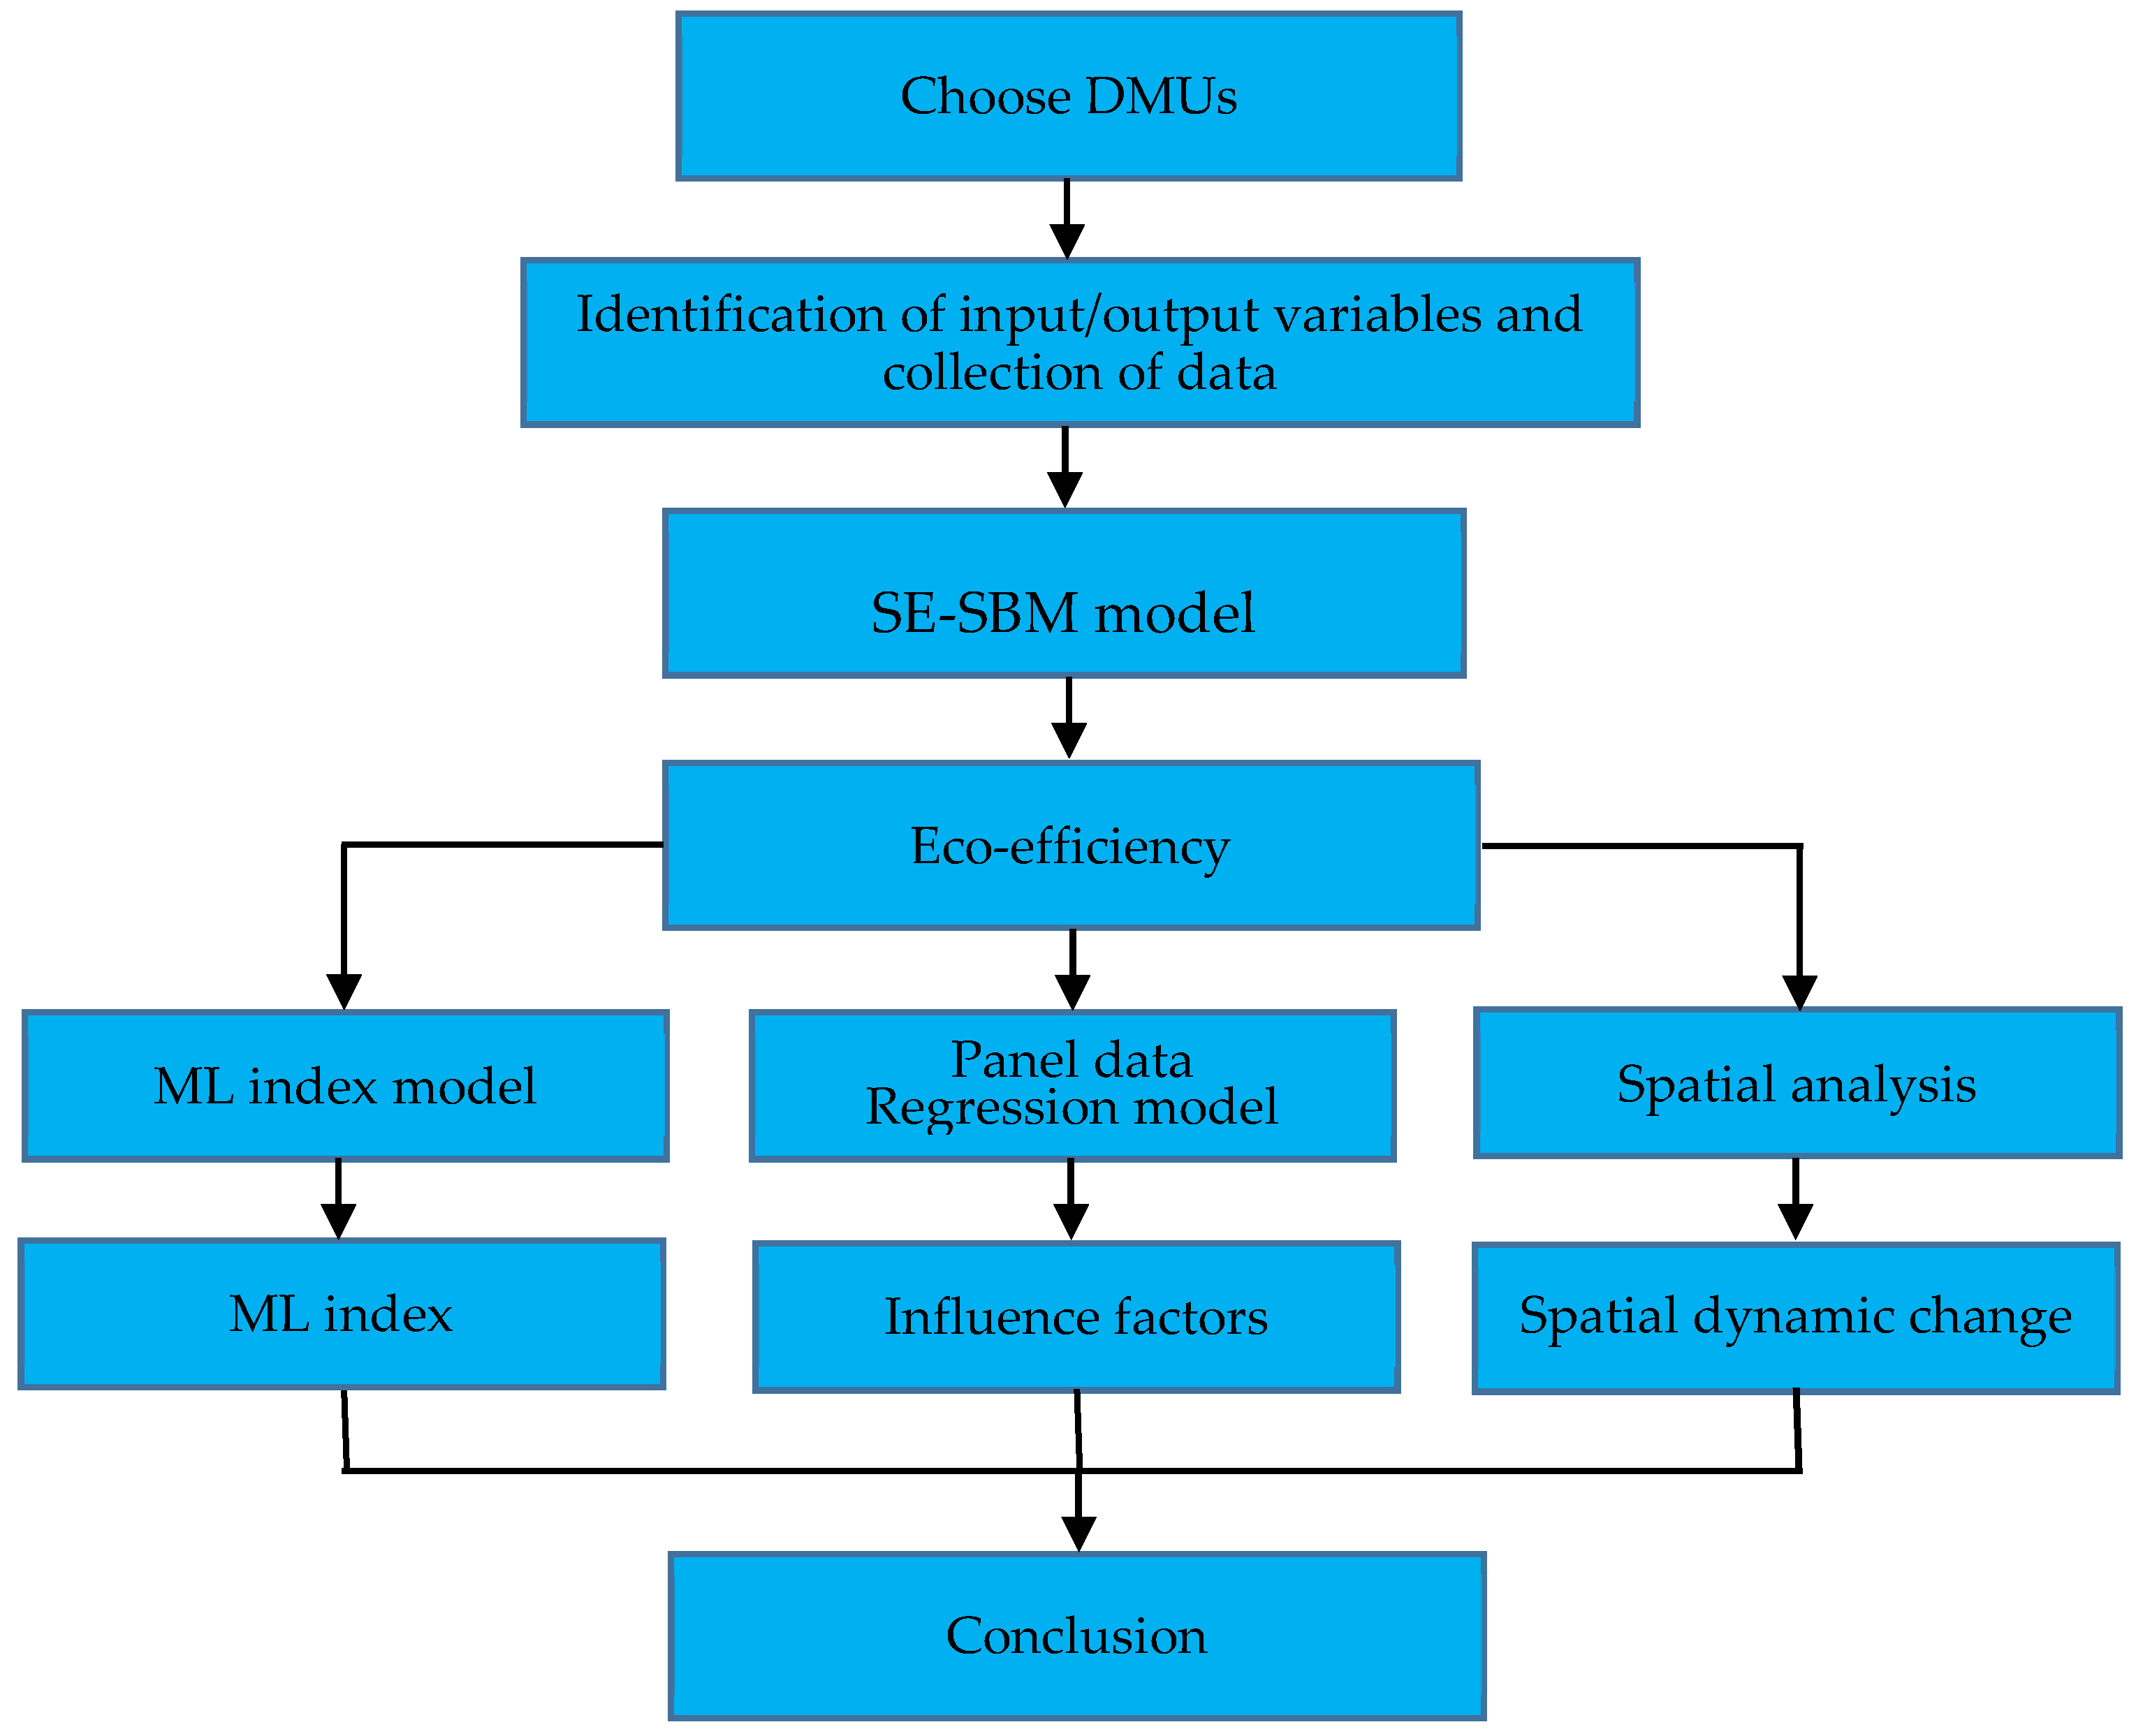
3. Research Method
3.1. SE-SBM Model
3.2. ML Index
4. Empirical Analysis and Results
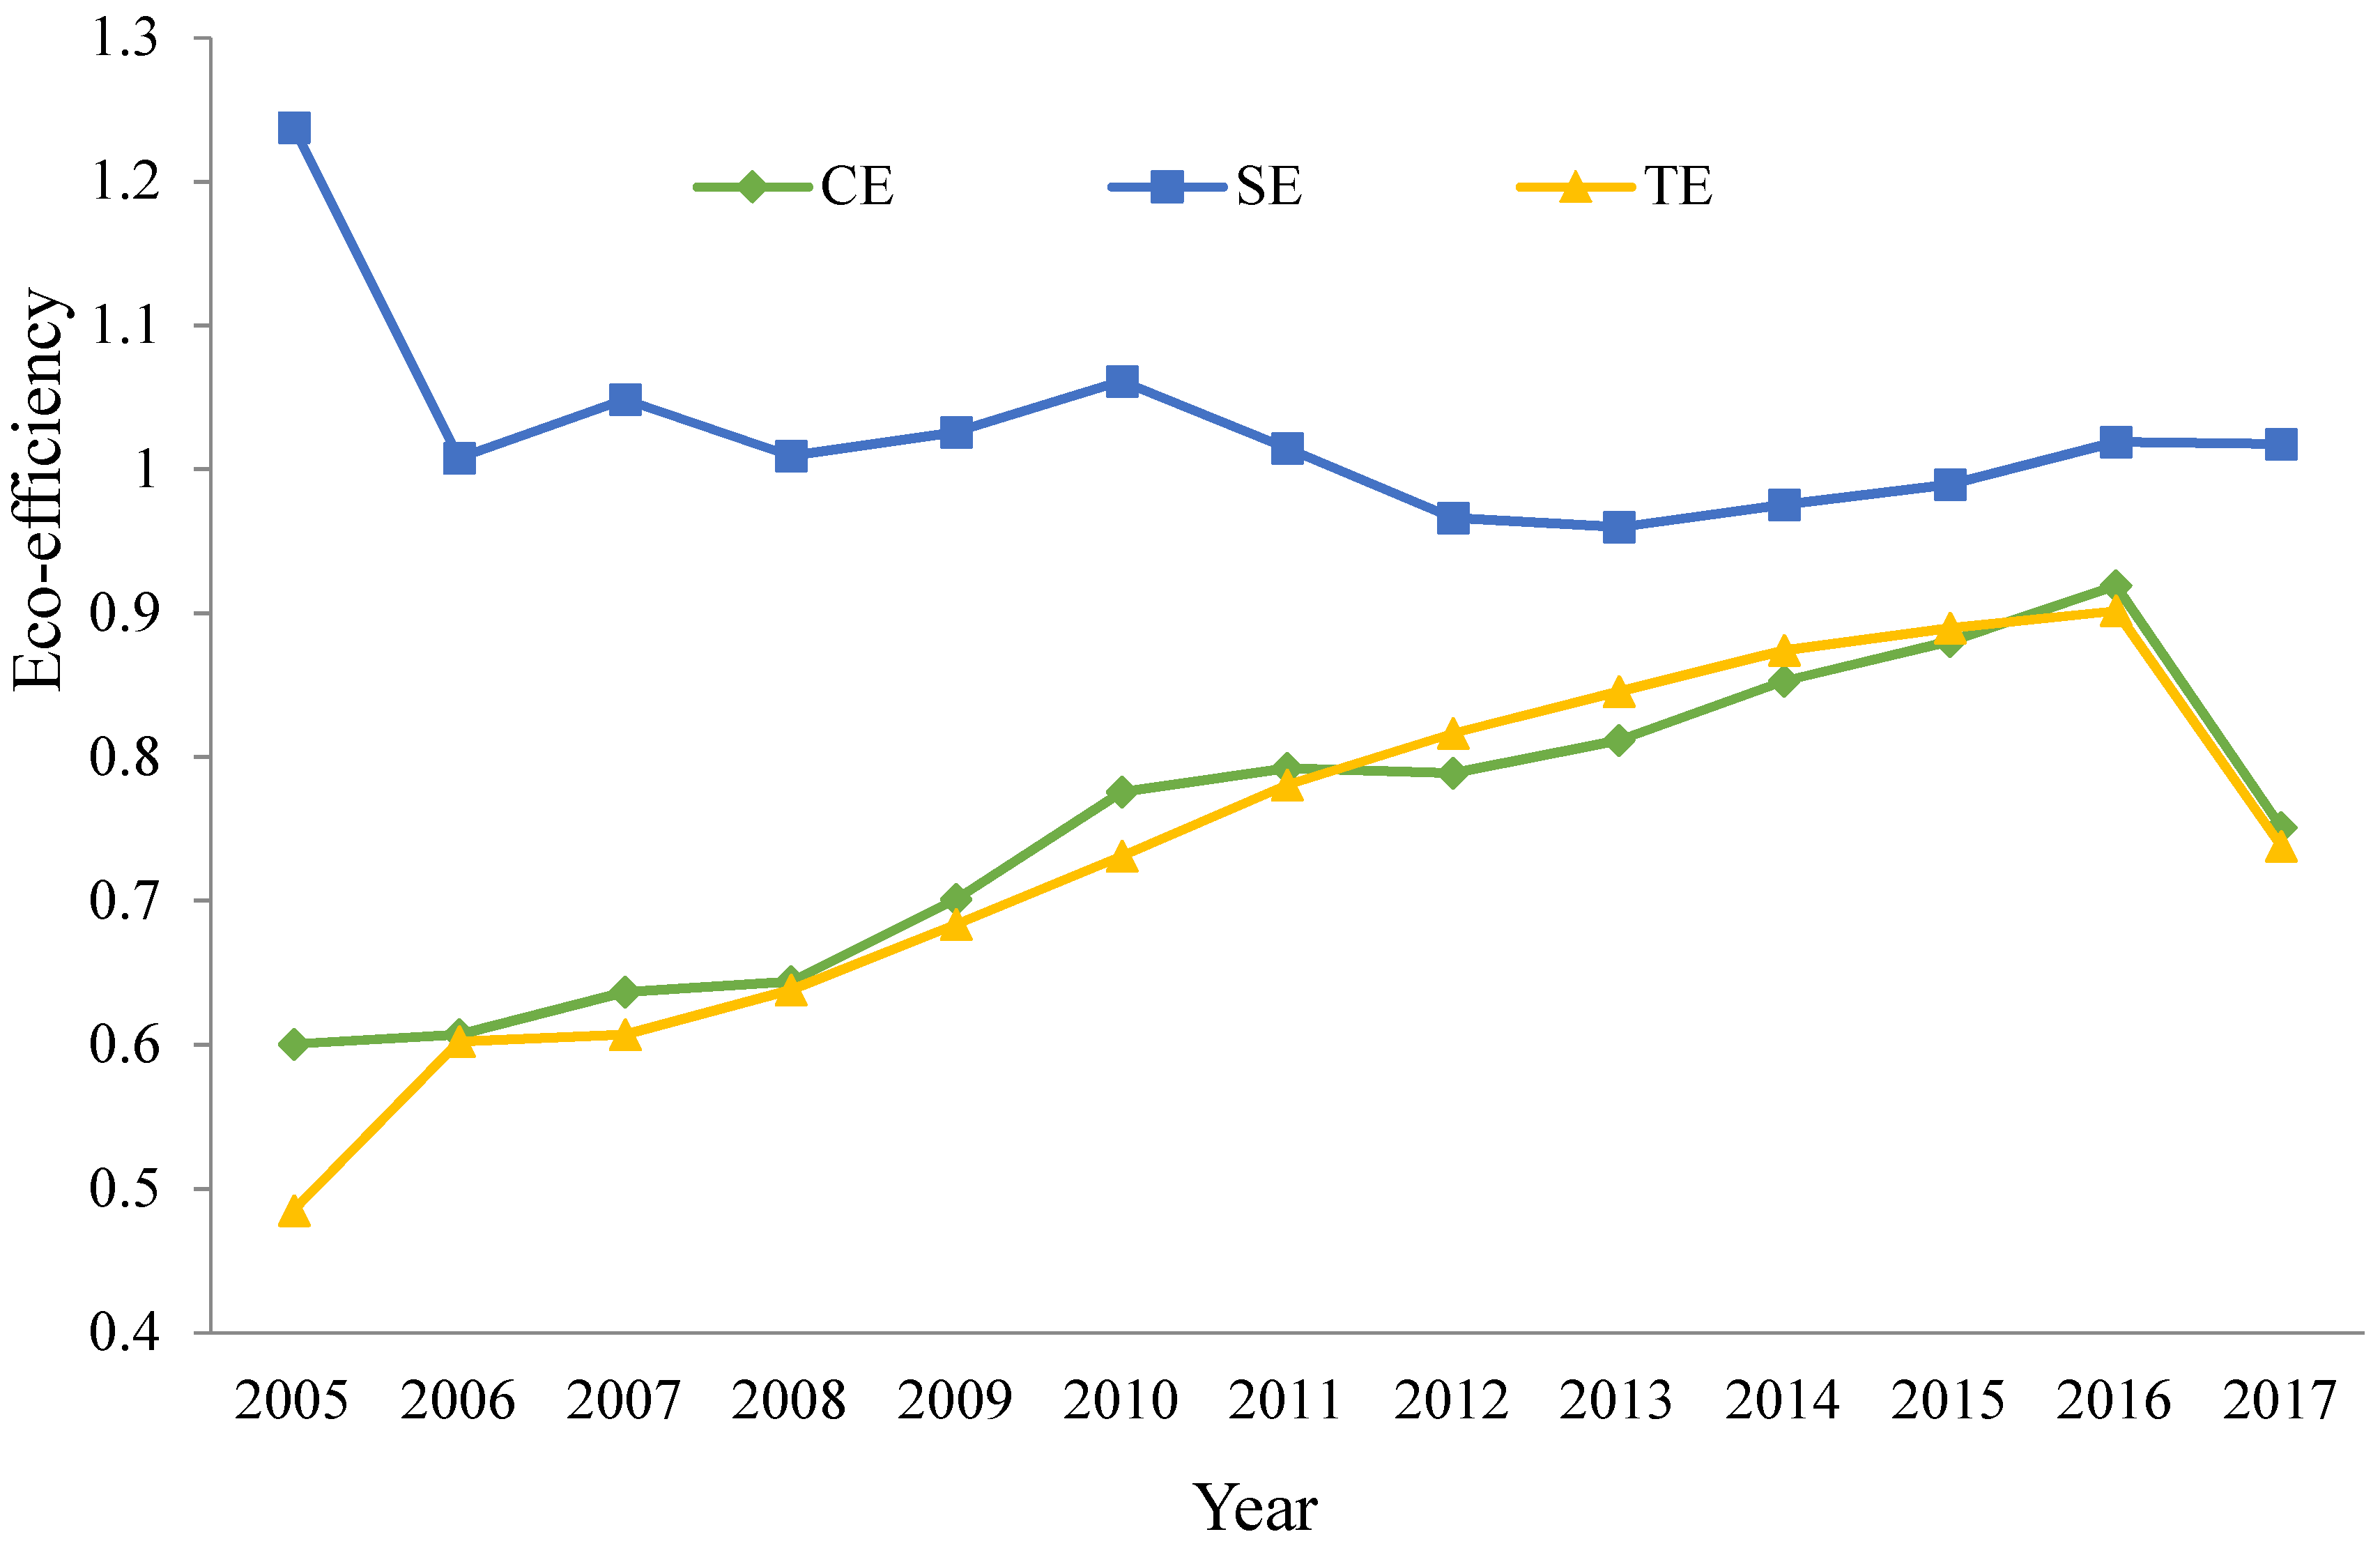
4.1. Eco-Efficiency Analysis of Minjiang-Source
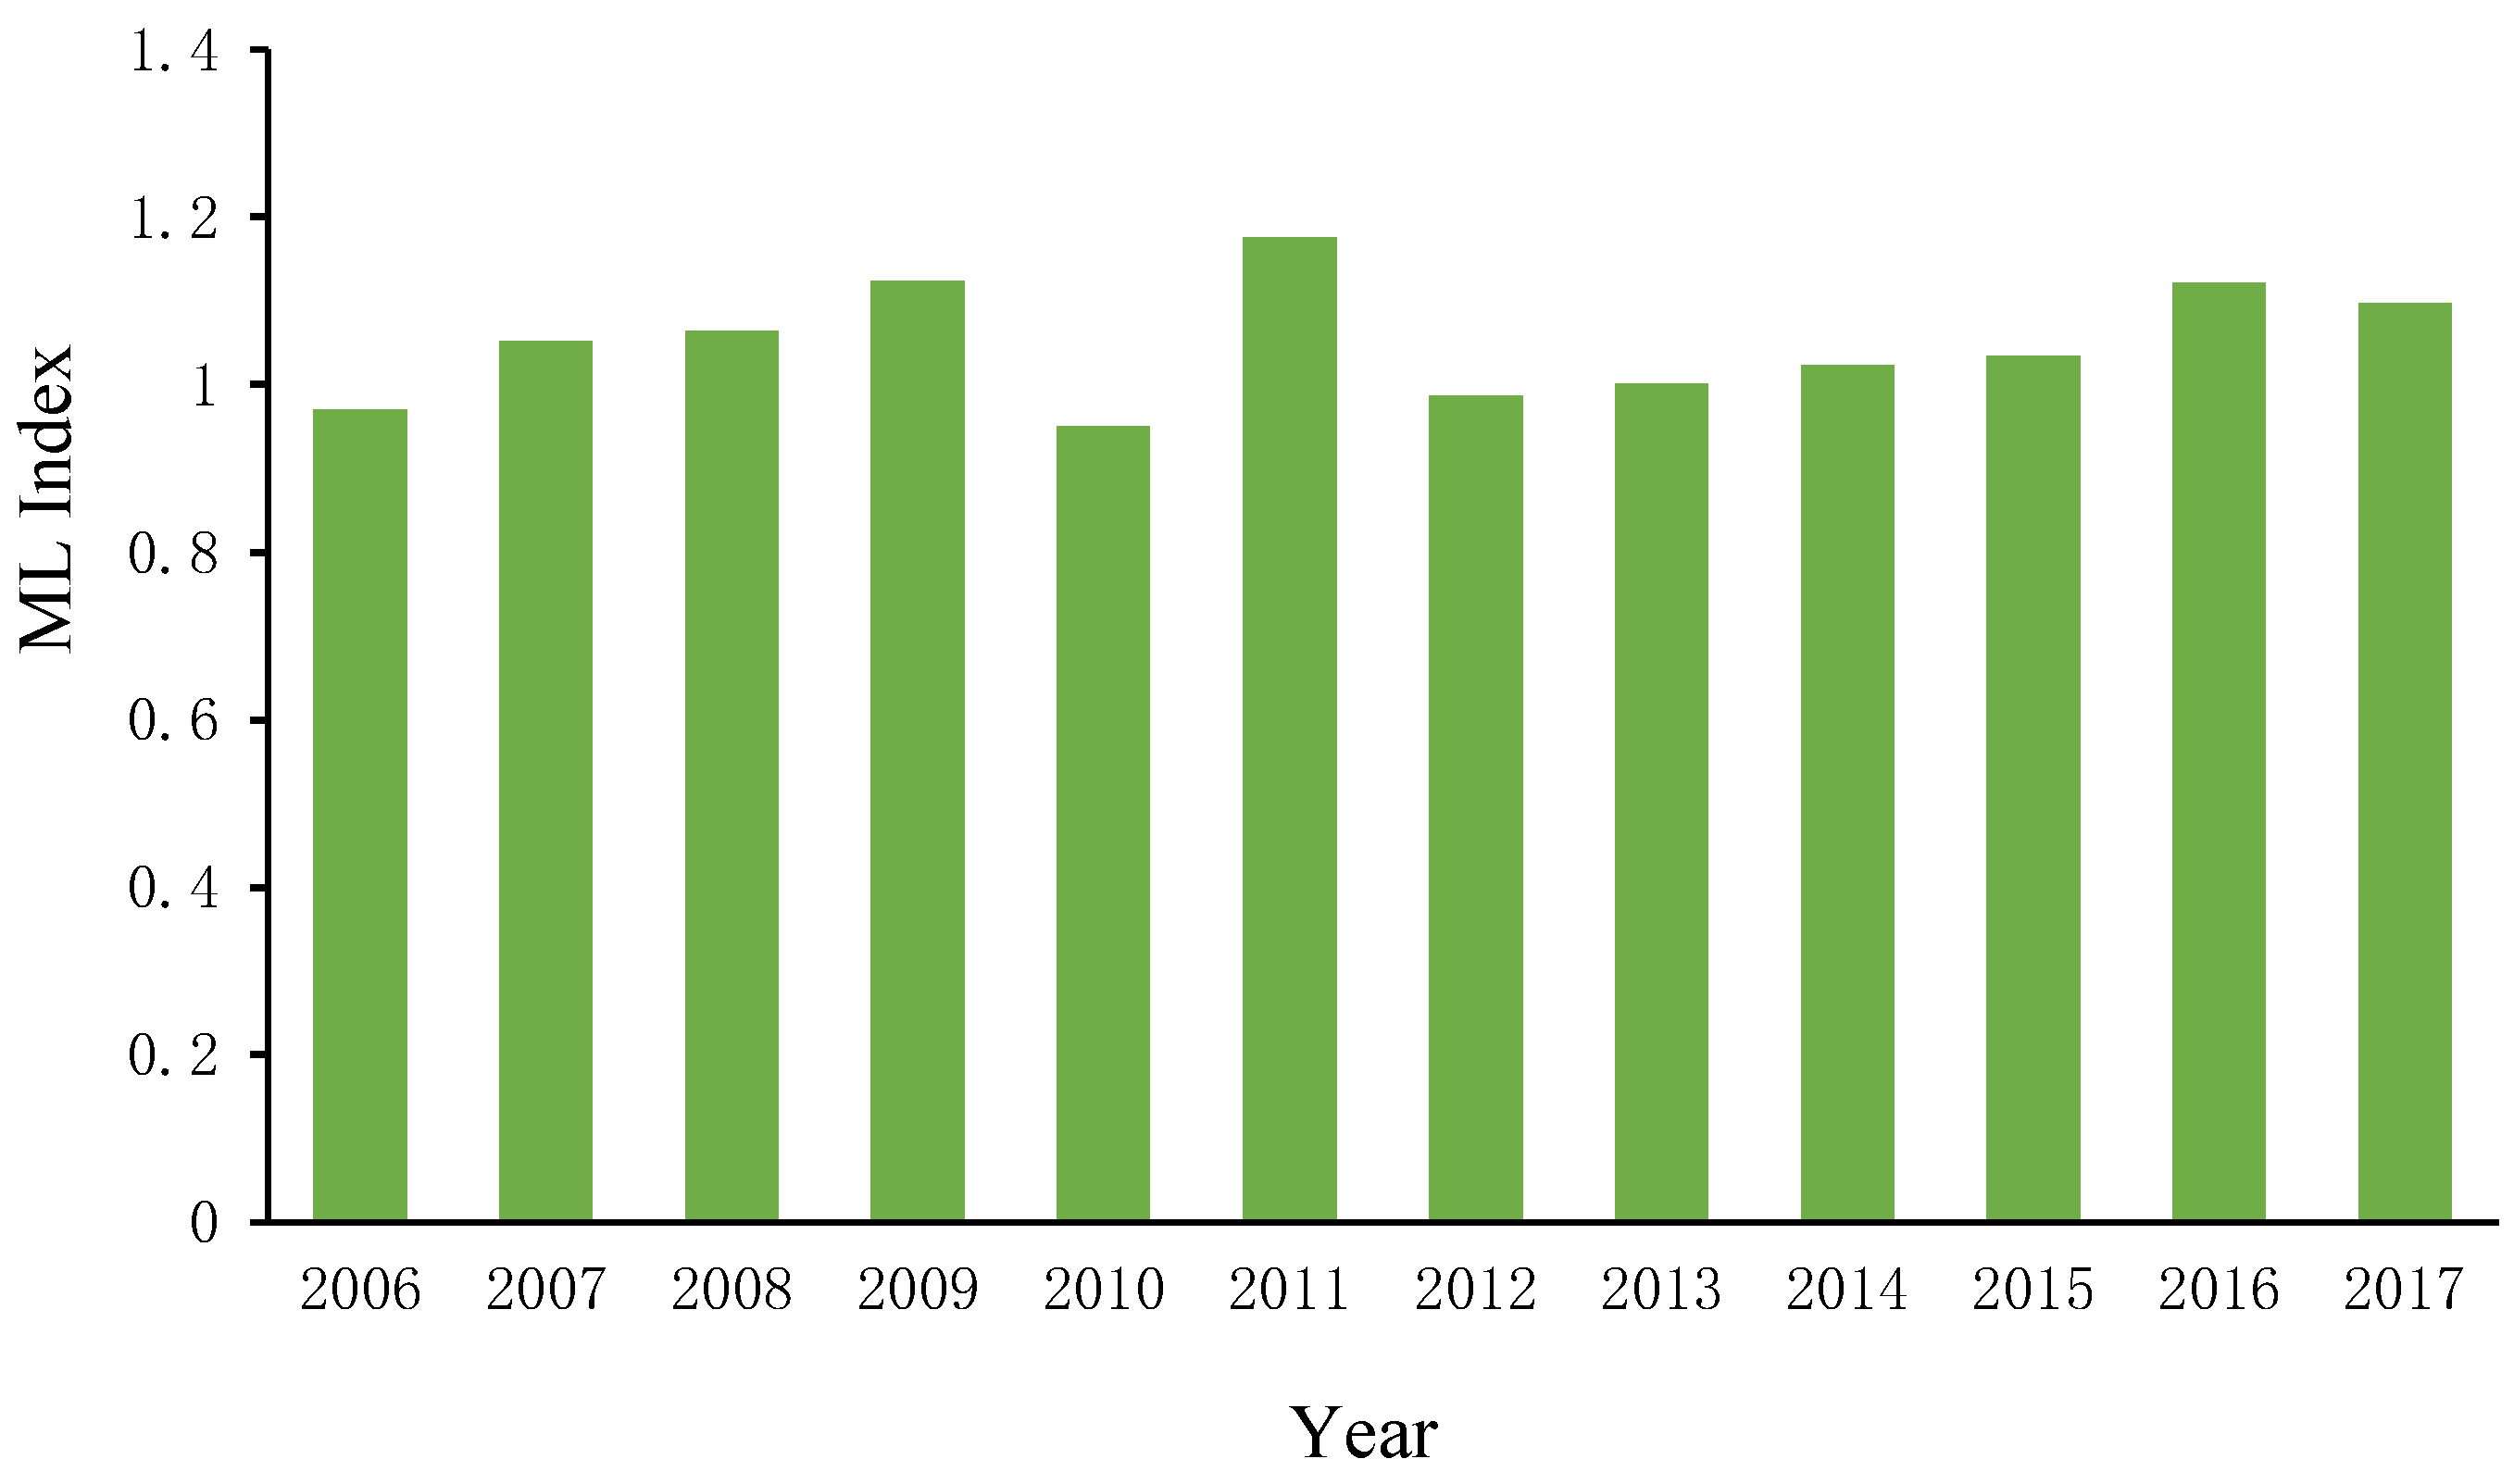
4.2. Index Analysis of ML Index in Minjiang Source
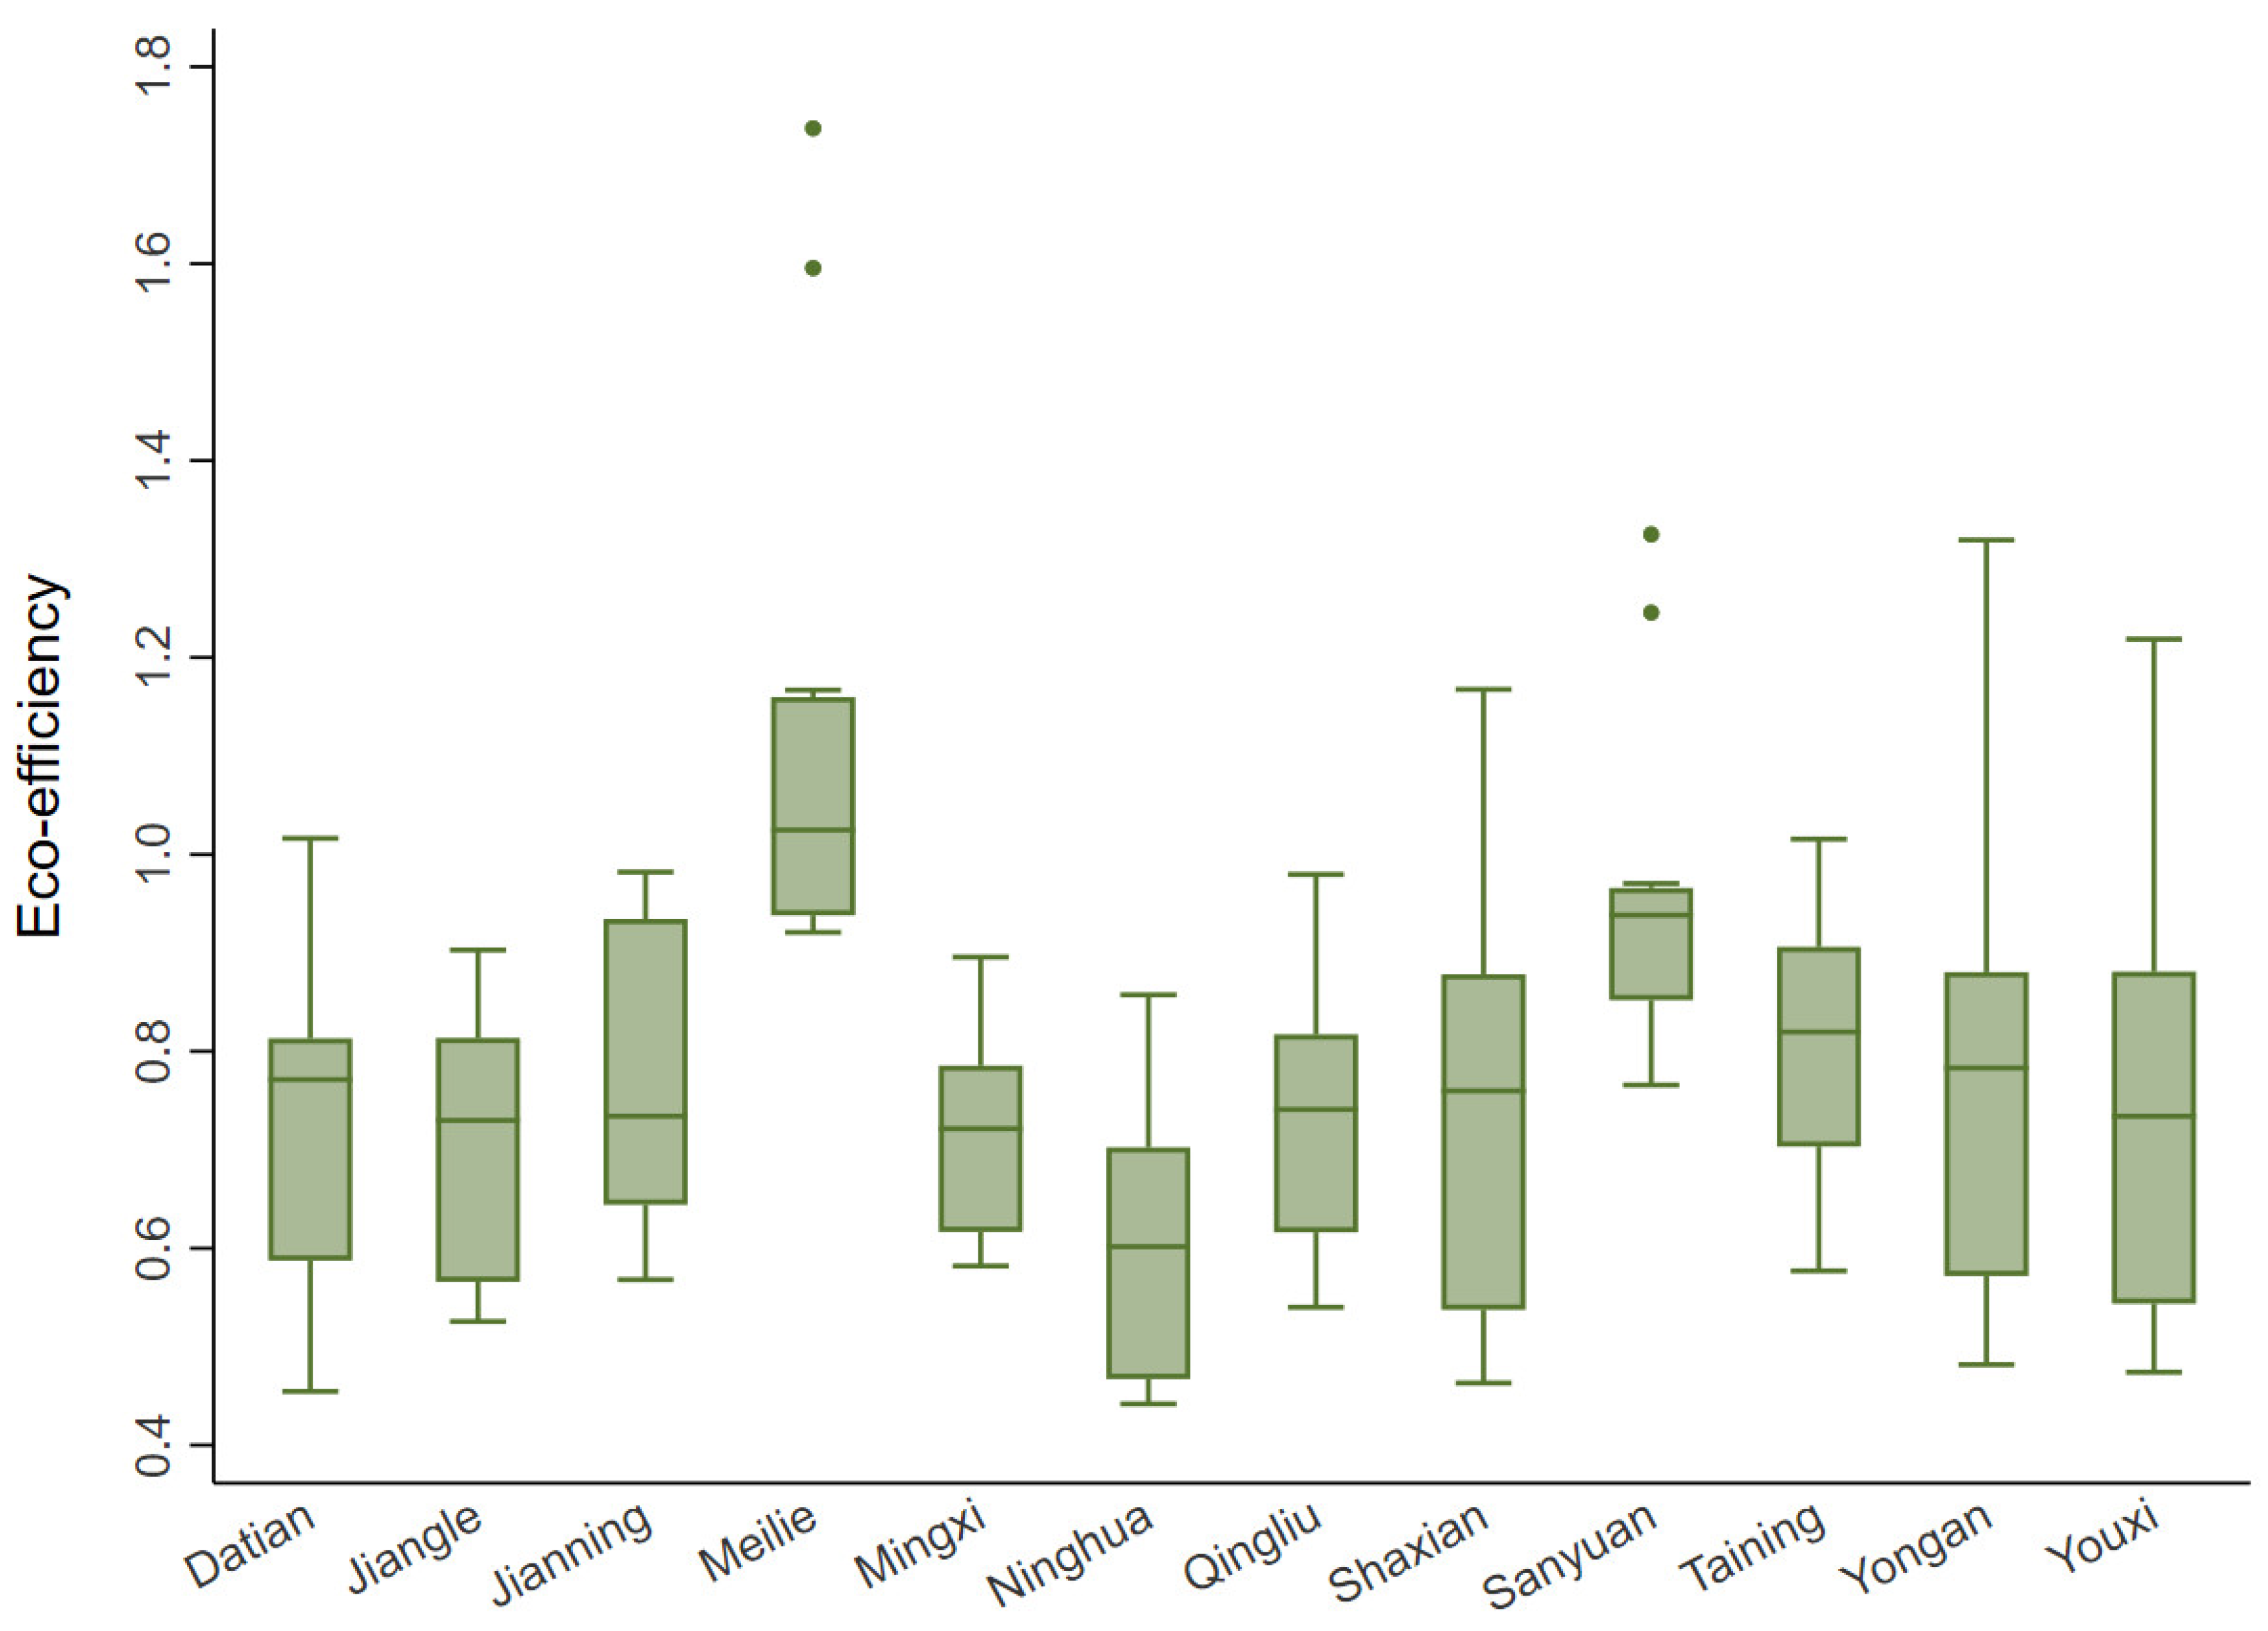
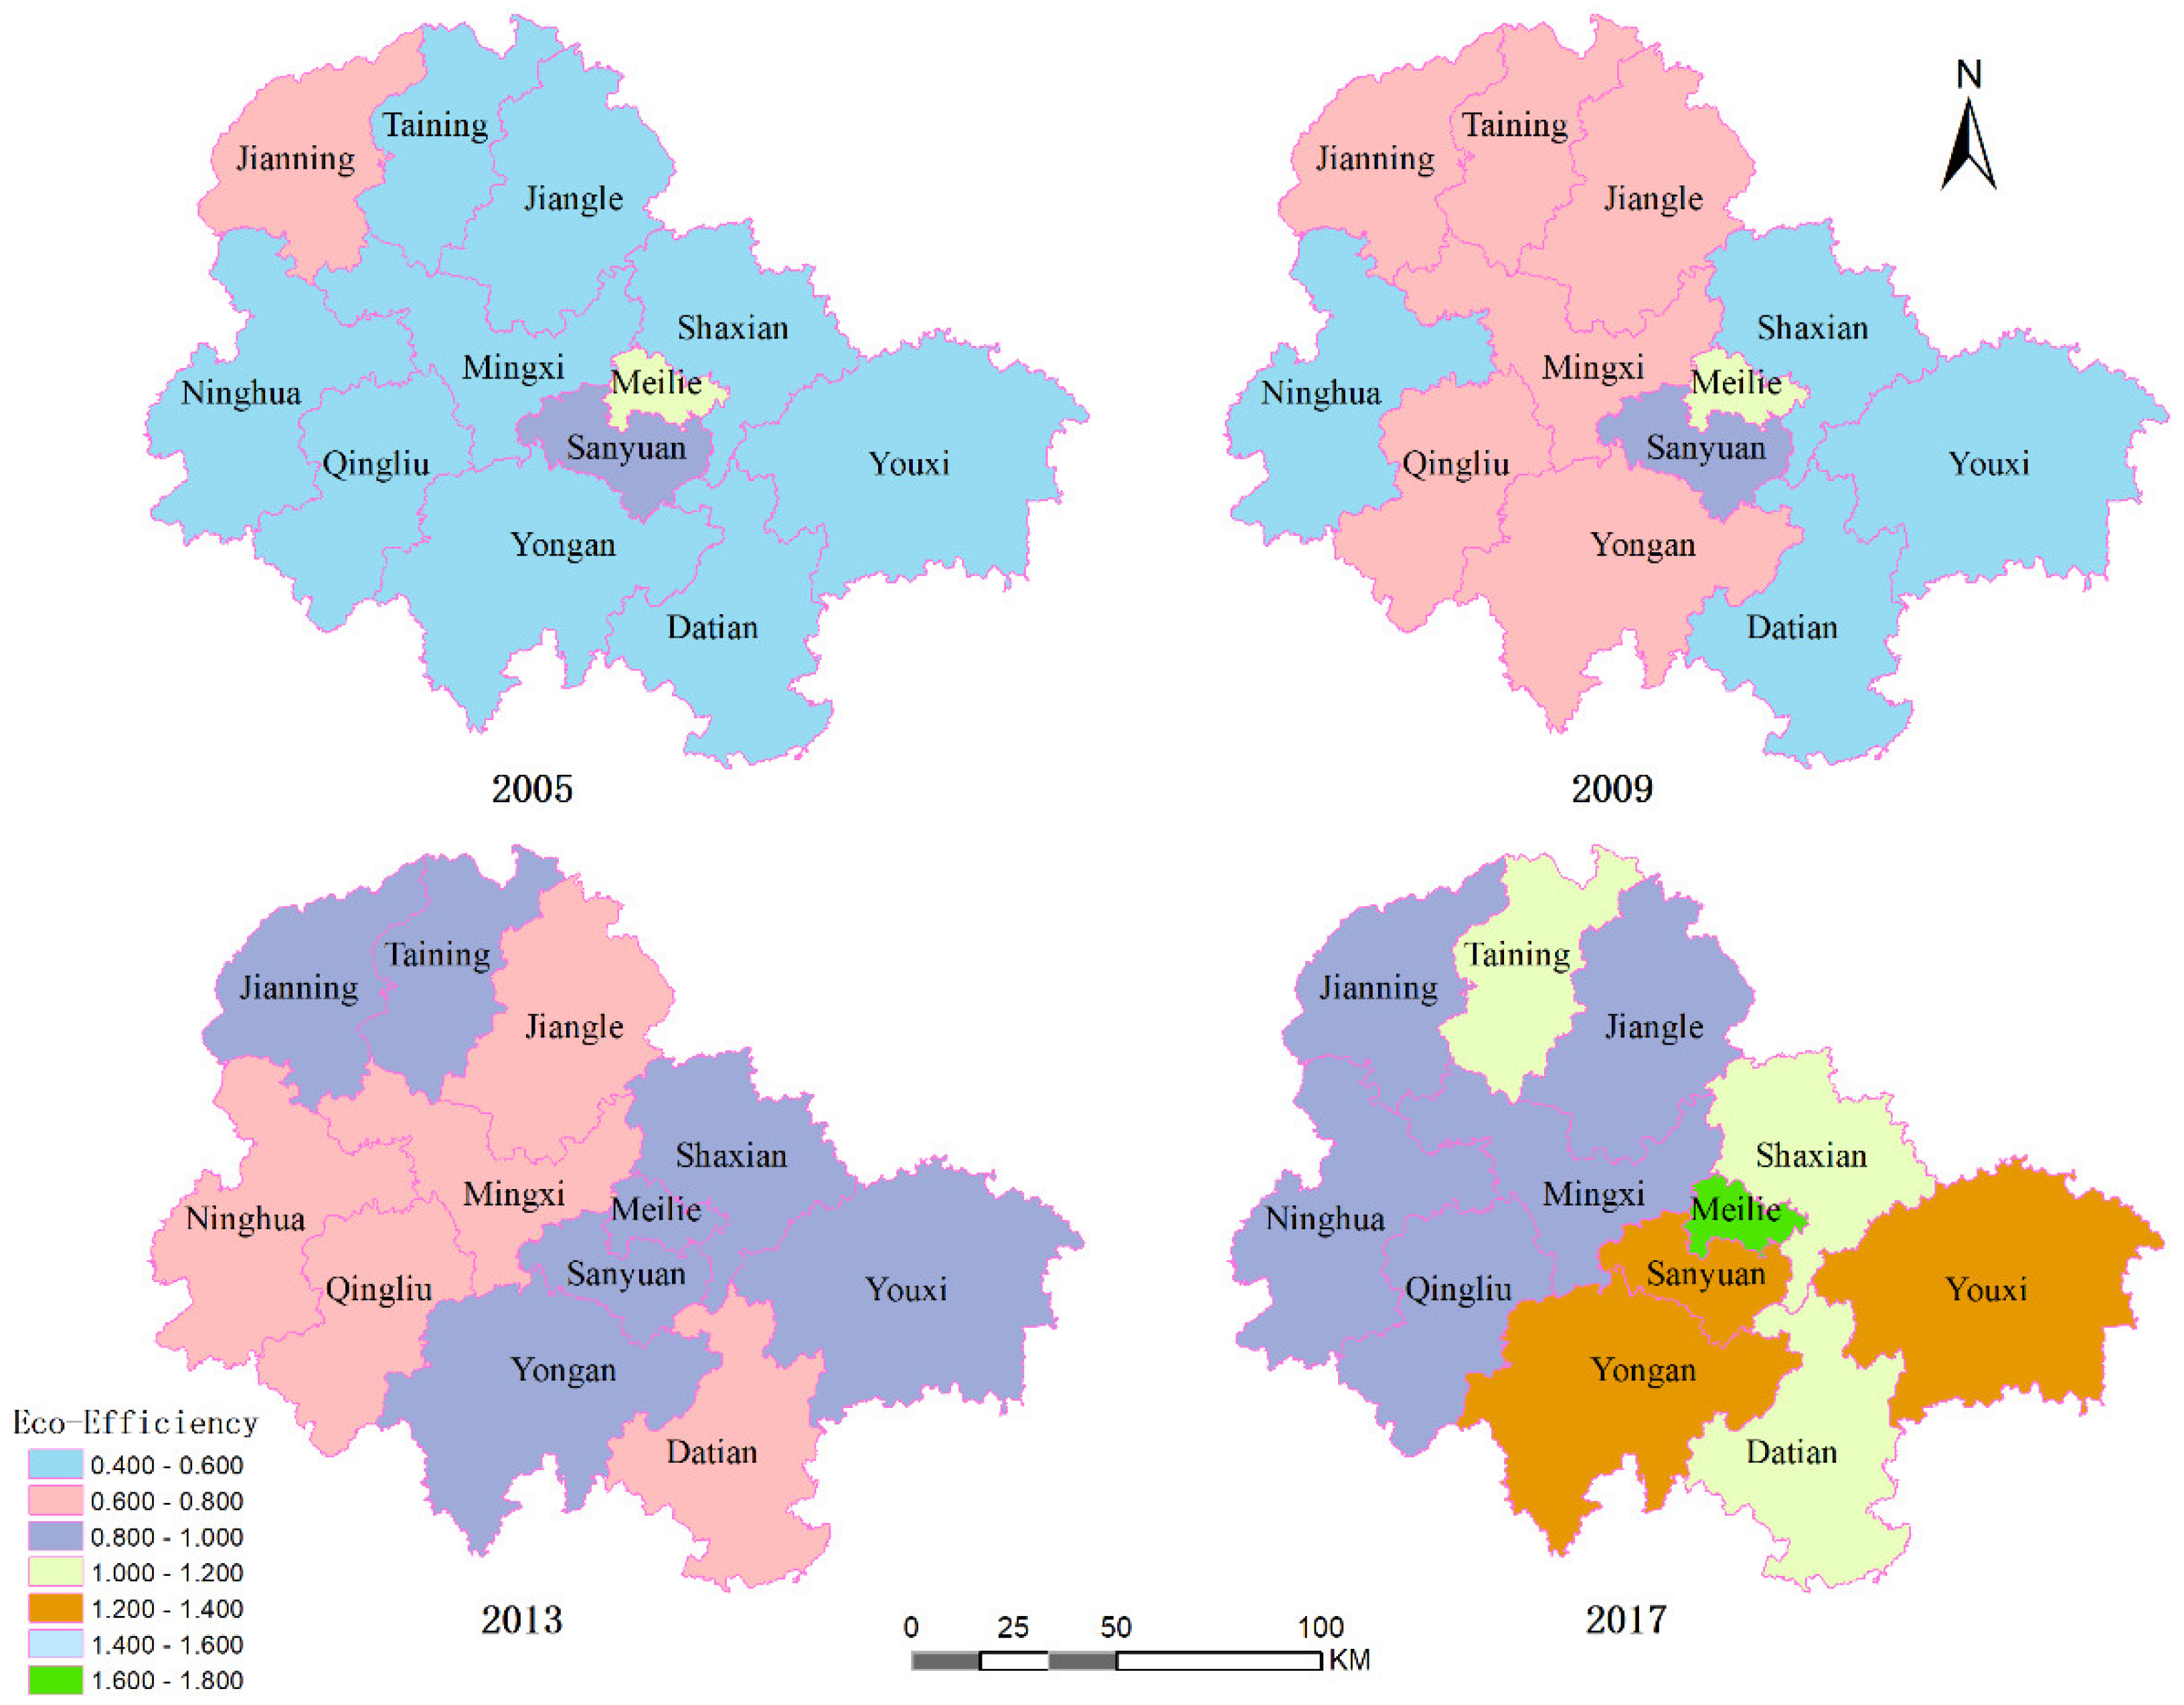
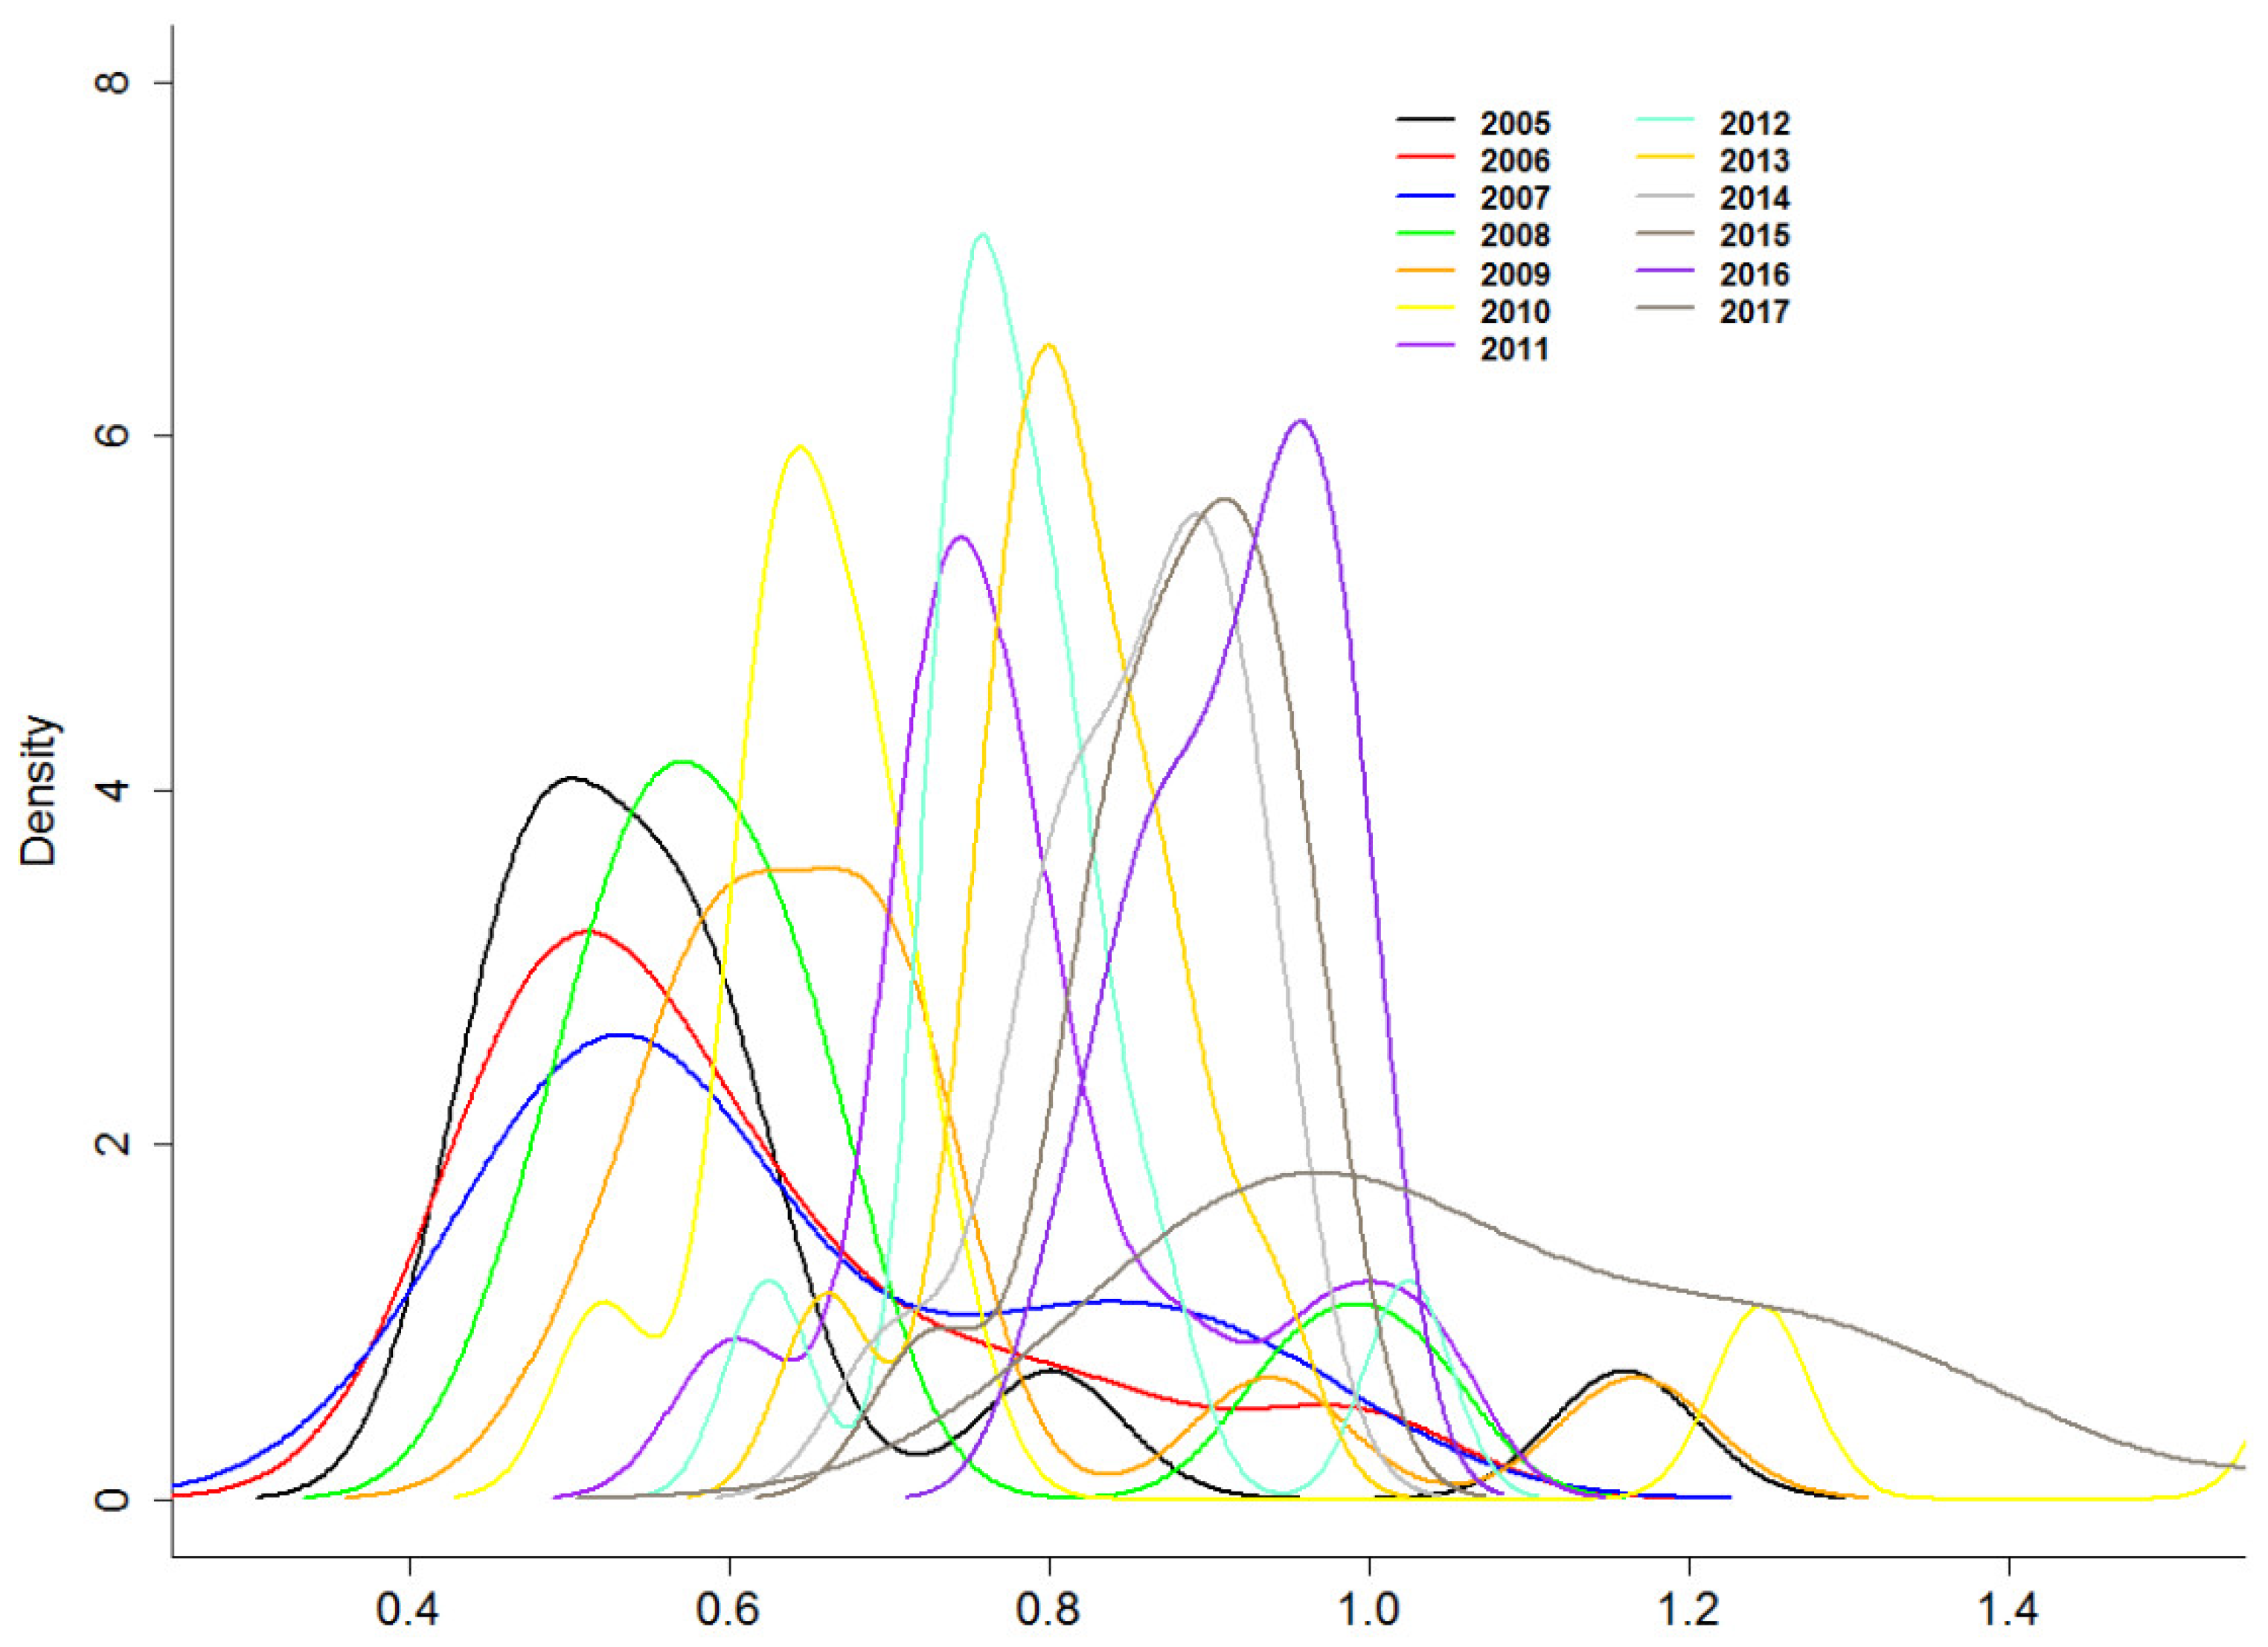
4.3. Spatial and Temporal Difference of Eco-Efficiency in Minjiang River Source and Evolution Analysis
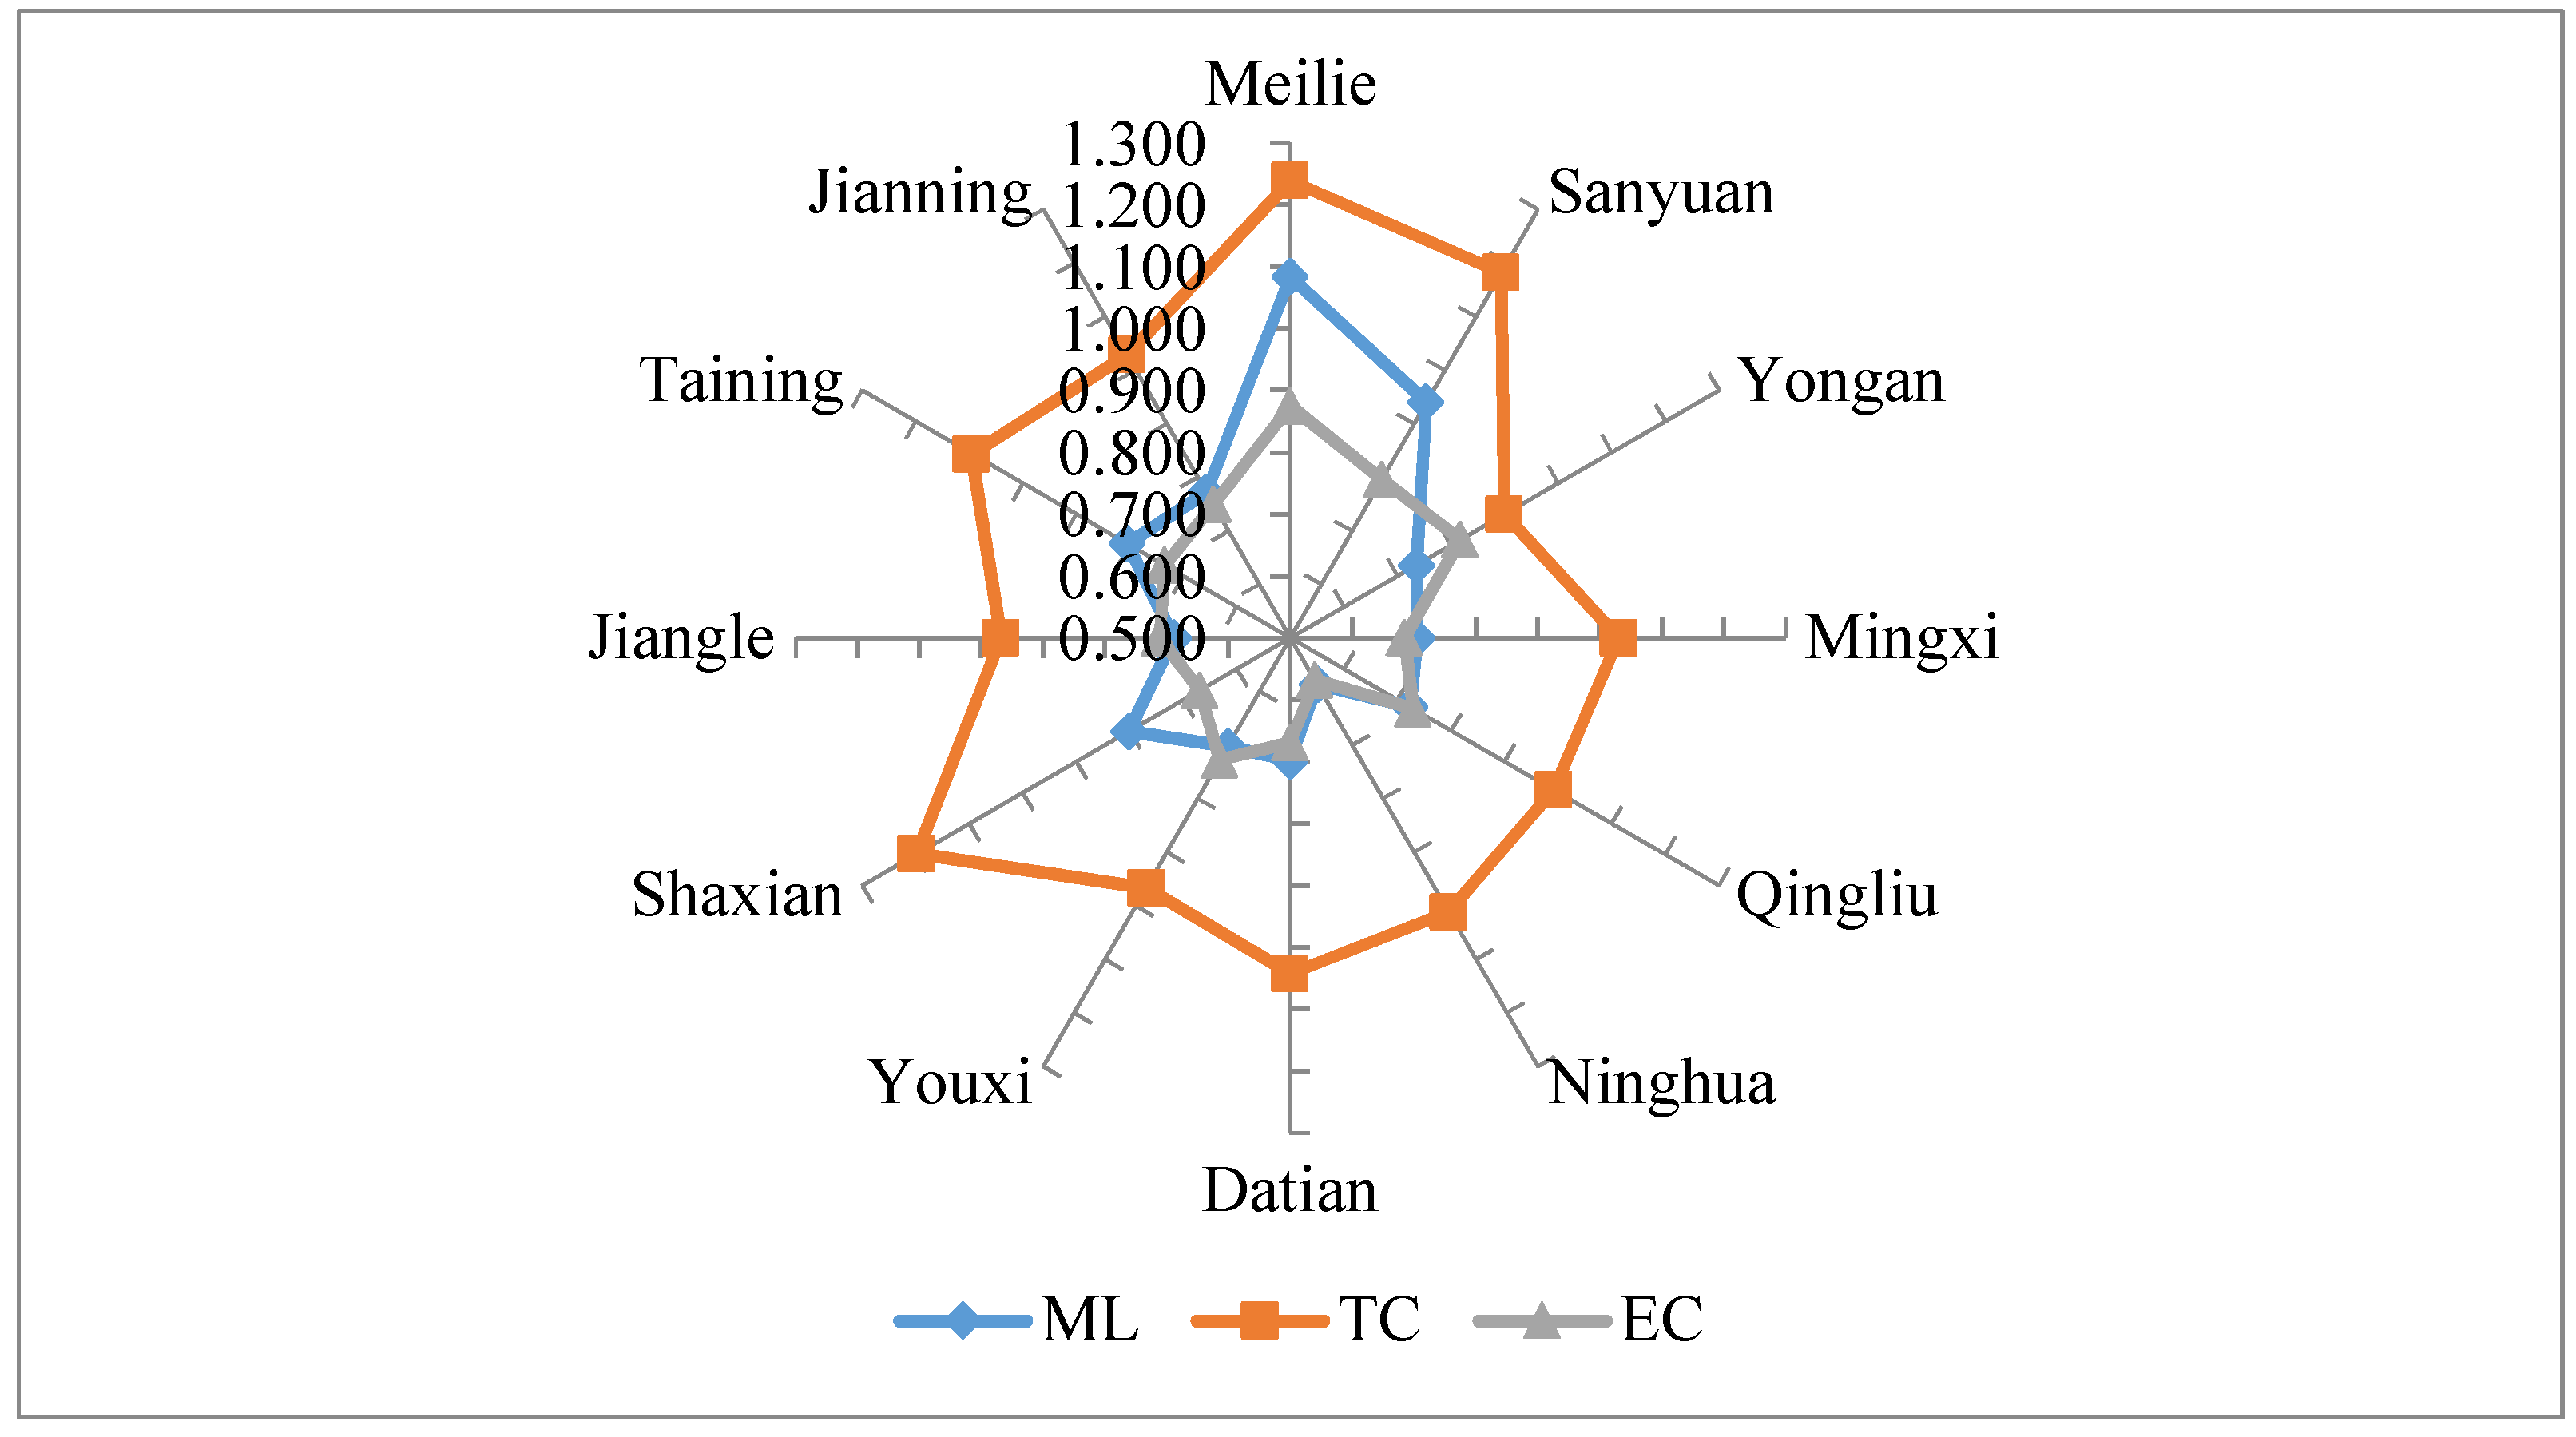
4.4. Influence Factors of Eco-Efficiency of Minjiang-Source
5. Discussions and Conclusions
Author Contributions
Funding
Acknowledgments
Conflicts of Interest
References
- Zhang, K.M.; Wen, Z.G. Review and challenges of policies of environmental protection and sustainable development in China. J. Environ. Manag. 2008, 88, 1249–1261. [Google Scholar] [CrossRef]
- The National Development and Reform Commission. The Planning of National and Regional Main Functional Areas; People′s Publishing House: Beijing, China, 2015.
- Xu, J.; Xie, G.; Xiao, Y.; Li, N.; Yu, F.; Pei, S.; Jiang, Y. Dynamic Analysis of Ecological Environment Quality Combined with Water Conservation Changes in National Key Ecological Function Areas in China. Sustainability 2018, 10, 1202. [Google Scholar] [CrossRef]
- Wang, G.; Yang, D.; Xia, F.; Zhong, R.; Xiong, C. Three Types of Spatial Function Zoning in Key Ecological Function Areas Based on Ecological and Economic Coordinated Development: A Case Study of Tacheng Basin, China. Chin. Geogr. Sci. 2019, 4, 689–699. [Google Scholar] [CrossRef]
- Organization for Economic Cooperation and Development (OECD). Eco-Efficiency; OECD: Paris, France, 1998; pp. 7–11. [Google Scholar]
- Chu, D.J.; Zhu, Y. Ecological efficiency and circular economy. Fudan J. 2005, 2, 60–66. [Google Scholar]
- Schaltegger, S.; Sturm, A. Ökologische Rationalität: Ansatzpunkte zur Ausgestaltung von ökologieorientierten Managementinstrumenten. Unternehmung 1990, 44, 273–290. [Google Scholar]
- Rybaczewska-Błażejowska, M.; Masternak-Janus, A. Eco-efficiency assessment of Polish regions: Joint application of life cycle assessment and data envelopment analysis. J. Clean. Prod. 2018, 172, 1180–1192. [Google Scholar] [CrossRef]
- Huang, J.; Xia, J.; Yu, Y. Composite eco-efficiency indicators for China based on data envelopment analysis. Ecol. Indic. 2018, 85, 674–697. [Google Scholar] [CrossRef]
- Ren, Y.; Fang, C.; Li, G. Spatiotemporal characteristics and influential factors of eco-efficiency in Chinese prefecture-level cities: A spatial panel econometric analysis. J. Clean. Prod. 2017, 72, 2047–2063. [Google Scholar] [CrossRef]
- Guo, S.; Li, H.; Zhao, R.; Zhou, X. Industrial environmental efficiency assessment for China’s western regions by using a SBM-based DEA. Environ. Sci. Pollut. Res. 2019, 26, 27542–27550. [Google Scholar] [CrossRef]
- Xing, Z.; Wang, J.; Zhang, J. Total-factor ecological efficiency and productivity in Yangtze River Economic Belt, China: A non-parametric distance function approach. J. Clean. Prod. 2018, 200, 844–857. [Google Scholar] [CrossRef]
- Zhu, W.; Xu, L.; Tang, L.; Xiang, X. Eco-efficiency of the Western Taiwan Straits Economic Zone: An evaluation based on a novel eco-efficiency model and empirical analysis of influencing factors. J. Clean. Prod. 2019, 234, 638–652. [Google Scholar] [CrossRef]
- Wang, Y.; Liu, J.; Hansson, L.; Zhang, K.; Wang, R. Implementing stricter environmental regulation to enhance eco-efficiency and sustainability: A case study of Shandong Province′s pulp and paper industry, China. J. Clean. Prod. 2011, 19, 303–310. [Google Scholar] [CrossRef]
- Xing, L.; Xue, M.; Wang, X. Spatial correction of ecosystem service value and the evaluation of eco-efficiency: A case for China’s provincial level. Ecol. Indic. 2018, 95, 841–850. [Google Scholar] [CrossRef]
- Chen, L.; Jia, G. Environmental efficiency analysis of China’s regional industry: A data envelopment analysis (DEA) based approach. J. Clean. Prod. 2017, 142, 846–853. [Google Scholar] [CrossRef]
- Zhou, Y.; Xing, X.; Fang, K.; Liang, D.; Xu, C. Environmental efficiency analysis of power industry in China based on an entropy SBM model. Energy Policy 2013, 57, 68–75. [Google Scholar] [CrossRef]
- Ma, X.; Wang, C.; Yu, Y.; Li, Y.; Dong, B.; Zhang, X.; Gu, Y. Ecological efficiency in China and its influencing factors—A super-efficient SBM metafrontier-Malmquist-Tobit model study. Environ. Sci. Pollut. Res. 2018, 25, 20880–20898. [Google Scholar] [CrossRef]
- Chansarn, S. The Evaluation of the Sustainable Human Development: A Cross-country Analysis Employing Slack-based DEA. Procedia Environ. Sci. 2014, 20, 3–11. [Google Scholar] [CrossRef]
- Jin, W.; Zhang, H.; Liu, S.; Zhang, H. Technological innovation, environmental regulation, and green total factor efficiency of industrial water resources. J. Clean. Prod. 2019, 211, 61–69. [Google Scholar] [CrossRef]
- Sun, X.; Loh, L. Sustainability Governance in China: An Analysis of Regional Ecological Efficiency. Sustainability 2019, 11, 1958. [Google Scholar] [CrossRef]
- Page, B.; Wohlgemuth, V. Advances in Environmental Informatics: Integration of Discrete Event Simulation Methodology with ecological Material Flow Analysis for Modelling eco-efficient Systems. Procedia Environ. Sci. 2010, 2, 696–705. [Google Scholar] [CrossRef][Green Version]
- Wursthorn, S.; Poganietz, W.R.; Schebek, L. Economic environmental monitoring indicators for European countries: A disaggregated sector-basedapproach for monitoring eco-efficiency. Ecol. Econ. 2011, 70, 487–496. [Google Scholar] [CrossRef]
- Beames, A.; Broekx, S.; Heijungs, R.; Lookman, R.; Boonen, K.; Geert, Y.V.; Dendoncker, K.; Seuntjens, P. Accounting for land-use efficiency and temporal variationsbetween brownfield remediation alternatives in lifecycle assessment. J. Clean. Prod. 2015, 101, 109–117. [Google Scholar] [CrossRef]
- Bai, Y.P.; Deng, X.Z.; Jiang, S.; Zhang, Q.; Wang, Z. Exploring the relationship between urbanization and urban eco–efficiency: Evidence from prefecture–level cities in China. J. Clean. Prod. 2018, 195, 1487–1496. [Google Scholar] [CrossRef]
- Zhou, P.; Poh, K.L.; Ang, B.W. A non-radial DEA approach to measuring environmental performance. Eur. J. Oper. Res. 2007, 178, 1–9. [Google Scholar] [CrossRef]
- Moutinho, V.; Fuinhas, J.A.; Marques, A.C.; Santiago, R. Assessing eco-efficiency through the DEA analysis and decoupling index in the Latin America countries. J. Clean. Prod. 2018. [Google Scholar] [CrossRef]
- Zhang, B.; Bi, J.; Fan, Z.; Yuan, Z.; Ge, J. Eco-efficiency analysis of industrial system in China: A data envelopment analysis approach. Ecol. Econ. 2008, 68, 306–316. [Google Scholar] [CrossRef]
- Yin, K.; Wang, R.S.; Zhou, C.B.; Liang, J. Review of eco-efficiency accounting method and its applications. Acta Ecol. Sin. 2012, 32, 3595–3605. [Google Scholar] [CrossRef]
- Lin, B.Q.; Wang, X.L. Exploring energy efficiency in China′s iron and steel industry: A stochastic frontier approach. Energy Policy 2014, 72, 87–96. [Google Scholar] [CrossRef]
- Halkos, G.; Petrou, K. Assessing 28 EU member states′ environmental effi-ciency in national waste generation with DEA. J. Clean. Prod. 2019, 208, 509–521. [Google Scholar] [CrossRef]
- Ali, E.; Yang, G. A survey and analysis of the first 40 years of scholarly literature in DEA: 1978–2016. Socio-Econ. Plan. Sci. 2018, 61, 4–8. [Google Scholar]
- Wu, J.; Xiong, B.; An, Q.; Sun, J.; Wu, H. Total-factor energy efficiency evaluation of Chinese industry by using two-stage DEA model with shared inputs. Ann. Oper. Res. 2015, 255, 257–276. [Google Scholar] [CrossRef]
- Deng, G.; Li, L.; Song, Y. Provincial water use efficiency measurement and factor analysis in China: Based on SBM-DEA model. Ecol. Indic. 2016, 69, 12–18. [Google Scholar] [CrossRef]
- Charnes, A.; Cooper, W.W.; Rhodes, E. Measuring the efficiency of decision making units. Eur. J. Oper. Res. 1978, 2, 429–444. [Google Scholar] [CrossRef]
- Banker, R.D.; Charnes, A.; Cooper, W.W. Some models for estimating technical and scale inefficiencies in data envelopment analysis. Manag. Sci. 1984, 30, 1078–1092. [Google Scholar] [CrossRef]
- Yang, L.; Ouyang, H.; Fang, K.; Ye, L.; Zhang, J. Evaluation of regional environmental efficiencies in China based on super-efficiency-DEA. Ecol. Indic. 2015, 51, 13–19. [Google Scholar] [CrossRef]
- Zhou, C.S.; Shi, C.Y.; Wang, S. Estimation of eco-efficiency and its influencing factors in Guangdong province based on Super-SBM and panel regression models. Ecol. Indic. 2018, 86, 67–68. [Google Scholar] [CrossRef]
- Zhang, X.Q. Research on Scientific Research Performance of Humanities and Social Sciences in China’s First-class Universities Based on SE-DEA. J. Econ. Sustain. Dev. 2019, 10, 15–32. [Google Scholar]
- Huang, Y.S.; Liu, S.J. Efficiency evaluation of a sustainable hydrogen production scheme based on super efficiency SBM model. J. Clean. Prod. 2020, 256, 1–25. [Google Scholar] [CrossRef]
- Tone, K.A. Slacks-based measure of efficiency in data envelopment analysis. Eur. J. Oper. Res. 2001, 130, 498–509. [Google Scholar] [CrossRef]
- Fare, B.R.; Grosskopf, S.; Norris, M.; Zhang, Z. Productivity growth, technical progress and efficiency change in industrialized countries. Am. Econ. Rev. 1994, 84, 66–83. [Google Scholar]
- Tang, D.C.; Tang, J.X.; Xiao, Z.; Ma, T.; Bethel, B.J. Environmental regulation efficiency and total factor productivity—Effect analysis based on Chinese data from 2003 to 2013. Ecol. Indic. 2017, 73, 312–318. [Google Scholar] [CrossRef]
- Ren, Y.F.; Fang, C.L.; Lin, X.Q. Evaluation of eco-efficiecy of four major urban agglomerations in eastern coastal area of China. Acta Geogr. Sin. 2017, 72, 2047–2063. [Google Scholar]
- Yue, S.; Shen, Y.; Yuan, J. Sustainable total factor productivity growth for 55 states: An application of the new malmquist index considering ecological footprint and human development index. Resour. Conserv. Recycl. 2019, 146, 475–483. [Google Scholar] [CrossRef]
- Pan, J.H.; Yin, J. Analysison the Urban Development Efficiency of Citiesat Prefecture Level or abovein China Basedon DEA-ESDA. Econ. Geogr. 2012, 32, 53–60. [Google Scholar]
- Diaz-Villavicencio, G.; Didonet, S.R.; Dodd, A. Influencing factors of eco-efficient urban waste management: Evidence from Spanish municipalities. J. Clean. Prod. 2017, 164, 1486–1496. [Google Scholar] [CrossRef]
- Liu, T.; Li, J.; Chen, J.; Yang, S. Urban Ecological Efficiency and Its Influencing Factors—A Case Study in Henan Province, China. Sustainability 2019, 11, 5048. [Google Scholar] [CrossRef]
- Simar, L.; Wilson, P.W. Estimation and inference in two-stage, semi-parametric models of production processes. J. Econom. 2007, 136, 31–64. [Google Scholar] [CrossRef]
- Rak, J.R.; Pietrucha-Urbanik, K. An Approach to Determine Risk Indices for Drinking Water–Study Investigation. Sustainability 2019, 11, 3189. [Google Scholar] [CrossRef]


| Categories | Indicators | Units |
|---|---|---|
| Inputs | Construction land | Square Kilometers |
| Water consumption | 10,000 Cube Meters | |
| Labor force | 10,000 | |
| Energy | Tons of Standard Coal | |
| Crop planting area | Acre | |
| Desirable Outputs | GDP | 100 Million RMB |
| Urban disposable income | RMB | |
| Rural disposable income | RMB | |
| Urban per capita green area | Square Meters | |
| Major grain yields | Ton | |
| Undesirable Outputs | Industrial waste water emissions | 10,000 Tons |
| Chemical oxygen demand (COD) emissions | Ton | |
| Ammonia nitrogen emissions | Ton | |
| Industrial exhaust emissions | 100 Million Cube Meters | |
| Industrial soot (dust) emissions | Ton | |
| Sulfur dioxide (SO2) emissions | Ton | |
| Industrial solid waste production | 10,000 Tons |
| Year | Meilie | Sanyuan | Yongan | Mingxi | Qingliu | Ninhua | Datian | Youxi | Shaxian | Jiangle | Taining | Jianning | Mean |
|---|---|---|---|---|---|---|---|---|---|---|---|---|---|
| 2005 | 1.160 | 0.801 | 0.482 | 0.582 | 0.566 | 0.442 | 0.510 | 0.474 | 0.463 | 0.526 | 0.577 | 0.624 | 0.601 |
| 2006 | 0.989 | 0.830 | 0.500 | 0.602 | 0.560 | 0.456 | 0.455 | 0.497 | 0.487 | 0.545 | 0.726 | 0.641 | 0.607 |
| 2007 | 0.948 | 0.766 | 0.523 | 0.595 | 0.540 | 0.445 | 0.809 | 0.512 | 0.498 | 0.546 | 0.891 | 0.568 | 0.637 |
| 2008 | 1.027 | 0.957 | 0.572 | 0.617 | 0.616 | 0.467 | 0.509 | 0.544 | 0.538 | 0.566 | 0.671 | 0.644 | 0.644 |
| 2009 | 1.167 | 0.938 | 0.700 | 0.641 | 0.693 | 0.505 | 0.587 | 0.581 | 0.577 | 0.614 | 0.703 | 0.708 | 0.701 |
| 2010 | 1.596 | 1.246 | 0.678 | 0.645 | 0.689 | 0.520 | 0.623 | 0.642 | 0.612 | 0.632 | 0.694 | 0.734 | 0.776 |
| 2011 | 1.035 | 0.970 | 0.880 | 0.721 | 0.741 | 0.602 | 0.788 | 0.734 | 0.778 | 0.730 | 0.802 | 0.729 | 0.792 |
| 2012 | 1.025 | 0.866 | 0.783 | 0.751 | 0.797 | 0.625 | 0.742 | 0.741 | 0.760 | 0.748 | 0.820 | 0.810 | 0.789 |
| 2013 | 0.938 | 0.852 | 0.806 | 0.752 | 0.790 | 0.661 | 0.771 | 0.809 | 0.824 | 0.789 | 0.865 | 0.884 | 0.812 |
| 2014 | 0.928 | 0.902 | 0.874 | 0.785 | 0.817 | 0.702 | 0.813 | 0.881 | 0.878 | 0.813 | 0.906 | 0.934 | 0.853 |
| 2015 | 0.931 | 0.944 | 0.889 | 0.830 | 0.869 | 0.726 | 0.828 | 0.908 | 0.896 | 0.840 | 0.940 | 0.963 | 0.880 |
| 2016 | 0.921 | 0.966 | 0.944 | 0.850 | 0.909 | 0.807 | 0.872 | 0.987 | 0.945 | 0.866 | 0.980 | 0.982 | 0.919 |
| 2017 | 1.737 | 1.325 | 1.320 | 0.896 | 0.980 | 0.858 | 1.016 | 1.219 | 1.168 | 0.903 | 1.016 | 0.973 | 1.117 |
| Mean | 1.084 | 0.939 | 0.735 | 0.706 | 0.723 | 0.586 | 0.698 | 0.704 | 0.696 | 0.689 | 0.804 | 0.771 |
| Variables | VIF | Std.Err. | z | p > |z| | [95% Conf. Interval] | |
|---|---|---|---|---|---|---|
| LNPGDP | 3.464 | 0.389 | 8.910 | 0.000 | 2.702 | 4.227 |
| LNER | 2.477 | 0.236 | 10.510 | 0.000 | 2.015 | 2.940 |
| SER | 1.797 | 0.187 | 9.590 | 0.000 | 1.429 | 2.164 |
| IS | 1.023 | 0.173 | 5.910 | 0.000 | 0.684 | 1.363 |
| LNTECH | 6.964 | 0.776 | 8.980 | 0.000 | 5.444 | 8.484 |
| LNLAB | 2.778 | 0.317 | 8.770 | 0.000 | 2.157 | 3.398 |
| Eco-Efficiency | Observed Coef. | Bootstrap Std. Err. | z | p > |z| | Normal-Based [95% Conf. Interval] | |
|---|---|---|---|---|---|---|
| LNPGDP | 0.131 | 0.039 | 3.380 | 0.001 | 0.055 | 0.206 |
| LNER | −0.099 | 0.041 | −2.440 | 0.015 | −0.179 | −0.020 |
| SER | −0.044 | 0.017 | −2.570 | 0.010 | −0.078 | −0.011 |
| IS | 0.015 | 0.205 | 0.070 | 0.941 | −0.387 | 0.417 |
| LNTECH | 0.283 | 0.048 | 5.920 | 0.000 | 0.189 | 0.377 |
| LNLAB | −0.329 | 0.098 | −3.360 | 0.001 | −0.521 | −0.137 |
| Constant | 4.171 | 1.088 | 3.830 | 0.000 | 2.038 | 6.304 |
| N = 156 | ||||||
| Wald chi2(6) = 419.98 Prob > chi2 = 0.000 | ||||||
| Within R-squared = 0.789 | ||||||
| Between R-squared = 0.722 | ||||||
| overall R-squared = 0.740 | ||||||
© 2020 by the authors. Licensee MDPI, Basel, Switzerland. This article is an open access article distributed under the terms and conditions of the Creative Commons Attribution (CC BY) license (http://creativecommons.org/licenses/by/4.0/).
Share and Cite
Li, J.; Cai, C.; Zhang, F. Assessment of Ecological Efficiency and Environmental Sustainability of the Minjiang-Source in China. Sustainability 2020, 12, 4783. https://doi.org/10.3390/su12114783
Li J, Cai C, Zhang F. Assessment of Ecological Efficiency and Environmental Sustainability of the Minjiang-Source in China. Sustainability. 2020; 12(11):4783. https://doi.org/10.3390/su12114783
Chicago/Turabian StyleLi, Junlong, Chuangneng Cai, and Feng Zhang. 2020. "Assessment of Ecological Efficiency and Environmental Sustainability of the Minjiang-Source in China" Sustainability 12, no. 11: 4783. https://doi.org/10.3390/su12114783
APA StyleLi, J., Cai, C., & Zhang, F. (2020). Assessment of Ecological Efficiency and Environmental Sustainability of the Minjiang-Source in China. Sustainability, 12(11), 4783. https://doi.org/10.3390/su12114783