Article

A Comparative Study of Sustainable Transition from Catch-up to Post Catch-up of South Korea and China

Science & Technology Management & Policy, University of Science and Technology (UST), KISTI, Seoul 34141, Korea
*
Author to whom correspondence should be addressed.
Sustainability 2020, 12(11), 4751; https://doi.org/10.3390/su12114751
Submission received: 2 April 2020 / Revised: 30 May 2020 / Accepted: 4 June 2020 / Published: 10 June 2020
(This article belongs to the Section Economic and Business Aspects of Sustainability)

Abstract

:
The essence of the experience of East Asia has been on technological capability building and dynamic industrial transitions from one stage to the next. While many studies for understanding the catch-up process and post catch-up agendas exist, empirical and comparative studies that consider the transition from catch-up to post catch-up are still rare. The significance of this research can be summarized in two ways. First, this study verifies the conformity of existing major catch-up to post catch-up transition studies with quantitative evidence. Second, by comparing commonalities and patterns from South Korea and China, this study examines the generality of the discourses and arguments about the transition from catch-up to post catch-up. The reflexive study of understanding transition from catch-up to post catch-up was conducted with a technology cycle time (TCT), self-citation ratio at a country level, and the basic research expenditure of Korea and China by using the US Patents and Trademark Office’s (USPTO) patent citation (for technology cycle time & self-citation ratio) and OECD’s database (basic research expenditure and gross domestic expenditure on basic research) for time period from 1998 to 2012. Empirical evidence of technology cycle time, self-citation ratio and gross domestic expenditure on basic research matched well with the prior transition arguments. First, Korea’s case shows a post catch-up trend with an increasing technology cycle time while China’s case presents catch-up trend (short-cycle period) and shifts to post catch-up trend (post catch-up trend). Self-citation ratios for both countries show increasing and converging pattern. In terms of basic research activities, both countries show increasing pattern. Korea exceeded the gross domestic expenditure on basic research of Japan and the US. Even though, China’s gross domestic expenditure on basic research has been tripled from 1998 to 2012, China’s gross domestic expenditure on basic research has still a long way to go to close the gap and to show a converging pattern. Many developing countries that once experienced a certain level of successful catch-up did not overcome the middle income trap have fallen behind. Understanding transition process of catch-up to post catch-up discussed in this paper may present a better understanding of long-term sequential development and economic sustainability of developing countries.

1. Introduction

Among many forms of knowledge, scientific and technological knowledge has played an important roles in achieving richness and abundance to human life. Various phenomena in the process of technological innovation include absorption and utilization of technological knowledge. By tracking the absorption and utilization of technological knowledge flow, we can gain better understanding of technological innovation and its influences on the economy and civil society.
In the past industrialization process, Korea has achieved high economic growth by carrying out innovation activities to adopt, assimilate and improve foreign technologies with the goal of catching up to the advanced countries. Since the 1970s, the Korean government has focused on technology development by publicly conducting and supporting R&D. R&D by the private sector was supported with tax incentives, and public-private joint R&D was also welcomed and actively conducted. However, Korea faced middle income traps because of increase in production costs domestically and the decrease in export competences due to developing countries cheaper products internationally [1]. To overcome this middle-income trap and make major changes in national innovation system, a post-catch up frame and discourse emerged in South Korea from the 2000s.
This paper contributes to provide a reflexive study of understanding catch-up process and post catch-up national strategy by comparing technological regimes based on the technology cycle time (TCT), self-citation ratio at a country level, and the basic research expenditure of Korea and China. By comparing and testing two countries, this study examines the conformity and generality of the theory and discourse about catch-up and post catch-up transition empirically. Section 2 first provides the theoretical backgrounds of global value chain (GVC) and innovation system, and then a literature review of catch-up and post catch-up frameworks. Section 3 describes the methodology and research design used in this study. Section 4 provides the results of the statistical analysis based on the specific methods and research design described in Section 3. Section 5 and Section 6 present the discussion and conclusion of the study respectively.

2. Theoretical Background

2.1. Global Value Chain and Innovation System

Global Value Chains (GVC) is a framework for understanding international supply chains and international economic activities at the global, national, and local levels within particular industries [2]. The two main issues in GVC are governance and upgrading [2]. Governance deals with degrees of dominance in network formation. Gereffi suggests that there are five modes of governance which are (A) Hierarchy (B) Captive (C) Relational (D) Modular (E) Market [3]. Three characteristics were presented to explain what make such differences in modes of governance. (A) Complexity of information and knowledge transfer (B) Extent to which the information can be codified (C) Capabilities of suppliers [4].
Humphrey and Schmitz [4] and later, Giuliani et al. [5] present and discuss the four types of upgrading modes. (A) Process (B) Product (C) Functional (D) Intersectoral. process upgrading means transforming raw materials or inputs into more value added materials or outputs efficiently by changing the production system. Product upgrading means shifting business entities into higher value-added product lines. Functional upgrading means implementing superior functions in the value chain for designing or marketing activities while intersectoral upgrading means the acquisition of competence in a certain function to move into a newly formed sector. Since functional upgrading and sectoral upgrading require more than technological innovation, they are scarce [5].
National innovation systems (NIS) refer to the “elements and relationships that interact in the production, diffusion, and use of new and economically useful knowledge” at the national levels according to Lundvall [6]. Neo-Schumpeterian scholars assert that differences in the national innovation systems generate differences in innovation results and influence the economic performance of countries significantly [6,7]. NIS literature and its advocates tend to place more emphasis on the role of the government while GVC literature focuses more on role of trade policies and transnational linkages [6,8]. Moreover, Lundvall asserts that the global value chain literature has a tendency to consider globalization causes institutional convergence among nations while innovation system scholars see globalization as a “process that might make specific national patterns more disparate leading to divergence not only in terms of economic structure but also in terms of institutions” [6].
The integration of the two approaches is crucial for understanding the dynamics of East Asian countries’ successful catch-up cases and the debates about post catch-up transition in this research. Developing nations and their firms need to access knowledge from developed nations or multinational corporations (MNCs) and therefore openness to foreign direct investment, international trade, and international knowledge transfers are required. However, getting access to foreign knowledge and staying in the GVC can ensure developing countries remain in low-valued positions [6,8,9,10,11].
Fu, Pietrobelli and Soete’s analysis [12] suggests that, international technology diffusion can be beneficiary to developing countries and their firms only if parallel indigenous innovation activities (the localization of knowledge creation activities) coexist. Their analysis concludes that income gaps between rich and poor nations will not be closed without indigenous innovation efforts. Moreover, their study presents empirical evidence that building a strong national innovation system is crucial for economic catch-up and upgrading in GVC for latecomers. Fagerberg’s empirical studies [13,14] also suggests the importance of building a national knowledge base, and openness (Openness to ideas, entrepreneurial effort) and governance (rules, intellectual property rights).
From Lee et al. [15] and Park et al. [16], it is noticeable that Korea and China have maintained economic and industrial policies limiting privatization, liberalization, and deregulation while keep active position in export promotion, imposing import tariffs, supporting public & private R & D, and stimulating higher education for their citizens. All these efforts they exert contribute toward building their national innovation systems and stimulating indigenous innovations.
Rodrick [17] explains the slow growth of Latin America by its economic and industrial policies built from the Washington Consensus’s all ten lists. The Washington Consensus refers to set of free-market economic policies asserted by financial institutions such as the International Monetary Fund and the World Bank as recommendations for developing countries’ economic development. Responding to Rodrick’s analysis [17], Lee added and emphasized the three missing elements from the Washington Consensus [18] (for further details, see Appendix A). Lee’s study clearly indicates commonalities of three Asian countries, South Korea, Taiwan and China, in their economic and industrial policy during their early stages of catch-up [18].

2.2. Literature Reviews of the Catch-up and Post Catch-up Frameworks

Catch-up was used first by the Gerschenkron for explaining the economic growth of Europe and the rise of the UK in the late nineteenth century [19]. Fagerberg and Godinho define the catch-up as “narrowing of country’s gap in productivity and income toward a leading the world as a whole” [20]. Song et al. defined post catch-up as innovation activities that form a new technological trajectory due to first, the absence of imitation and catch-up objects, and second, the accumulation of the technological capabilities of developing nations or latecomers [21]. It is process-oriented concept for establishing a new innovation system while the activities of each innovation agent form a new technology trajectory [21]. In addition, the post catch-up approach is a dynamics framework that can understand the organizational and institutional competency and continuity accumulated through the catch-up process, and at the same time, it takes into account the discontinuity of a technology trajectory which can occur due to changes in the environment [21].
Kindleberger applied the concept of catch-up and explained the background and motivation of Japan’s rapid catch-up to the United States [22] while Amdsden’s study analyses the limitations and economic difficulties of non-Western latecomers [23]. Lee clarifies that catch-up studies prior to Kindlerberger [22] and Amdsden [23] have focused mainly on how developing countries have acquired and improved their technological capabilities by absorbing the obsolete technologies from developed countries based on product life cycle theory [24,25,26]. These studies include Utterback and Abernathy [26], Bolton [27], Kim [28], and Lee et al. [29]. Table 1 below shows the stage models of technological innovation capabilities mentioned above.
However, a latecomer does not simply follow the same path paved by advanced countries. They skip stages or create their own unique path for technological development while accumulating their own technology capabilities [24,25,30]. From these possibilities and observations, Perez and Soete [32] suggested the leapfrogging strategy.
Taking into account the possibilities of path-skipping and path–creating strategies that developing countries can initiate, Lee provided a strong argument that leapfrogging can occur more frequently if developing countries (latecomers) focus and target short cycle sectors and take advantage of specialization from these sectors [24,25]. A short cycle time means that the industry relies less on existing technologies and can seize the greater opportunities that arise from the emergence of new ones [1,24,25,33,34].
Lee’s study shows that patent application from South Korea increase in technology fields with shorter cycle times of technology such as electronics and ICT sectors and decreases in an average cycle time (a lower technology cycle time) until around 2000 [1,24,25]. Focusing and targeting short cycle time sectors in South Korea has been considered as a very useful national development model and a successful case for developing countries.
However, around 2000, Lee also observed that the technology cycle time of Korea reached a turning point [1,24,25]. From around 2000, the decreasing trends of average cycle time stopped, and turned into increasing trends after the early 2000s. Lee’s study asserted that this technology cycle time shift represents the start of the post catch-up transition stage of the South Korea. According to Lee, this turning point and increases in cycle time (higher technology cycle time) were due to Korean firms’ efforts to get into long cycled sectors such as pharmaceuticals and biotechnologies [1,24,25] (However, the current study presents rather contradicting empirics, as seen in Section 4).
In the past, Korea has successfully secured a competitive edge of the “fast follower” by successfully adopting advanced technologies and gradually improving. Since the 2000s, Korea has experienced the rigidity of the “catch-up” path. The study of “post catch-up” innovation activities emerged to deal with how innovative actors create new ways of conducting and organizing work in a new environment, and how these new activities interact with organizational methods, rules and institutions [21].
Post catch up discourse have received attention from many scholars and policy-makers in South Korea. These discourses grew from the need to lock-out the self-reinforcing and path-dependent catch-up inertia and the needs to create a new path. There were various arguments and debates about the post catch-up transition from policy-makers and scholars in South Korea. No universal answers could be found but innovation study scholars in Korea made general consensus for making distinctions between the catch-up stage and post catch-up stage as seen in Table 2 below.
The main argument of the first dimension about post catch-up transition in terms of technology life cycle was mainly asserted by Lee’s study and has been discussed above. The significance of the localization of knowledge creation was already mentioned in the discussion of literature review of GVC and NIS literature. In the very early stage of economic development, Korean firms entered into a market which was already mature in developed countries and absorbed obsolete technologies. The internalization of knowledge processes gradually developed the technological capabilities of Korea, and thus Korean firms can now accumulate technological capabilities to acquire products and technologies which are in a transition phase [26] from developed countries.
This process further develops to the point where it is possible to acquire high technology capability that can ultimately acquire the technology and products of advanced countries, which is in the stage of fluid stage [26] in developed countries. Many Korea firms evolved from Original Equipment Manufacturer (OEM) into Original Design Manufacturer (ODM), and, finally, Original Brand Manufacturer (OBM) [1,8,24,25]. These indigenous innovation activities and efforts to upgrade into higher value-added positions favored strengthening the localization of knowledge creation.
Unlike the catch-up stage, in which the target of catch-up clearly exist, the post catch-up innovation activity has no target to catch [21]. Song et al. assert that countries like Korea which experienced relatively successful economic and technological catch-up can manage to accumulate knowledge, and set up institutions and infrastructures to develop further, but their knowledge base for conduct basic research is still inevitably weak compared to advanced countries [21]. In these unique contexts, strengthening basic research activities was justified with dominant supports from the government officials and scholars [1,24,25,35,36]. Establishing institutions, manpower, funding for conducting basic research was considered as important national agenda in South Korea.
It is also worth mentioning that Song et al. [21] classified the firm-level post catch-up technological innovation activities into three types. The first type (deepening) of post catch-up innovation is the capital-intensive industry and this type of firms accumulate knowledge from the existing mainstream industries. Emblematic industries of the first type include Nano-fiber and semiconductors. The first post catch-up type has the characteristics of developing specialized equipment and materials through interaction with companies, or obtaining original technologies through industry-academic cooperation with universities and research institutes [21].
The second type (architecture innovation) of post catch-up innovators enter to the market immediately after the dominant design is established and performs leading technological innovation through product differentiation based on application capabilities (mobile phone chips, set-top boxes, etc.). Architecture innovation can be said to be an innovation that changes the way in which existing elements are combined [21,39]. The second type performs technological innovation through effective co-learning with user companies which lead architecture innovation.
The third type (innovations from securing original technology or basic research results) of post catch-up innovation is the case of possessing and commercializing the original technology in a niche area. Emblematic industries in which this post catch-up innovation type frequently occurs include biopharmaceuticals and microprocessors industries. The third type commercializes new technologies through close links with basic research institutes such as universities, government research institutes, and large companies [21].

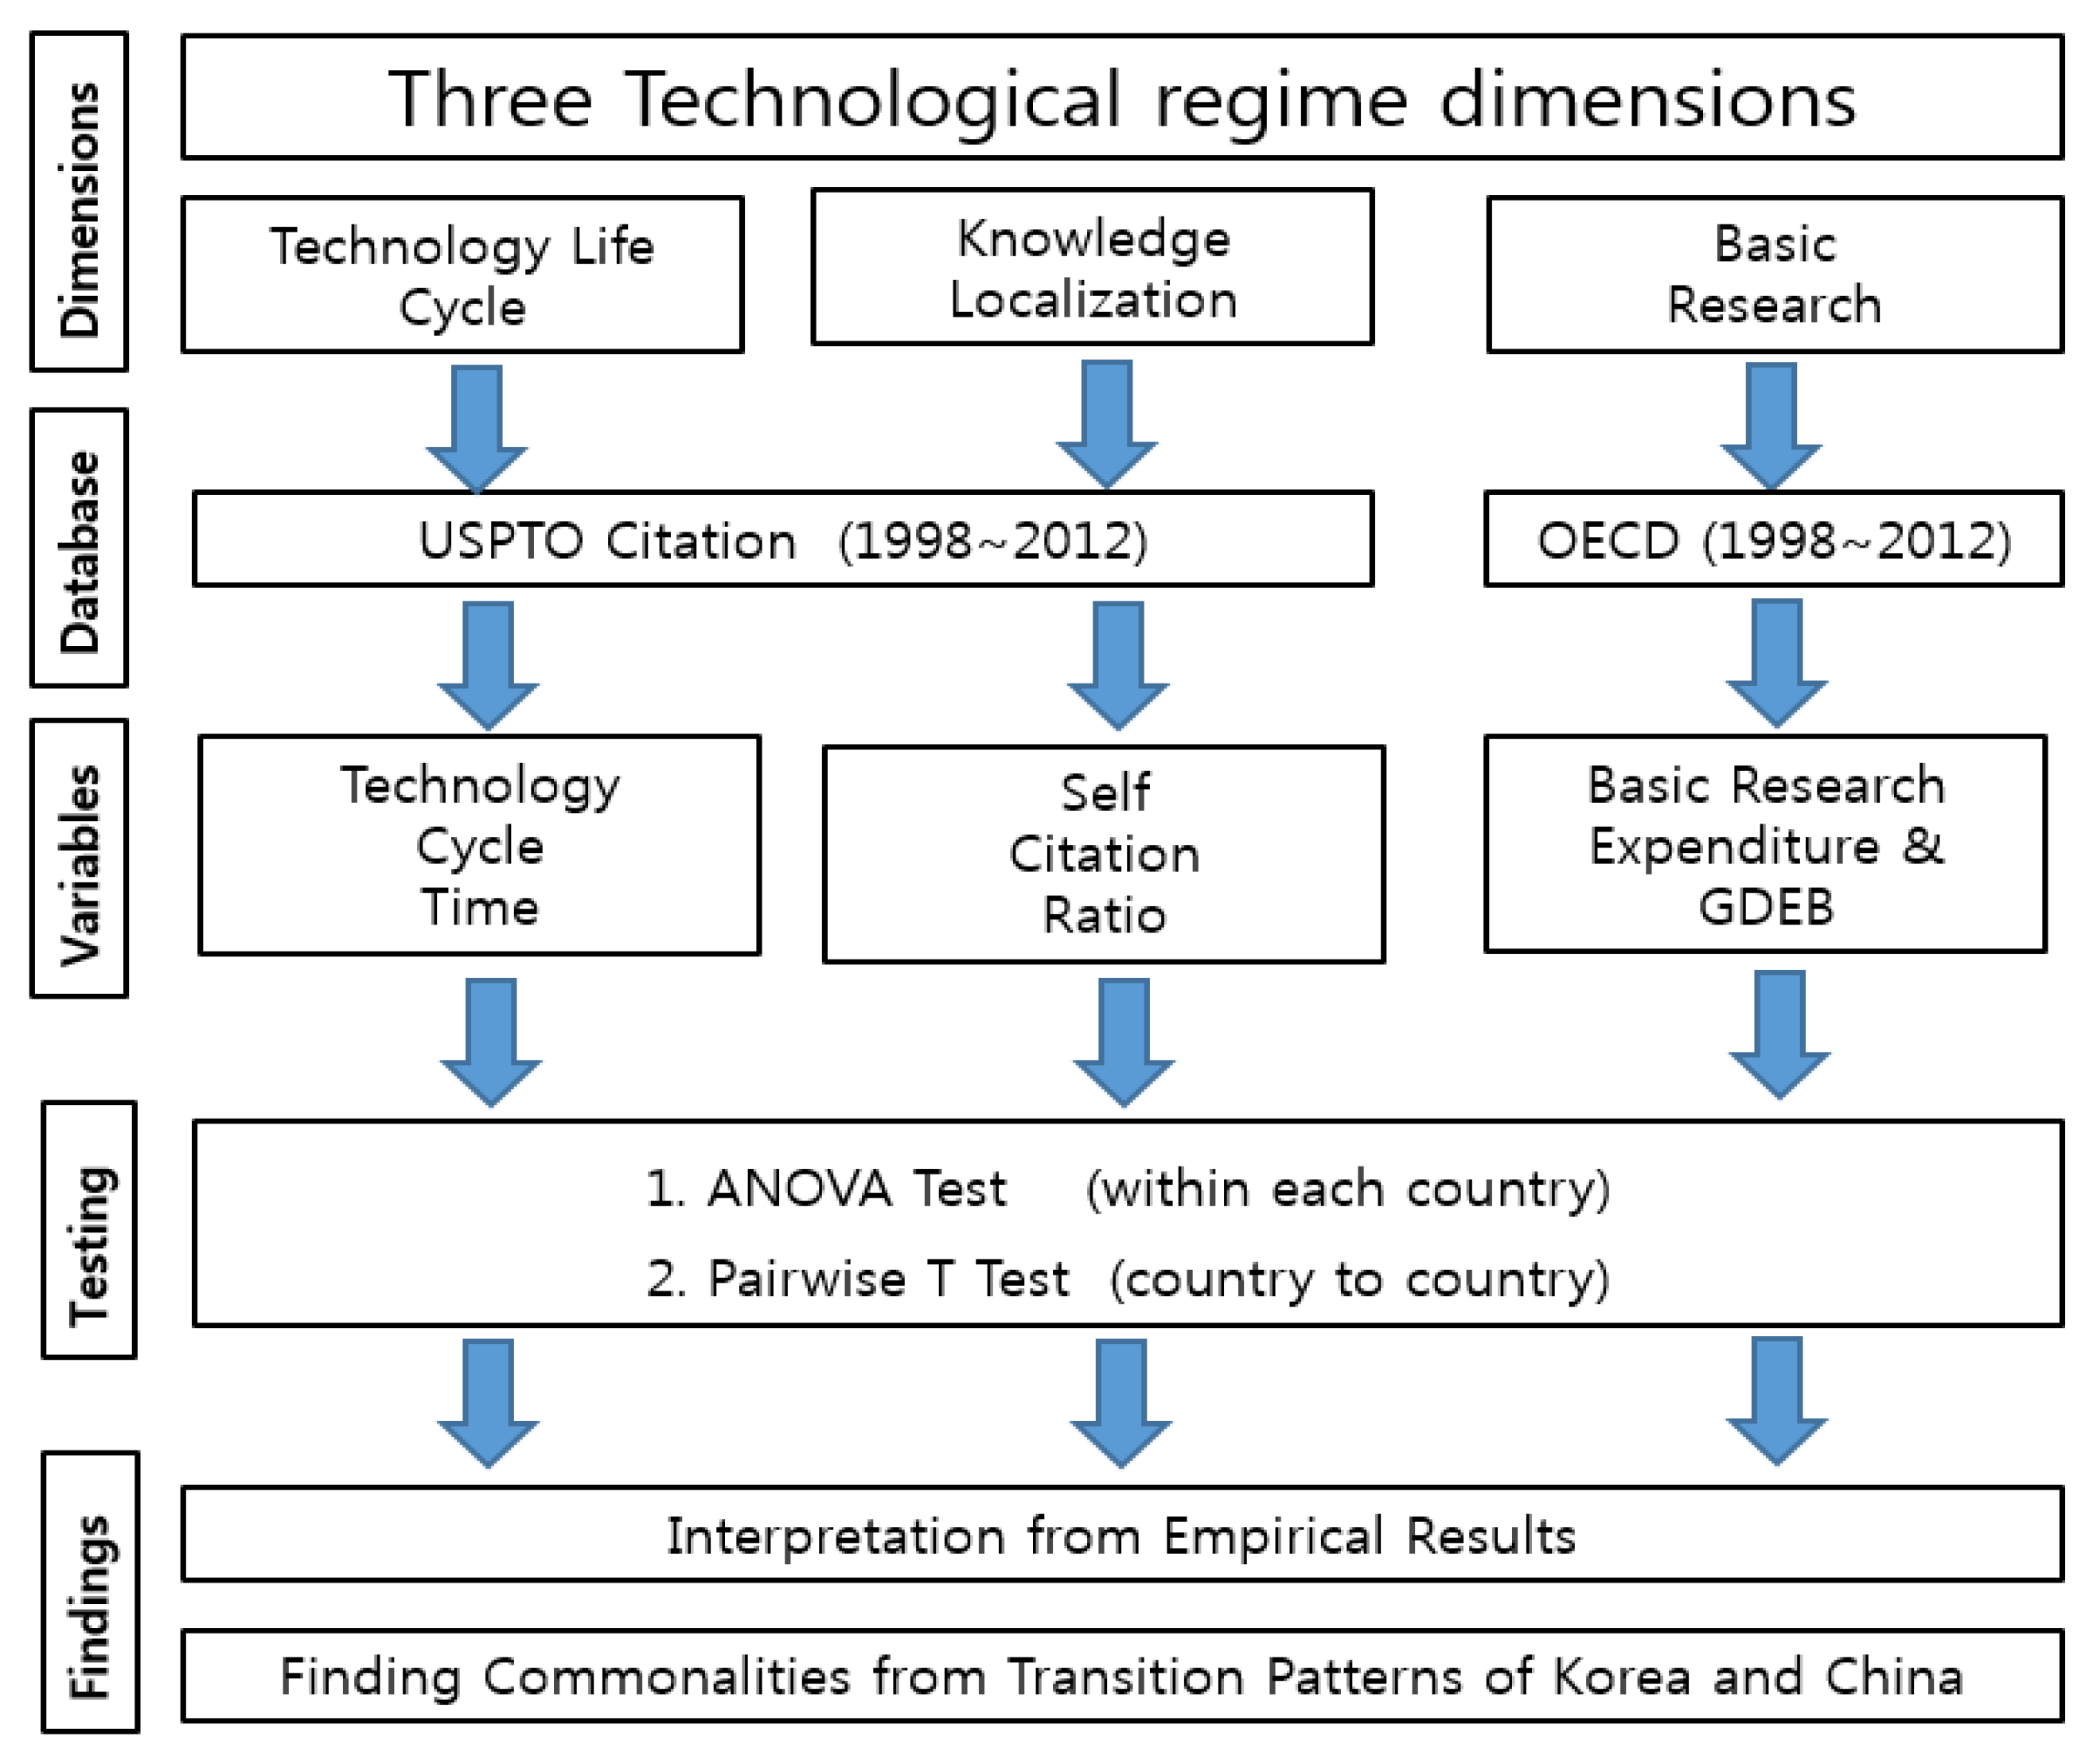
3. Methodology and Research Design

This study only examined and performed quantitative analysis for macro level technological regime dimensions from the Table 2 above. This was due to the fact that the organizational structure, culture, and social problem dimensions were not comparable quantitatively and case study may be more suitable to trace them in further studies.
It is challenging to compare two countries’ national innovation systems and their innovation activities. Using patent data to analysis the technology cycle time and self-citation ratio yields advantages and limitations simultaneously [40]. It is obvious that patents do not cover all the innovation activities of the firms. Moreover, many studies including this one only compare the quantitative dimensions of the patents, and do not handle qualitative information from each patent.
Though there are many limitations, patents, especially, the US patent database, have been increasingly used for conducting comparative studies at the national level and serve as a reliable “paper trail of knowledge flows” [41]. Patent citations can be considered as important knowledge links among the individuals, institutions and countries which access them.
For our study’s purpose, data from the US Patents and Trademark Office (USPTO) has been obtained and used (publication years: 1998–2012) to compare South Korea’s and China’s technology life cycle and degree of knowledge creation localization respectively. Selecting the USPTO database to conduct the comparative study has its reasons. Korea’s and China’s patent database has only recently provided a database of citation, while the USPTO has been systemically collecting and opening citation data for a longer period of time.
The first dimension, technology life cycle concerns how fast an industry’s or company’s technology and knowledge domains become obsolete. The technology cycle time which was first suggested by Narin and Smith [42] is most generally used to measure technology life cycle. Technology cycle time can be calculated by averaging time lags (scale: years; year to year comparisons) between the publication years of citing and cited patents. An industry with a short technology cycle time means that the knowledge fields of the corresponding industry quickly become outdated and obsolete [1].
This study uses Lee’s study [1,24,25] as the foundation and critical references for analyzing the empirics of catch-up and post catch-up transitions. Moreover, this study also complies with Lee’s argument that targeting and specialization into shorter-cycled sectors can be advantageous and provide greater opportunities for developing countries’ catch-up [1,24,25]. This study also accepts his assertion of Korea’s turning point from a short cycle time to a long cycle time as a beginning of post catch-up transition. However, this study does not follow Lee’s prediction that longer TCT is due to relatively long TCT with emblematic industries, such as the bio industries or pharmaceuticals industries. The empirics from this research reveal this point in Section 4.
Reflecting the literature reviews [1,24,25], this study posits that Korea’s TCT will show increasing trends since Korea have reached post catch-up stages from 2000s, while China’s technology cycle time presents a V-shape pattern, decreasing in the catch-up stages and increasing after China gets into the post catch-up stage. A statistical analysis of technology cycle time was conducted in Section 4 as below, using the following method:
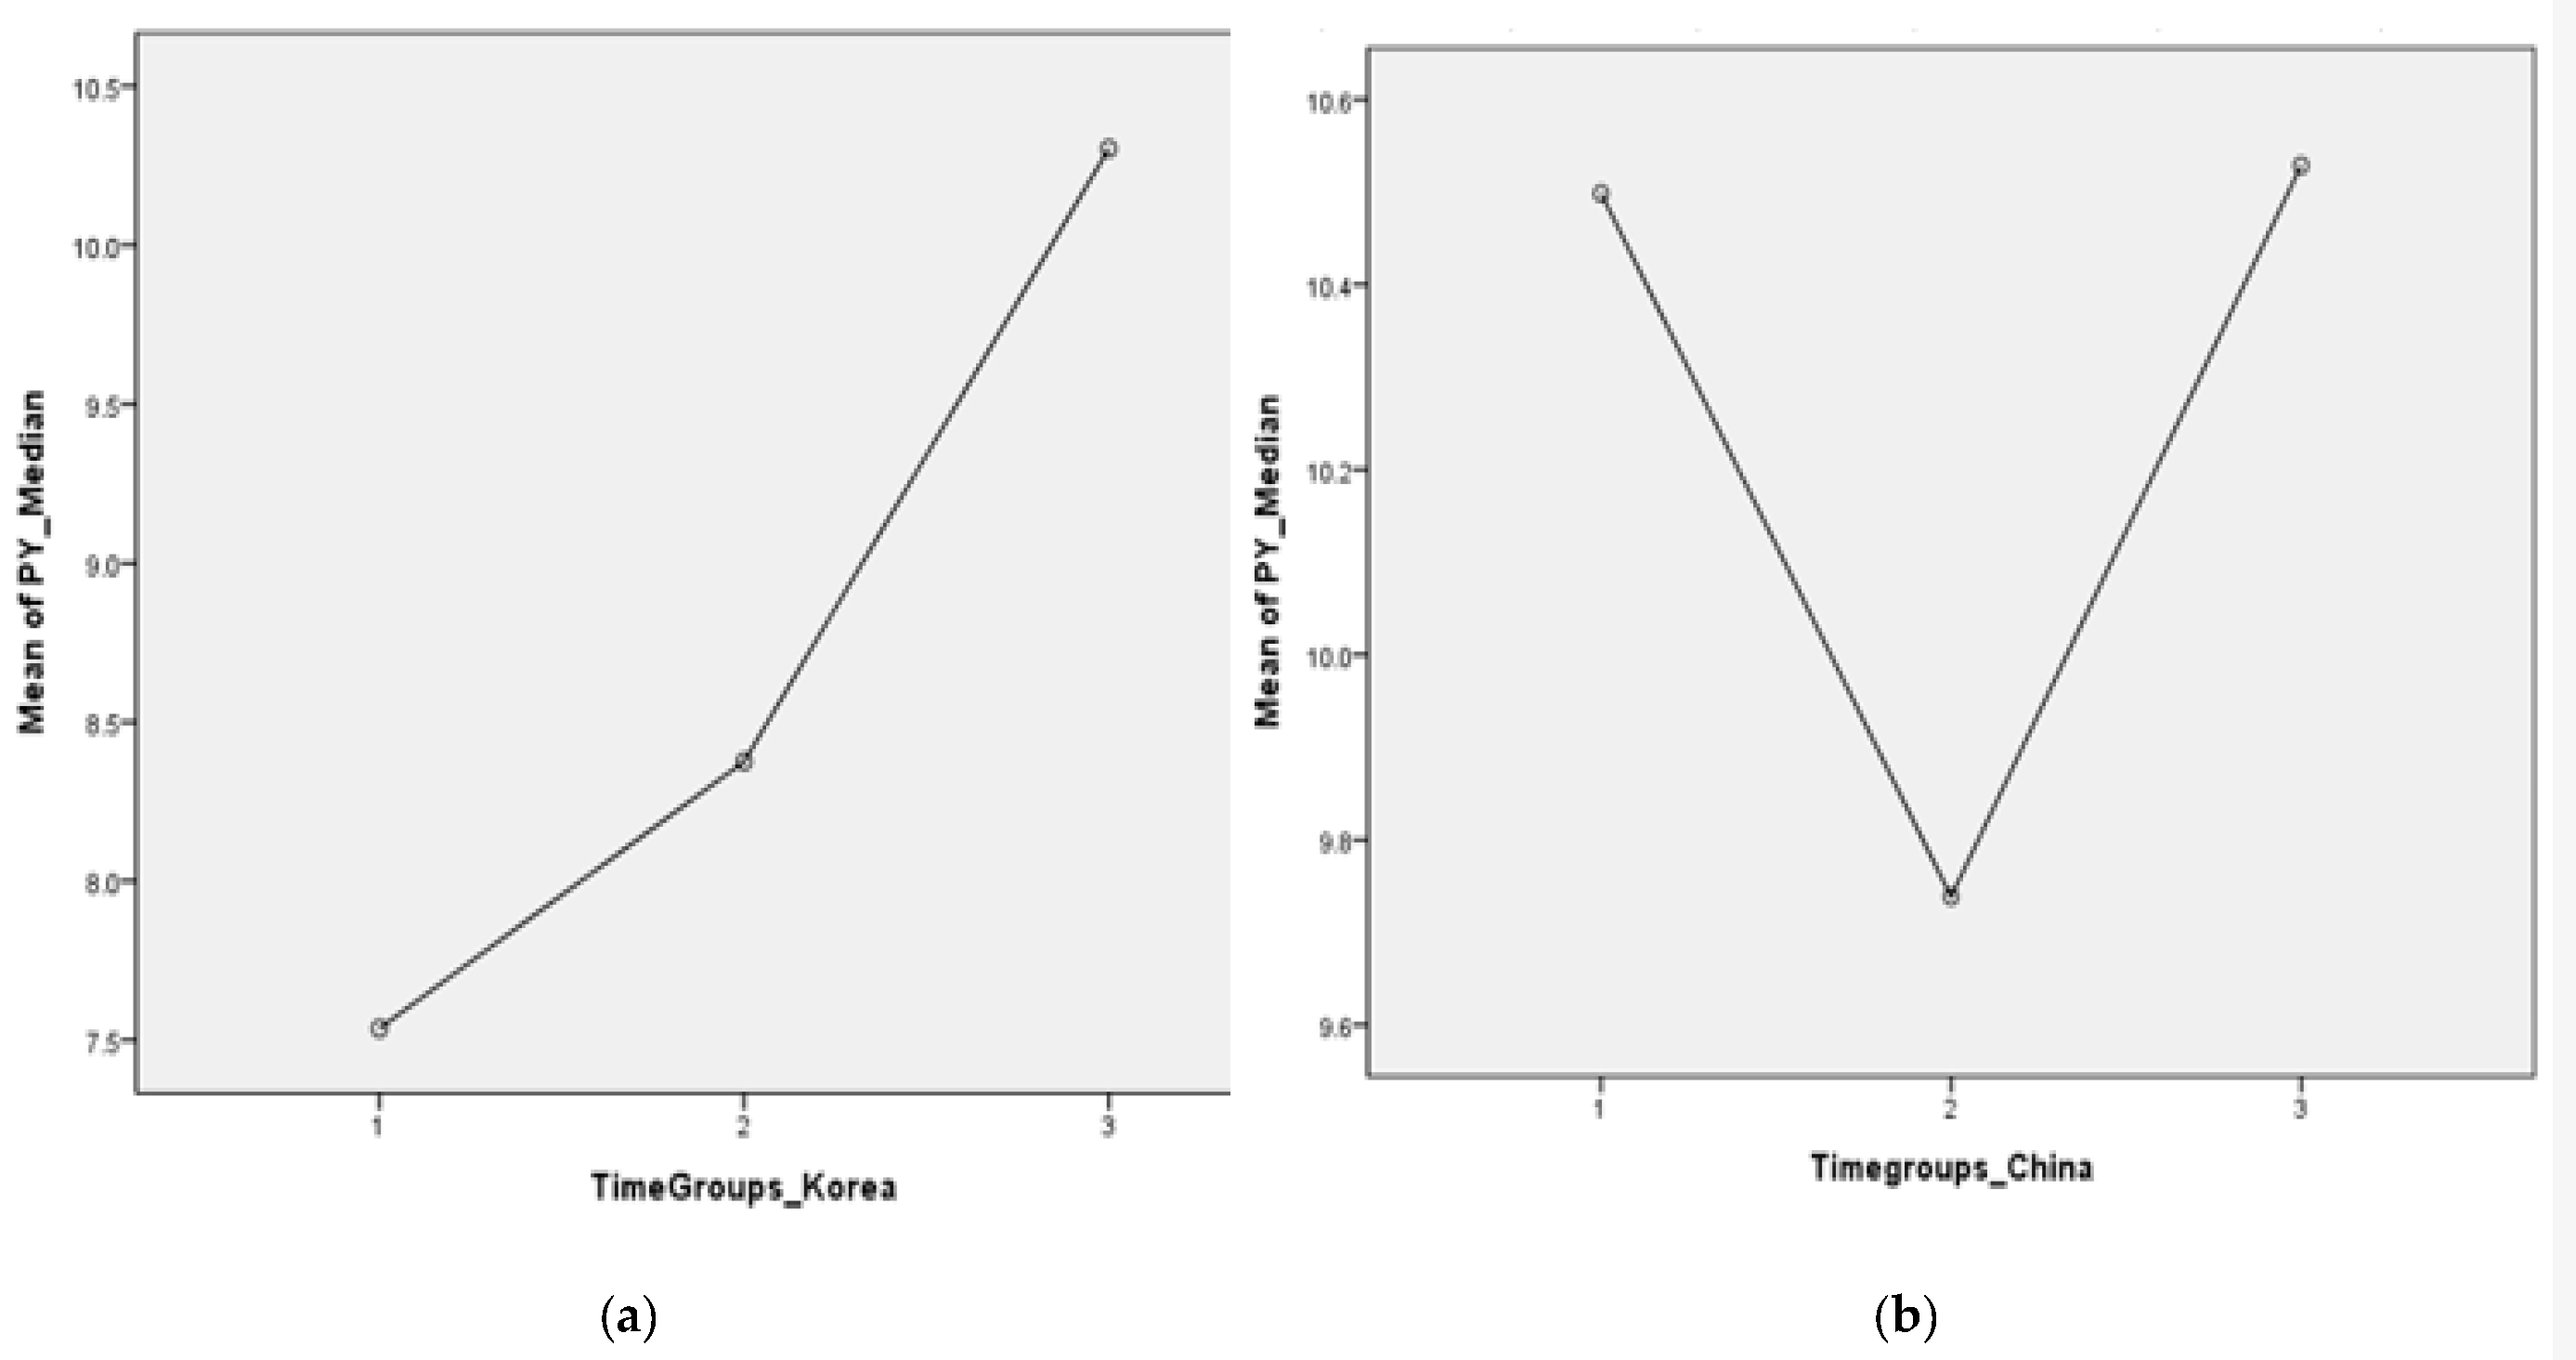
  • An ANOVA test was conducted for each country’s TCT (scale: year) in terms of time groups to examine whether the increasing pattern of TCT for Korea and V-shaped pattern for China were present or not. This is comparison within a country.
  • (Time group 1: 1998–2002, time group 2: 2003–2007, time group 3: 2008–2012).
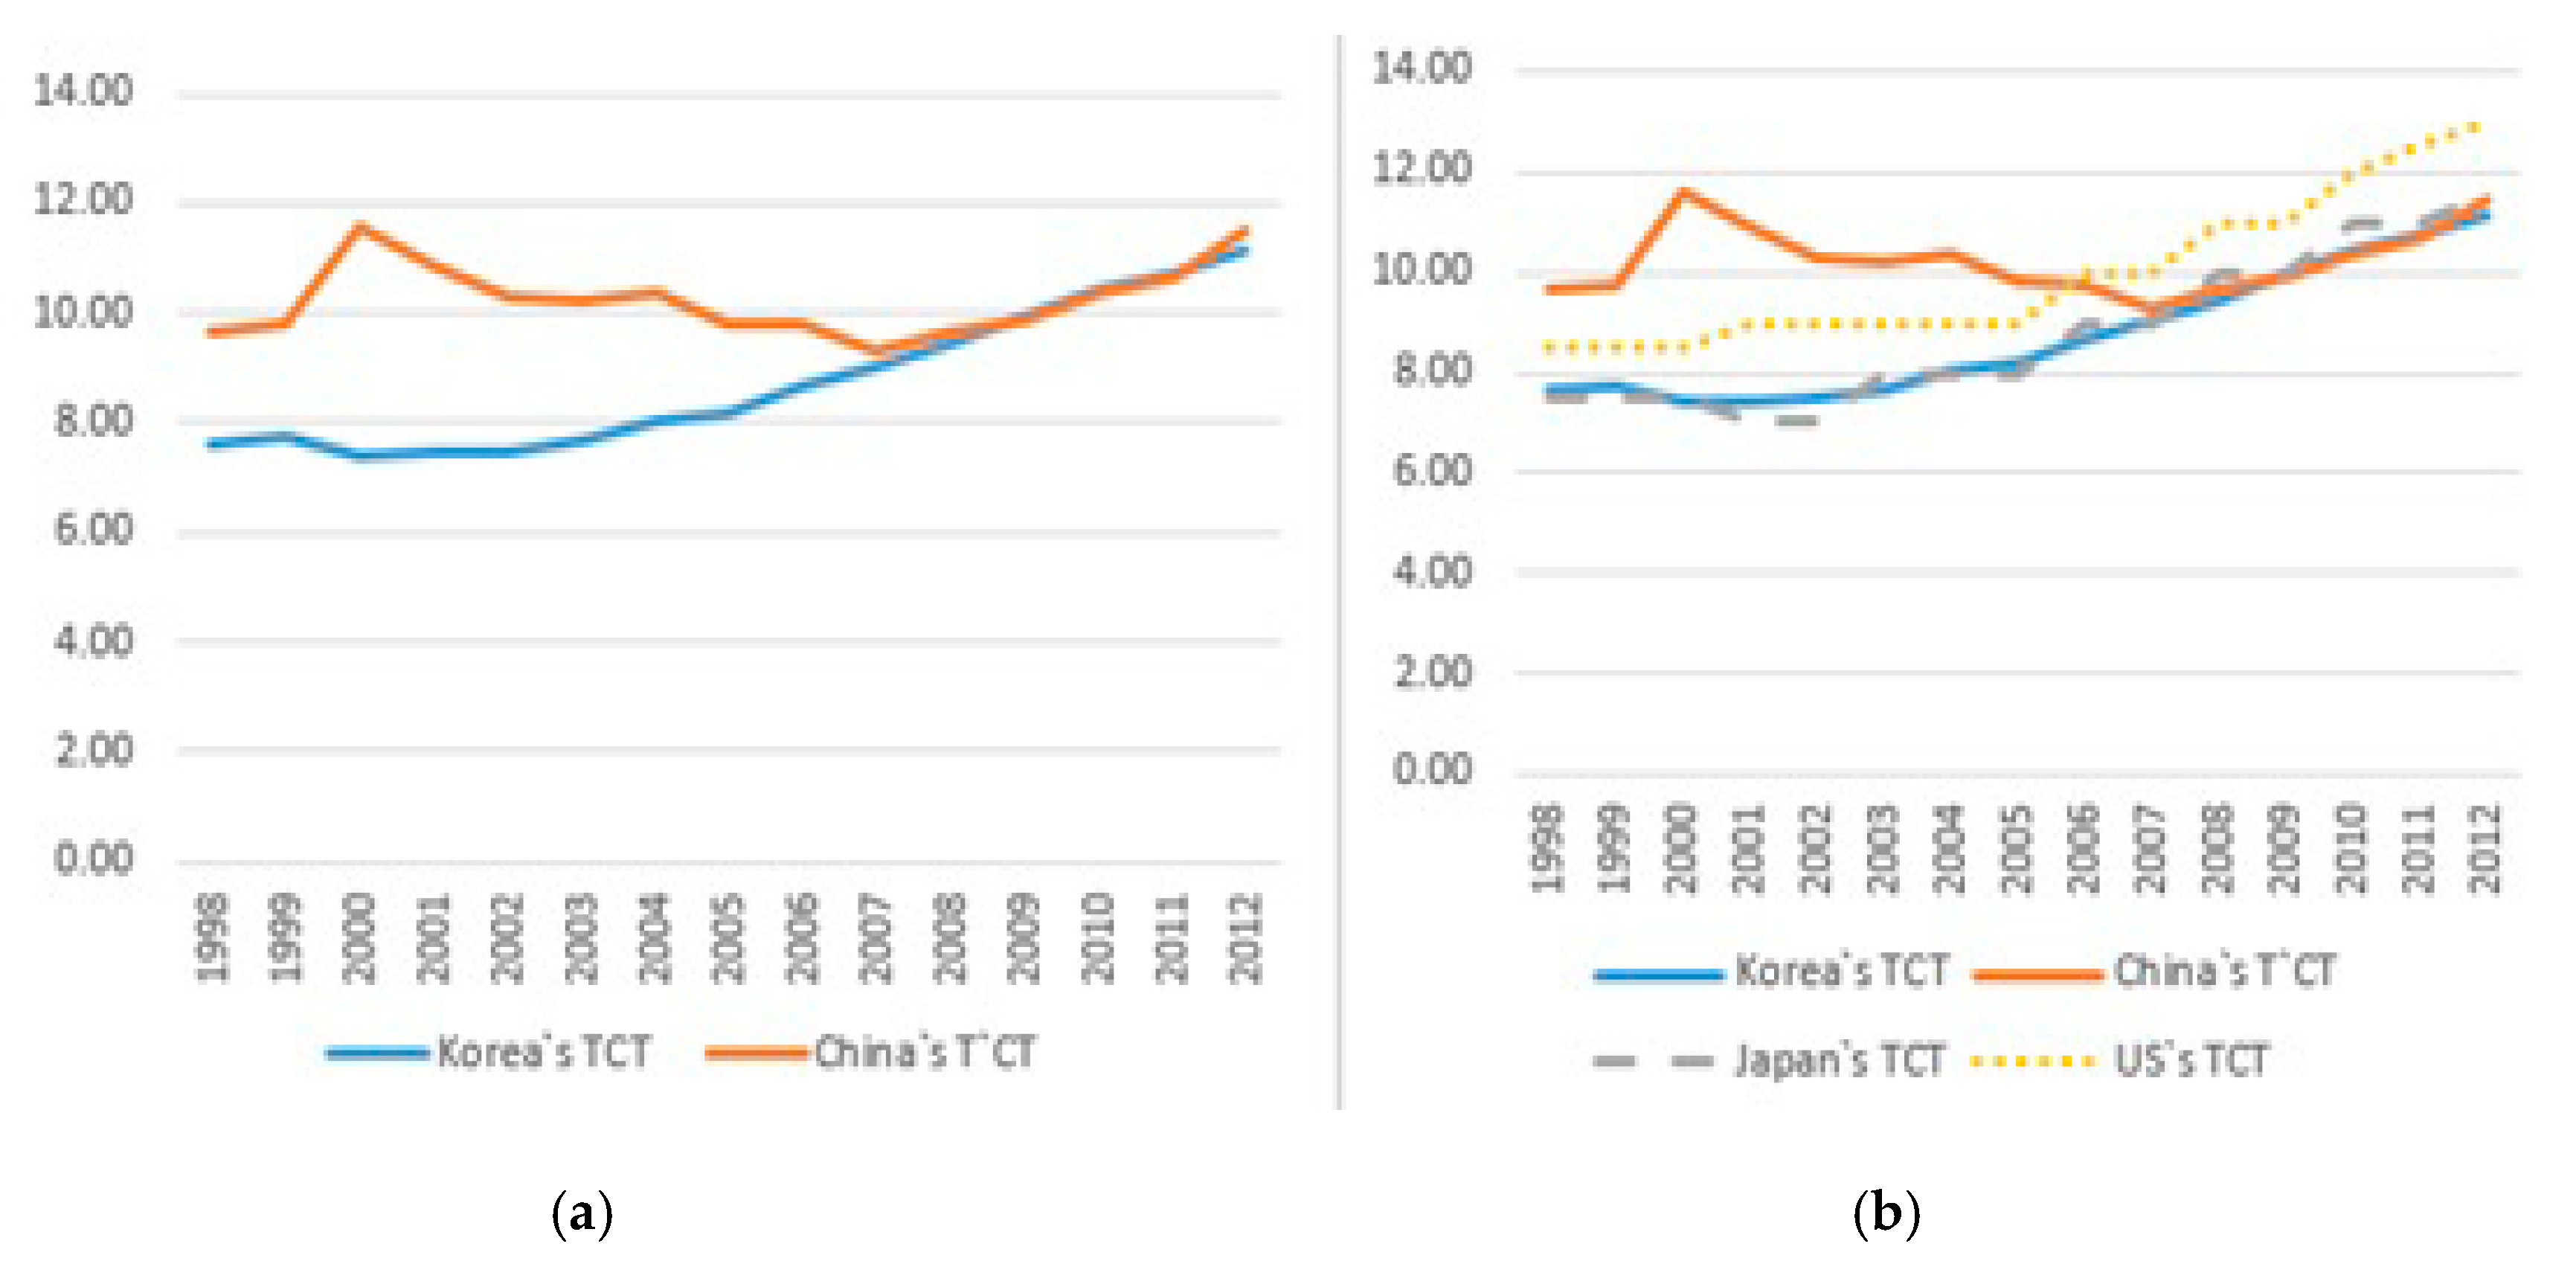
  • A Pairwise T test was used for comparing the mean differences of Korea, China, Japan, and the US’s TCT over 15 years. The pairwise t-test was performed to see whether the TCT of Korea and China show a converging pattern or not. This is country-to-country comparison.
The second dimension, the localization of knowledge creation concerns the source of knowledge creation and measures the dependency on foreign knowledge bases and domestic knowledge bases of a nation or a company. This study followed the same operation definition used in prior researches such as Lee’s study [1,24,25,35], and Hu’s study [43] which measure and conduct country-to-country comparison for the localization of knowledge creation.
To quantify the degree of knowledge creation localization, this study measured the patent’s self-citation ratio at the country level (for example, the percentage of the US patent filed by a Korean citizen cites other US patents filed by Korean citizens and so forth). This study posits that both Korea and China’s self-citation ratio shows increasing patterns through time groups.
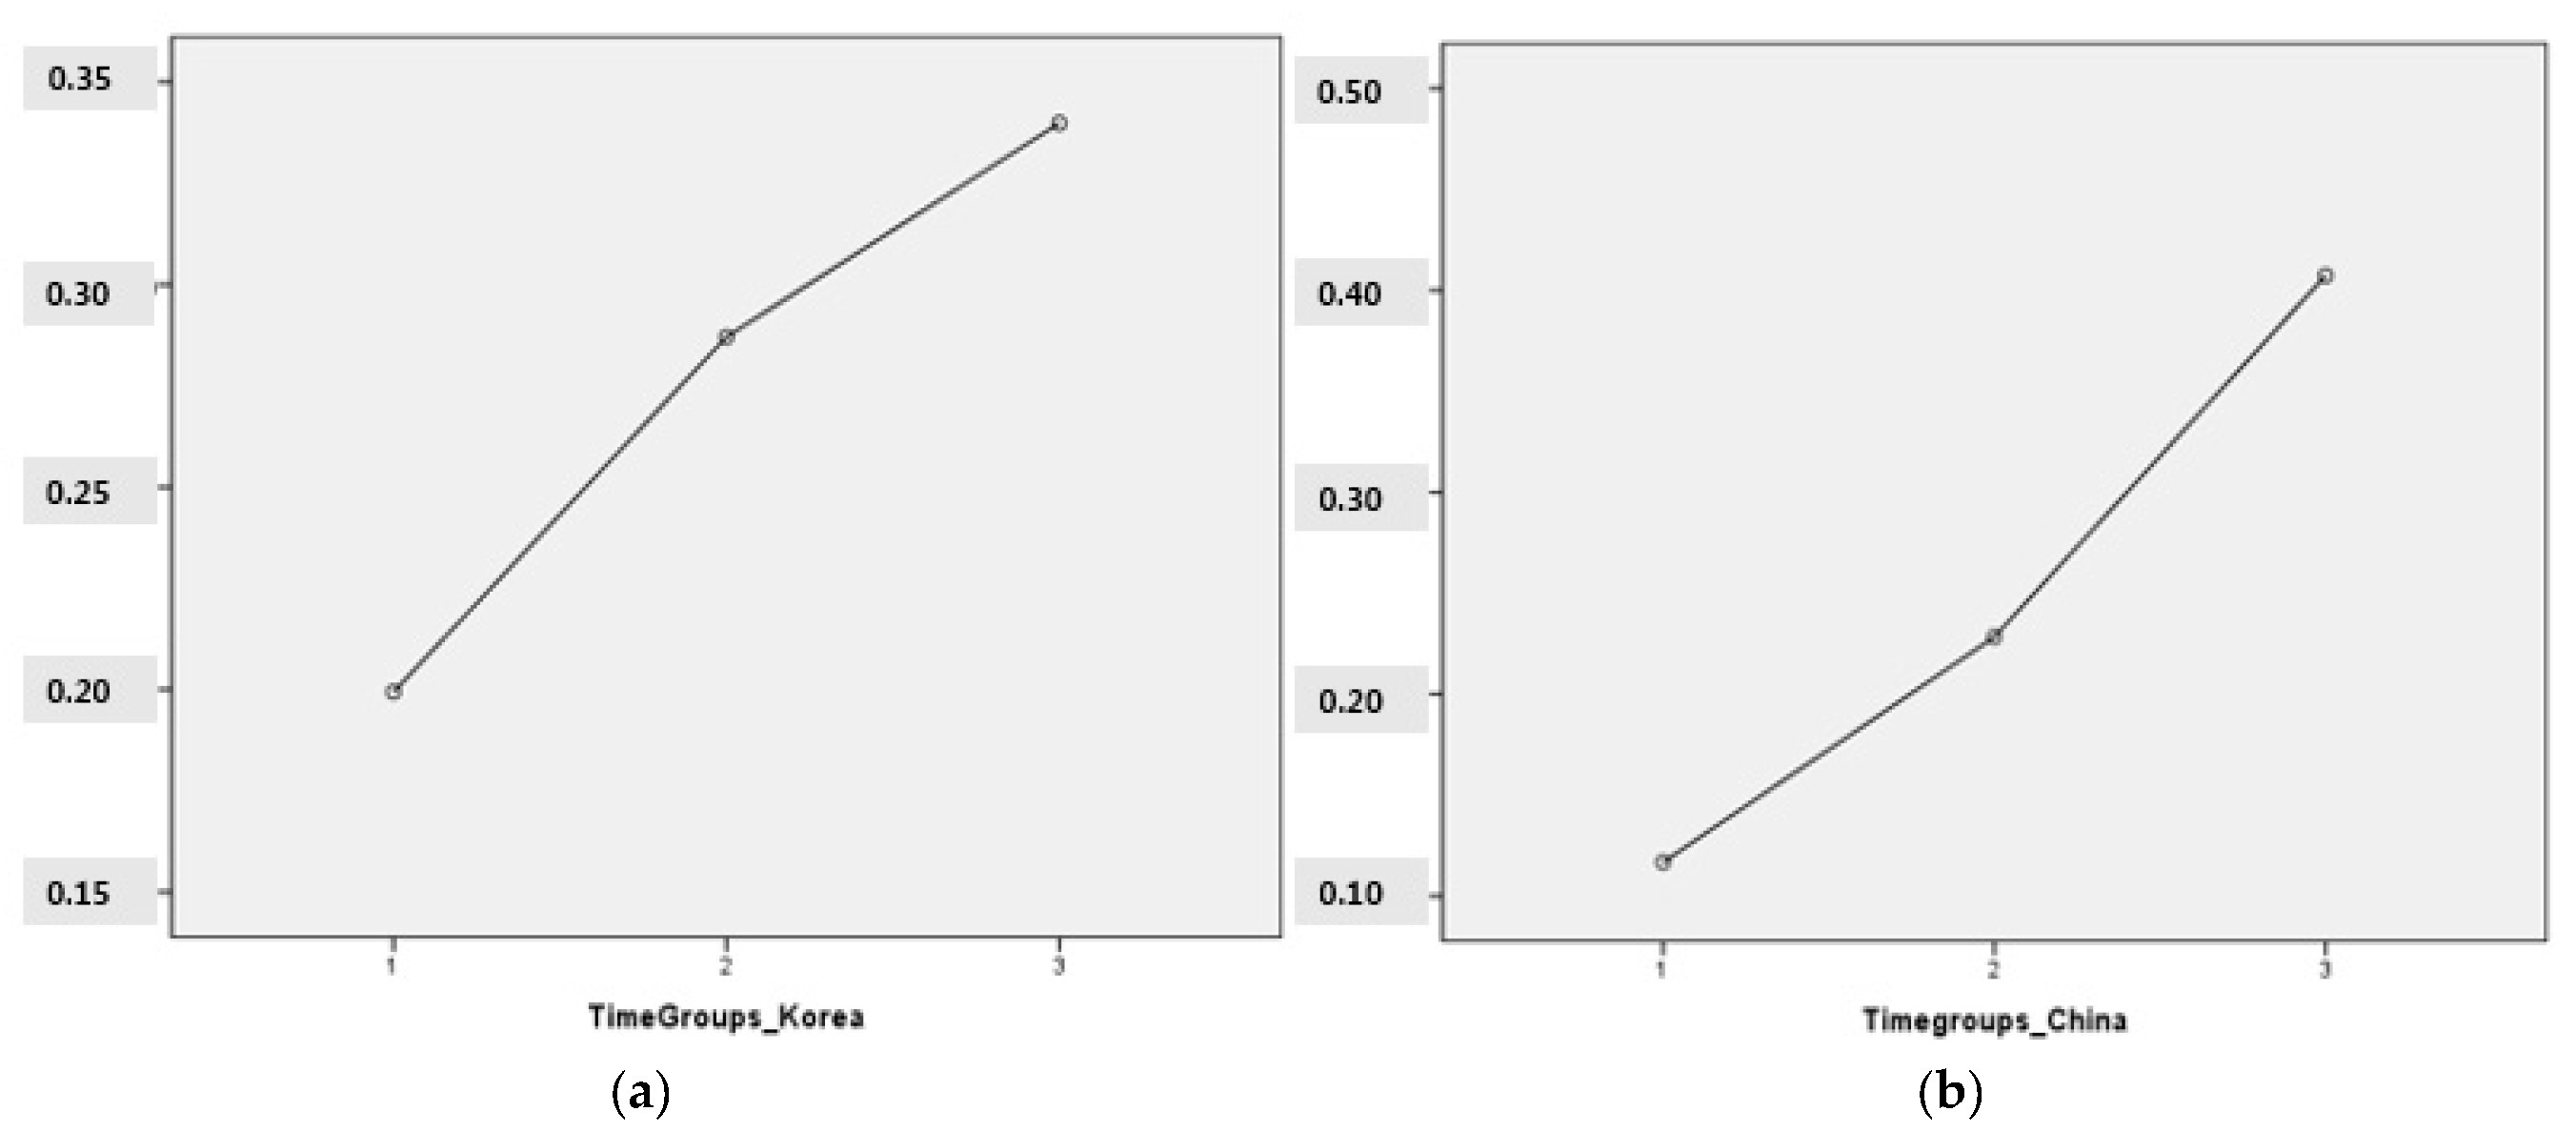
  • An ANOVA test was conducted on each country’s localization of knowledge creation (scale: percentage) in terms of time groups to examine whether the localization of knowledge creation for both Korea and China shows increasing patterns in terms of time groups. This is comparison within a country.
  • A Pairwise t test was used for comparing the mean differences of Korea, China, Japan, and the US’s localization of knowledge creation over 15 years. A pairwise t-test was performed to see whether the localization of knowledge creation of Korea and China shows converging pattern or not. This is country-to-country comparison.
For analyzing the last dimensions, basic research activities and investments, basic research expenditure and gross domestic expenditure on basic research as a percentage(GDEB) data were obtained (1998–2012) from the OECD database. Measurements were based on the Frascati Manual 2015: Guidelines for Collecting and Reporting Data on Research and Experimental Development [44].
Given the limitations in financial resources and technological capabilities, developing nations may not have the chance to invest in basic researches in their early stages of catch-up. Developing nations and their firms may conduct basic research when they accumulate certain amounts of knowledge and economic profits. From the literature review, this study posits that both Korea and basic research expenditure (absolute expenditure, gross domestic expenditure) shows increasing patterns through time groups.
  • An ANOVA test was conducted on each country’s basic research expenditure and gross domestic expenditure on basic research as percentage in terms of time groups to examine whether the basic research expenditure (scale: purchasing power parity by dollars, in thousands) and GDEB (scale: percentage) for both countries show increasing patterns in terms of time groups. This is comparison within a country.
  • A pairwise t-test was used for comparing the mean differences of Korea, China, Japan, and the US’s GDEB over 15 years. A pairwise t-test was performed to see whether the GDEB of Korea and China show a converging pattern or not. This is country-to-country comparison. This study did not conduct a pairwise t-test for basic research expenditure. This was because the absolute amount of the basic research expenditure will strongly depends on a country’s size (especially GDP and population) and country-to-country comparisons may not be suitable.
It is crucial to understand that catch-up and post catch-up literature, including this study, have not tested and suggested the appropriate degree (or quantity) of technology cycle time, self-citation ratio and basic research expenditure. Three dimensions and corresponding variables are comparable in terms of directions (increasing or decreasing; converging or diverging) and not in terms of a certain quantity. The research design and framework is summarized in Figure 1 below.

4. Statistical Analysis of the Research

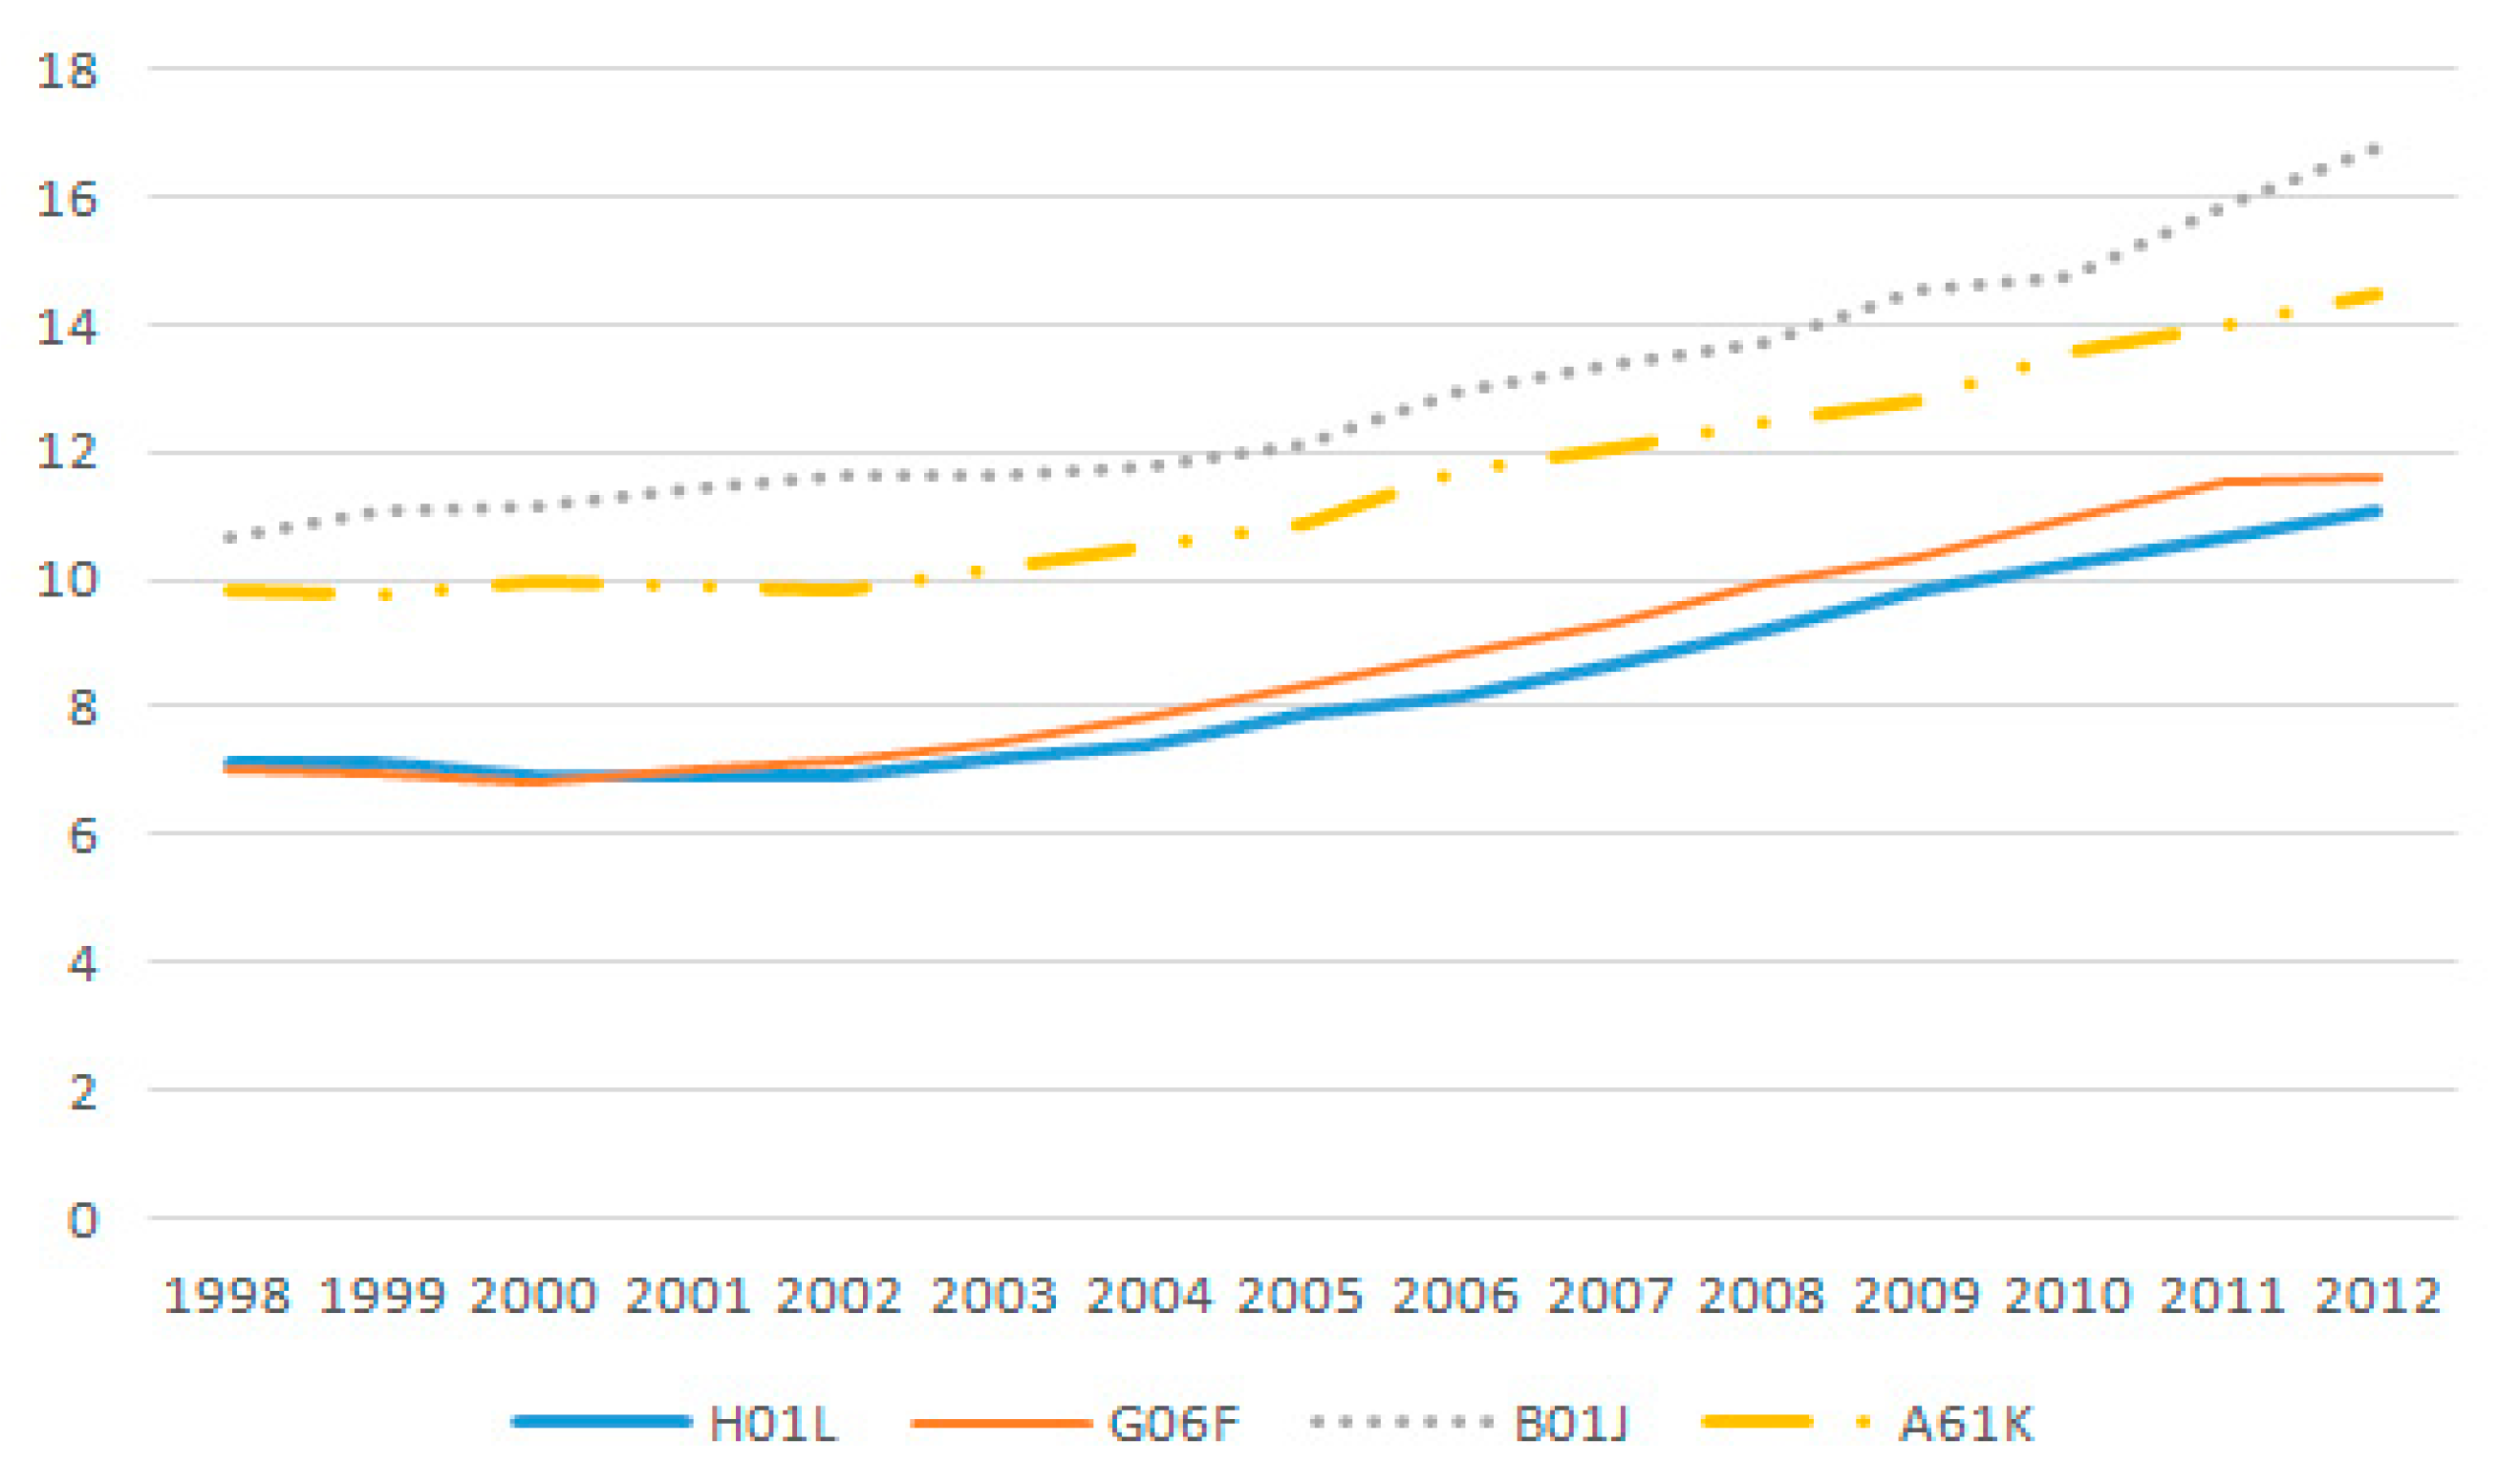
4.1. Statistical Analysis of Technology Cylce Time

This study analyzed three main technological-regimes-related variables: the technology cycle time, the country level self-citation ratio and the basic research expenditure for both Korea and China during 1998–2012. First, Table 3 shows the descriptive statistics of TCT for both Korea and China. From the descriptive statistics and the mean plots of South Korea and China, it is seen that the two countries present different paths in terms of mean technology cycle time from 1998 to 2012. First, Korea’s TCT means increased through the three time groups. (group 1: 7.54, group 2: 8.38, group 3: 10.30 respectively) However, China’s TCT means decreased from time group1 to time group2 (10.50 and 9.74 respectively) and increased from time group 2 to time group3 (9.74 and 10.53 respectively).
Figure 2 below is the mean plot of both South Korea’s and China’s TCT. It is seen that Korea’s TCT presents an increasing pattern while China’s TCT presents a V-shaped pattern. An ANOVA test was conducted for both Korea’s and China’s TCT, and the results are shown in Table 4.
F-test and following p-value (0.000 and 0.033 for Korea and China respectively) from Table 4 show that there are statistically significant differences in both Korea’s and China’s technology cycle time in terms of time groups.
To have a better understanding of the two countries’ differences in TCT requires a comparison to two other countries, Japan and the US. Both countries serve as representatives of two developed countries. Second, this study examined the proportion of the international patent classification of the US patents granted to Korea and China. This examination reveals what major technology fields caused the increase and decrease of the two countries’ TCT, and whether changes in the structure and proportion of technology fields and corresponding industries were the main causes of these TCT changes.
From Figure 3 below, it is seen that Korea’s TCT follows Japan’s and US’s increasing patterns. Lee [19] presents the cases of Korea and Taiwan, and asserts that developing countries with successful catch-up tend to show patterns of short cycle time (less barrier to entry, easy to copy or get access to technology, less reliance on tacit and complex knowledge) while advanced countries tend to show a pattern of a long cycle time (more barrier to entry, hard to copy or get access to technology, more reliance on tacit and complex knowledge). From a country with a short TCT, Korea has changed to a country with long TCT through the 2000s. Lee’s argument [1,19] about the transition from a catch-up stage (short cycle time) to a post catch-up (long cycle time) has been realized as Lee’s studies proposed.
This study also conducted pairwise t-test for four countries (Korea, China, Japan, and the US) from 1998 till 2012 and the results are shown in Table 5. First of all, Korea’s and China’s TCT mean difference was −1.513. This difference is statistically significant at alpha = 0.05 (p-value: 0.001). Moreover, it is shown that there was no statistically significant difference between Korea’s mean TCT and Japan’s mean TCT during 1998–2012 (p-value: 0.433). This results reveals that Korea’s TCT and Japan’s TCT shows rather converging patterns during these 15 years. It is also noticeable that there is a statistically significant difference between China’s mean TCT and Japan’s TCT (p-value: 0.004).
From Appendix B, this study found rather contradicting evidence for explaining what actually made such increases in technology cycle time in Korea. Korea’s case reveals that there were no major shifts in International patent class (IPC) proportions across time and Korea shows a path-dependency of a strong proportion of electronics- and ICT-related technology fields in terms of patents granted. Electronics- and ICT-related technology fields comprised a high proportions from the top ten IPC list in Korea’s case and the total percentages of both H, and G IPC classification increased across time groups. It is shown that HO1L (SEMICONDUCTOR DEVICES) take up the most proportion for all three time groups and B41J (TYPEWRITERS; SELECTIVE PRINTING MECHANISMS) were included once in time group1 but disappeared through time group 2 and time group 3 (see more detailed IPC descriptions in Appendix C).
This study found no convincing evidence to prove the predictions that a longer TCT is due to an increase in relatively long TCT industries’ proportions, such as the proportions from the bio industry and medicine industry. Instead, a longer TCT in the post catch-up stage in Korea’s case resulted from increases in electronics- and ICT-related patents’ TCT, which take up the major proportion and influence Korea’s mean TCT overall.
While Korea’s TCT shows a one-way increasing patterns, China’s TCT presented a V shaped patterns during the 15 years studied. China’s V-shaped pattern was already shown in South Korea’s case [1,19]. Until 2007 and 2008, China’s TCT decreased and increased again through time group 3. Lee’s argument [1,19] about the transition from a catch-up stage (short cycle time) to a post catch-up stage (long cycle time) has been realized in China too. The turning point in between the decreasing trends and increasing trends occurred around 2006–2008 in China.
From Appendix B, it is seen that China’s case reveals that there was a major shifts in IPC proportions from time group1 and time group 2. Traces for the electronics and ICT industries existed only for H01L (SEMICONDUCTOR DEVICES), G06F (ELECTRIC DIGITAL DATA PROCESSING), G11C (STATIC STORES) in time group1. However, in time group2, H05K (PRINTED CIRCUITS; CASINGS OR CONSTRUCTIONAL DETAILS OF ELECTRIC APPARATUS; MANUFACTURE OF ASSEMBLAGES OF ELECTRICAL COMPONENTS) and G06F, H01L took up the first, second and third highest proportions. Moreover, H and G IPCs comprised eight out of top ten listed above in time group 2.
It is noticeable that a heavy weight on electronics and ICT technology field patent publication continue through time group3. In other words, there was no major shift in IPC proportions from time group2 to time group3 and China shows path-dependency and a strong proportion of electronics and ICT in terms of patents granted, like South Korea showed it before. This study found no convincing evidence to prove the predictions that longer TCT is due to relatively long TCT industries, such as the bio industry and medicine industry, and electronics and ICT sectors take up a high portion of the US patents granted in China’s case again.
After observing technology cycle time’s change in the same industry (or technology field), these questions must be asked.
  • Can we really distinguish technology fields or industries with long TCT and short TCT in the first place?
  • Do TCTs from technology fields show converging or diverging patterns?
Appendix D shows a comparison (granted US patents from all nations) among H01L (SEMICONDUCTOR DEVICES), G06F (ELECTRIC DIGITAL DATA PROCESSING), B01J (CHEMICAL OR PHYSICAL PROCESSES) and A61K (PREPARATIONS FOR MEDICAL, DENTAL, OR TOILET PURPOSES). Both H01L and G06F listed on both Korea’s and China’s Top ten registered patent lists. A61K and B01J only appeared in China’s Top ten listed. From Appendix D, all four IPC classes’ TCT present increasing patterns and the gaps between the long TCT classes (here, A61K and B01J) and short TCT classes (here H01L, and G06F) did not converge. The IPC classes with a long TCT remained long compared to the IPC classes with a short TCT in relative sense (generalization needs to be followed in further studies).

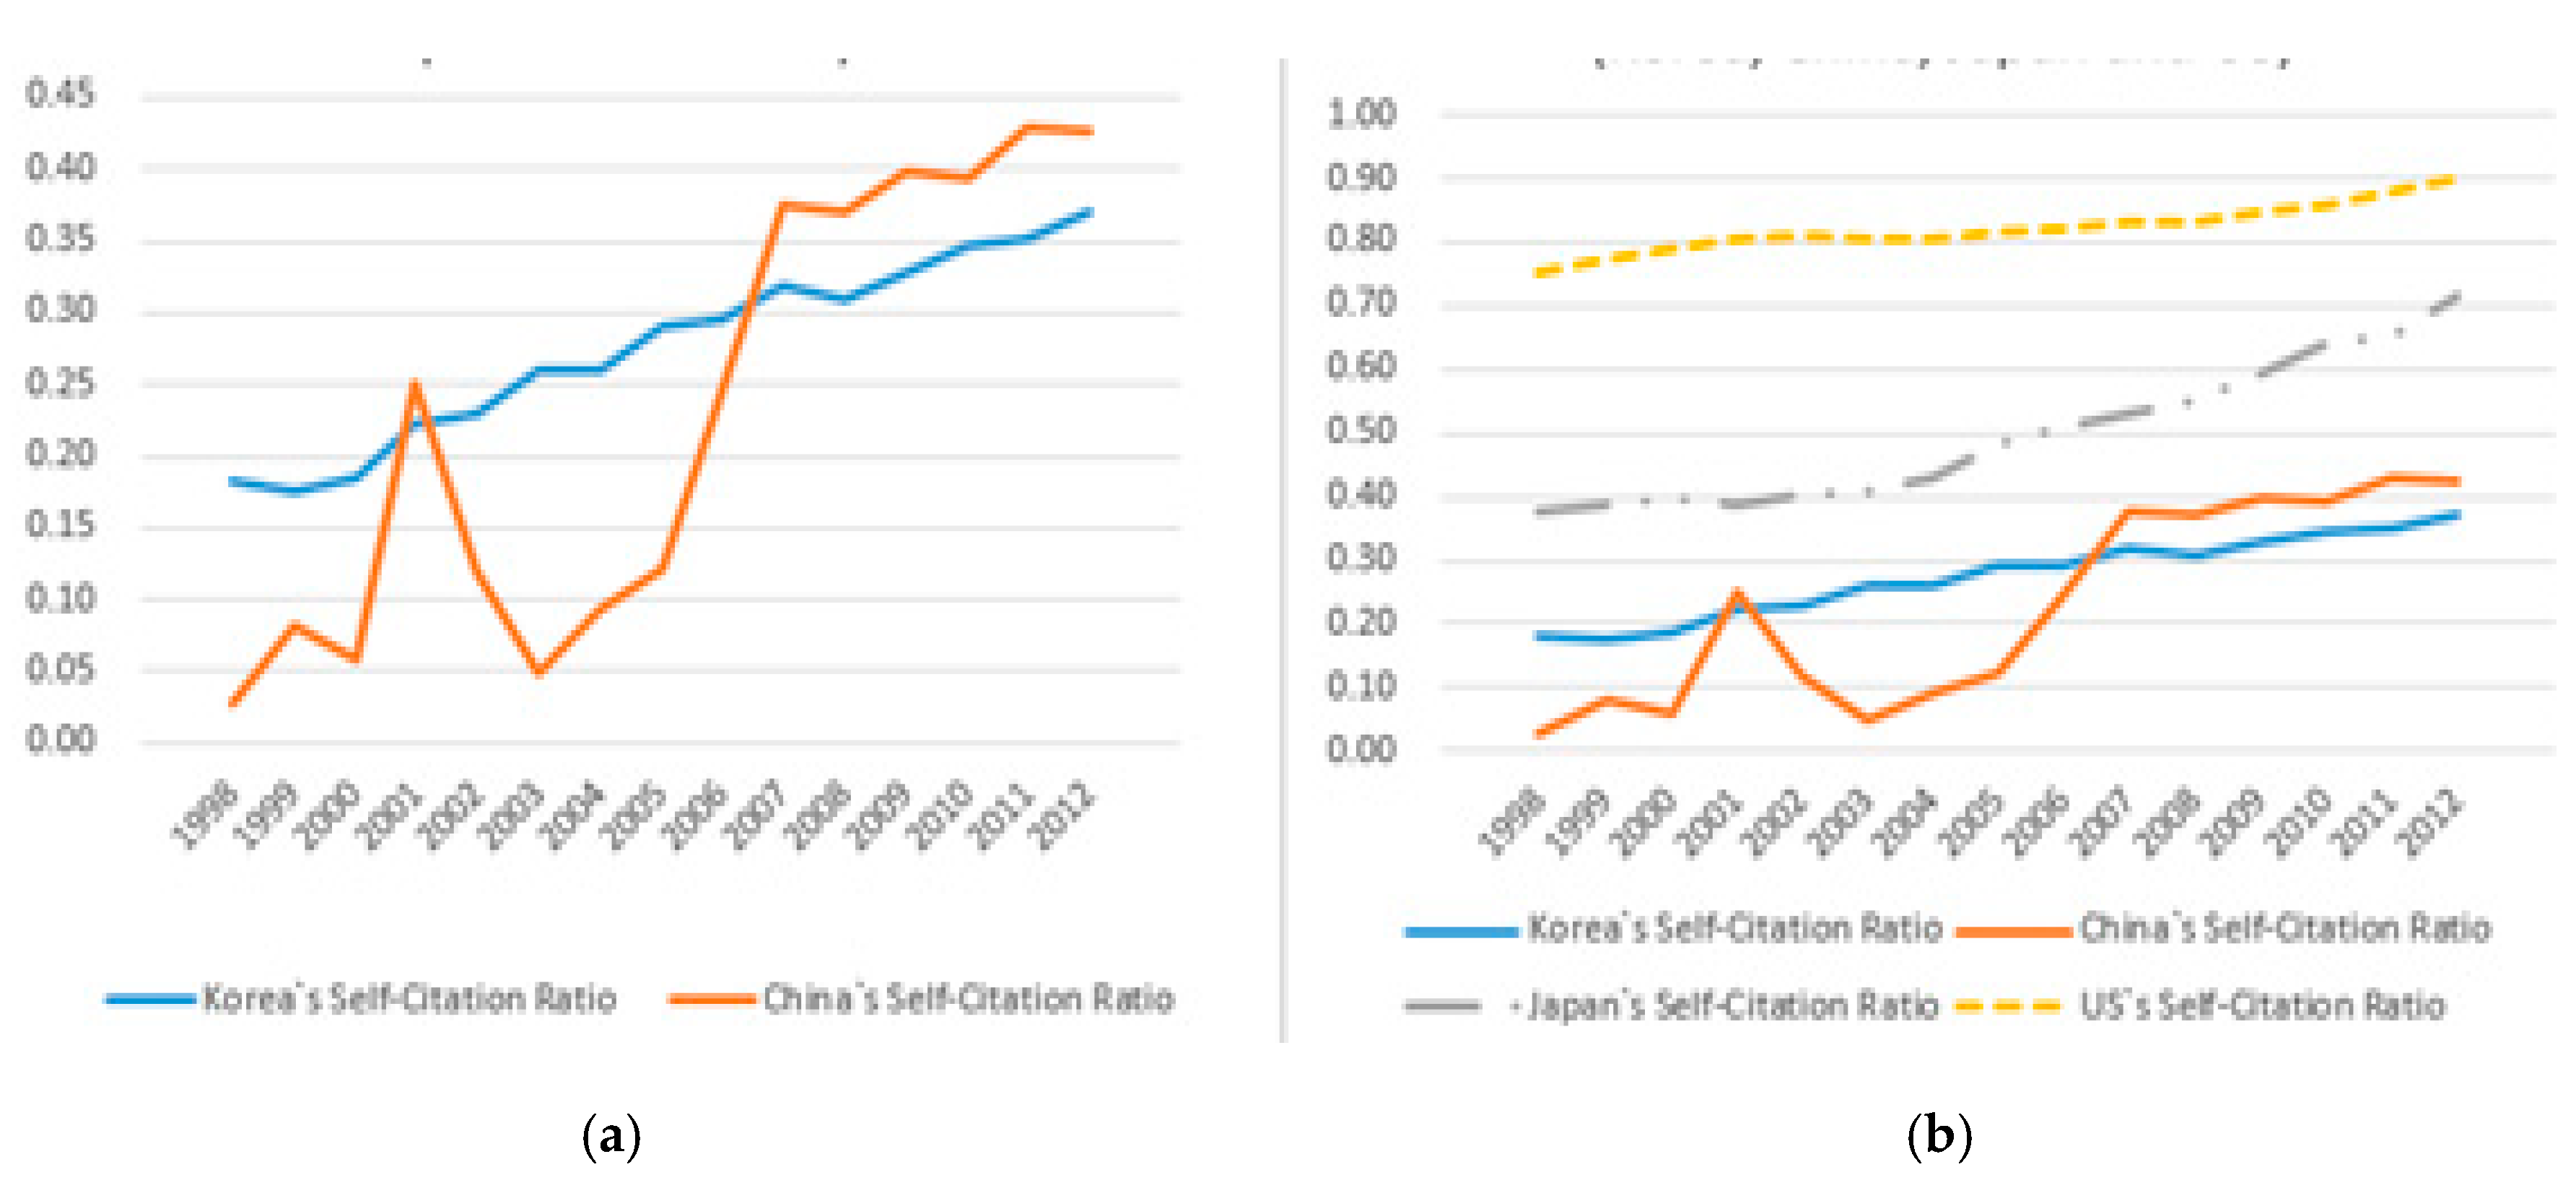
4.2. Statistical Analysis of Self-Citation Ratio at Country Level

For analyzing the second variable, localization of knowledge by country level, Table 6 below presents the descriptive statistics and Figure 4 shows the mean plots in terms of time groups. From the descriptive statistics and the mean plots of South Korea and China, it is seen that both countries present the same increasing patterns in terms of the mean of self-citation ratio across all time groups. Korea’s mean of self-citation ratio increased from 19.9% in time group1, 29.7% for time group 2 and 34% for time group 3 respectively. China’s mean of self-citation ratio increased from 11.7% in time group1, 22.8% for time group 2 and 40.7% for time group 3 respectively.
An ANOVA test was conducted for both Korea and China’s self-citation ratio and the results are shown as Table 7 below. For both South Korea and China, the F-test and following p-value (0.000 and 0.000 for Korea and China, respectively) show that there are statistically significant differences in both Korea’s and China’s self-citation ratio in terms of time groups, as presented in Table 7.
To compare the self-citation ratios among different countries, Japan and the US were added again in Figure 5. It is seen that both Korea and China’s self-citation increased during the 15 years and reached Japan’s 1998’s self-citation ratio (37.8%).
To see whether the two countries’ self-citation ratio present converging patterns, a pairwise t-test was conducted. The results are shown in Table 8 below. The test found no statistically significant difference (p-value: 0.124) in Korea’s and China’s self-citation ratio in terms of means at alpha = 0.05 level. Therefore, both countries show converging patterns in terms of self-citation ratio. It is also noticeable that mean differences between Korea and Japan, Korea and the US, and China and Japan are statistically significant and do not show converging patterns.

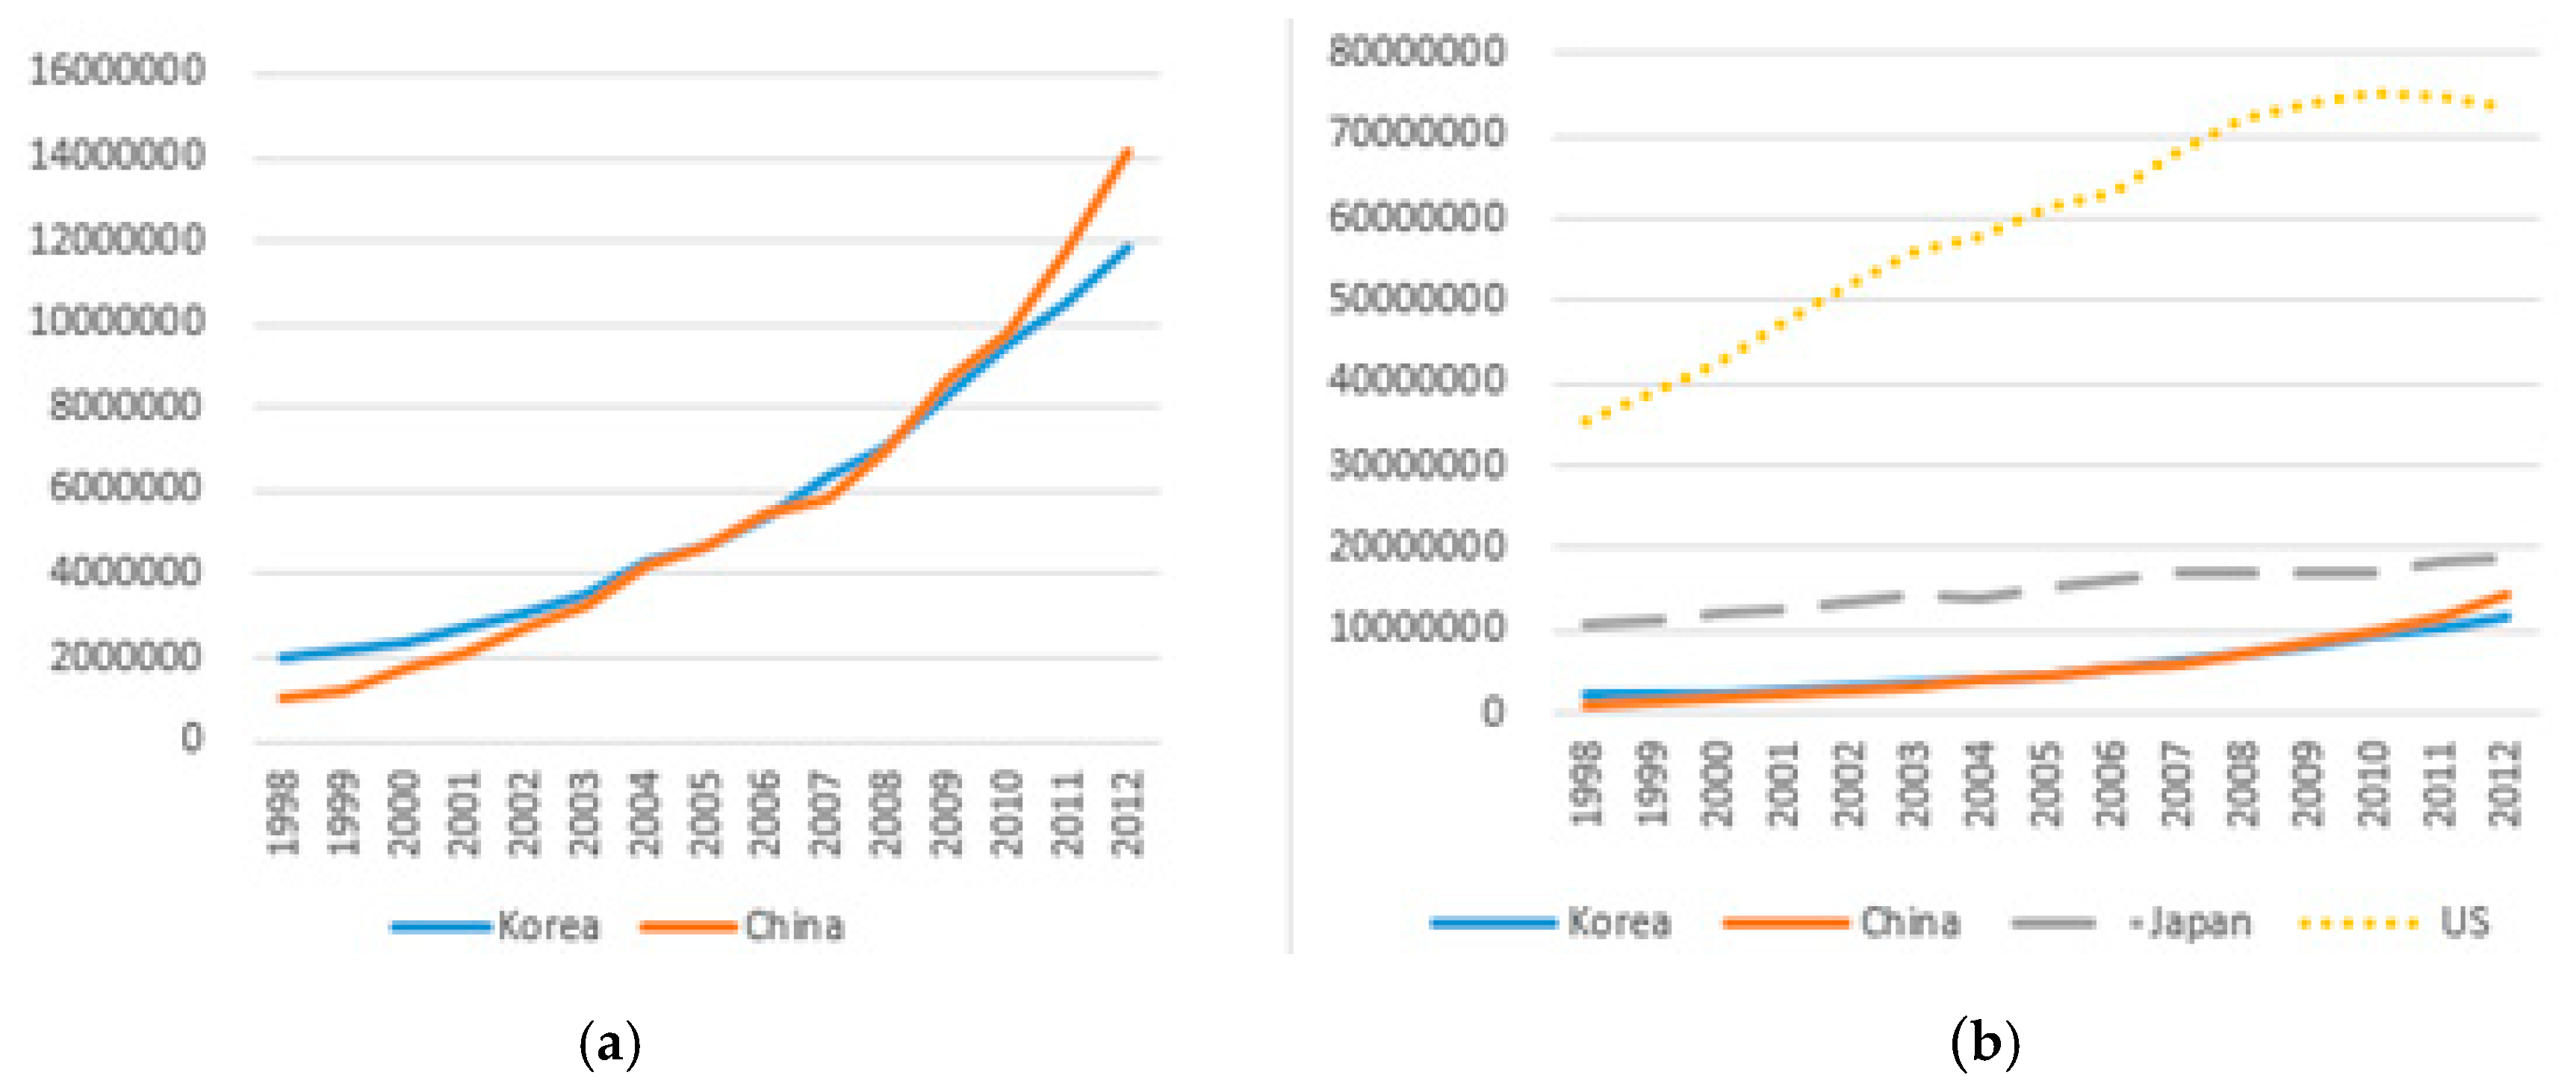
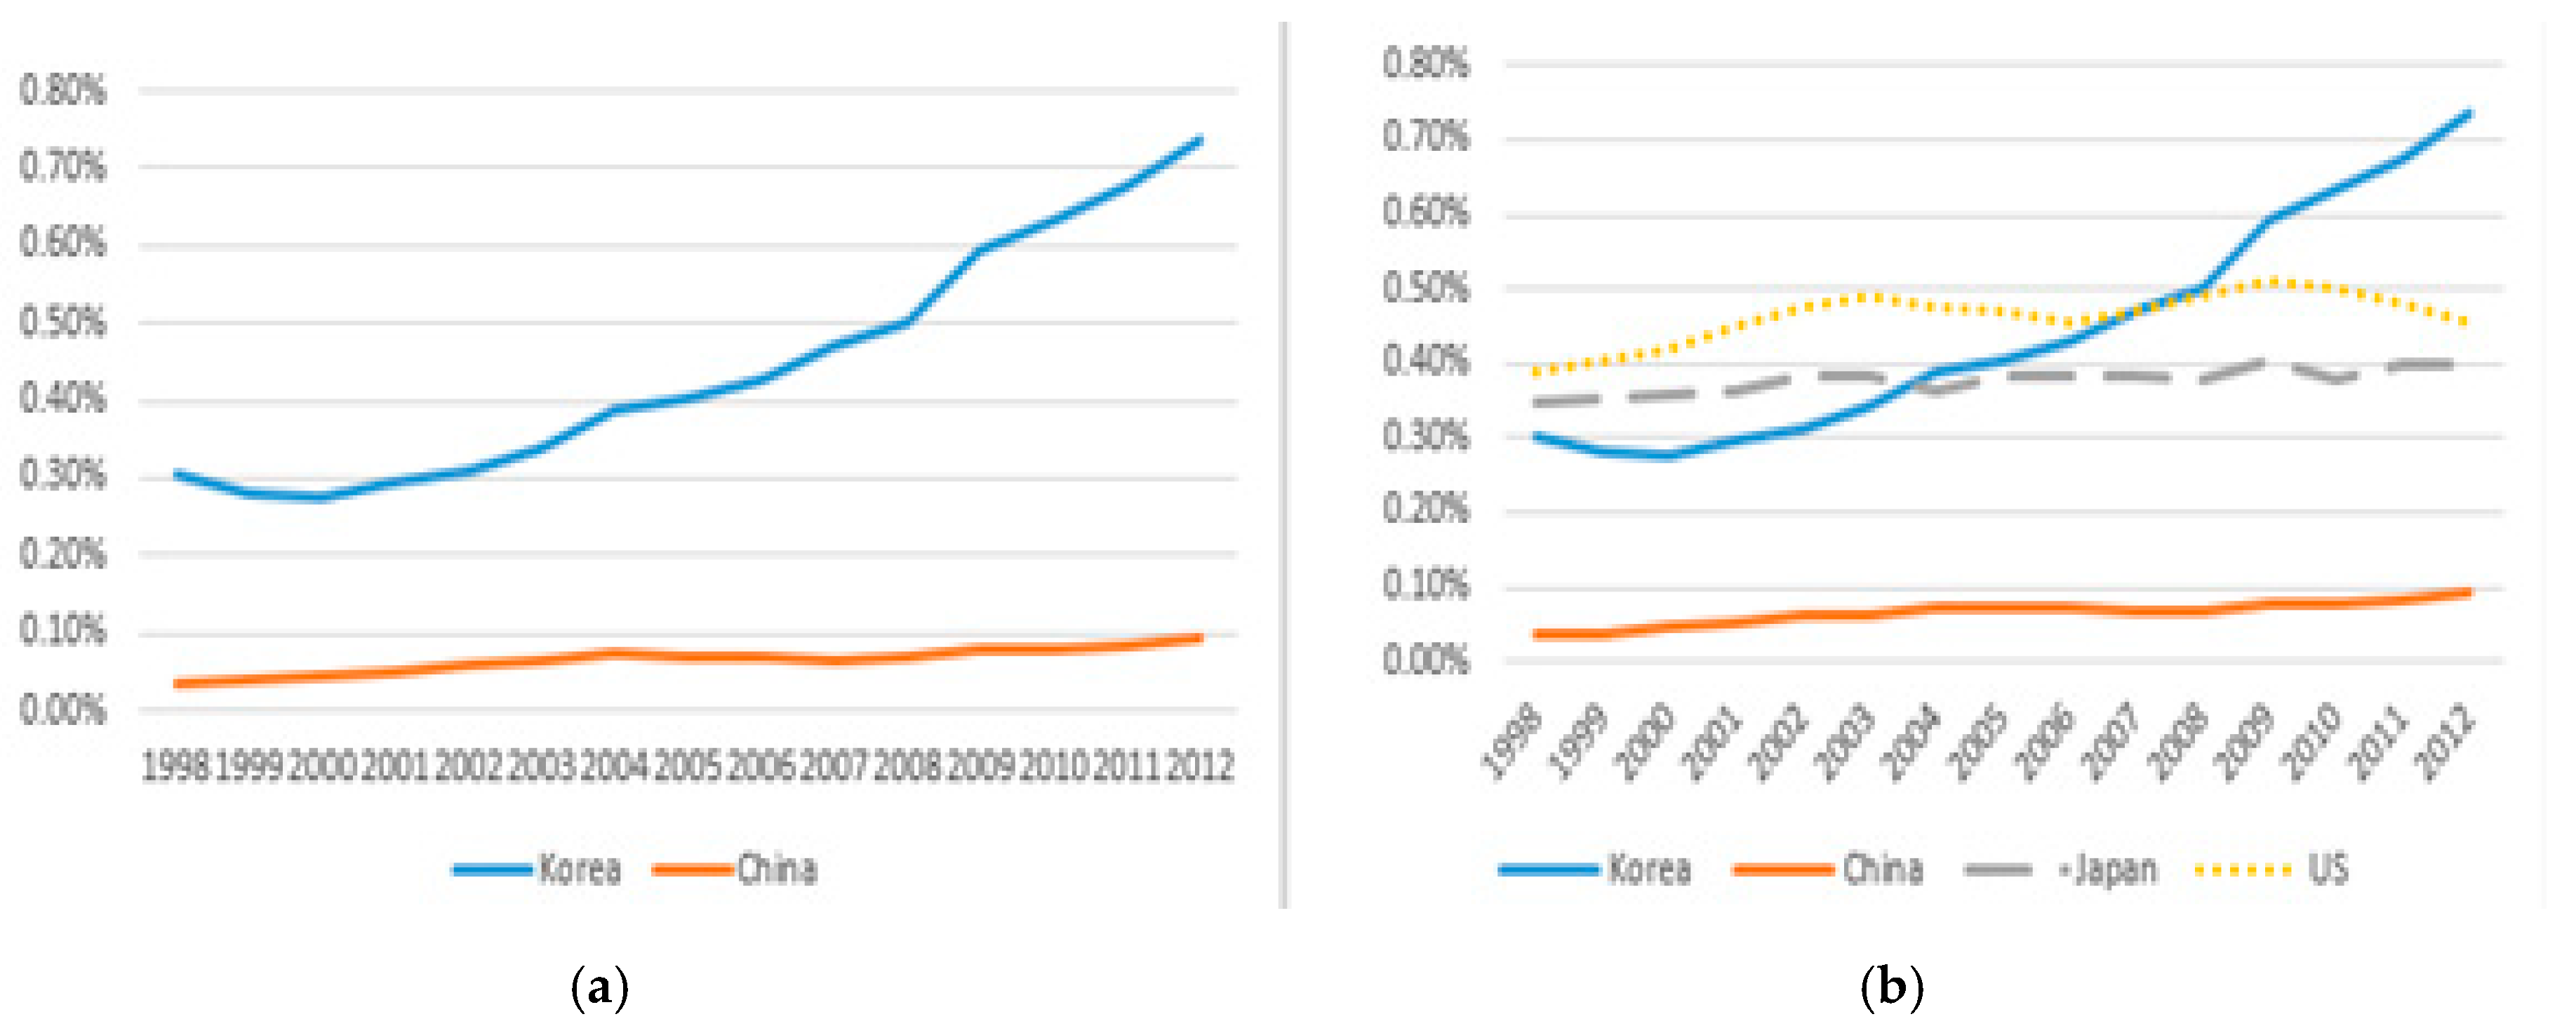
4.3. Statistical Analysis of Basic Research Expenditure and GDEB at Country Level

For analyzing the last dimensions, basic research activities, Appendix E shows the statistics of basic research expenditures (unit: thousands, purchasing price parity by dollars) and gross domestic expenditure on basic research as percentages (GDEB) of four countries. To compare the basic expenditures and gross domestic expenditures on basic research among the different countries, Japan and the US were added again. It was seen that both Korea and China’s basic research expenditure and gross domestic expenditure on basic research percentage showed increasing patterns through the time groups.
It is also noticeable that China’s basic research expenditure exceeded that of Korea from 2009 in absolute terms. However, in terms of gross domestic expenditure percentage on basic research, China has not reached Korea’s lowest level (0.3% in 1998) yet. From Figure 6 below, it is seen that Korea and China are catching up Japan’s basic research expenditure in absolute terms. However, Figure 7 below indicates that Korea exceeded Japan’s, and the US’s gross domestic expenditure on basic research as percentages in 2004 and 2008, respectively.
An ANOVA test of basic research expenditure and gross domestic expenditure on basic research was conducted for both Korea and China. From Table 9 and Table 10 below, the F-test and following p-value (0.000 and 0.000, respectively) show that there are statistically significant differences in both Korea’s and China’s basic research expenditure and gross domestic expenditure on basic research in terms of time groups.
To see whether the four countries’ gross domestic expenditure on basic research presented converging patterns, a pairwise t-test was conducted. The results are shown in Table 11 below. The test result show that the mean difference between Korea’s GDEB and China’s GDEB is statistically significant (p-Value: 0.000) at alpha = 0.05 level. Therefore, both countries do not show converging patterns in terms of gross domestic expenditure on basic research. It is also noticeable that the mean difference between Korea and US is not statistically significant (p-Value: 0.592).
In Section 3, this study mentioned that researchers have not conduct pairwise t-test for basic research expenditure. This is because the absolute amount of the basic research expenditure will strongly depends on country’s size (especially GDP and population) and country-to-country comparison may not be suitable.

5. Discussion of the Research

By testing three dimensions in two countries, this study examined the conformity and generality of the major discourse about catch-up and post catch-up transition empirically. Table 12 below summarizes the test results. First, the two countries presented different paths in terms of mean technology cycle time from 1998 to 2012. While Korea’s TCT means showed increasing patterns during three time groups, China’s TCT means decreased from time group1 to time group 2 and increased from time group 2 to time group 3. From a country with a short TCT, Korea has changed into a country with long TCT through the 2000s. China’s case presented the transition from a catch-up stage with a short cycle time (from time group 1 to time group 2) to post catch-up stage (from time group2 to time group3) with long cycle time. These empirical findings from the research matched with arguments about TCT, distinguishing catch-up and post catch-up stages.
However, this study found contradicting evidence from Lee’s study [1] in explaining what actually drove increases in mean TCT in Korea and China. This study found no evidence to prove the predictions and arguments that longer TCT is due to increases in registered patents from industries with a long TCT, such as the bio industry and medicine industry in both Korea’s and China’s case. Instead, this study found that weights on electronics and ICT increased through time groups and their TCT got lengthened through the time groups for both Korea and China.
Korean scholars with a dominant post catch-up frame assert the necessity and importance of the increase in self-citation ratio and basic research to reach the post catch-up stage. This study found the two countries’ concurrent and parallel patterns that support the argument for both self-citation ratio and basic research expenditures. However, it is noticeable that China’s gross domestic expenditure on basic research has not even reached to Korea’s lowest level and does not show a converging pattern.
Moreover, IPC composition shows path dependency and a deepening tendency after both countries get into post catch-up. Capital-intensive industry such as semiconductor sector remained first in IPC composition in Korea and in the top three in China. Growth from other types of post catch-up types such as the architecture innovation type or the third type of post catch-up (commercializing original technologies or basic research result, e.g., biotechnologies or the pharmaceutical sector) can coexist within a dominant deepening path dependency. However, empirics from research do not support or reveal growth (number of patent granted) of such types.
These research results suggest that getting into a short cycle time sector is beneficiary for developing countries in early stages. Developing nations may exert their efforts to increase knowledge localization and build their technology capabilities by conducting basic research. However, direct application or duplicating deepening tendency led by conglomerates or large firms from South Korea and China to other developing countries may be challenging and also unrealistic in many cases. More empirical evidence from various post catch-up innovation activities must be verified to draw a balanced and generalized development strategy.
This study has certain methodological limitations. Using patent data to analyze technology cycle time and self-citation ratio has limitations. It is obvious that patents do not cover all innovation activities of firms. Many studies including this one only treat the quantitative dimensions of patents, and do not handle qualitative dimensions and tacit dimensions of the innovation activities. Moreover, catch-up and post catch-up literature including this study, have not suggested the appropriate degree (or quantity) of TCT, self-citation ratio and basic research expenditure for developing countries at each stage. The three dimensions and corresponding variables were compared in terms of direction (increasing or decreasing; converging or diverging) and not in terms of a certain quantity in this research. Since this study takes inductive position and only considered two countries, generalization must be followed to verify whether commonalities and conformities of Korea and China can be reproduced in further studies.
Acknowledging the obvious limitation stated above, this study suggests following further research.
  • A study that discovers the dynamic natures between the three dimensions of the research and other social factors
  • A study that links sectoral innovation system dynamics with national landscape’s change during catch-up to post catch-up transition
  • A study that illuminates the conflict and politics involved in the process of transition from catch-up to post catch-up transition

6. Conclusions

East Asian countries such as Korea, Taiwan and now China have paved their own ways but share many commonalities. A reflexive study of understanding transition from catch-up to post catch-up was conducted with the technology cycle time, self-citation ratio at country level, and basic research expenditure (absolute term and GDEB %) for Korea and China.
From developing nation’s points of view, focusing and entering the short cycle time sector (transitioning to long cycle sector in post catch-up stage later) may be the first priority. After entering the short cycle time sector, developing nations may make efforts to increase the degree of knowledge localization and conduct basic research. Though each developing country has different technological capabilities and faces particular socio-economic conditions, policy-makers of developing countries need learn from South Korea’s and China’s transition from catch-up to post catch-up cases, and make their own paths ultimately.

Author Contributions

Conceptualization, S.C.; Data curation, S.C. and J.L.; Formal analysis, S.C. and H.-W.P.; Funding acquisition, H.-W.P.; Methodology, S.C. and J.L.; Resources, S.C. and H.-W.P.; Software, S.C. and J.L.; Supervision, H.-W.P.; Writing—original draft, S.C.; Writing—review & editing, S.C. and J.L. and H.-W.P. All authors have read and agreed to the published version of the manuscript.

Funding

This research received no external funding.

Conflicts of Interest

The authors declare no conflict of interest.

Appendix A

Table A1. Consensus vs. East Asian Consensus.
A. Elements of the Washington ConsensusSouth KoreaTaiwanChina
Macroeconomic Stabilities
1. Fiscal DisciplineYes, generallyYesYes, generally
2. Redirections of publish expenditure to
health, education, infrastructure

Yes

Yes

Yes, generally
3. Tax reform, broadening the tax baseYesYesYes, since 1994
4. Unified & competitive exchange ratesYesYes Yes, since 1994
5. Secure property rightsYesYes, GenerallyMixed
Privatization, Deregulation, Liberalization
6. DeregulationLimitedLimitedLimited
7. Trade liberalizationLimited until 80sLimited until 80sLimited till 2002
8. PrivatizationNo from 50s~60sNo from 50s~60sPartly no
9. Elimination of barriers to FDIHeavily restrictedState controlRegulated
10. Financial liberalizationLimited till 90sLimited till 80sLimited till 80s
B. Elements Missing from the WC
11. Export promotion & Import TariffsYes, very strong YesYes, very strong
12. Technology policy for upgrading
(Public, in house R&D, joint ventures)
Yes, since 70sYes, since 80sGiven priority
since mid-90s
13. Higher education revolution
(Doubling of number of college students)
Yes, since 1980sYes, generallyYes, since 90s
Source: Part A for Korea and Taiwan is from [17]; China and part B are from [18].

Appendix B

Table A2. Korea’s Top 10 IPC by time groups.
1998–20022003–20072008–2012
IPCTCTNPercentIPCTCTNPercentIPCTCTNPercent
H01L6.37262717.58%H01L7.08293115.69%H01L9.33366815.21%
G11C5.7411517.70%G02F7.6215478.28%G11C8.2617307.17%
H04N6.899356.26%G11C6.7613207.07%G06F10.4815686.50%
G11B7.518665.80%G06F8.239405.03%G02F10.0513955.78%
G06F7.018325.57%H04B7.928484.54%H04B9.7212315.03%
G02F6.355953.98%G11B8.518304.44%G09G10.169313.86%
H04B6.433532.36%H04N8.626073.25%H04N11.028393.48%
H01J8.623382.26%G02B7.925382.88%H04L9.847723.20%
G02B7.293162.11%H01J8.484212.25%G11B10.276182.56%
B41J8.132641.77%H04L7.713912.09%H04W9.965762.39%
Total7.5414942100%Total8.3818678100%Total10.3024118100%
Table A3. China’s Top 10 IPC by time groups.
1998–20022003–20072008–2012
IPCTCTNPercentIPCTCTNPercentIPCTCTNPercent
B01J13.263812.30%H05K6.82908.00%H05K8.0852311.46%
H01L7.00216.80%G06F7.88585.16%G06F9.754469.77%
A61K8.71144.53%H01L7.24585.16%H01L10.062064.51%
B01D12.30103.24%G11B7.98544.80%H01R9.301844.03%
C08F12.70103.24%B01J13.63413.64%H04L9.991773.88%
A47J13.6382.59%H01R9.39312.76%F21V7.601593.48%
C07D11.5082.59%H04B8.67302.67%G11B9.421182.59%
G06F8.1382.59%A61K11.52292.58%H04B10.281062.32%
G11C6.8672.27%G02B8.73262.31%H04W10.14972.13%
A01N10.6051.62%G01N10.90201.78%H04J10.05831.82%
Total10.50309100%Total9.7491125100%Total10.534563100%

Appendix C

Table A4. Korea’s and China’s IPC classification description.
IPCDescription From WIPO
ClassSubclass
A HUMAN NECESSITIES
A01NPRESERVATION OF BODIES OF HUMANS OR ANIMALS OR PLANTS OR PARTS THEREO; BIOCIDES; PEST REPELLANTS OR ATTRACTANTS; PLANT GROWTH REGULATORS
A47JKITCHEN EQUIPMENT; COFFEE MILLS; SPICE MILLS; APPARATUS FOR MAKING BEVERAGES
A61KPREPARATIONS FOR MEDICAL, DENTAL, OR TOILET PURPOSES
B PERFORMING OPERATIONS; TRANSPORTING
B01DSEPARATION. This subclass covers evaporation, distillation, crystallisation, filtration, dust precipitation, gas cleaning, absorption, adsorption;
B01JCHEMICAL OR PHYSICAL PROCESSES, e.g., CATALYSIS, COLLOID CHEMISTRY; THEIR RELEVANT APPARATUS
B41JTYPEWRITERS; SELECTIVE PRINTING MECHANISMS, i.e., MECHANISMS PRINTING OTHERWISE THAN FROM A FORME; CORRECTION OF TYPOGRAPHICAL ERRORS
C CHEMISTRY; METALLURGY
C07DHETEROCYCLIC COMPOUNDS
C08FMACROMOLECULAR COMPOUNDS OBTAINED BY REACTIONS ONLY INVOLVING CARBON-TO-CARBON UNSATURATED BONDS
F MECHANICAL ENGINEERING; LIGHTING; HEATING; WEAPONS; BLASTING
F21VFUNCTIONAL FEATURES OR DETAILS OF LIGHTING DEVICES OR SYSTEMS THEREOF; STRUCTURAL COMBINATIONS OF LIGHTING DEVICES WITH OTHER ARTICLES, NOT OTHERWISE PROVIDED FOR
G PHYSICS
G01NINVESTIGATING OR ANALYSING MATERIALS BY DETERMINING THEIR CHEMICAL OR PHYSICAL PROPERTIES
G02BOPTICAL ELEMENTS, SYSTEMS, OR APPARATUS
G02FDEVICES OR ARRANGEMENTS, THE OPTICAL OPERATION OF WHICH IS MODIFIED BY CHANGING THE OPTICAL PROPERTIES OF THE MEDIUM OF THE DEVICES OR ARRANGEMENTS FOR THE CONTROL OF THE INTENSITY, COLOUR, PHASE, POLARISATION OR DIRECTION OF LIGHT,
G06FELECTRIC DIGITAL DATA PROCESSING (computer systems based on specific computational models G06N)
G09GARRANGEMENTS OR CIRCUITS FOR CONTROL OF INDICATING DEVICES USING STATIC MEANS TO PRESENT VARIABLE INFORMATION.
G11BINFORMATION STORAGE BASED ON RELATIVE MOVEMENT BETWEEN RECORD CARRIER AND TRANSDUCER
G11CSTATIC STORES (information storage based on relative movement between record carrier and transducer G11B; semiconductor devices for storage H01L)
H ELECTRICITY
H01JELECTRIC DISCHARGE TUBES OR DISCHARGE LAMPS.
H01LSEMICONDUCTOR DEVICES; ELECTRIC SOLID STATE DEVICES NOT OTHERWISE PROVIDED FOR
H01RLECTRICALLY-CONDUCTIVE CONNECTIONS; STRUCTURAL ASSOCIATIONS OF A PLURALITY OF MUTUALLY-INSULATED ELECTRICAL CONNECTING ELEMENTS; COUPLING DEVICES; CURRENT COLLECTORS
H04BELECTRIC COMMUNICATION TECHNIQUE.
H04JMULTIPLEX COMMUNICATION (peculiar to transmission of digital information H04L 5/00; systems for the simultaneous or sequential transmission of more than one television signal H04N 7/08; in exchanges H04Q 11/00)
H04LTRANSMISSION OF DIGITAL INFORMATION, e.g., TELEGRAPHIC COMMUNICATION.
H04NPICTORIAL COMMUNICATION, e.g., TELEVISION
H04WWIRELESS COMMUNICATION NETWORKS
H05KPRINTED CIRCUITS; CASINGS OR CONSTRUCTIONAL DETAILS OF ELECTRIC APPARATUS; MANUFACTURE OF ASSEMBLAGES OF ELECTRICAL COMPONENTS

Appendix D

Figure A1. TCT comparison among H01L, G06F, B01J, A61K.
Sustainability 12 04751 g0a1

Appendix E

Table A5. Basic Research Expenditure and Gross Domestic Expenditure on Basic research comparison Korea, China, Japan and the US.
Basic Research Expenditure (Thousands, PPP by $)Gross Domestic Expenditure on Basic Research as %
YearKoreaChinaJapanUSYearKoreaChinaJapanUS
19982,043,9661,037,58610,949,65835,334,00019980.30%0.03%0.35%0.39%
19992,153,2551,249,43811,365,38838,876,00019990.28%0.04%0.35%0.40%
20002,336,8131,725,99412,244,78942,752,00020000.27%0.05%0.36%0.42%
20012,674,1742,058,26912,647,91547,727,00020010.29%0.05%0.36%0.45%
20023,083,0372,757,28113,678,36551,902,00020020.31%0.06%0.38%0.47%
20033,482,3983,255,59714,176,58056,089,00020030.34%0.06%0.38%0.49%
20044,281,5324,180,85414,073,18157,73100020040.39%0.07%0.36%0.47%
20054,698,6244,650,56615,443,21061,321,00020050.40%0.07%0.38%0.47%
20065,365,5975,475,10816,151,77362,996,00020060.43%0.07%0.38%0.46%
20076,386,2005,841,93417,035,88068,047,00020070.47%0.06%0.39%0.47%
20087,047,1746,989,76516,93,20772,105,00020080.50%0.07%0.38%0.49%
20098,304,3388,632,06717,113,34373,772,00020090.59%0.08%0.40%0.51%
20109,506,6769,808,65517,057,04775,070,00020100.63%0.08%0.38%0.50%
20111,0546,87811,747,54218,192,48174,752,00020110.68%0.08%0.40%0.48%
201211,876,78414,152,61918,978,06373,284,00020120.74%0.09%0.40%0.45%

References

  1. Lee, K.; Im, B.; Han, J. The National innovation system (NIS) for the catch-up and post-catch-up stages in South Korea. In The Korean Government and Public Policies in a Development Nexus; Springer: Cham, Switzerland, 2017; pp. 69–82. [Google Scholar]
  2. Gereffi, G. Global value chains in a post-Washington Consensus world. Rev. Int. Political Econ. 2014, 21, 9–37. [Google Scholar] [CrossRef]
  3. Gereffi, G.; Humphrey, J.; Sturgeon, T. The governance of global value chains. Rev. Int. Political Econ. 2005, 12, 78–104. [Google Scholar] [CrossRef]
  4. Humphrey, J.; Schmitz, H. How does insertion in global value chains affect upgrading in industrial clusters? Reg. Stud. 2002, 36, 1017–1027. [Google Scholar] [CrossRef]
  5. Giuliani, E.; Pietrobelli, C.; Rabellotti, R. Upgrading in global value chains: Lessons from Latin American clusters. World Dev. 2005, 33, 549–573. [Google Scholar] [CrossRef]
  6. Lundvall, B.A. The Learning Economy and the Economics of Hope; Anthem Press: London, UK, 2016; pp. 351–373. [Google Scholar]
  7. Nelson, R.R. National Innovation Systems: A comparative Analysis; Oxford University Press: New York, NY, USA, 1993. [Google Scholar]
  8. Lee, K.; Szapiro, M.; Mao, Z. From global value chains (GVC) to innovation systems for local value chains and knowledge creation. Eur. J. Dev. Res. 2018, 30, 424–441. [Google Scholar] [CrossRef]
  9. Park, J.; Lee, D.; Lee, K. The Determinants of foreign direct investment in R&D: Different inducement effects of private and public R&D in developed and developing host countries. Singap. Econ. Rev. 2020, 1–29. Available online: https://doi.org/10.1142/S0217590819500759 (accessed on 6 June 2020).
  10. Lee, K.; Wong, C.Y.; Intarakumnerd, P.; Limapornvanich, C. Is the fourth industrial revolution a window of opportunity for upgrading or reinforcing the middle-income trap? Asian model of development in Southeast Asia. J. Econ. Policy Reform 2019, 1–18. Available online: https://doi.org/10.1080/17487870.2019.1565411 (accessed on 6 June 2020). [CrossRef]
  11. Lee, K.; Lee, J. The National Innovation System (NIS) and readiness for the fourth industrial revolution: South Korea compared with four European countries. In Transforming Industrial Policy for the Digital Age; Edward Elgar Publishing: Cheltenham, UK, 2019; pp. 68–81. [Google Scholar]
  12. Fu, X.; Pietrobelli, C.; Soete, L. The role of foreign technology and indigenous innovation in the emerging economies: Technological change and catching-up. World Dev. 2011, 39, 1204–1212. [Google Scholar] [CrossRef] [Green Version]
  13. Fagerberg, J. Technology and international differences in growth rates. J. Econ. Lit. 1994, 32, 1147–1175. [Google Scholar]
  14. Fagerberg, J. The Changing Global Economic Landscape: The factors that Matter. In The Shape of the Division of Labour: Nations, Industries and Households; Edward Elgar Publishing: Cheltenham, UK, 2010; pp. 6–31. [Google Scholar]
  15. Lee, K.; Jee, M.; Eun, J.H. Assessing China’s economic catch-up at the firm level and beyond: Washington Consensus, East Asian Consensus and the Beijing model. Ind. Innov. 2011, 18, 487–507. [Google Scholar] [CrossRef]
  16. Park, J.; Ryu, D.; Lee, K. What determines the economic size of a nation in the world: Determinants of a nation’s share in world GDP vs. per capita GDP. Struct. Chang. Econ. Dyn. 2019, 51, 203–214. [Google Scholar] [CrossRef]
  17. Rodrik, D. Understanding economic policy reform. J. Econ. Lit. 1996, 34, 9–41. [Google Scholar]
  18. Lee, K. The Washington Consensus and East Asian sequencing: Understanding reform in East and South Asia. In Understanding Market Reform; Palgrave Macmillan: London, UK, 2006; pp. 99–140. [Google Scholar]
  19. Gerschenkron, A. Economic Backwardness in Historical Perspective: A Book of Essays; Belknap Press of Harvard University Press: Cambridge, MA, USA, 1962. [Google Scholar]
  20. Fagerberg, J.; Manual, G. Innovation and Catch-up. In The Oxford Handbook of Innovation; Oxford University Press: London, UK; New York, NY, USA, 2005. [Google Scholar]
  21. Song, W.; Seong, J.; Kim, Y.; Hwang, H.; Choung, J. In search of post catch-up innovation system. STEPI Policy Res. 2006, 25, 1–530. [Google Scholar]
  22. Kindleberger, C.P. World Economic Primacy: 1500-1900; Oxford University Press: New York, NY, USA, 1996. [Google Scholar]
  23. Amsden, A.H. The Rise of “the Rest”: Challenges to the West from Late-Industrializing Economies; Oxford University Press: New York, NY, USA, 2001. [Google Scholar]
  24. Lee, K. Schumpeterian Analysis of Economic Catch-Up: Knowledge, Path-Creation, and the Middle-Income Trap; Cambridge University Press: Cambridge, UK, 2013. [Google Scholar]
  25. Lee, K. The Art of Economic Catch-Up: Barriers, Detours and Leapfrogging in Innovation Systems; Cambridge University Press: Cambridge, UK, 2019. [Google Scholar]
  26. Utterback, J.M.; Abernathy, W. A dynamic model of process and product innovation. Omega 1975, 3, 639–656. [Google Scholar] [CrossRef]
  27. Bolton, M.K. Imitation versus innovation: Lessons to be learned from the Japanese. Organ. Dyn. 1993, 21, 30–45. [Google Scholar] [CrossRef]
  28. Kim, L. Imitation to Innovation: The Dynamics of Korea’s Technological Learning; Harvard Business School Press: Boston, MA, USA, 1997. [Google Scholar]
  29. Lee, J.; Bae, Z.T.; Choi, D.K. Technology development processes: A model for a developing country with a global perspective. RD Manag. 1988, 18, 235–250. [Google Scholar] [CrossRef]
  30. Lee, K.; Lim, C. Technological regimes, catching-up and leapfrogging: Findings from the Korean industries. Res. Policy 2001, 30, 459–483. [Google Scholar] [CrossRef]
  31. Park, K.; Ali, M.; Chevalier, F. A spiral process model of technological innovation in a developing country: The case of Samsung. Afr. J. Bus. Manag. 2011, 5, 5162–5178. [Google Scholar]
  32. Perez, C.; Soete, L. Catching Up in Technology: Entry Barriers and Windows of Opportunity in Technical Change and Economic Theory; Pinter Publishers: New York, NY, USA, 1998. [Google Scholar]
  33. Chang, S.; Kim, H.; Song, J.; Lee, K. Technological Opportunity, Technological Leadership Change, and Latecomers’ R&D Resource Allocation Between Innovation and Imitation. Technological Leadership Change, and Latecomers’ R&D Resource Allocation between Innovation and Imitation. (14 February 2020). Available online: https://ssrn.com/abstract=3538041 (accessed on 6 June 2020).
  34. Lee, K. Economics of technological leapfrogging. In Research and Statistics Working Paper; Department of Policy, UNIDO: Vienna, Austria, 2019; Volume 17. [Google Scholar]
  35. Lee, K.; Lee, J. National innovation systems, economic complexity, and economic growth: Country panel analysis using the US patent data. J. Evol. Econ. 2019, 29, 1–32. [Google Scholar] [CrossRef]
  36. Hwang, H. Beyond selection and concentration, through diversity and horizontal cooperation. Future Horizon 2014, 22, 36–39. [Google Scholar]
  37. Shin, H.; Lee, K. Impact of Financialization and financial development on inequality: Panel cointegration results using OECD data. Asian Econ. Pap. 2019, 18, 69–90. [Google Scholar] [CrossRef]
  38. Lim, J.; Lee, K. Employment effect of innovation under different market structures: Findings from Korean manufacturing firms. Technol. Forecast. Soc. Chang. 2019, 146, 606–615. [Google Scholar] [CrossRef]
  39. Henderson, R.; Clark, K. Architectural innovation: The reconfiguration of existing product technologies and the failure of established firms. Adm. Sci. Q. 1990, 35, 9–30. [Google Scholar] [CrossRef] [Green Version]
  40. Kang, R.; Jung, T.; Lee, K. Intellectual property rights and Korean economic development: The roles of patents, utility models and trademarks. Area Dev. Policy 2019, 5, 1–23. [Google Scholar] [CrossRef]
  41. Jaffe, A.B.; Trajtenberg, M.; Henderson, R. Geographic localization of knowledge spillovers as evidenced by patent citations. Q. J. Econ. 1993, 108, 577–598. [Google Scholar] [CrossRef]
  42. Narin, F.; Albert, M.B.; Smith, V.M. Technology indicators in strategic planning. Sci. Public Policy 1992, 19, 369–381. [Google Scholar]
  43. Hu, A. The regionalization of knowledge flows in East Asia: Evidence from patent citations data. World Dev. 2009, 37, 1465–1477. [Google Scholar] [CrossRef]
  44. OECD. Frascati Manual 2015: Guidelines for Collecting and Reporting Data on Research and Experimental Development, The Measurement of Scientific, Technological and Innovation Activities; OECD Publishing: Paris, France, 2015; Available online: https://www.oecd.org/sti/frascati-manual-2015-9789264239012-en.htm (accessed on 6 June 2020).
Figure 1. Research Design and Framework of the research.
Sustainability 12 04751 g001
Figure 2. Mean plots of TCT for both South Korea and China. (a) Mean Plots of Korea’s TCT. (b) mean plots of China’s TCT.
Sustainability 12 04751 g002
Figure 3. TCT Comparison by countries (a) TCT Comparison (Korea & China). (b) TCT Comparison (Korea, China, Japan & United States).
Sustainability 12 04751 g003
Figure 4. Mean plots of self-citation ratio for both South Korea and China. (a) mean plots of Korea’s self-citation ratio. (b) mean plots of China’s self-citation ratio.
Sustainability 12 04751 g004
Figure 5. Self-citation ratio of Korea, China, Japan and the US. (a) self-citation ratio of Korea and China (b) self-citation ratio of Korea, China, Japan, and the US.
Sustainability 12 04751 g005
Figure 6. Basic research expenditure of Korea, China, Japan and US. (a) Basic Research Expenditure of Korea and China. (b) Basic Research Expenditure of Korea, China, Japan and the US.
Sustainability 12 04751 g006
Figure 7. Gross domestic expenditure on basic research as percentage comparison. (a) gross domestic expenditure on basic research in Korea and China (b) gross domestic expenditure on basic research of Korea, China, Japan, and the US.
Sustainability 12 04751 g007
Table 1. Stage models of technological innovation capabilities.
Stage 1Stage 2Stage 3
Utterback and Abernathy [26]FluidTransitionSpecific
Bolton [27]ImitationReflective imitationInnovation
Kim [28]Duplicative imitationCreative imitationInnovation
Lee [24,25], Lee and Lim [30]Path-followingPath-skippingPath-creating
Developed countries
Source: Park et al. [31].
Table 2. Arguments of transition from catch-up to post catch-up strategy of South Korea.
DimensionsArgumentSources
Catch-Up
Period
Post Catch-Up Period
Technological
Regime
Changes
Technology
Life
Cycle
Short Cycle Cector
Emblematic Industry:
ICT and Electronics
Long Cycle Sector
Emblematic Industry:
Bio and Medicine
[1,24,25,35]
Localization
of Knowledge Creation
LowHigh[1,24,25,35,36]
Basic Research
Expenditure
LowHigh[1,24,25,35,36]
Organizational &
Cultural Change in firms
& Social Problems
Imbalanced Growth
Inequality
Bureaucracy
Top-Down Structure
Vertical Decision Making Culture
Balanced Growth
Toward Equality
Democratic and
Bottom-Up Structure
Horizontal Decision Making Culture
[36,37,38]
Table 3. Descriptive statistics of TCT for both South Korea and China.
South Korea’s TCT Descriptive StatisticsChina’s TCT Descriptive Statistics
Groups1998–20022003–20072008–2012Groups1998–20022003–20072008–2012
Mean7.548.3810.30Mean10.509.7410.53
N149421867824118N30911254563
SD3.7533.6543.997SD4.9434.8134.778
Var14.08413.34915.977Var24.43323.16522.826
Median6.508.0010.00Median10.009.0010.00
Min112Min222
Max293338Max283237
Table 4. ANOVA Test Results for Korea’s and China’s TCT.
ANOVA Results for South Korea’s TCTANOVA Results for China’s TCT
Sum of SquaresdfMean
Square
FSig. Sum of SquaresdfMean
Square
FSig.
Between
Groups
80,156.494240,078.2472738.1300.000Between
Groups
567.8042283.90212.3590.000
Within
Groups
845,072.09257,73514.637 Within
Groups
137,693.43599422.972
Total9,525,228.5857,737 Total13,861.2395996
Table 5. Pairwise t-test results for Korea, China, Japan, and the US.
Paired Samples Test
Paired DifferencestdfSig. (2-Tailed)
MeanStd. DeviationStd. Error Mean95% Confidence Interval of the Difference
LowerUpper
Pair 1KR-CN−1.5131.3960.360−2.285−0.740−4.198140.001
Pair 2KR-JP−0.0690.3330.086−0.2540.115−0.807140.433
Pair 3KR-US−1.2690.3580.092−1.468−1.071−13.733140.000
Pair 4CN-JP1.4431.6110.4160.5512.3353.471140.004
Table 6. Descriptive statistics of the self-citation ratio for both South Korea and China.
Korea’s Self-Citation Descriptive StatisticsChina’s Self-Citation Descriptive Statistics
Groups1998–20022003–20072008–2012Groups1998–20022003–20072008–2012
Mean0.1990.2870.340Mean0.1170.2280.407
N149421867824118N30911254563
SD0.3640.3710.418SD0.4740.4210.437
Var0.1330.1380.174Var0.2240.1770.191
Median0.0640.1110.000Median0.0000.0000.250
Min0.0000.0000.000Min0.0000.0000.000
Max10.2639.3334.900Max7.6438.0001.000
Table 7. ANOVA test results for Korea and China’s Self-Citation Ratio.
ANOVA Results for South Korea’s TCTANOVA Results for China’s TCT
Sum of SquaresdfMean
Square
FSig. Sum of SquaresdfMean
Square
FSig.
Between
Groups
181.808290.904599.0950.000Between
Groups
47.991223.995126.3640.000
Within
Groups
8760.45657,7350.152 Within
Groups
1138.2159940.190
Total8942.26457,737 Total1186.205996
Table 8. Pairwise t-test for Korea’s and China’s self-citation ratio.
Paired Samples Test
Paired DifferencestdfSig. (2-Tailed)
MeanStd. DeviationStd. Error Mean95% Confidence Interval of the Difference
LowerUpper
Pair 1Korea-China0.044670.105620.02727−0.013820.103161.638140.124
Pair 2Korea-Japan−0.223330.054340.01403−0.25342−0.19324−15.919140.000
Pair 3Korea-US−0.547330.033900.00875−0.56611−0.52856−62.523140.000
Pair 4China-Japan−0.268000.076920.01986−0.31060−0.22540−13.493140.000
Table 9. ANOVA test results for Korea and China’s Basic Research Expenditure (Natural Log).
ANOVA Results for South Korea’s TCTANOVA Results for China’s TCT
Sum of SquaresdfMean
Square
FSig. Sum of SquaresdfMean
Square
FSig.
Between
Groups
4.50522.25255.4400.000Between
Groups
8.06724.03343.2250.000
Within
Groups
0.488 120.041 Within
Groups
1.120120.093
Total4.99214 Total9.18614
Table 10. ANOVA test results for gross domestic expenditure on basic research.
ANOVA Results for South Korea’s TCTANOVA Results for China’s TCT
Sum of SquaresdfMean
Square
FSig. Sum of SquaresdfMean
Square
FSig.
Between
Groups
0.29120.14541.7800.000Between
Groups
0.00320.00222.9520.000
Within
Groups
0.042120.003 Within
Groups
0.001120.000
Total0.33314 Total0.00414
Table 11. Pairwise t-test of gross domestic expenditure on basic research as a percentage.
Paired Samples Test
Paired DifferencestdfSig. (2-Tailed)
MeanStd. DeviationStd. Error Mean95% Confidence Interval of the Difference
LowerUpper
Pair 1Korea-China0.378 0.140 0.036 0.300 0.455 10.463 14 0.000
Pair 2Korea-Japan0.065 0.141 0.036 −0.013 0.143 1.790 14 0.095
Pair 3Korea-US−0.020 0.138 0.036 −0.096 0.057 −0.549 14 0.592
Pair 4China-Japan−0.312 0.009 0.002 −0.317 −0.308 −142.171 14 0.000
Pair 5China-US−0.397 0.025 0.006 −0.411 −0.383 −62.078 14 0.000
Table 12. Arguments and empirical results of Both South Korea and China.
DimensionsArgument and DiscourseEmpirical Finding of the Research
Catch-Up
Period
Post Catch-Up PeriodCatch-Up PeriodPost Catch-Up Period
Technological
Regime
Changes
Technology’s
Economic
Life
Short Cycle Sector
Emblematic Industry:
ICT & Electronics
Long Cycle Sector
Emblematic Industry:
Bio & Medicine
Short Cycle
Period
ICT & Electronics
Industry
Driven
Long Cycle
Period
ICT & Electronics
Industry
Driven Still
(TCT got longer)
Localization
of
Knowledge
Creation
LowHighLowHigh
Basic Research
Expenditure
&
GDEB %
LowHighLowHigh

