1. Introduction
The agricultural sector is considered key in the national economy of the Republic of Moldova. Moldavian agricultural development is heavily influenced by a favorable mild climate with very-high-quality soils that allow the production of high-value crops like fruits and vegetables. Still, even in a very-high-quality soil context, Shik et al. [
1] mention in their studies that large-scale agricultural companies, which are also the core of the export activities, produce mostly low-value-added crops (such as sugar beet, oilseeds and cereals) on farms that exceed 50 ha of land. The same authors also notice that the agricultural sector of the Moldavian Republic was characterized by significant changes over the last years, especially related to its modernization and development.
The dynamic character of this sector has manifested during the past decade and can be attributable to a large variety of factors, such as disruption of production, distribution networks enhancement, climate change (there is no other economic sector as exposed to natural hazards), economical strategies and globalization or investments dynamics. Subsidy development programs and the volume of investments are important indicators that characterize the state policy in the agriculture sector. For example, Valeriu et al. [
2] highlights that in Moldova, during the period between 2006 and 2015, the volume of investments and subsidies in agriculture displayed pronounced annual growths and decreases, while evolving non-uniformly. In this context, agriculture subsidies can be considered measures for avoiding large annual fluctuations, being focused both on agricultural products with a high export potential and on those that are not covered completely by national production. Compared to the rest of the European countries, Moldova has a high agricultural potential. Indeed, having among the largest areas of farmland as a share of the total land (75.00% compared to the European average of 45%), it is still placed at the end when it comes to agricultural production efficiency [
3].
Thus, the aim of this article is to analyze the Republic of Moldova’s national agricultural sector during a nine year period, by developing an analytical framework based on several technological tools and a set of models containing agricultural indicators proved to be relevant (state subsidies, agricultural loans, gross domestic product—GDP, agriculture GDP, gross value added—GVA, agriculture GVA, main agriculture crops production and value of production) for identifying patterns and solutions that would lead to maximizing agricultural efficiency.
According to the IBM researcher Lieberman [
4], an analytical framework is composed of several major components: a set of tools; a set of useful solution patterns; one or more model forms; and multiple research techniques. The present study followed this approach as it provides, by using several technological tools, a set of models describing the existing relations between the aforementioned parameters and several discovered patterns. The data we used in our research spans over 9 years; that is, between 2008 and 2016. Currently, there is a limited number of studies that would provide insights referring to the dynamics of the Moldavian agricultural sector over the past years.
In order to have a better understanding of the productivity aspect of the Moldavian agricultural systems, our analytical framework is also using a set of parameters related to agricultural gross value added. Gross value added (GVA) is strongly related to productivity as it measures the contribution to the economy of an individual producer, industry or sector.
In a study based on machine learning cluster analysis [
5], different types of farms and their development level were delimitated based on certain economic aspects like GVA; thus, presenting an interesting aspect of the Moldavian agricultural sector—the existence of many small family farms and only a small number of corporate holdings that are accounting for most of the agricultural production. Small individual farms predominantly produce solely for one or several family needs, unable to find their way to the market place, thus enforcing the rural economy.
Mainly, we consider that the low productivity of the agricultural sector is determined by the lack of investments, capital and available loan schemes, a context that led to the proliferation of low-efficiency technologies and the reduced use of fertilizers and pesticides—a situation confirmed by Shik et al. [
1]. This situation clearly affects the welfare of the rural population of Moldova, population that is depending significantly on the agricultural sector.
As for the economic relations with the EU, the Republic of Moldova is the only country in the Commonwealth of Independent States that has preferential access to the EU market; thus, all the premises for the creation of free trade areas throughout the country were ensured. We consider that these free import zones could serve as liaison centers for capturing the foreign direct investments necessary to support the efforts of industrialization and subsequent development of exports, and the free zones for export offer a series of advantages for relocating certain industries originating from other countries in the host country.
In the Republic of Moldova, the agricultural sector supplies a large quantity of products for export, made up largely of raw unprocessed material at very low prices, while the import of agri-food products is comprised mainly of processed products. The size of the processing sector (excluding wine) is relatively small, at 4.50% of the total food and beverage industry in 2013 [
6]. This situation is related to the lack of competitiveness that characterizes the Moldavian industry. Especially, this is the case with the food processing industry, due to low processing infrastructure (mostly limited to wine, apples and tomatoes). This manifested after 1989, when proper conditions for trade liberalization and import barriers reduction appeared.
The present research refers to the period between 2008 and 2016 and is based on data collected from agricultural farms, provided by the Moldavian National Bureau of Statistics and the Agency for Interventions and Payments in Agriculture, respectively. The period of nine years, between 2008 and 2016, was chosen since challenges generated by both climate change (the 2012 drought that affected 80.00% of farmland) and a difficult political situation (restrictions imposed by the Russian Federation on Republic of Moldova agri-food imports and exports between 2013 and 2014) were recorded. Therefore, by analyzing this period, a high-fidelity representation can be obtained, in order to assure a proper development strategy of the Moldavian agriculture sector, capable to face different environmental or political challenges scenarios.
For modelling purposes, the present study framework took into consideration the production values of the Moldavian main crops (wheat, maize and grapes), as they can be categorized from the information presented in
Table 1 and
Table 2. By also calculating the productivity of the abovementioned crops, using the data presented in both tables, it can be concluded that both maize and wheat have similar average productivities (3.27 tons per hectare and 3.25 tons per hectare, respectively) during the four mentioned years (2015–2018).
However, according to recent studies [
7], the grape and vegetable culture sectors are characterized by a large number of producers across the country that have important social impacts in addition to their strong economic impact, as they represent around 25% of the total agri-food exports. Vegetables were considered important crops as most of the production is obtained from greenhouses that require technological improvement and could benefit from subsidies and agricultural loans. The understanding of seasonality vis-à-vis competitors from other countries and their ability to spread marketing over time by using and improving greenhouses for vegetables could be a solution for increasing the performances of the agricultural sector [
7].
Table 1.
Sown area main crops (hectares) [
8].
Table 1.
Sown area main crops (hectares) [
8].
| | 2015 | 2016 | 2017 | 2018 |
|---|
| Sown area - total | 1502.60 | 1519.60 | 1532.90 | 1544.30 |
| Cereals and leguminous crops | 949.60 | 950.80 | 936.60 | 974.10 |
| Wheat – total | 345.50 | 371.30 | 335.60 | 373.10 |
| Barley-total | 84.50 | 83.20 | 80.70 | 65.00 |
| Grain maize | 492.70 | 468.00 | 481.40 | 491.40 |
| Industrial crops | 434.90 | 447.40 | 478.30 | 462.80 |
| Sugar beet (industrial) | 21.80 | 20.90 | 23.60 | 19.80 |
| Sunflower | 330.30 | 362.40 | 384.90 | 364.20 |
| Soy | 67.80 | 39.90 | 34.00 | 28.00 |
| Tobacco | 0.80 | 0.60 | 0.50 | 0.40 |
| Potatoes, Vegetables, Melons, Gourds | 57.30 | 58.90 | 57.10 | 53.40 |
| Potatoes | 22.20 | 20.70 | 19.70 | 19.00 |
| Field vegetables | 27.60 | 28.30 | 28.80 | 28.60 |
| Forage crops | 60.80 | 62.40 | 60.90 | 54.00 |
| Fruit and berry plantations | 110.40 | 110.10 | 113.40 | 113.10 |
| Plantations of vineyards | 128.80 | 129.10 | 120.70 | 126.90 |
Table 2.
Gross harvest main crops (thousand tons) [
8].
Table 2.
Gross harvest main crops (thousand tons) [
8].
| | 2015 | 2016 | 2017 | 2018 |
|---|
| Sown area - total | 2206.40 | 2993.20 | 3354.80 | 3466.70 |
| Cereals and leguminous crops | 922.30 | 1292.90 | 1250.70 | 1162.80 |
| Wheat – total | 178.80 | 255.70 | 248.90 | 175.30 |
| Barley-total | 1076.80 | 1392.40 | 1772.50 | 2073.80 |
| Grain maize | 23.10 | 39.10 | 69.00 | 45.60 |
| Industrial crops | 484.80 | 677.10 | 803.80 | 788.70 |
| Sugar beet (industrial) | 47.90 | 42.10 | 46.50 | 57.70 |
| Sunflower | 537.50 | 664.80 | 876.30 | 707.20 |
| Soy | 47.90 | 42.10 | 46.50 | 57.70 |
| Tobacco | 537.50 | 664.80 | 876.30 | 707.20 |
| Potatoes, Vegetables, Melons, Gourds | 1.20 | 0.90 | 1.00 | 0.70 |
| Potatoes | 158.20 | 214.00 | 197.00 | 174.80 |
| Field vegetables | 245.80 | 293.30 | 309.70 | 283.30 |
| Forage crops | 54.50 | 66.50 | 56.10 | 46.10 |
| Fruit and berry plantations | 485.50 | 595.70 | 666.40 | 894.20 |
| Plantations of vineyards | 598.70 | 615.70 | 675.10 | 730.20 |
Moldova is a world-class producer of grapes, maize and wheat as a result of the European Neighborhood Program for Agriculture and Rural Development (ENPARD) partnership with the EU since 2013. This ranking has not changed since 2013, with two main producers being recognized, Moldova and Ukraine [
6]. In 2017, Moldova was ranked first in terms of grape export in the ENPARD program, accounting more than 80% of ENPARD production [
6]. In terms of grape production, in Europe, Moldova ranks 11th and 20th in the world. Besides that, the Republic of Moldova is the country with the highest density of vineyards in the world.
Due to the continuous development of the Moldavian agricultural sector, funding needs are continuously growing. Farmers and companies alike want to buy new equipment, materials, fertilizers, quality seeds and new breeds, or want to expand their farm sizes. That is why the present paper’s analytical framework considered several parameters that would potentially address this aspect, specifically subventions and loans. Regarding the subsidies allocated to agricultural farms, usually they were offered on the basis of the following two directions: 1) for the modernization of the agricultural sector, by subsidizing investment activities related to the creation of units for the handling and processing of agricultural production, the provision of the appropriate equipment, the supply of materials for agricultural crops, the establishment of vineyards and orchards and the development of agricultural services; and 2) to increase the competitiveness of the plant and livestock sector, by stabilizing the market and ensuring food security and income for farmers by allocating direct payments according to culture, animal species and average farm yield—depending on the area of agricultural land or the number of animals.
The financial support granted to the agricultural producers came through different sectorial programs, the state budget or external sources (Rural Investment and Services project; The Agricultural Revitalization Project IFAD-II; improving market access for grape producers in the South Center area—HEKS; technical assistance for young farmers regarding marketing and entrepreneurship—IFAD; etc.). However, the subsidy fund can be considered an instrument for unifying all programs and projects for agricultural producers.
Lastly, it should be emphasized that the agricultural economic situation is strongly related to agricultural sustainability as, according to the OECD, the definition of sustainable agriculture is agricultural production that is economically viable and does not degrade the environment over the long run [
9]. The Committee for Agriculture of the Food and Agriculture Organization of the United Nations (FAO) [
10], as well as other studies related to agriculture sustainability, also emphasized that changes in perceptions in relation to the interpretation of sustainable agriculture are emerging. Thus, the concept must extend to social, institutional and economic sustainability, and not exclusively environmental sustainability—the conservation and rational utilization of natural resources [
11].
Agricultural sustainability can be defined as the state of four subsystems (economic, social, environmental and institutional) within which agriculture is operating [
11]. Measuring sustainable development at an aggregate level, however, requires a broad integration of indicators of economic, environmental, and social changes.
Therefore, in order to make agriculture sustainable, the economic sustainability of this production sector must first be accomplished. General criteria of durable growth in agriculture should reflect mainly economic criteria, defined by economic efficiency, since the conception of sustainable agriculture includes the postulate of multifunctional development [
12].
Thus, the present paper analyzes the performance of the agriculture sector and its impact on the Moldavian economy by using the custom-developed analytical framework in order to generate various perspectives that can be used to elaborate on an economic sustainable development strategy for the Moldavian agriculture sector.
2. Literature Review
The analysis of the performance of the Moldavian agricultural sector and its impact on the Moldavian economy was based on several scientific studies. The presented studies define the overall context while also describing relevant directions for the current research: a) the importance of the agricultural sector for the Moldavian economy; b) agricultural economical aspects like budgetary transfers to agriculture, agriculture as a strategic policy, agricultural funding in terms of subsidies and loans, budget sharing for agricultural research, irrigation, viticulture, and agricultural subsidy systems; c) the chosen crops’ importance; and d) agricultural modelling scenarios developed to obtain better insights over a country’s agricultural sector.
Related to the importance of the agricultural sector for the Moldavian economy, Valeriu et al. [
2] highlights that in the Republic of Moldova, agriculture represents an important sector of the national economy, which has changed dramatically over time due to a wide range of factors of which the most important are disruptions in the production and distribution networks. This sector is particularly exposed to climate change that primarily causes large fluctuations in agricultural production. In his research, Valeriu [
2] analyzed the development evolution of the agricultural sector of the Republic of Moldova and formulated several recommendations to overcome existing problems.
The agriculture importance is also presented by Timofti et al. [
3] which shows that the agrarian sector is of national interest. Considering his opinion, the agriculture should be an engine of economic growth and the state should ensure medium and long-term performance of the agricultural sector by the adoption of effective economic policy. For example, economic policies could refer to agricultural import and exports.
There are several research papers presenting relevant economical perspectives of the Moldavian agricultural system. As presented by Stratan et al., the agricultural sector was considered a strategic one by the Moldavian governments. His study shows that from 2012 to 2015, budgetary transfers to agriculture and rural development increased from 698 million MDL (Moldavian Leu) to 1093 million MDL. Considering the registered inflation rate of 4.65% in 2012 and 9.67% in 2015, reported by the Moldavian National Bank, it can be stated that Moldavian budgetary transfers to agriculture and rural development increased, in real value, by 49.42%. It was a growth driven by an effort to modernize agriculture as a strategic policy. In the same period, the volatility of the budget expenditures was very high with a decrease in spending in 2008 and 2010 [
13]. A significant share of the capital spending facilitated an upgrade of obsolete infrastructure, while more efforts were dedicated to the sustainable use of natural resources and risk management. As the author describes, other agricultural budgetary expenditures were related to physical infrastructure and business development for the sector modernization and to key services, with significant allocations for food safety and agricultural education and a smaller share of the budget spent on research, irrigation, viticulture and wine development, as well as support of high-value markets and risk mitigation.
The funding of the Moldavian agricultural sector is presented as a critical aspect during the past years. In his research, Efros [
14] presents the problems faced by the farmers concerning various forms of subsidies. In his opinion, the agricultural subsidy system should be constantly in the focus of executive authorities. Thus, agriculture subsidizing should be a mandatory aid for the agricultural development as well as a means of attracting investments in this area. Efros [
14] identifies several objectives regarding the allocation of subsidy funds: (a) increasing the productivity and competitiveness of the Moldovan agricultural products on domestic and foreign markets; (b) stimulating technology transfer and extension services; (c) increasing the income of agricultural producers; (d) ensuring food security; (e) reducing the poverty level of the Moldovan population; (f) attracting young farmers for agricultural activities in rural areas; and (g) ensuring the efficient use of natural resources and environmental conservation.
By analyzing the investment climate in the Moldavian Republic, the top points and the weak points, Natalia and Artur [
15] highlight that while investments are important for economies in transition, the agricultural sector of the Moldavian Republic has many problems and one of the most important is the lack of financial resources. In her opinion, this is the cause of why the agricultural sector gross value added declined in the 2000–2010 period. Minviel and Latruffe [
16] also investigated public agricultural subsidies related to their impact on farm technical efficiency, and discovered that subsidies are usually negatively associated with the farm technical efficiency.
Sargo and Timofti [
17], in their research, analyzed the efficiency of investment in agriculture and determined the optimal level of investment for 1 ha of agricultural land, while also identifying a serious issue represented by the inefficient management of funding sources. In addition, the author emphasized that the need for funding in the agricultural sector grew as agricultural enterprises were consolidating in order to sell the products on domestic and international markets. Farmers needed to buy tools and equipment necessary for optimizing their business. Heavy investments were also made in seeds or fertilizers that were imported, usually at high costs. As such, the need for financial resources registered a continuously upward trend. If referring to high import costs and international integration, Zbanca et al. [
18] mentioned that the objective of Moldova’s integration into the international economic system requires a qualitative change from the current situation in the food sector. For Moldova, this would mean that the entrepreneurs should focus on crop diversification and the production of agricultural products with high added value, as required for profitable markets. Adrian [
19] analyzed the import and export trends between the Republic of Moldova and the EU, focusing on their influence on economic growth.
The performance of the Moldavian agricultural productivity in a larger context was presented by Csaki and Jambor [
20]. In their paper, they analyzed the agricultural performance of the Commonwealth of Independent States (CIS) countries between 1997 and 2016 in order to identify whether the states’ transitions brought positive changes in agricultural productivity.
Besides indicators like loans, subsidies, GDP and GVA, we also resolved to add to our proposed framework the production of several crops. As described above, the framework crops were chosen according to their impact on the sector. In terms of specialized literature, there are several studies describing crop importance for the agricultural system.
Zbanca et al.’s [
18] research aimed to provide a comparative analysis of cultivation of high-value crops for enabling local entrepreneurs to correctly select their crops based on the economic indicators and financial resources. The authors developed financial models for each crop, with high-value production (particularly fruit and vegetables) that would lead to the highest profits.
In another study, Ursu and Petre [
21] specified that the area of cultivated wheat in the Republic of Moldova increased during the period 2007–2018. In 2018, a total area of 373 thousand hectares was used, displaying an increase of 18.41% compared to 2007. Still, the highest value was registered in 2008. Namely, 400 thousand hectares. Ursu and Petre [
21] show that the average annual growth rate over 12 years was around 1.55% annually. Statistically, from 2007 until 2018, 347.3 thousand hectares were cultivated annually, with a standard deviation from this average of 30.7 thousand hectares that represented a variation of 8.86%. Even if the wheat cultivated area increased, the production (1,286,332 tons (2008), 736,660 tons (2009), 744,160 tons (2010), 794,783 tons (2011), 495,231 tons (2012), 1,008,647 tons (2013), 1,101,682 tons (2014), 922,283 tons (2015), 1,292,921 tons (2016), 1,250,700 tons (2017), and 1,162,800 tons (2018)) actually decreased from 2008 until 2015, with the minimum being reached during the 2012 drought. There are several factors that could explain why in a context defined by the expansion of the cultivated area, the production actually decreased: a lack of infrastructure and machinery, a poor irrigation system as well as poor seed and fertilizer quality.
As for the area of cultivated maize, it is the largest of all the analyzed crops, displaying an average of 460,580 hectares, with a small yearly increase of 0.48%. In 2018, 491,000 hectares were cultivated with maize, 5.36% higher than in 2007 [
21].
Grape production, another parameter of our framework, is also a significant element of the Moldavian agricultural sector. A number of interesting aspects can be found in several studies [
22,
23]. Thus, in 2018, the Moldavian vineyard covered an area of 148,500 hectares with a total production of wine estimated in 2016 at 1.7 million hectoliters. In the year 2018, the Republic of Moldova boasted as being one of the most significant grape-producing countries, ranking in the 19th position in the world.
In the Republic of Moldova, vineyards and the wine sector offer the highest number of jobs in rural areas: 29 679 legal entities being involved in this sector of the economy. In Moldova in 2018, there were 187 wineries registered in the Wine Register and 68 had their own vineyards. As such, the wineries own 36% of the total vineyard area.
As for investments, in 2018 the amount was around 20 million dollars: 10.5 allocated for planting, 4.7 for modernization, and 1.7 million and 0.23 million for various programs. Moldavian Republic is the country with the highest density of vineyards in the world, 65% of which planting white varieties and 35% red varieties [
23].
Golban [
24] presented the role and importance of financial services for the Moldavian horticultural sector, emphasizing the viticulture segment, in order to increase its competitiveness. He highlights that the modernization of the sector depends directly on the implemented financial services. His paper presents an analysis of the main financial services implemented in the horticultural sector (credits, subsidies and insurances) and the problems the farmers are encountering when accessing these services.
Besides research targeting the main agricultural crops presented above, there are also studies considering niche crops, like vegetables. Such an example can be found in the World Bank Report on the competitiveness in Moldova’s agricultural sector [
6], which focuses also on vegetables given its important economic impact, not only in terms of exports but also in the domestic economy. According to the study, there is a large number of small producers in this sector, meaning that the sector affects a large proportion of the population in the rural areas. This is also the sub-sector within agriculture in which most opportunities for increased competitiveness have been identified.
As our research presents, 2012 was an extremely difficult year for Moldavian agriculture as the Republic of Moldova suffered the combined impacts of poor rainfall and extremely high temperatures, which resulted in major losses in national crop production. Potopova et al. [
25] shows that crop losses due to drought represent a complex issue as it involves the intensity, duration, and the developmental stage of the plants when drought occurs. In her studies, she investigated how to assess the drought-induced decline in crop harvest, as well as the drought variability and the yield sensitivity of winter wheat, maize, sugar beet and sunflower to such drought during their growth. Sutton et al. [
26] identifies that the Republic of Moldova is one of the countries that is at a high risk due to climate change with the potential of having serious problems, as the majority of the rural population depends either directly or indirectly on agriculture for their livelihoods. In the same study, Sutton [
26] highlights that, in the Republic of Moldova, drought can be one of the most severe natural hazards with extremely high economic and societal impact.
The scientific literature provides different modelling scenarios aiming to obtain better insights over a country’s agricultural sector. Our study comes as an addition to the multitude of already developed models, as very few of them targeted the Moldavian agricultural sector.
As an example, we noticed the models targeting the relationships between the income per farm and the measurement of the farm performance. Kölling [
27] performed surveys across different EU regions and investigated farmers’ incomes and the way in which revenue data is used to evaluate Common Agriculture Policy (CAP) performance. After studying the farm sizes and income level of the agricultural population, Kölling [
27] emphasized that these, along with the farm diversity, vary significantly. Actually, the averages used by the European Commission to compare incomes by farm size class, farm type and by region in FADN-RICA (Farm Accountancy Data Network—a data analysis tool designed to evaluate the income of agricultural holdings or farms and the impact of the Common Agricultural Policy) do not always demonstrate the extent to which certain groups of farmers are disadvantaged over others.
Another example of applied agricultural modelling can be found in Kern et al. [
28], which presents a study in which multiple linear regression models were constructed to simulate the yield of winter wheat, rapeseed, maize and sunflower for the 2000–2016 time period in Hungary. He used meteorological data and soil water content as predictors, and based on a stepwise linear regression-like method, he obtained simple equations with well-interpretable coefficients. These could estimate crop yield with high accuracy. The explained variance was 67% for winter wheat, 76% for rapeseed, 81% for maize and 68.5% for sunflower. Holzworth et al. [
29] also emphasizes the role of agricultural production modelling, with examples coming from all over the world, but focusing on different elements like environmental performance, greenhouse gas emissions, soil carbon changes, food security, pests and climate change. Yield prediction in Indian agriculture was studied by Sellam and Poovammal [
30] in order to help farmers reduce their losses and to get the best prices for their crops. His research considered the analysis of environmental parameters, such as annual rainfall (AR), food price index (FPI) and area under cultivation (AUC), as they influence the yield of a crop; this in order to establish existing relationship among them. Similar with our proposed framework, Sellam and Poovammal [
30] also used regression analysis (RA) to analyze the environmental factors and their infliction on crop yield. He considered the above parameters for a period of 10 years and established the relationship between the explanatory variables (AR, AUC, FPI) and the crop yield as a response variable.
Besides yield prediction models, like the one presented in [
25], we also identified different studies, like [
31], who aimed to model the impact of financial management performance on the agricultural enterprises of the Republic of Moldova by using nonparametric modelling of the economic efficiency.
Dubravka [
32] also emphasizes that the share of gross value added by agriculture in the total GVA is one of the most important indicators regarding the importance of agriculture in the economic structure. By using linear regression methods, applied for examining the impact of GVA on Serbian agriculture and on total GVA, she showed that the movement of agriculture GVA has a statistically significant influence on the movement of total GVA.
Jones et al. [
33] reviewed agricultural modelling, stating that modeling represents an essential tool in agricultural systems science and these days the “next generation” models, data and knowledge products are facing increasingly complex systems. In his opinion, the technological progress has strongly contributed to the evolution of agricultural system modeling, including the development of process-based bio-physical models of crops and livestock, statistical models based on historical observations, and economic optimization and simulation models at the household and regional to global scales.
It is also true that many models were developed and, as a consequence, there is also much redundancy. In his research, Janssen et al. [
34] describes that agricultural modeling is suffering from fragmentation in model implementation. There are many models, much redundancy, models often being poorly coupled, and component re-use is rare. In this context, he considers that in order to improve this situation, an open, self-sustained and committed community could be formed that would develop agricultural models, associated data and tools as a common resource. All agricultural systems modelling should instantly absorb state-of-the-art technologies, best practices and standard operating procedures.
The information presented in the literature review section of the present research reveals the importance of agriculture in the Moldavian economy, emphasizing the need for developing this sector in order to assure proper, long-term, economically sustainable progress. This section also presented some of the main aspects which need to be improved in order to modernize the agriculture sector and to encourage current entrepreneurs, as well as to attract possible new investors. The information related to grape production and the wine sector reveals the importance of adopting governmental policies to encourage linking crop production with the food processing sector. The literature review section also reveals the novelty and importance of agricultural modelling, based on crop production and economic indicators, for assuring economically sustainable progress.
3. Materials and Methods
For analyzing the available data, we used Minitab software, together with the Python programming language and Spyder integrated development environment. Today, Python is one of the most popular programming languages because it is free to use and highly productive, compared to other programming languages like C++ or Java.
Furthermore, Python is one of the most-used languages for data analysis/analytics, machine learning and artificial intelligence, possessing an extensive set of libraries dedicated to these kinds of applications. For the current analysis, the Seaborn and SciPy library were used. Seaborn is a library built on top of matplotlib, integrated with pandas’ structures, used for statistical graphics.
In terms of functionality, Seaborn offers multiple usages: an API for examining relationships between multiple variables, support for categorical variables, visualization of univariate or bivariate distributions, estimation and plotting of linear regression models, convenient views of complex datasets, built-in themes for matplotlib figures and color palettes for revealing patterns in data.
A second library used was SciPy, which is a component of an entire Python ecosystem for engineering, mathematics and science, comprised of six core libraries, namely, NumPy (base N-dimensional array package), SciPy (library for scientific computing), Matplotlib (2-D plotting), IPython (an enhanced interactive console), SymPy (symbolic mathematics) and pandas (data structures and analysis). The SciPy library that was used is a core package of the SciPy stack, providing user-friendly numerical routines for integration, interpolation, optimization, linear algebra and statistics.
The research analysis employed the specific functions used to minimize the objective functions for nonlinear curve fitting problems.
Due to the nature of the data, most of the curve fitting situations were related to the case in which polynomial terms were added in the linear regression, more specifically squared predictors. Typically, we choose the model order depending on the number of bends observed in our data plotting.
Each increase in the exponent produces one additional bend in the curve-fitted line. Still, we could not identify a situation that would require the cubic term or more than that. Besides, using polynomial terms as predictors, different scenarios included firstly testing the reciprocal (1/X) of the predictor variable in the model both as a linear and quadratic model and, secondly, transforming the variables with log or ln functions in the linear regression. A log transformation is a method that allows linear regression to be used for curve fitting, otherwise possible only with nonlinear regression.
As an example, the nonlinear function: Y = eB0X1B1X2B2 can be expressed in the linear form of ln Y = B0 + B1lnX1 + B2lnX2.
The logarithm can be used on both sides of the equation (double-log form), or one side, known as the semi-log form. Log functional forms are powerful, but in the case where many predictors are involved, many combinations can be formed. For the current research, non-linear models were not proposed due to the low number of available data samples.
In order to test our model’s goodness-of-fit in regression, we included in our research four residual plots, respectively, a normal probability plot of the residuals; a histogram of the residuals; residuals versus fits; and residual versus order.
A residual plot is represented by a graph that helps to determine if the OLS (ordinary least squares) assumptions are met, meaning that unbiased coefficient estimates with minimum variance were found. The normal probability plot of the residuals was used to verify the assumption that the residuals are normally distributed.
The histogram of the residuals determines whether the data is skewed or whether outliers exist in the data. Residuals versus fits verifies the assumption that the residuals have a constant variance, while the residuals versus order plot verifies the assumption that the residuals are independent from one another.
The analytical framework generates various perspectives, which can be used in order to elaborate on an economic sustainable development strategy of the Moldavian agriculture sector. Therefore, in order to identify the importance of agriculture sector for the Moldavian economy, the total GDP, GDP agriculture, GDP per capita, total GVA, GVA for agriculture and GVA per capita were included among the analyzed parameters of the present study. Thus, the GDP gives the economic output from the consumers side, while the GVA elucidates the state of economic activity from the producers’ side or supply side. However, in order to characterize the sector in terms of financial input and production values, as well as production capacity, the value of the agriculture governmental subsidies, agriculture loans, main crops production quantity and production value were integrated among the analyzed parameters in the present study.
Wheat, maize, grapes and vegetables were crops considered as having considerable potential to influence the economic performance of the agriculture sector. In order to verify these, the total agriculture plant production and production values were integrated among the analyzed parameters. In addition, since only a small number of total agriculture farms manage to access the governmental subsidies, the value of the subsidies per subsidized farm was also considered to be included in the list of analyzed parameters, in order to offer a better result for the analytical framework, and thus more able to generate more accurate perspectives for sustaining the economic sustainable development of the Moldavian agriculture sector.
Our framework development was based on a dataset containing 21 parameters considered relevant, as previously explained in the introduction and further in the results section, and used here to describe the evolution of the agricultural sector during a period of nine years, between 2008 and 2016. The 21 parameters, statistically described in
Figure 1, are as follows:
- -
Subsidies [Subsidies] (million
$) (Source: FAO database [
35]): the total value of governmental subsidies;
- -
Agricultural credits [Agr_Credit] (million
$) (Source: FAO database [
35]): the total value of agricultural loans;
- -
Gross Domestic Product [GDP] (million
$) (Source: World Bank database [
36]): total Moldavian gross domestic product
- -
Agricultural Gross Domestic Product [GDP_Agriculture] (million
$) (Source: FAO database [
35]): the gross domestic product produced by the agricultural sector;
- -
Gross Domestic Product Capita [GDP_Capita] (
$) (Source: FAO database [
5]): the Gross Domestic Product per Capita
- -
Farms Number [Farms_No] (Source: FAO database [
35]): number of farms in Republic of Moldova that were subsidized;
- -
Farm Subsidies [Farm_Subsidies] (
$) (Source: FAO database [
35]): the value of subsidies per subsidized farm;
- -
Gross Value Added—[GVA_Economy] (million
$) (Source: FAO database [
35]): total Moldavian Gross Value Added;
- -
Gross Value Added for Agriculture [GVA_Agriculture] (million
$) (Source: Moldavian National Bureau of Statistics [
37]): the Gross Value Added of the Moldavian agricultural sector;
- -
Gross Value Added per Farm [GVA_Farm] ($) (calculated based on 2010 census): the Gross Value Added per farm;
- -
Gross Value Added per Capita [GVA_Capita] ($) (calculated): the Gross Value Added per Capita;
- -
Grape Production Value [Grapes_Val] (million
$) (Source: FAO database [
35]): the total value of Moldavian grape production;
- -
Maize Production Value [Maize_Val] (million
$) (Source: FAO database [
35]): the total value of Moldavian maize production;
- -
Vegetable Production Value [Vegetables_Val] (million
$) (Source: FAO database [
35]): the total value of Moldavian vegetable production;
- -
Wheat Production Value [Wheat_Val] (million
$) (Source: FAO database [
35]): the total value of Moldavian wheat production;
- -
Grape Production [Grapes_Prod[(tons) (Source: FAO database [
35]): the total Moldavian grapes production;
- -
Maize Production (Maize Prod) (tons) (Source: FAO database [
35]): the total Moldavian maize production;
- -
Vegetable Production [Vegetables_Prod] (tons) (Source: Moldavian National Bureau of Statistics [
37]): the total Moldavian vegetable production;
- -
Wheat Production [Wheat_Prod] (tons) (Source: Moldavian National Bureau of Statistics [
37]): the total Moldavian wheat production;
- -
Total Agricultural Plants Value [TotalPlantsVal] (million
$) (Source: Moldavian National Bureau of Statistics [
37]): the total value of plants production in the Republic of Moldova;
- -
Total Agricultural Plants Production [TotalPlantsProd] (tons) (Source: Moldavian National Bureau of Statistics [
37]): the total production of plants in the Republic of Moldova
Data distribution in relation with the mean and percentiles determines the presence of outliers in the data. Several outliers were identified, like the Farm Subsidies parameter with a value of 16,100.00; GDP Agriculture (1079.98); Total Plants Value (638.32, 1355.50); Grape Production (482,000.00 and 685,000.00, respectively); and Number of Farms (2198.00 and 2357.00, respectively).
4. Results and Discussion: A Custom Analytical Framework for Characterizing the Moldavian Agriculture Sector
The scientific research and literature regarding the Moldavian agricultural system is not extensive. Consequently, we considered it of interest to provide a set of qualitative and quantitative analysis and models that could be used by people and entities to gain a better understanding of the Moldavian agricultural system. Therefore, the proposed framework contains analysis regarding the dynamics of agriculture subsidies and agricultural loans; the dynamics of the agriculture sector GDP and GVA; the dynamics of the agricultural production and production value; and a set of models that would mathematically express the relations found between what we considered as relevant agricultural parameters.
4.1. The Dynamics of Agriculture Subsidies and Agriculture Loans
The agriculture subsidies and agriculture loans are meant to significantly influence the agriculture sector’s productivity and sustainability. Therefore, since it is considered a key sector for the Republic of Moldova’s economy, agriculture benefits from governmental subsidies are materialized in development of exports, maximization of production and productivity, production diversification in order to introduce new crops with high added value, improving food safety and security and, also, reducing those agricultural regions affected by natural disasters and decreasing the effects of climate change. However, proper policies must be established in order to increase the number of agriculture farms that can access this source of governmental financing. According to Khatkar et al. [
38], agricultural credit and subsidies are also considered important supporting factors for agriculture growth. In the Republic of Moldova, the dynamics of agriculture subsidies registered a significant decrease between 2010 and 2011, followed by an upward trend till 2014 (
Figure 2). The high number of governmental subsidies recorded in 2013 and 2014 can be most likely associated with the restrictions imposed by the Russian Federation on the Republic of Moldova’s agri-food imports and exports. Stratan et al. [
39] emphasizes that domestic food producers were mostly exposed to the negative consequences of the Russian restrictive measures in external trade with the Republic of Moldova, during 2013–2014.
However, the percentage of Moldavian agriculture farms that benefit from governmental subsidies is very low, with an average of 0.41% from the total number of registered and active agriculture farms in the Republic of Moldova territory (
Figure 2). It also can be observed that the lowest number of subsidy-financed farms is registered both in 2011 and 2014 (
Figure 2). For 2011, this result is explained by the low value of available subsidies. For the year 2014, the situation can be justified by the political restrictive measures described above, the fact that created the incertitude related to the possibility of marketing the entire agriculture production and discouraged farm owners to apply for this type of government financial support. The average value of subsidies per agriculture farm during the nine-year period was 7538.46 USD, with the maximum value in year 2014 (16,079.76 USD) and a minimum value in year 2010 (5070.69 USD).
According to the Moldovan Agency for Intervention and Payment in Agriculture (A.I.P.A.) (aipa.gov.md), during the years 2008–2011, the majority of the subsidies’ total value (46.40%) were invested in agriculture equipment in order to maximize agricultural mechanization. However, this percentage decreased to 28% between the years 2012 and 2016 (aipa.gov.md).
According to the A.I.P.A., based on the registered data, 19.00% of the total subsidy value allocated by the government were directed by beneficiary agriculture farms, during the period between 2008 and 2011, to post-harvest and processing infrastructure, while this percentage increased to 21.00% between the years 2012 and 2016. The situation is obtained based on the data collected by A.I.P.A. directly from subsidized agricultural farms, related to how the subsidies were spent. The activities set up a multi-annual plantation benefit of 15.00% of the total subsidy value during the years 2008–2011, while during the years 2012–2016 this percentage increased to 17.00%. Furthermore, the production insurance percentage increased from 3.80% of the total value of the subsidies (between 2008 and 2011) to 6.85% (between 2012 and 2016), most likely due to the risks of climate change. Thus, most of the subsidies were used for limiting the possible risks to which agriculture farms are exposed, for developing the irrigation technologies, anti-hail and frost control systems, as well as for on-farm land maintenance investments. Only 3.00% of the agricultural need for financing is covered by subsidies; approximately 33.00% is covered by agricultural loans [
37]. The dynamics of the agriculture loans is, in most analyzed years, indirectly correlated with the dynamics of the subsidies. However, there is a large difference between the values of the subsidies and the agriculture loans (
Figure 2), a fact that reveals the high demand of Moldavian agriculture farms for financial support. Agricultural long-term loans are mainly used for investment purposes, while short-term loans are for production purposes. Thus, since agriculture loans are more likely accessed by agriculture farms, the farm owners prefer to use these financial founds to cover the facility operational costs and, therefore, maintaining the production potential of the farm. However, if subsidies are accessed, chances for new investments directed for improving fish farms productivity increase. However, most agriculture loans to Moldavian farms are short-term loans. This situation imposes the continuity of the governmental agriculture subsidies program in order to assure the technological development of the agriculture sector. A rational use of both subsidies and agriculture loans can also contribute to the development of a new agricultural production niche, as ecological agriculture.
Thus, if subsidies are invested in order to target the diversification of the production panel with new organic products that resulted from ecological agriculture practices, new consumer market niches can be accessed and exploited, resulting therefore in possible profitability maximization. According to Vozarova and Kotulic [
40], agricultural subsidies help to increase the performance and reduce world prices. On the other hand, they also disrupt international markets and reduce economic efficiency.
4.2. The Dynamics of the Agriculture Sector GDP and GVA
The Republic of Moldova’s total GDP and GVA dynamics registered an upward trend from 2009 to 2014, with both parameters directly correlated. (
Figure 3). As emphasized by Ursu [
41] and Valeriu et al. [
2], the Moldavian agricultural sector plays a key role in the Moldavian overall economy. He also pointed out that 31.70% of the total Moldavian employment sector worked in agricultural activities, in a context where approximately 2 million people (57.50% of the total population) were living in rural areas.
Agricultural GDP makes up to 23.69% ± 2.96% of the Republic of Moldova’s total GDP. The highest share of agriculture in relation to total GDP is recorded in 2010 (28.12%), while the year 2009 registered the lowest share (19.85%) of this sector. In the analyzed period (2008–2016), an average 1658.91 ± 255.51 USD for GDP per capita is recorded.
The values of agricultural GDP and GVA correlated with total governmental subsidies show that agricultural product taxes recorded an average value of 846.30 million USD during the analyzed period, with the highest value recorded in the year 2011 (1098.76 mil USD) and the lowest value in 2015 (612.82 mil USD).
The GVA of the agricultural sector makes up 13.46% ± 1.49% of the Republic of Moldova’s total GVA. The highest share of agriculture in relation to total GVA was recorded in the year 2014 (15.17%), while 2008 registered the lowest share (10.74%) of this sector. The dynamics of both agricultural GDP and GVA indicators reveals the importance of governmental subsidies in the agriculture sector (
Figure 2 and
Figure 3), with a major impact between the years 2012 and 2014. The share of the abovementioned indicators in the total GDP and GVA is also significant (
Figure 3), a situation which underlines the importance of the agriculture sector for the Moldavian economy.
The agriculture sector can be considered a key sector, with considerable potential to sustain the economic development of the Republic of Moldova. The statement is based both on the agriculture potential of the country (the area of farmland as a share of its total land surface) as well as on the actual share of the agricultural GDP from the total GDP; the average share of the Moldavian GDP from agriculture from the total GDP during the analyzed period was 11.39%, which places the Republic of Moldova in the middle of the Commonwealth of Independent States (CIS), being surpassed by Uzbekistan, Tajikistan, Kirghizstan and Armenia (
Figure 4).
However, the first three of the previously mentioned countries have an area of farmland ranging from four to over thirteen times higher than the Republic of Moldova. Thus, it can be stated that, considering the CIS competitors, the Republic of Moldova’s economy considerably relies on the agricultural sector’s performance.
Still, as shown in
Figure 5, in terms of agricultural gross value added, the Republic of Moldova performs poorly, being the last one when compared with the rest of the CIS states.
4.3. The Dynamics of the Agriculture Production and Production Value
The Republic of Moldova’s agriculture production comprises mainly four major crops—maize, grapes, wheat and vegetables. These make up an average share of 76.66% of total the agricultural production recorded during the analyzed period (2008–2016). Maize recorded the highest production of the total production, with an average share of 34.67%, followed by wheat (25.22%), grapes (16.02%) and vegetables (0.74%).
The highest total agricultural production was recorded in the year 2008 (4.52 million tons), while the lowest was in 2012 (2.18 million tons) (
Figure 6). Upon observation, the grape production dynamics are relatively constant, while maize, wheat and vegetable production have similar trends (
Figure 6). This can emphasize the stability of the grape market. The dynamics of other major crops can also be influenced by the precipitation regime, since the Republic of Moldova does not have a large capacity for functional irrigation systems. According to the FAO [
42], the irrigation potential has been estimated at 1.5 million ha, from which around 11% is actually used for agricultural irrigation.
The growth of agriculture production from 2009 to 2011 can be also attributed to the growth of the national agricultural surface of 34,800 ha [
42]. In 2012, the decrease in the national agricultural surface area, due to drought, generated a significant decrease in agriculture production (
Figure 6) and, therefore, agricultural production value (
Figure 7).
The four major crops (maize, grapes, wheat and vegetables) mentioned above contributed an average of 47.06% of the total Republic of Moldova agriculture production value during the analyzed period (2008–2016).
Maize recorded the highest production value of the total production value, with an average share of 21.23%, followed by grapes (13.18%), wheat (12.09%) and vegetables (0.55%).
The highest total agriculture production value was recorded in the year 2011 (1355.5 million USD), while the lowest in 2009 (638.32 million USD) (
Figure 7). It can be observed that the evolution of the production value in this year (
Figure 7) is directly correlated with the agricultural loan dynamics (
Figure 2). It can be observed that the agriculture production value dynamics (
Figure 7) are significantly influenced by market supply-and-demand, as it differs from the agricultural production dynamics (
Figure 6). The dynamics recorded between 2012 and 2014 can be also associated with the restrictions imposed by the Russian Federation on the Republic of Moldova’s agri-food imports and exports.
The decrease in production and production value registered in 2009 and 2012 can be also explained by the decrease in foreign direct investments in the Moldovan agriculture sector. Thus, the foreign investments in Moldovan agriculture registered a share of 1.51% from the total investment values in the year 2009; this was 2.62% in 2011 compared to 2.85% in 2012 [
43]. Furthermore, according to Șargo [
17], the number of employees in the agriculture sector in 2012 was reduced by 60.6% compared to the year 2000 (770,000 employees), and by 4.5% compared to 2011. Exceptionally, for 2014, the EU also decided to double the export quotas without custom duties for grapes (from 10 to 20 thousand tons). Despite the embargo imposed by the Russian Federation on Moldovan agricultural products, exports of agri-food products increased by 12% in 2013 compared to 2012, and exports of agri-food products to the EU increased by 22% compared to the same period of 2013 [
38]. Șargo [
17] highlights that the lack of both agricultural post-harvest infrastructure and low to none cooperation between agricultural producers in the export process are major obstacles in maintaining the quota on traditional markets and expanding exports to potential new markets. Both the awareness of market requirements and the ability to make strategic decisions to meet those requirements are decisive for the development of agriculture. Furthermore, investments in equipment and in quality-enhancing infrastructure (especially greenhouses for vegetables) to strengthen the production capacity, to promote private investment as well as to build sector resilience to adverse weather events (stimulating investments in anti-hail nets, anti-frost systems, on-farm irrigation structures, etc.), can be considered key points regarding the need for investment in the Moldavian agriculture sector.
4.4. The Correlation Matrix
In our research, we used a correlation matrix as a tool to summarize the linear relations existent in our data and for identifying the strong and relevant relations that could be further modelled. Therefore, as part of the analytical framework, all data related to the main indicators that characterize the Moldavian agriculture sector were processed using the Python Seaborn library for obtaining a correlation matrix (
Figure 8).
By analyzing the correlation matrix, significant direct correlations are found between vegetable, maize and wheat production and production values and total agricultural production, respectively (
Figure 8). Therefore, the economic indicators associated to these three major crops (maize, wheat and vegetables) can be used as tools in order to control and maximize the productivity of the agriculture sector.
The dependence of the Moldavian economy on its agriculture sector is revealed by the significant direct correlations between the total agricultural production value and total GVA, the agricultural GVA and the agricultural GDP (
Figure 8). However, maize and vegetable production values present strong direct correlations with agricultural GDP (
Figure 8).
Direct, strong correlations in terms of production are also observed between vegetables, maize and wheat (
Figure 8). Grapes also can be correlated directly, in terms of production value with maize (
Figure 8). The positive effect of agriculture loans is revealed by the direct correlation of this indicator with total agricultural production (
Figure 8). In terms of significant negative correlations, the strongest was recorded between the value of agriculture subsidies and agriculture loans, depicting the fact that when the agricultural subsidy value is increasing, the agricultural loan value decreases. (
Figure 8). Starting from the correlation matrix that displayed the possible parameter relations, we further investigated which relations could be actually formalized through linear or non-linear models through curve-fitting and model detection techniques.
The following part will present several investigated cases, providing a parametric model and the residual plots for assessing whether the observed error (residuals) is consistent with the stochastic error (
Appendix A). It also should be mentioned that due to the limited number of samples, as yearly data is analyzed, multiple regression could not be performed, as a minimum of 10 samples should be available for each of the predictors—see Austin and Steyerberg [
44]. Model residuals plots should emphasize that it is not possible to predict the error for any given observation, having the residuals consistent with the random error. Residuals should be centered on zero throughout the range of fitted values.
More than that, while using an OLS approach, random errors are assumed to produce residuals that are normally distributed. Therefore, the residuals that should not be correlated with another variable or to each other (if adjacent) should fall in a symmetrical pattern and have a constant spread throughout the range. If there is a non-random pattern in the residuals, this would indicate the deterministic portion (predictor variables) of the model is not capturing some explanatory information that is transferred into the residuals.
For each scenario, several models were tested and those considered more relevant were presented. For identifying how well the models fitted the data, metrics like S (the standard error of the regression), R-squared and adjusted R-squared were used. The standard error of the regression provides the absolute measure of the typical distance that the data points fall from the regression line (
Appendix A). The S value represents a number using the same unit as the dependent variable. Normally, smaller values are better as they indicate that the observations are closer to the fitted line.
4.5. Models Based on Main Crops Production
Both wheat and maize production proves to significantly influence the total Moldavian agriculture production. The model representing the relation between wheat production and total plant production (
Figure 9) has a high R-square. The residuals display a normal distribution (
Figure A1), being independent from one another. As the value of the wheat production increases, the value of total plant production increases (one unit of wheat production leading to a 2.17 unit increase in total plants production). The relation between maize production and total plant production is strongly linear (
Figure 10), showing an R-square of 88.00%, higher than the one found when modelling wheat production–total plant production. The residuals also display a normal distribution, being independent from one another (
Figure A3). As maize production value increases, the value of total plant production increases (one unit of maize production leading to a 2.07 unit increase in total plant production). The models can be used in order to assess the total agriculture production indicators by variating both the maize and wheat production quantity.
Therefore, in order to grow the agricultural production, the maize and wheat production capacity must be maximized. Thus, it is recommended that a significant share of government financial resources be used in order to develop and implement better growth technologies for these crops, as well as to implement proper technical measurement for maintaining the optimum technological requirement of them during the entire year’s production cycle.
4.6. Models Based on Main Crops Production Value
Wheat production–wheat production value follows a linear positive trend (
Figure 11). The model describes this while having the regression
p-value at 0.01, an R-square of 60% and independence of the residuals. This, according to the histogram and normal probability plot (
Figure A5 and
Figure A6) are right skewed (working with a low number of samples usually has an effect over the residuals histograms as a histogram is most effective when there are 20 or more data points. If the sample is too small, then each bar on the histogram does not contain enough data points to reliably show skewness or outliers). This model emphasizes the stability and high liquidity of the wheat market. Therefore, the wheat market is characterized by high trading activity and high wheat supply and demand. Thus, Moldavian wheat production will sell fast, without any constrains related to price, in order to make this crop production more attractive for buyers. The grape production value–maize production value scenario is characterized by no variation and no correlation of the residuals (
Figure A7). The model explains 65% of the maize production value variance by using the grape production value (
Figure 12). The
p-value for the grape production value is 0.008, below the 0.05 threshold (
Figure A8). The equation shows that for every unit increase in the grape production value, the maize production value will increase with 2.09 units. Thus, the model emphasizes the complementarity between both the grape and maize markets in terms of the prices established for both crops during the analyzed nine-year period.
4.7. Models Based on Crops Production Value vs. GVA and GDP Economic Indicators
As expected, the R-square value of the model depicting the relation between the agricultural production value and agriculture sector GDP is very high at 92.70 (
Figure 13). The adjusted R-square is similarly large, the residuals displaying a constant variance and independence (
Figure A9). This emphasizes that the agriculture sector’s GDP is mostly influenced by the agriculture production value and less influenced by taxes. This facilitates the control of size and growth rate of agriculture economy.
At first glance, as represented in the table fitted line plot, the relation between the wheat production value and total GVA is linear (
Figure 14). Still, due to a special case, in which for a high wheat production value there was a low total GVA, the linear model fails to perform very well. The regression
p-value is 0.07 (
Figure A12), close to the 0.05 significance level, but according to the R-square the model is explaining 38.00% of the variance. The quadratic model fits the model much better. Still, future observations are required in order to more clearly asses the overall context (
Figure 14a). The model emphasizes the important share of wheat production value from the total GVA of the Republic of Moldova. Therefore, the wheat market has a significant impact on all of the Moldavian economy and can be used as an instrument of macro-economic control. The total agriculture plant production value–agriculture GVA displays a positive linear trend and the linear model can explain around 43.00% of the agricultural GVA based on the total plants value (
Figure 15). The regression
p-value is 0.05 (
Figure A14), while the residuals displays almost constant variance, independence and a good normal probability plot (
Figure A13). This model confirms the transparency between total production value and GVA in the agriculture sector.
4.8. Models Based on GVA and GDP Economic Indicators
The relation between agriculture GVA and total GVA is strongly linear (
Figure 16); the model shows independent normally distributed residuals, with constant variance, a high 91.80 R-square, a very low S-value at 0.05 and a regression
p-value at 0 (
Figure A15 and
Figure A16). As such we can determine the value for total GVA relying on agriculture GVA. As we used natural logarithms for the terms of the model, a 1.00% increase of the agriculture GVA will lead to a 0.59% increase of total GVA. This model emphasizes the importance of agriculture sector for the Republic of Moldova’s economy, as this sector can be used as a control tool to induce long term economic development.
As noticed in the
Figure 17, the relation between GDP (as predictor) and agricultural GVA (as explained variable) can be linearly expressed, having for residuals a slightly visible variation and no correlation (
Figure A17). As for the equation coefficients, they are showing that for a 1% increase in agricultural GVA, the GDP value will increase by 0.45%. This model completes the previous model, thereby emphasizing the importance of the agriculture sector in the Moldavian macro-economy.
4.9. Models Based on Agriculture Subsidies and Agriculture Loans
The model presented in
Figure 18 describes the relation between the agricultural credit and vegetables production with a regression
p-value at 0.01 (
Figure A20). Thus, this reveals that a significant part of agriculture loans is used for vegetable production. Therefore, agriculture loans can be used as control tools for maximizing the vegetable production.
An important model describes the relation between governmental agriculture subsidies as predictor and agricultural loans (
Figure 19a). With a maximum R-square of 81.40, governmental agriculture subventions explain the variability in agricultural loans.
The Versus Order chart shows no particular form of dependence of the error terms, while the distribution of the residuals, according to the normal probability plot, is normal (
Figure A21). By using a linear approach for the same scenario presented in
Figure 19a, a lower R-square is obtained, respectively 72.80% (
Figure 19). Still, as the model involves a linear equation, it is easier to numerically grasp the relation between the predictor and the dependent variable. The equation shows that for every extra 1% additional subsidies, the agricultural credit will decrease by an average of 0.83 percent. However, this negative correlation between agriculture subventions as predictor and agricultural loans is expected as they must work as complementary financing sources. In this direction, it is recommended to cover the gap between the value of governmental agriculture subsidies versus the value of agricultural loans.
At first glance it seems there is linear relation between total GDP and subsidies (
Figure 20). Still, due to a situation in which for the medium-high total GDP value there was a very low subsidy value, the model returned an R-square of only 21.40%. Removing that data point would generate the following situation: both the R-square and adjusted R-square significantly increased, and as the equation shows, for every 1 unit GDP increase the subventions will increase with 0.004 (
Figure 20a). Still, we consider the R-square to be quite low for some conclusions to be drawn. However, by analyzing
Figure 20a, after the outlier removal, the total GDP–Subsidy model returned an R-square of 55.80%. However, it is hard to identify a certain pattern between total GDP and subsidies value since the percentage of subsidized farms was less than 1%. It is possible that if the subsidies values rise the effect of this governmental financial support will be better observed in the Republic of Moldova macro-economy and, therefore, in the total GDP.
The conclusions mentioned at the previous described model (between total GDP and governmental agriculture subsidies) are confirmed by the model from
Figure 21 which describes the relation between GVA per farm and subsidies per farm and that displays some peculiarities. Even if it is not statistically relevant, with an R-square of 31.40%, it is still possible to see why the value is low (
Figure 21a,b). This is mainly due to a specific case where, for a very high value of subsidies per farm (16,100 USD) in 2014, the GVA per farm was not as high as expected, probably due to external factors. Another peculiar fact is that high values of GVA per farm are associated with low values for subsidies per farm.
Actually, subsidies per farm does not change much, while GVA per farm almost doubles, so it seems that directly, subsidies per farm does not radically influence the GVA per farm. This can be due to the direction in which subsidies are invested by farm owners.
As mentioned previously, subsidies are mainly directed toward technical investments and not to yearly production; therefore, their effect may be visible on a long-term period and during the years in which the climate change effect is more intense.
An increased agricultural GVA is associated with a constant increase in the subsidies per farm (
Figure 22). The data presents an outlier, where for a small increase in agricultural GVA there was a significant increase of subsidies per farm, probably due to external factors that were not considered. Still, the best model is obtained when we apply the log function to both predictor and dependent variable, having an R-square of 99.88 (Subsidies per farm Log = Log (Subsidies per farm) and Agriculture GVA Log = Log Agriculture GVA) (
Figure 22a).
The
Figure 23 displays how subsidies influence subsidies per farm. As it can be noticed, subsidies per farm mostly increase with the increase of subsidies. The quadratic are better representations of the current situation due to the high value subsidies per farm point, which is also associated with the highest value for subsidies. The S value, at 1502, can be considered small for a scale ranging from 2000 to 16,000. Both the agricultural GVA–subsidies per farm model and subsidies–subsidies per farm model where possible in conditions of a relatively constant dynamics of agriculture farm number. However, their significance is expected to decrease in a long-term macro-economic analysis, when agricultural farm number can register higher variations.
All models described above will contribute to a better understanding of the Moldavian agriculture sector, offering tools that can be used in order to ensure an efficient intervention that targets to maximize the performances of this sector in different scenarios and, therefore, contribute to the economic sustainability of agriculture sector.
As with the majority of studies, the design of the current study is subject to limitations. One limitation of the present paper’s analytical framework is the lack of a multifactorial connection between the economic subsystem and social and environmental subsystems. This would potentially establish a better agriculture sustainability approach. However, the economic sustainability of agricultural activities is considered the basic constraint for the survival of farm systems over time [
45]. Therefore, if agriculture sustainability is targeted, economic sustainability must be the starting point.
The second limitation concerns the economic indicators list that could be extended in order to elaborate on a more complex analytical framework. According to Latruffe et al. [
46], a wider range of indicators has been proposed to capture various economic properties of farming systems that are associated with sustainability, such as profitability, liquidity and stability or autonomy/dependence [
47]. However, subsidy-dependence can be considered an aspect of autonomy: if farms are highly dependent on public support, any policy reform that reduces subsidies could put farm sustainability at risk [
46]. Other studies [
48] that multidimensionally analyzed agricultural economic sustainability used specific indicators that analyse the imports and exports of agricultural products, as well as the gross regional product values compiled with the crop productivity indicators.
The analysis of agricultural economic sustainability can be oriented towards different types of fish farms according to their production potential. Therefore, studies which assessed the sustainable economic development for family farms [
49] developed the analytical framework based on indicators such as return on equity, return on assets, operating expense, debt to assets, debt to total output, depreciation expense or gross margin.
The economic dimension of agricultural sustainability is characterized in other studies by using various economic and socio-economic indicators [
50,
51,
52,
53,
54]. However, the evaluation of the economic sustainability of farms involves a wide range of sustainability themes that are difficult to combine in a unique approach [
50,
51]. Therefore, by using a multifactorial approach that considers labor, land profitability and productivity, as well as vitality marginalization, diversification of farmer labor, competitiveness, incidence of agricultural value added and fixed investment in agriculture, Dillon et al. 2014 [
53] concludes that efficient agricultural structures, appropriate technologies as well as the diversification of income sources for farms are critical elements for the achievement of the agricultural sector’s economic sustainability. Other studies [
50,
54] concluded that the diversification of farm activities significantly contributes to the economic sustainability of agriculture, while using an analytical framework structured on the following indicators: value of production, value added, farm ability to generate income, autonomy, diversification of the production, business diversification and multifunctionality.
The third limitation of the present study concerns the lack of governance and institutional capacities indicators. This is because governance is an essential driver of both agricultural productivity and sustainability in developing countries [
55]. However, those indicators are related to agricultural policies and technological interventions that would rather concern the political economy approach, although correlating the two sustainability subsystems (economic and political subsystems) could raise the analytical framework level of complexity.
However, analytical framework studies that are predominantly based on economic and production indicators revealed that the effect of agricultural GDP growth on poverty reduction is at least twice as high as the effect of GDP growth coming from other sectors.
For the Republic of Moldova’s agriculture, analytical framework studies were conducted in order to increase the competitiveness of the horticultural sector [
56]. This revealed that with the increase of the share of the horticultural production sales income regarding the total sales income, being more than 20%, the enterprises will be more competitive on the market, registering higher values of total productivity factors. Furthermore, a study [
56] confirmed that horticulture may represent a solution for developing the Moldavian agriculture sector. This is due to the fact that the agriculture farms that had a share of the horticultural production sales income in total sales income of more than 20% performed better in terms of financial productivity.
However, no similar studies concerning the economic sustainability of the Republic of Moldova’s agriculture sector were found in the literature.
The present study confirms that agriculture subsidies and agriculture loans can be also used directly in order to raise the share of agriculture GDP in total GDP. However, Lopez et al. [
57] in their study related to agriculture subsidies in China has issued a hypothesis according to which the larger the share of agriculture is in the economy, the costlier it will be to subsidize; also, in the long term, subsidy governmental programs may cause farm dependence [
46] and if stopped or reduced, may cause significant economic disturbances. In the present study, an indirect correlation is observed between governmental agriculture subsidies value and agriculture loans. In spite of this correlation, the value of subsidies is considerably low compared to agriculture loans and only a small percentage of total agriculture farms managed to access them during the analyzed years. Thus, agriculture governmental subsidies cannot be considered financial sources for the substitution of agriculture loans. However, the relation between agriculture loans and subsidies presented in present study can be attributed to the fact that, in general, subsidy financing programs are a result of governmental policy intention of supporting the agricultural economic sector during a certain period of time. Therefore, the high level of governmental subsidies is proportional with other measures, both being part of governmental support programs which targets to improve the economic sustainability of agriculture sector. Therefore, the dynamics and size of subsidies can emphasize the intensity of governmental supporting program of which they belong rather than its real financial value. This hypothesis can also explain the direct correlation between the value of farm subsidies and agriculture GVA. Thus, if the subsidies’ size and dynamics reveal the intensity of then governmental supporting program, this must be observed on the agricultural GVA dynamics. However, the relationship between the agriculture sector’s performance and governmental supporting programs intensity can be inverse [
58] if inconsistent financing policy is applied over long periods—the increase of financial support must be applied before a relative downsizing of the agriculture sector. Recent studies [
59] have revealed the positive effect of subsidies in modern maize agriculture, only if this financial support is invested in crop-growing technology, specifically in seeds and fertilizers. Therefore, Vozarova and Kotulic [
40] concluded that removal of agricultural subsidies would contribute to increasing the income disparities between rural and urban areas, which would lead to an exit of domestic farmers from the industry. For this reason, according to Won and Kennedy [
60] most countries use some form of subsidy in order to protect their agriculture, since studies [
61] have been proven it to be the most effective mechanism for accelerating the growth of the agricultural sector. However, although several studies proved the effects of subsidies and other financial tools on productivity [
62,
63,
64] or the efficiency of agriculture [
65,
66,
67,
68,
69], the subject still remains open for discussion, as it depends on numerous series of climate, social or political variables.
In present study, the significantly high correlation between total GVA and agricultural GVA reveals the significant influence of the agriculture sector in assuring and improving the Republic of Moldova’s economic performance. This confirms the findings of Timofti et al. [
3], who emphasized that the financing and developing of the Moldavian agriculture sector is a cornerstone in achieving modernization; also, Dinu et al. [
19] encourage the development of the agriculture sector since it has great importance for the economic growth of the Republic of Moldova. A country that is not self-sufficient in food production can be more vulnerable to commercial pressure and the global food crisis [
70].
The direct correlations between agricultural loans and vegetable production can be due to the peculiarities of vegetables production systems. Therefore, most of the vegetable production is obtained in greenhouse, intensive crop production systems, since the seasonality of these crops can significantly influence their profitability [
6]. Thus, the influence of the agricultural loan value on vegetable production can be justified because the production intensity of greenhouse-based systems is significantly dependent on the level of financial investment in high-performance equipment, which assures a maximization of growth performance and a good seasonality compared to the competitors from other countries.
The present study also emphasizes the importance of Moldavian wheat production for the economic growth. Therefore, a direct correlation was identified between wheat production value and total GVA. Wheat and maize production quantity is also strongly and directly correlated with total plant production, revealing the importance of the production performance of these two crops for the Moldavian agriculture sector. Thus, the policy of supporting the improvement of production technologies for maize and wheat in order to maximize their growth rate can raise the economic sustainability of the agriculture sector.
Although advanced data analysis frameworks are performed, it is hard to establish a general model that will perform perfectly in all circumstances. This was also confirmed by Nowak et al. [
71], who argue that to evaluate the performance and effectiveness of agriculture is quite complicated, not least due to the instability of the climatic conditions but also due to the wide variety of households in view of their economic strength and production profile.
5. Conclusions
The agriculture sector has a major impact on the Moldavian economy, a fact revealed by the significant model between agricultural GVA and total GVA. The Republic of Moldova’s agriculture policies must focus on maintaining a high and constant financial standard for governmental agriculture supporting program, in order to improve the economic sustainability of this production sector. However, a negative significant correlation was identified between agriculture subsidies supporting programs and agriculture loans. Therefore, it is recommended to assure the complementarity of the two funding sources (agriculture supporting programs and agriculture loans), in order to obtain a better economic performance of the agriculture sector.
The supporting programs prove to be highly efficient for increasing the production quantity of crops cultivated in greenhouse, intensive production systems, such as vegetables. Thus, since vegetable production has both a social and economic impact (improving the living standards of rural communities and increasing the agri-food exports) it is recommended to continue and even increase the governmental agriculture supporting programs for maximizing the production of these crops.
The Moldavian agriculture sector recovered its production potential after the drop registered in the year 2012 caused by drought and after the restrictions imposed by the Russian Federation on Republic of Moldova agri-food imports and exports, between the years 2013–2014. The direct significant correlation model between the wheat and maize production and total agriculture production reveals the importance of these crops to the Moldavian economy. It is recommended to focus the governmental financial support on improving the technologies that lead to a superior productivity of these crops in order to improve the economic sustainability of the Moldavian agriculture sector.
Future avenues of research should target the improvement of the present analytical framework by expanding the current dataset with other indicators, describing the existing relations between the economic, social and environmental systems so it could be used as an efficient tool for identifying better agricultural sustainable strategies. As such, since the complexity of the analytical framework is positively influenced by the number of analyzed parameters and the dataset size, other relevant economic indicators like liquidity, stability, autonomy/dependence, return on equity, return on assets, operating expense, debt to assets, debt to total output, depreciation expense, gross margin, farm ability to generate income, diversification of the production and, also, business multi-functionality, are recommended to be added in the analysis.
Moreover, the Republic of Moldova’s governance and institutional capacities can provide relevant parameters in enhancing the agriculture sector’s analytical framework, so the political system could be also linked to the economic, social and environmental systems. Lastly, as more data would be available, several other modelling techniques could be used. For example, future studies could consider multiple linear regressions enhanced by using lasso, ridge or elastic net regularization methods; support vector regressions; or an extended array of ensemble learning prediction methods like Ada Boost, Gradient Boosting, XGBoost, Bagging, GBM and CatBoost.

 ,
, 


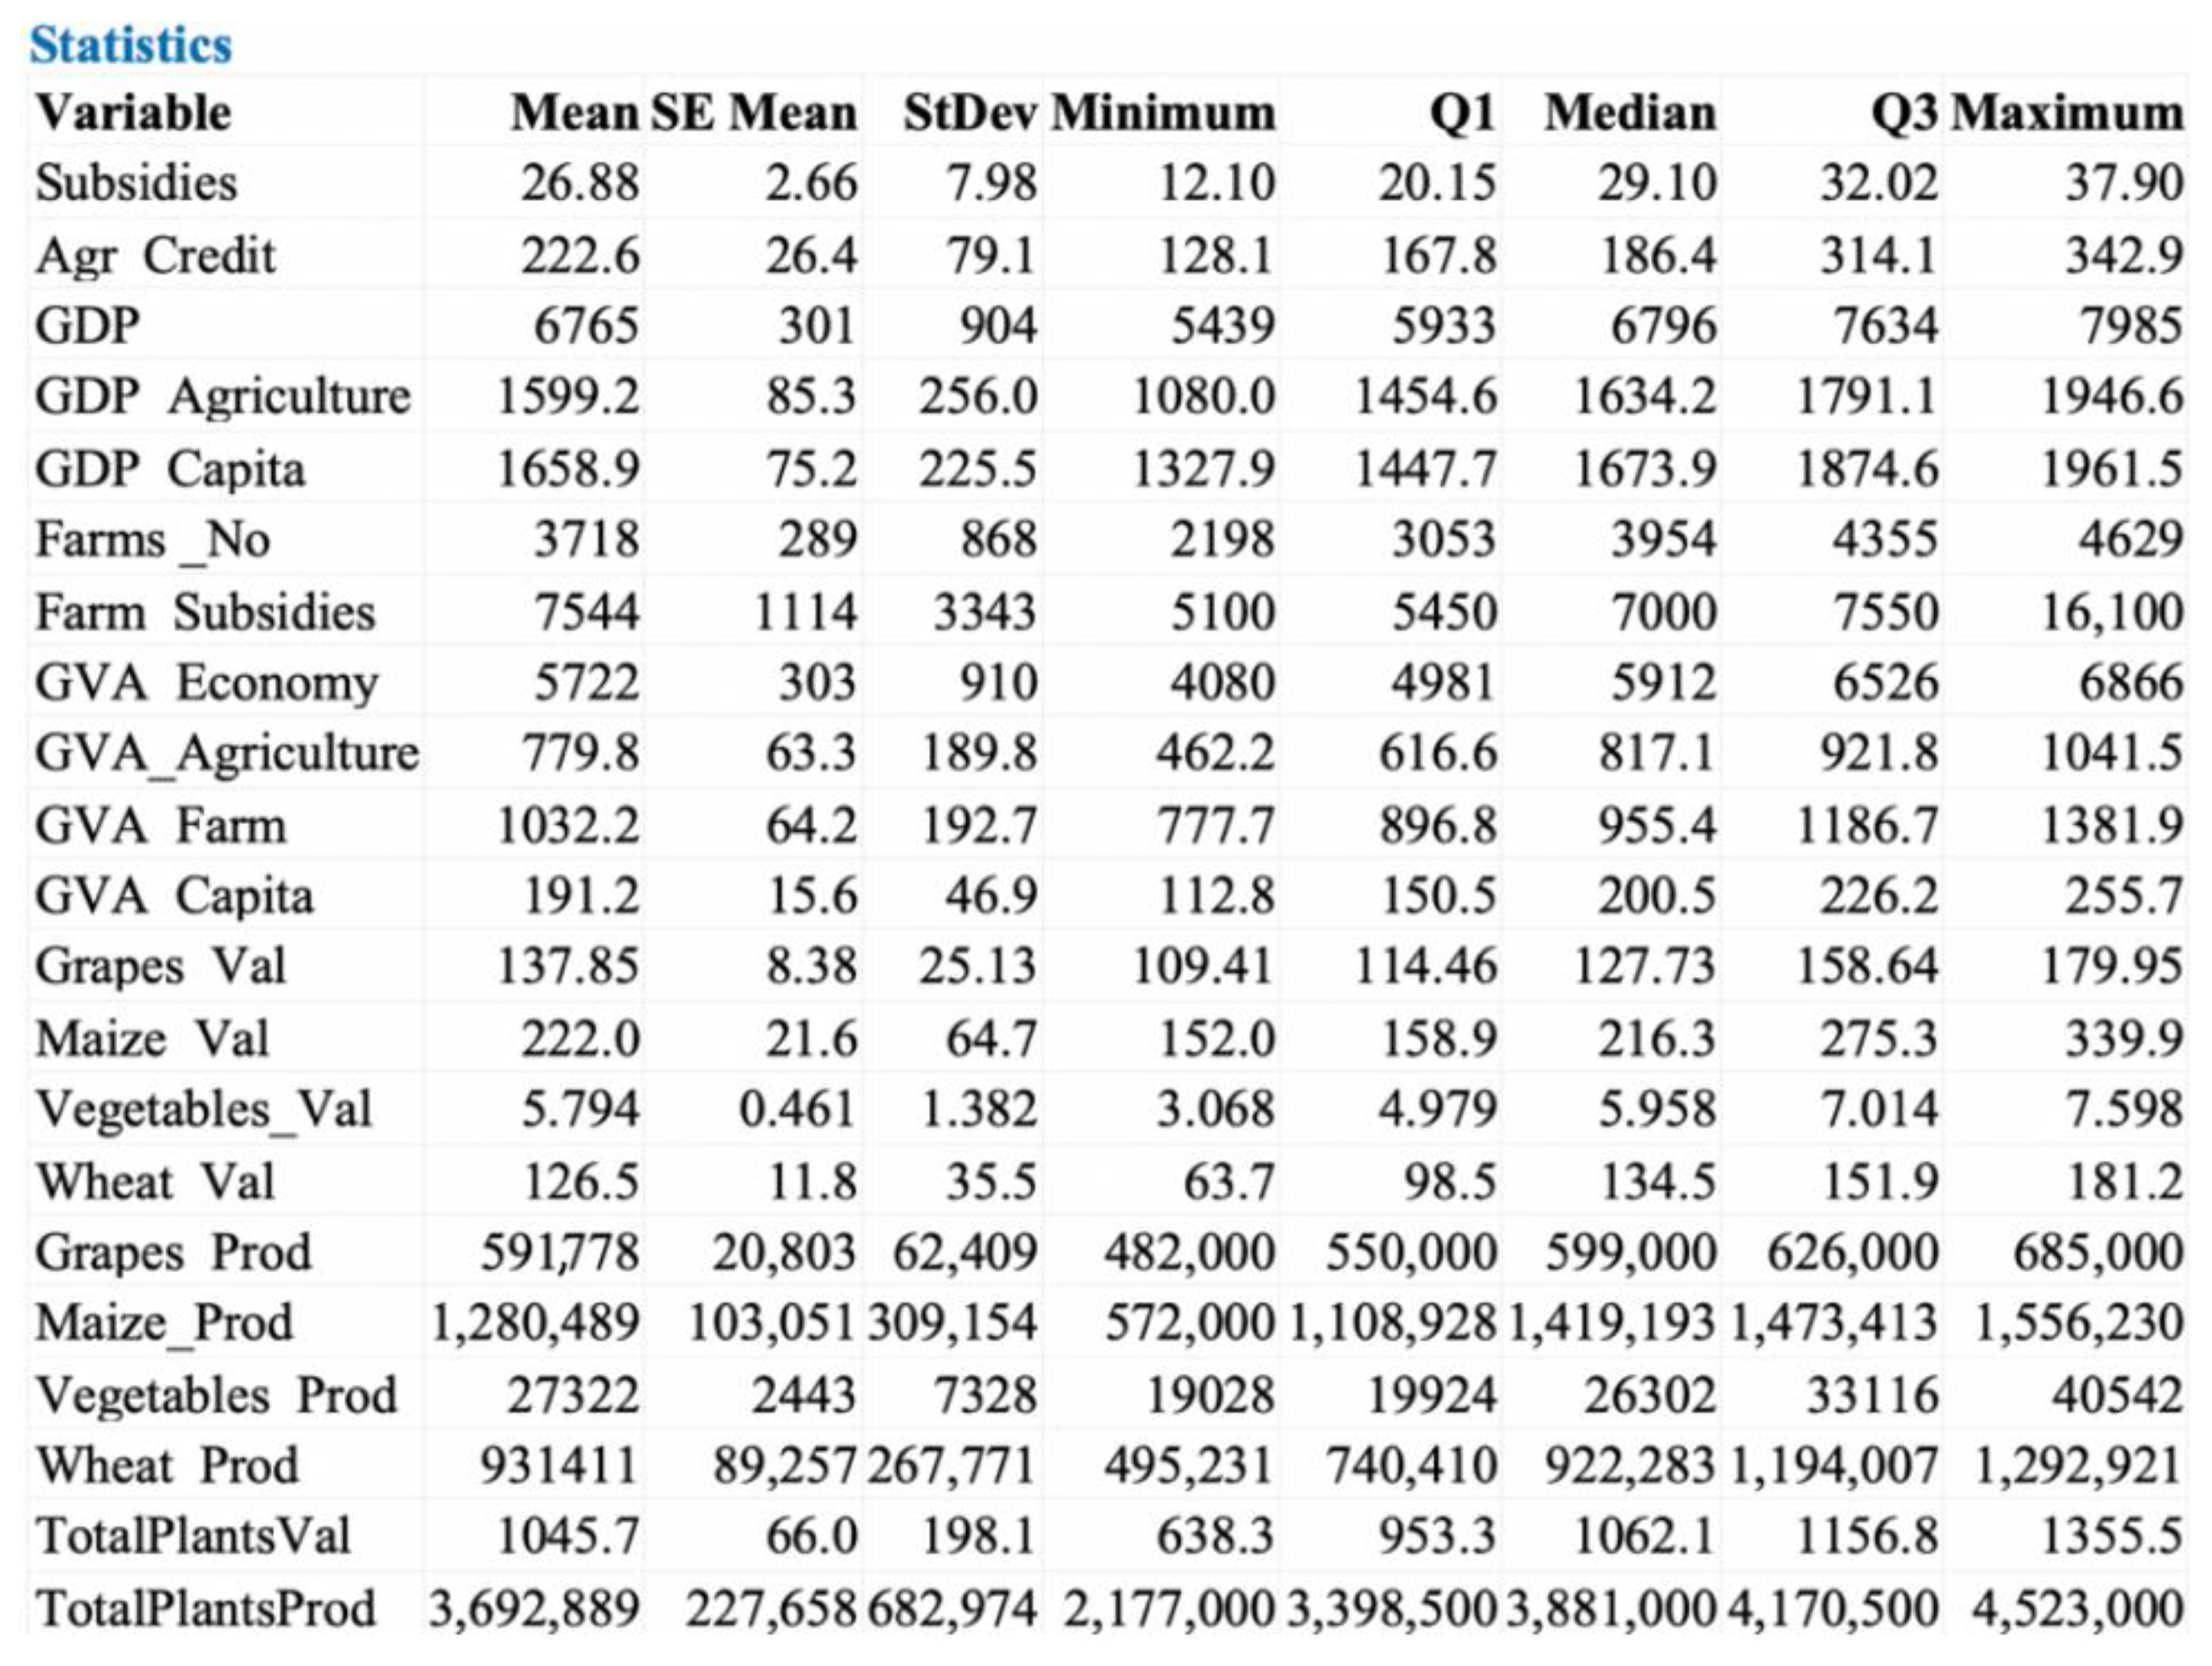
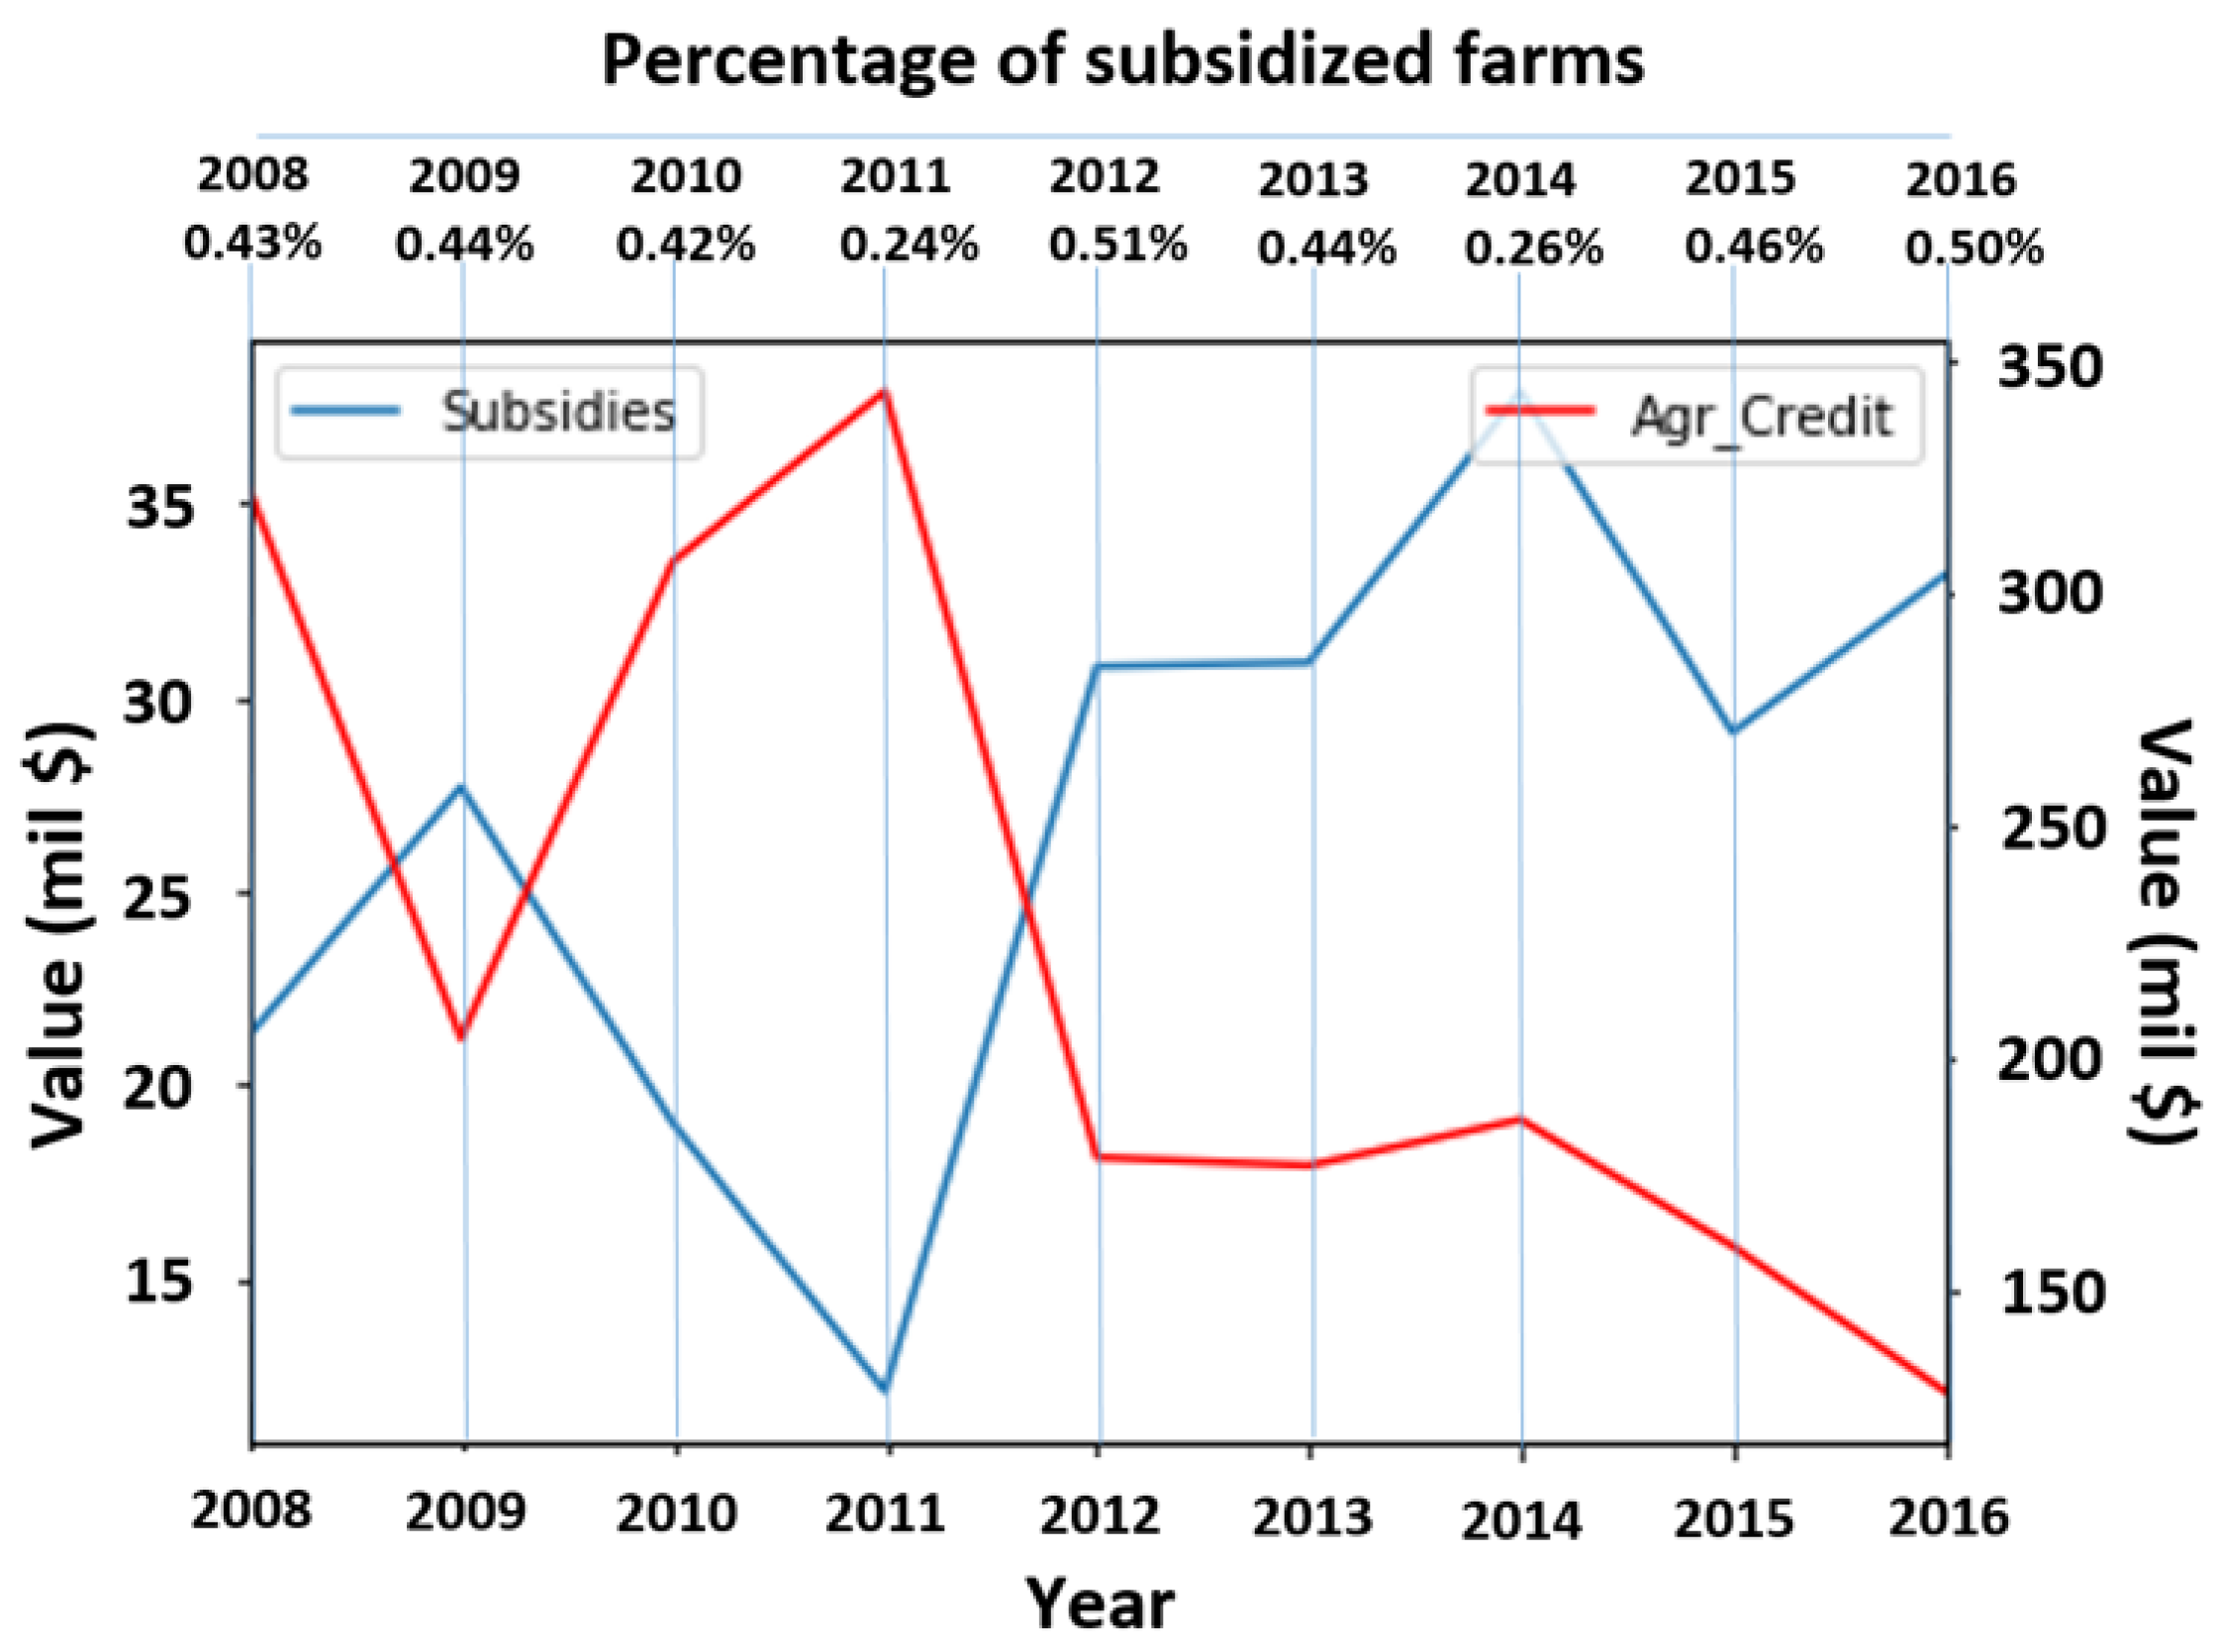
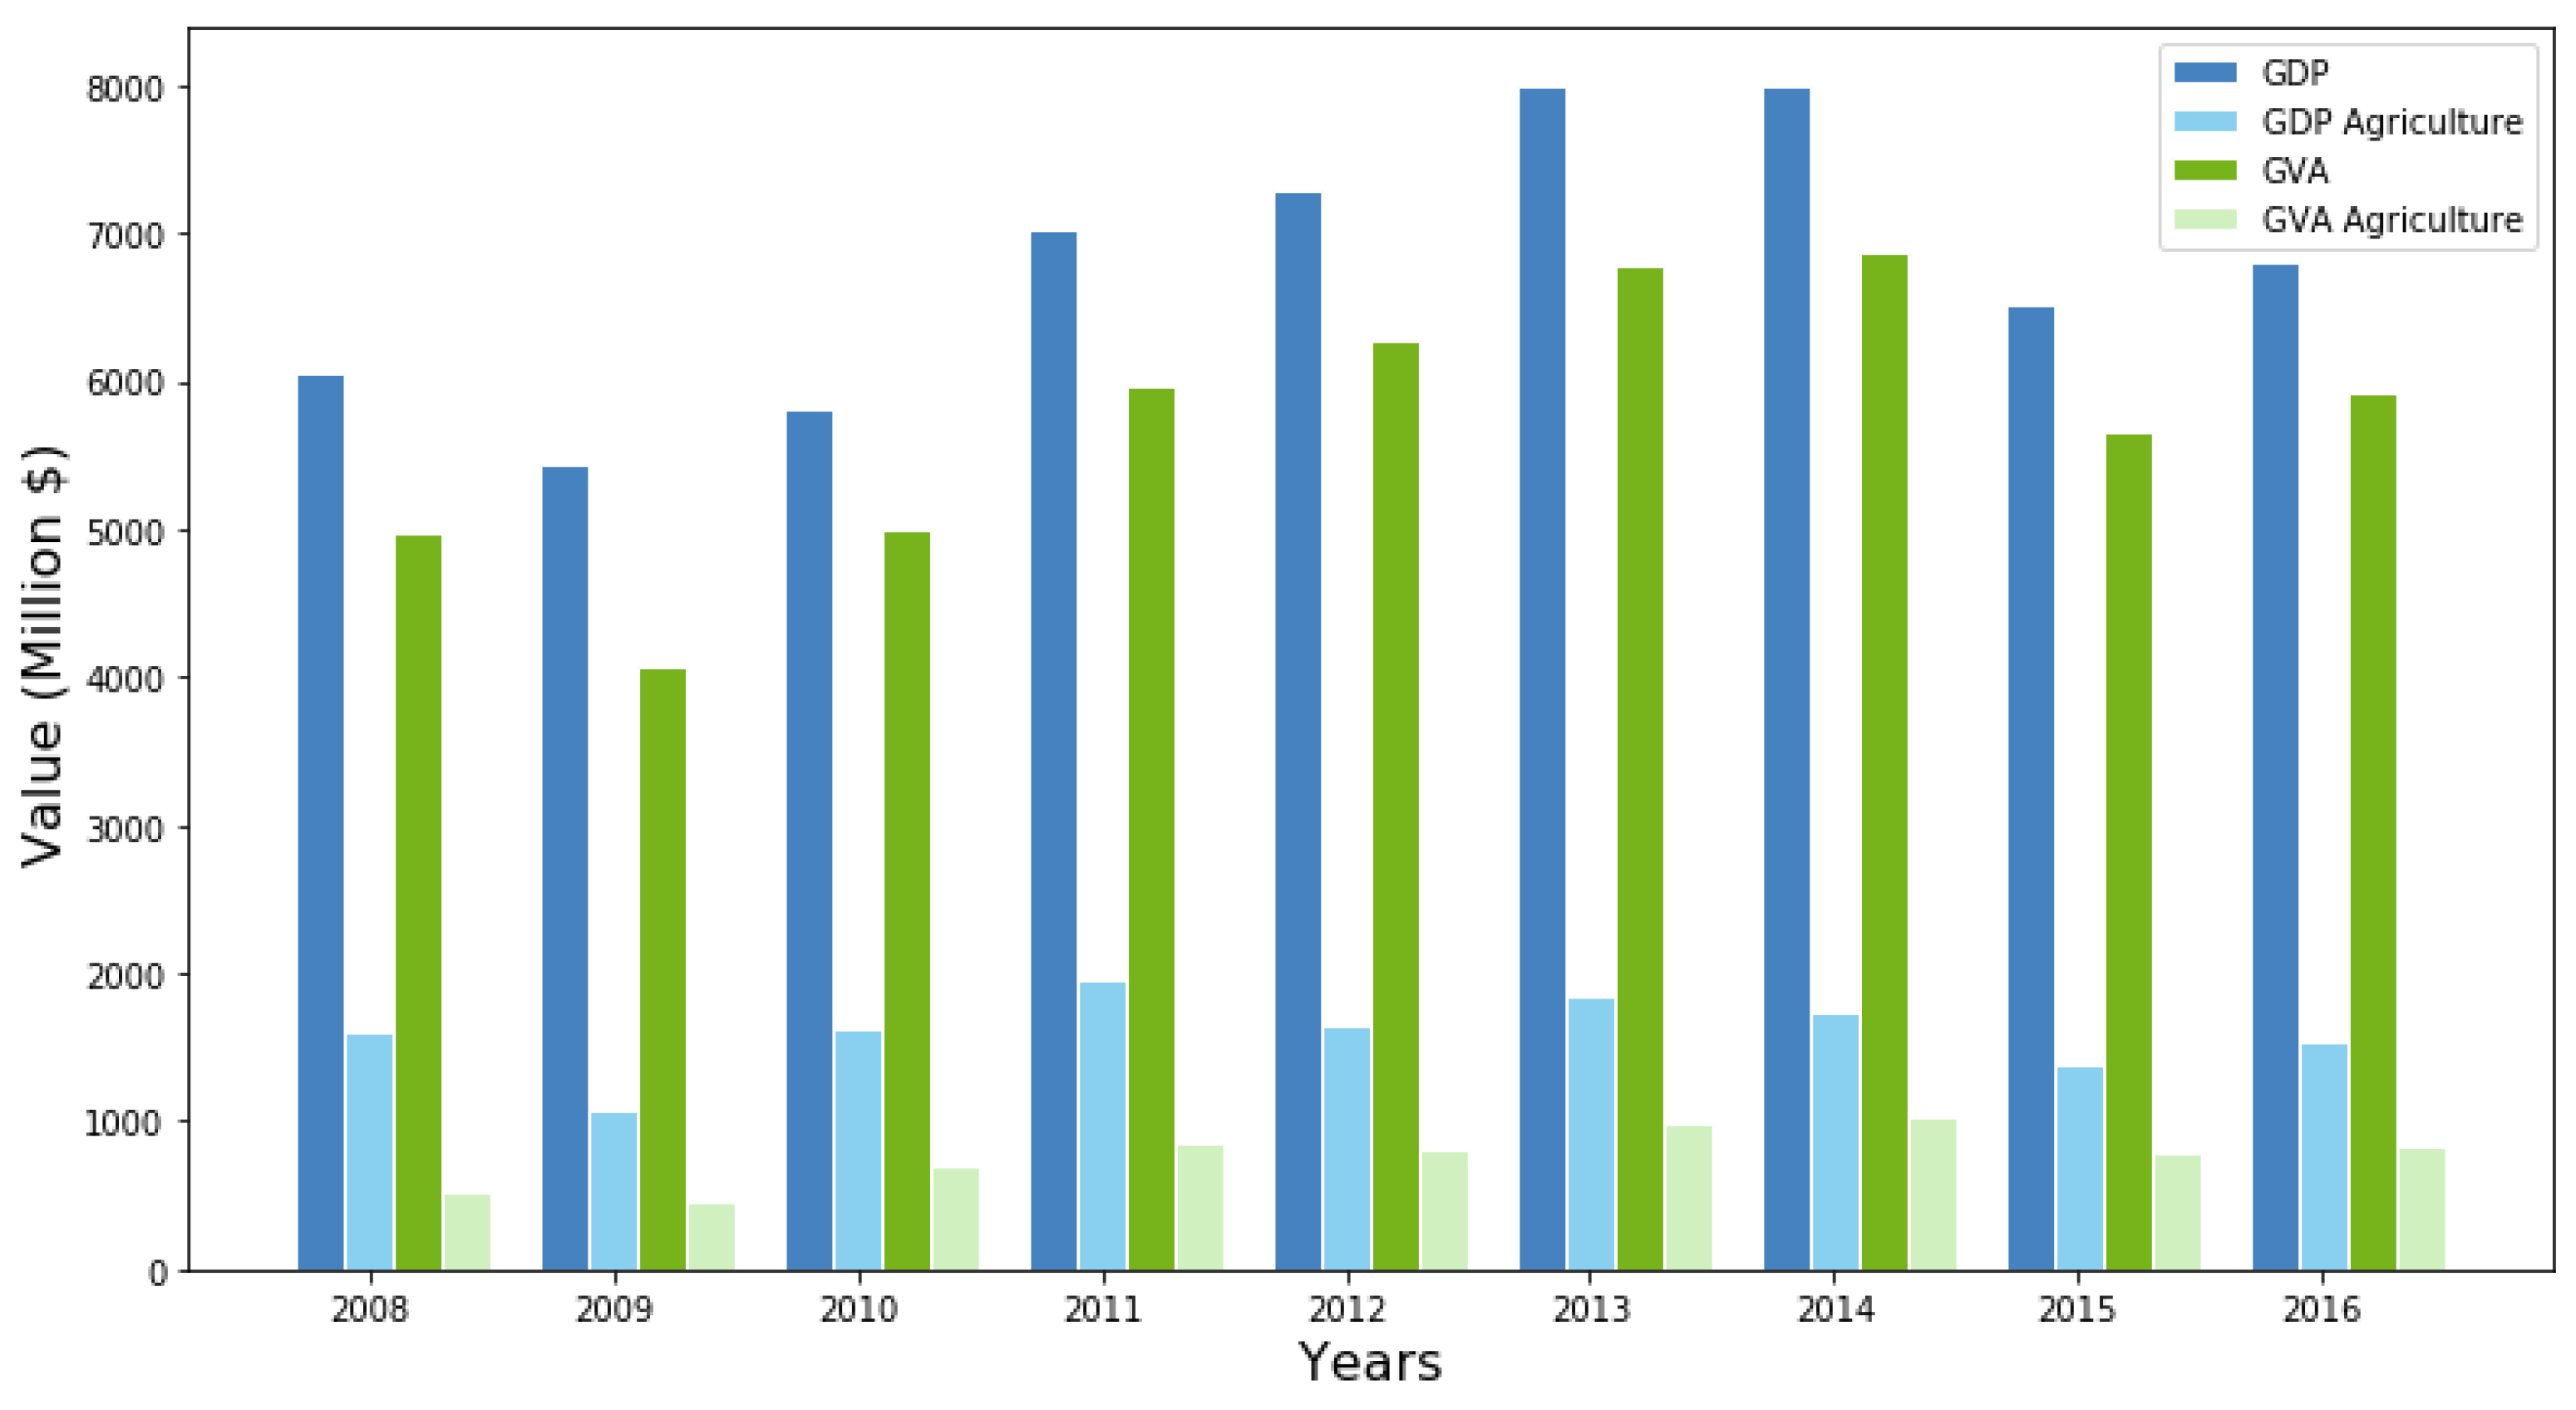
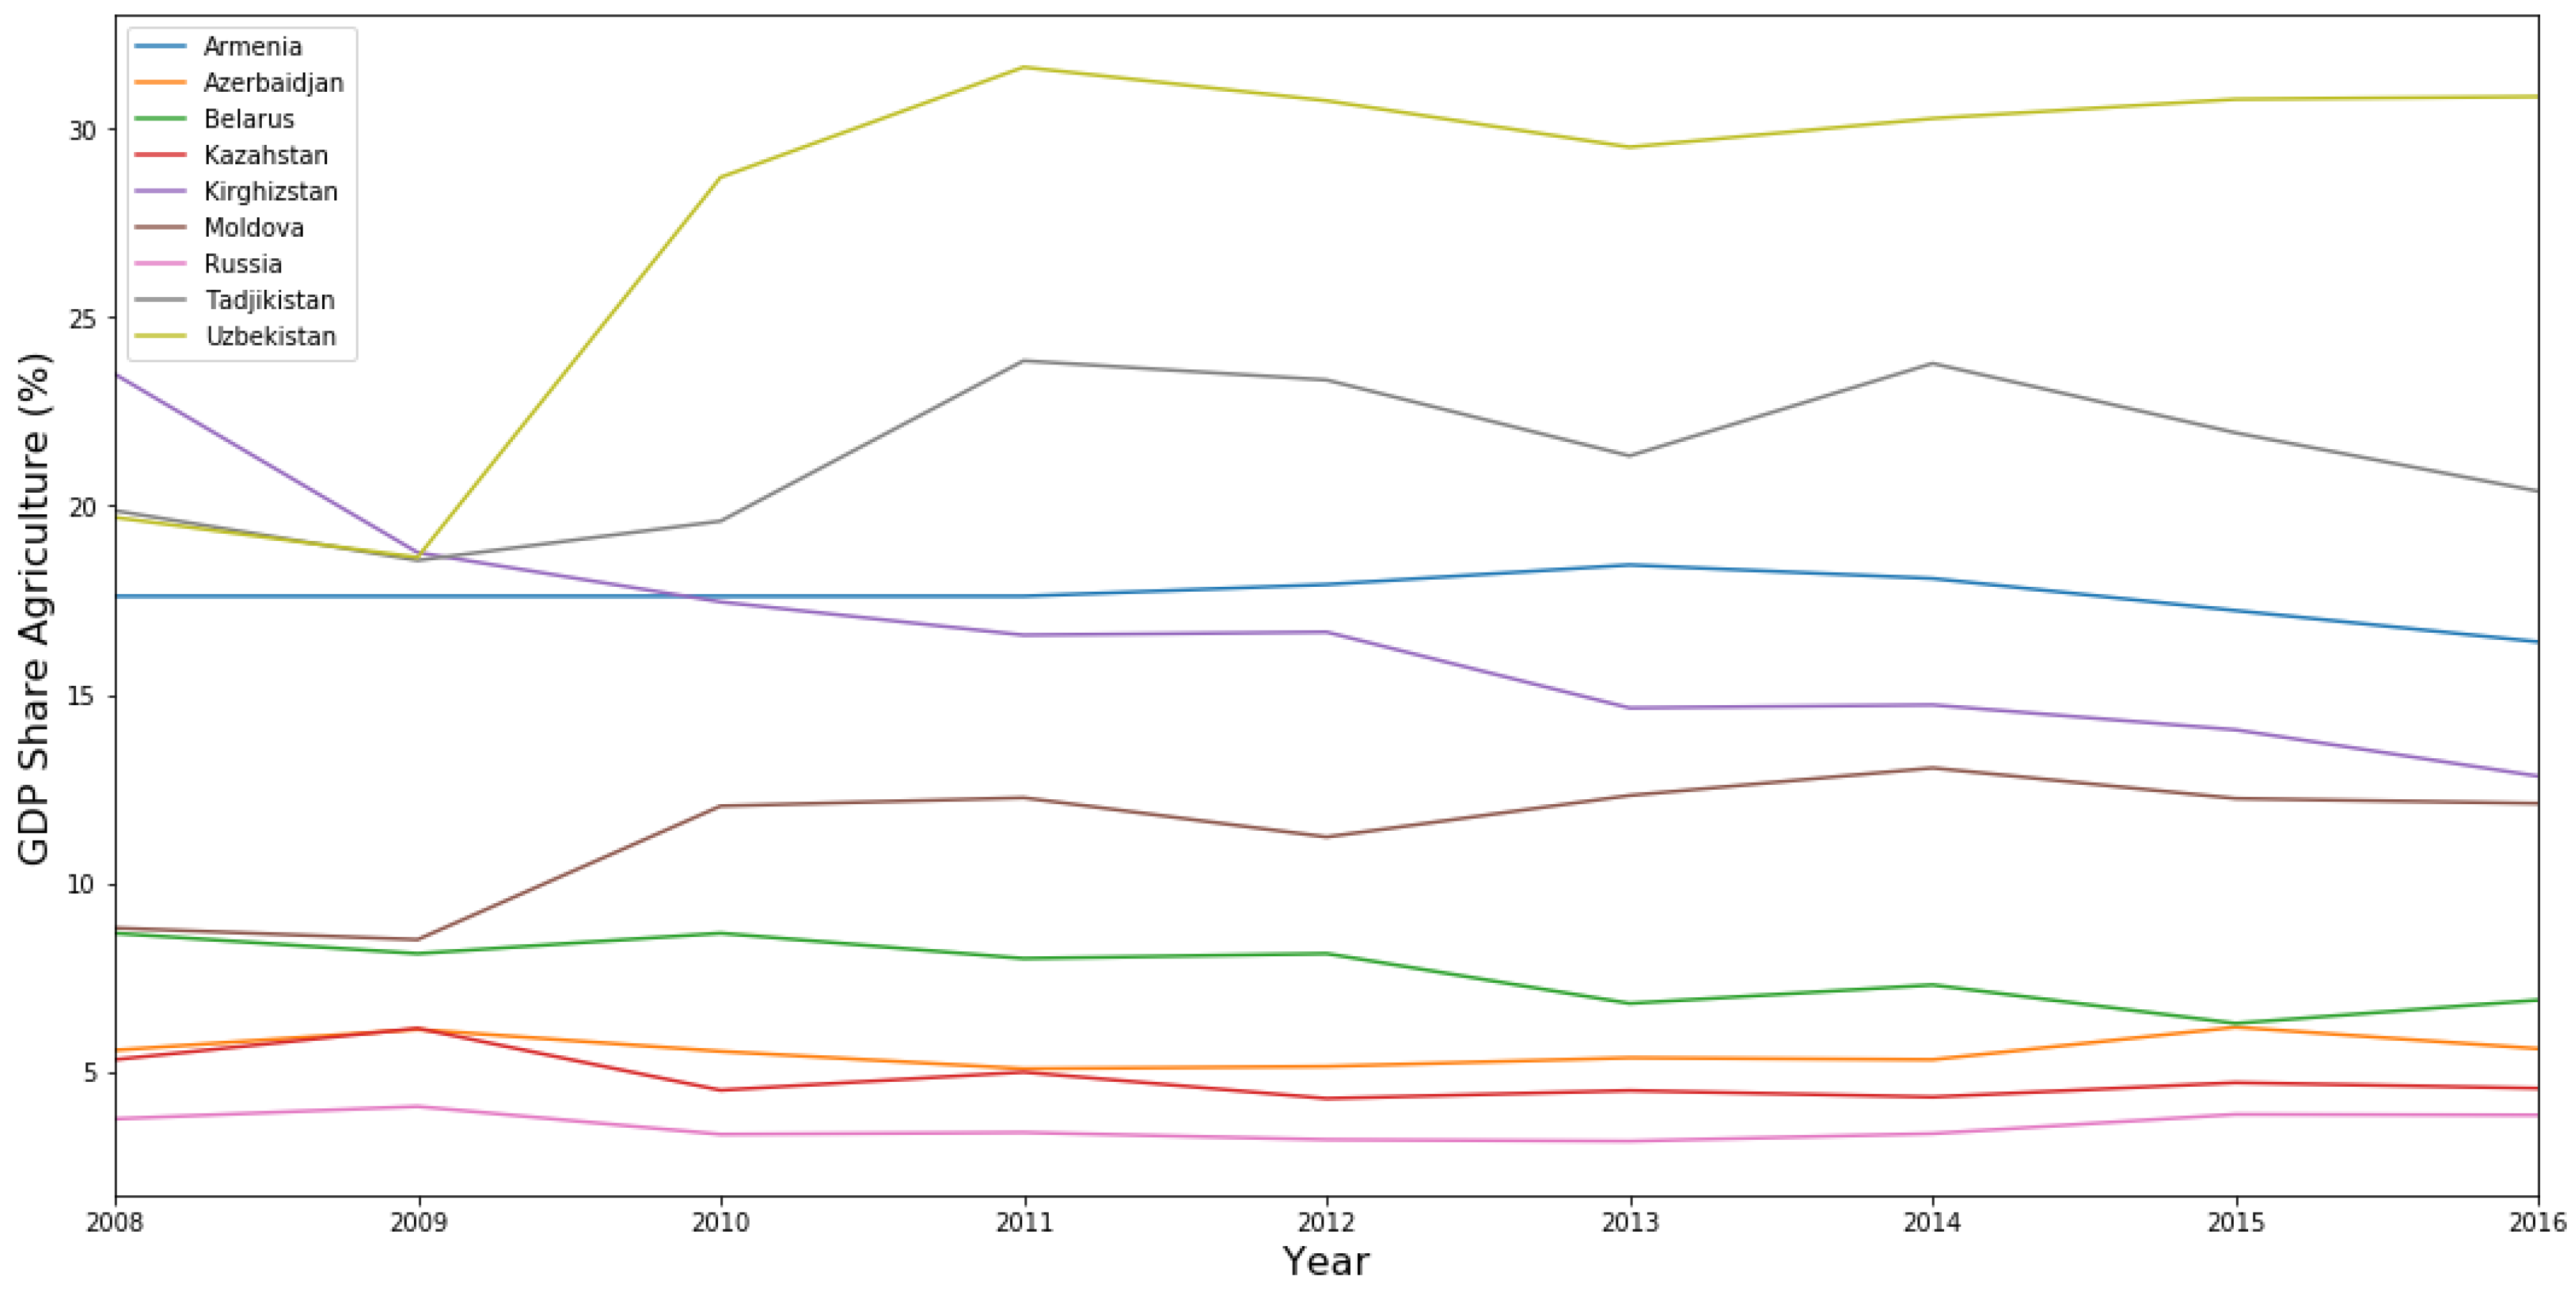
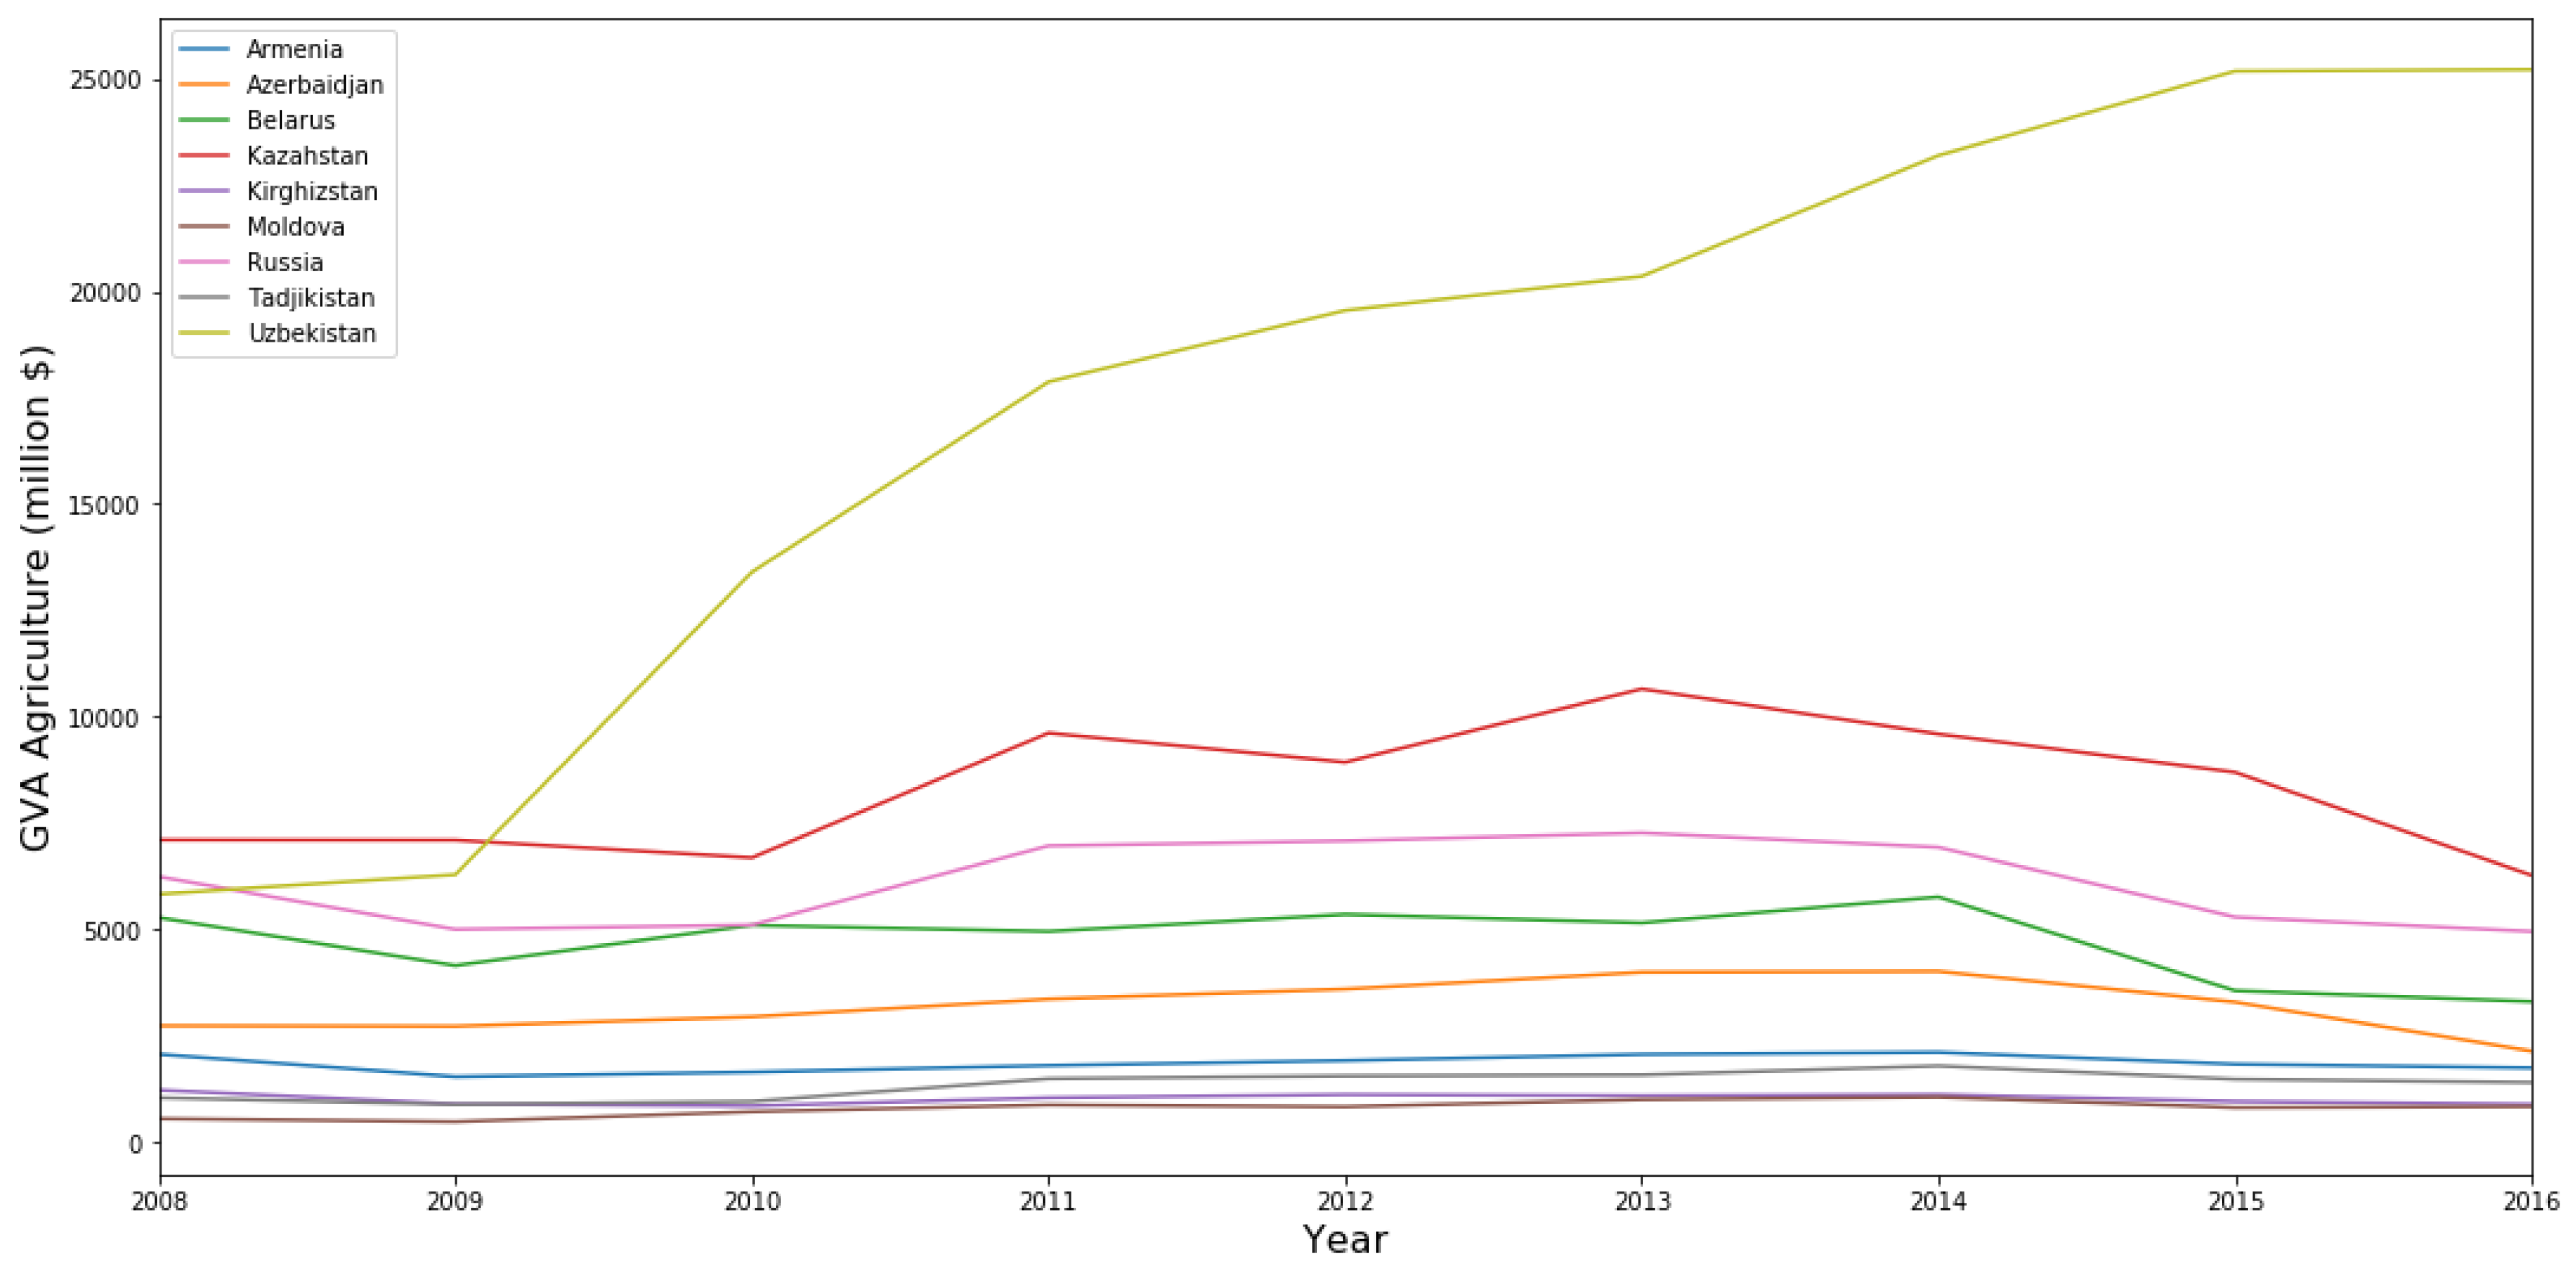
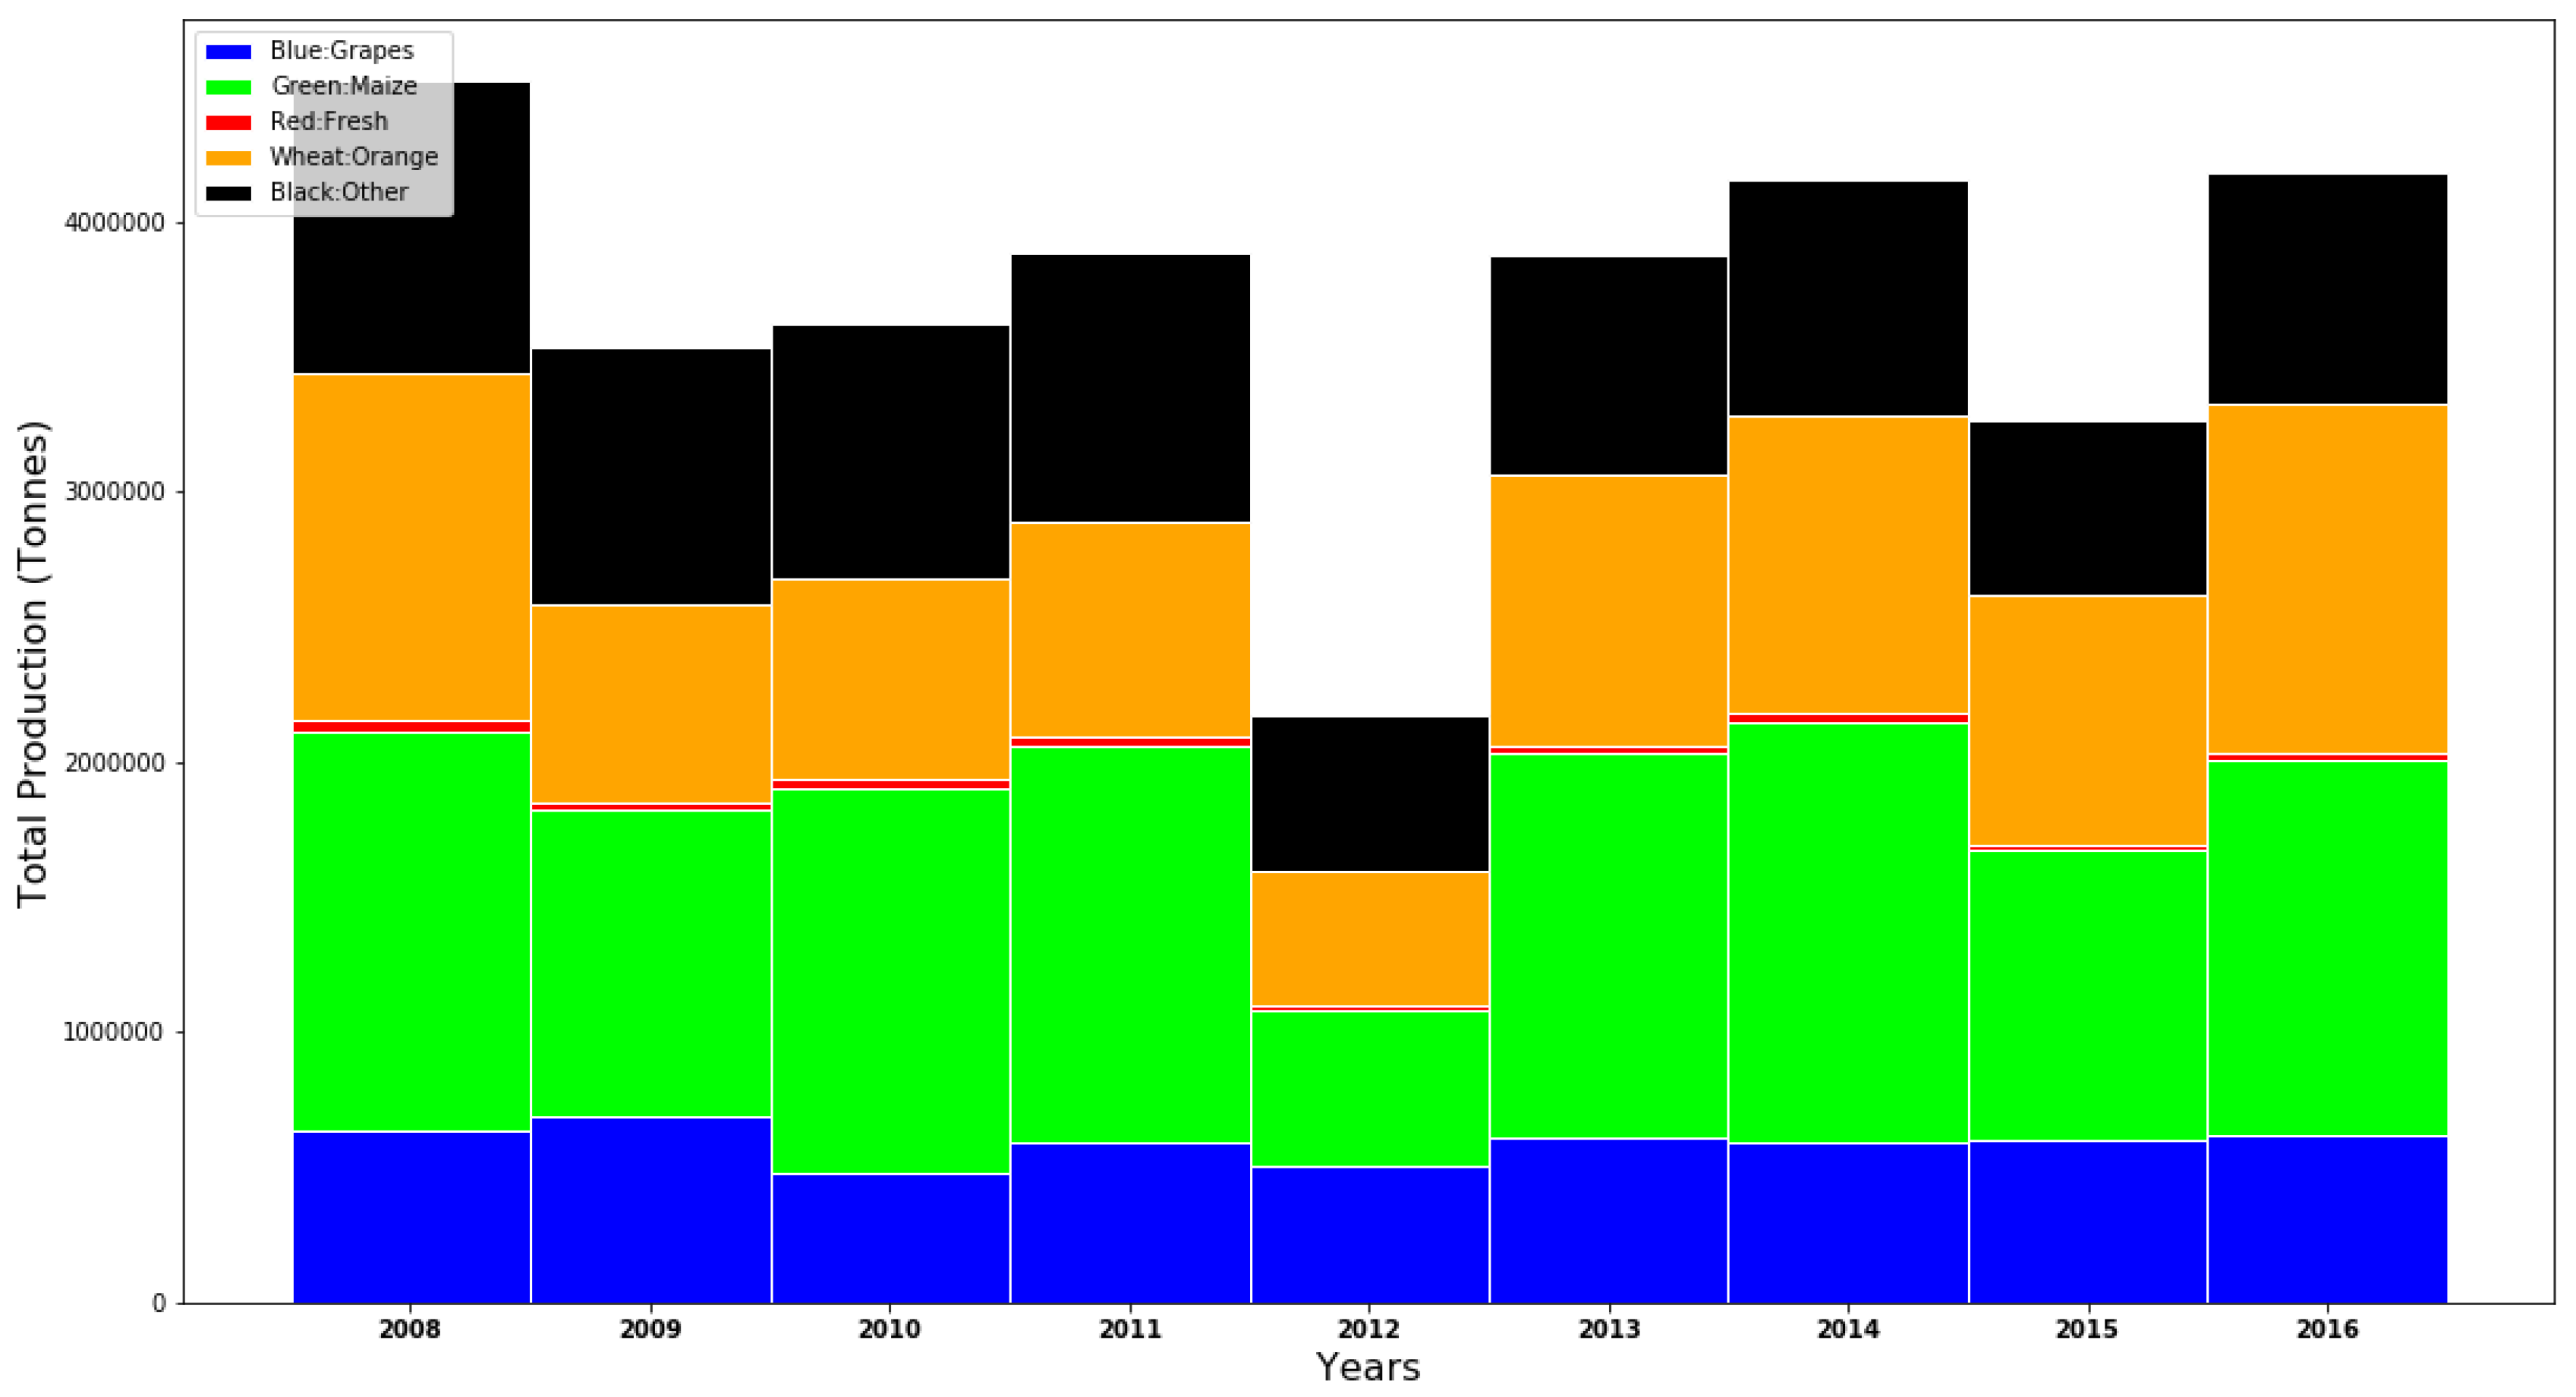
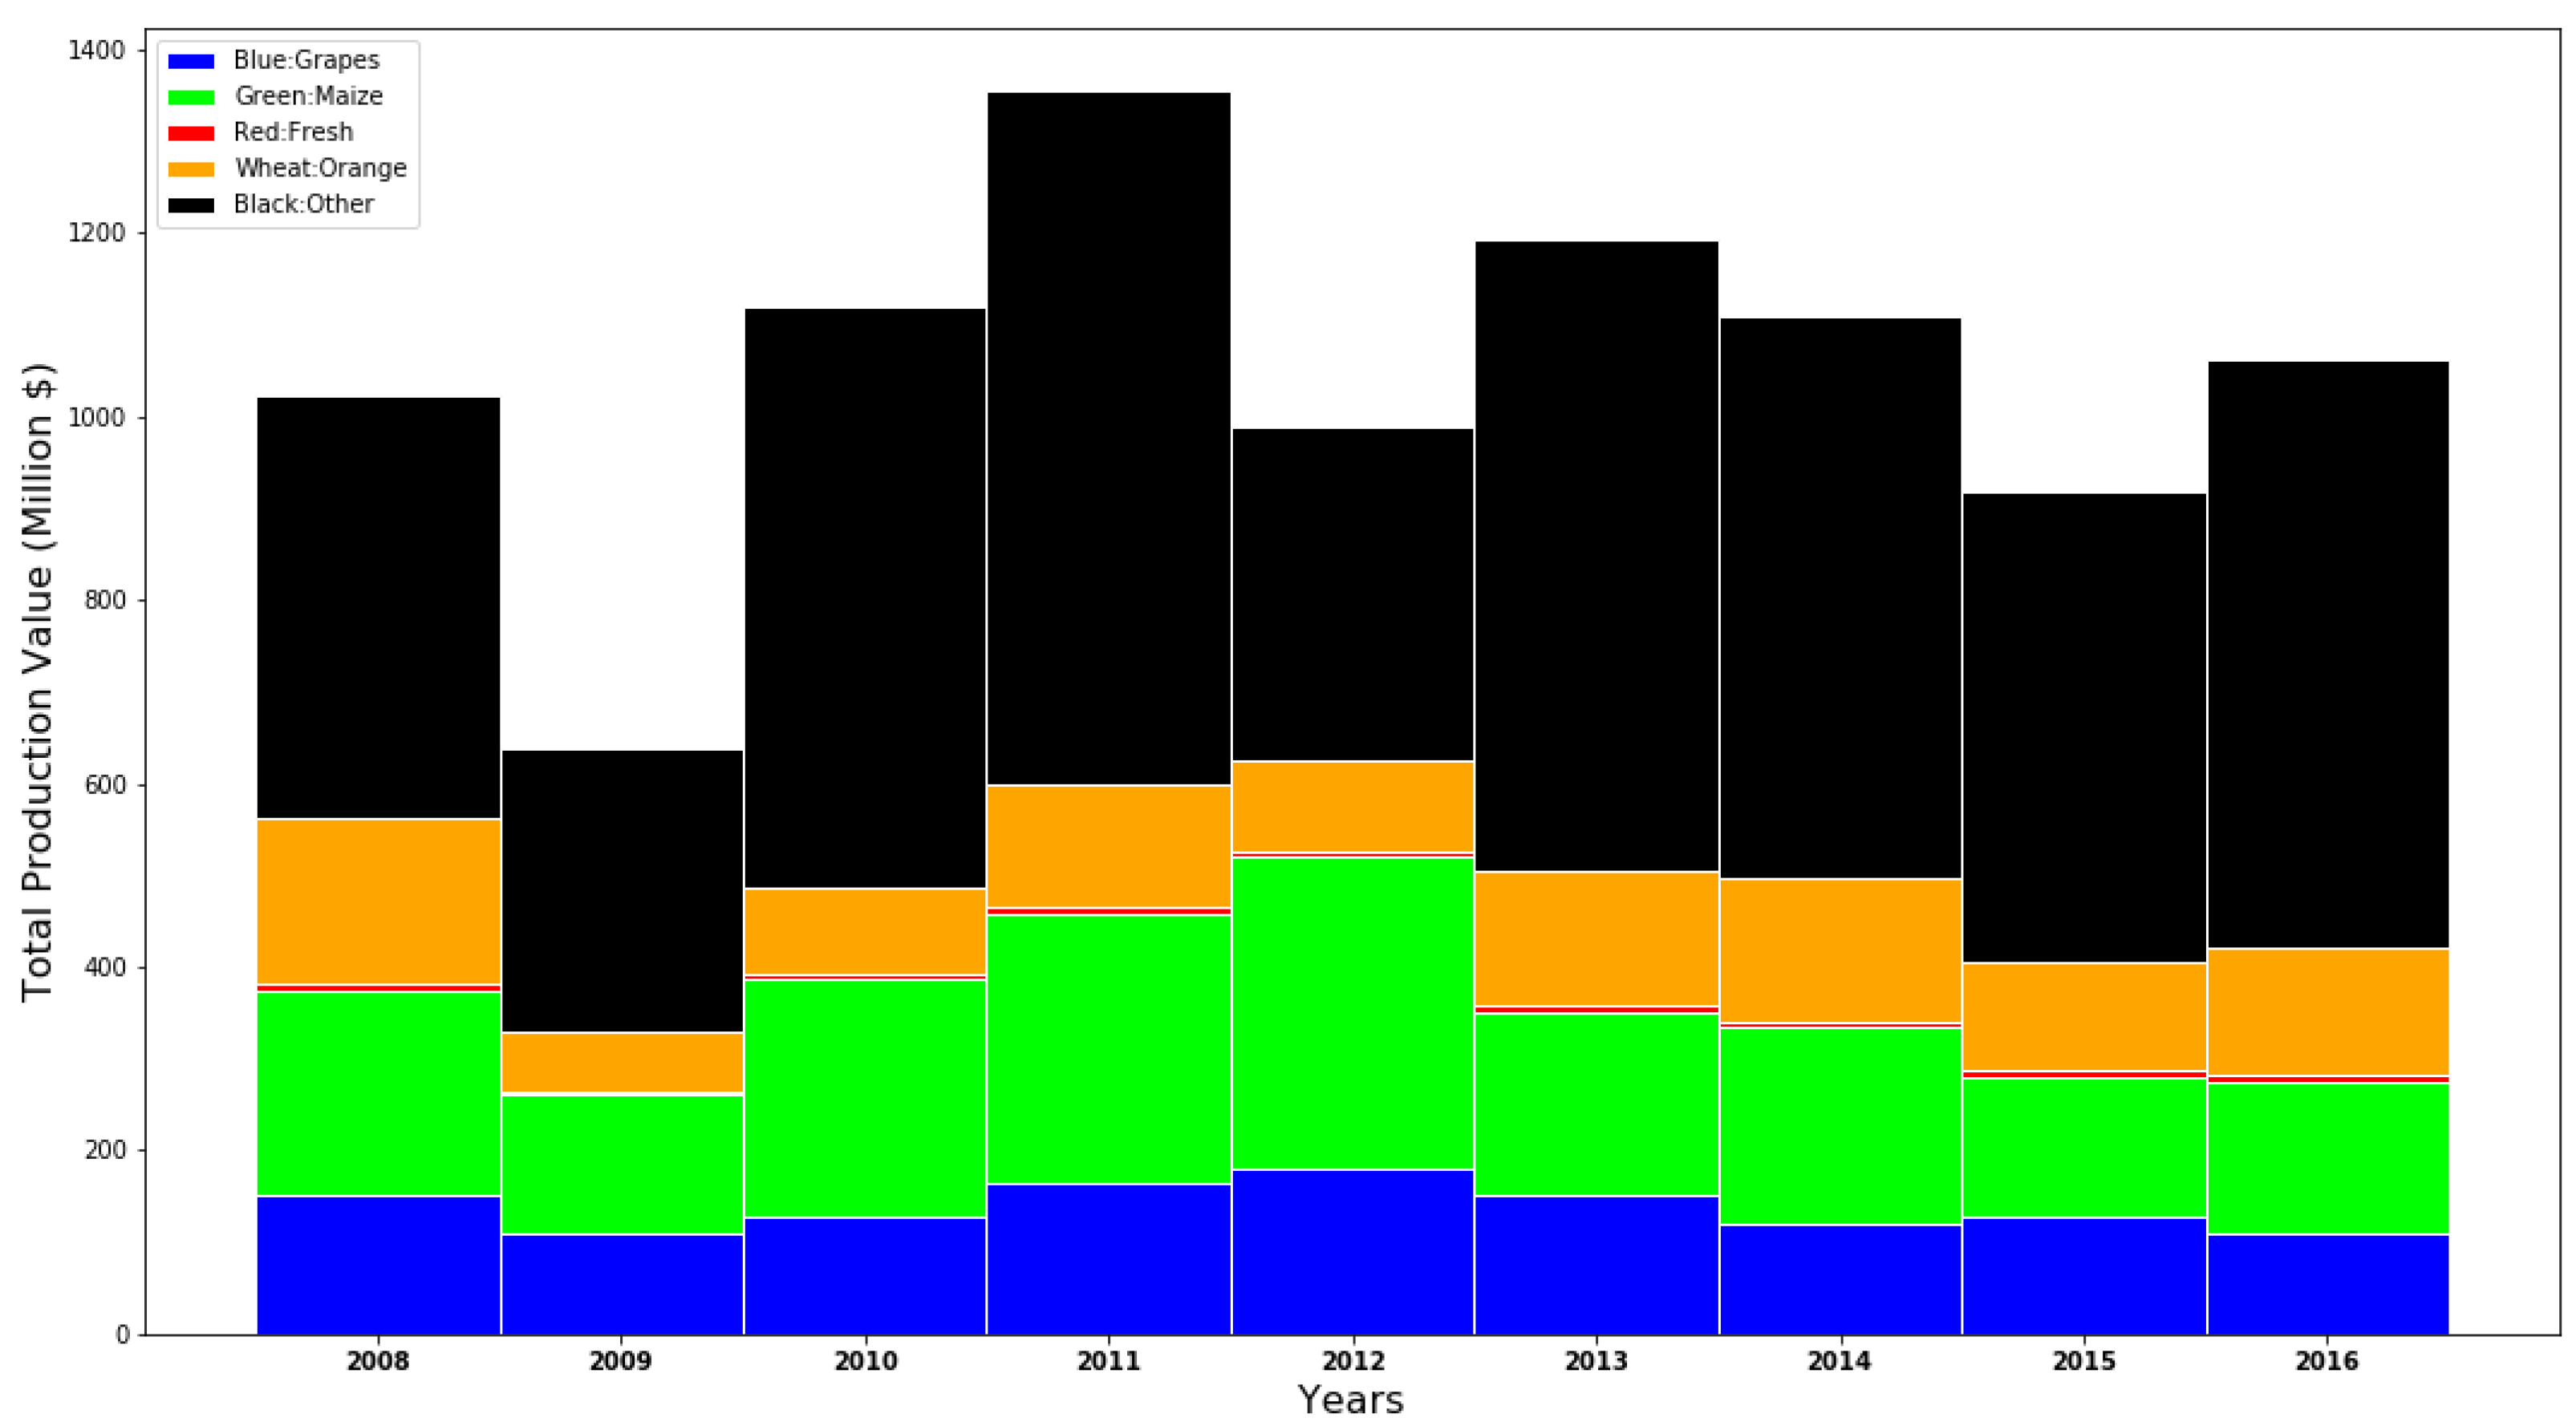
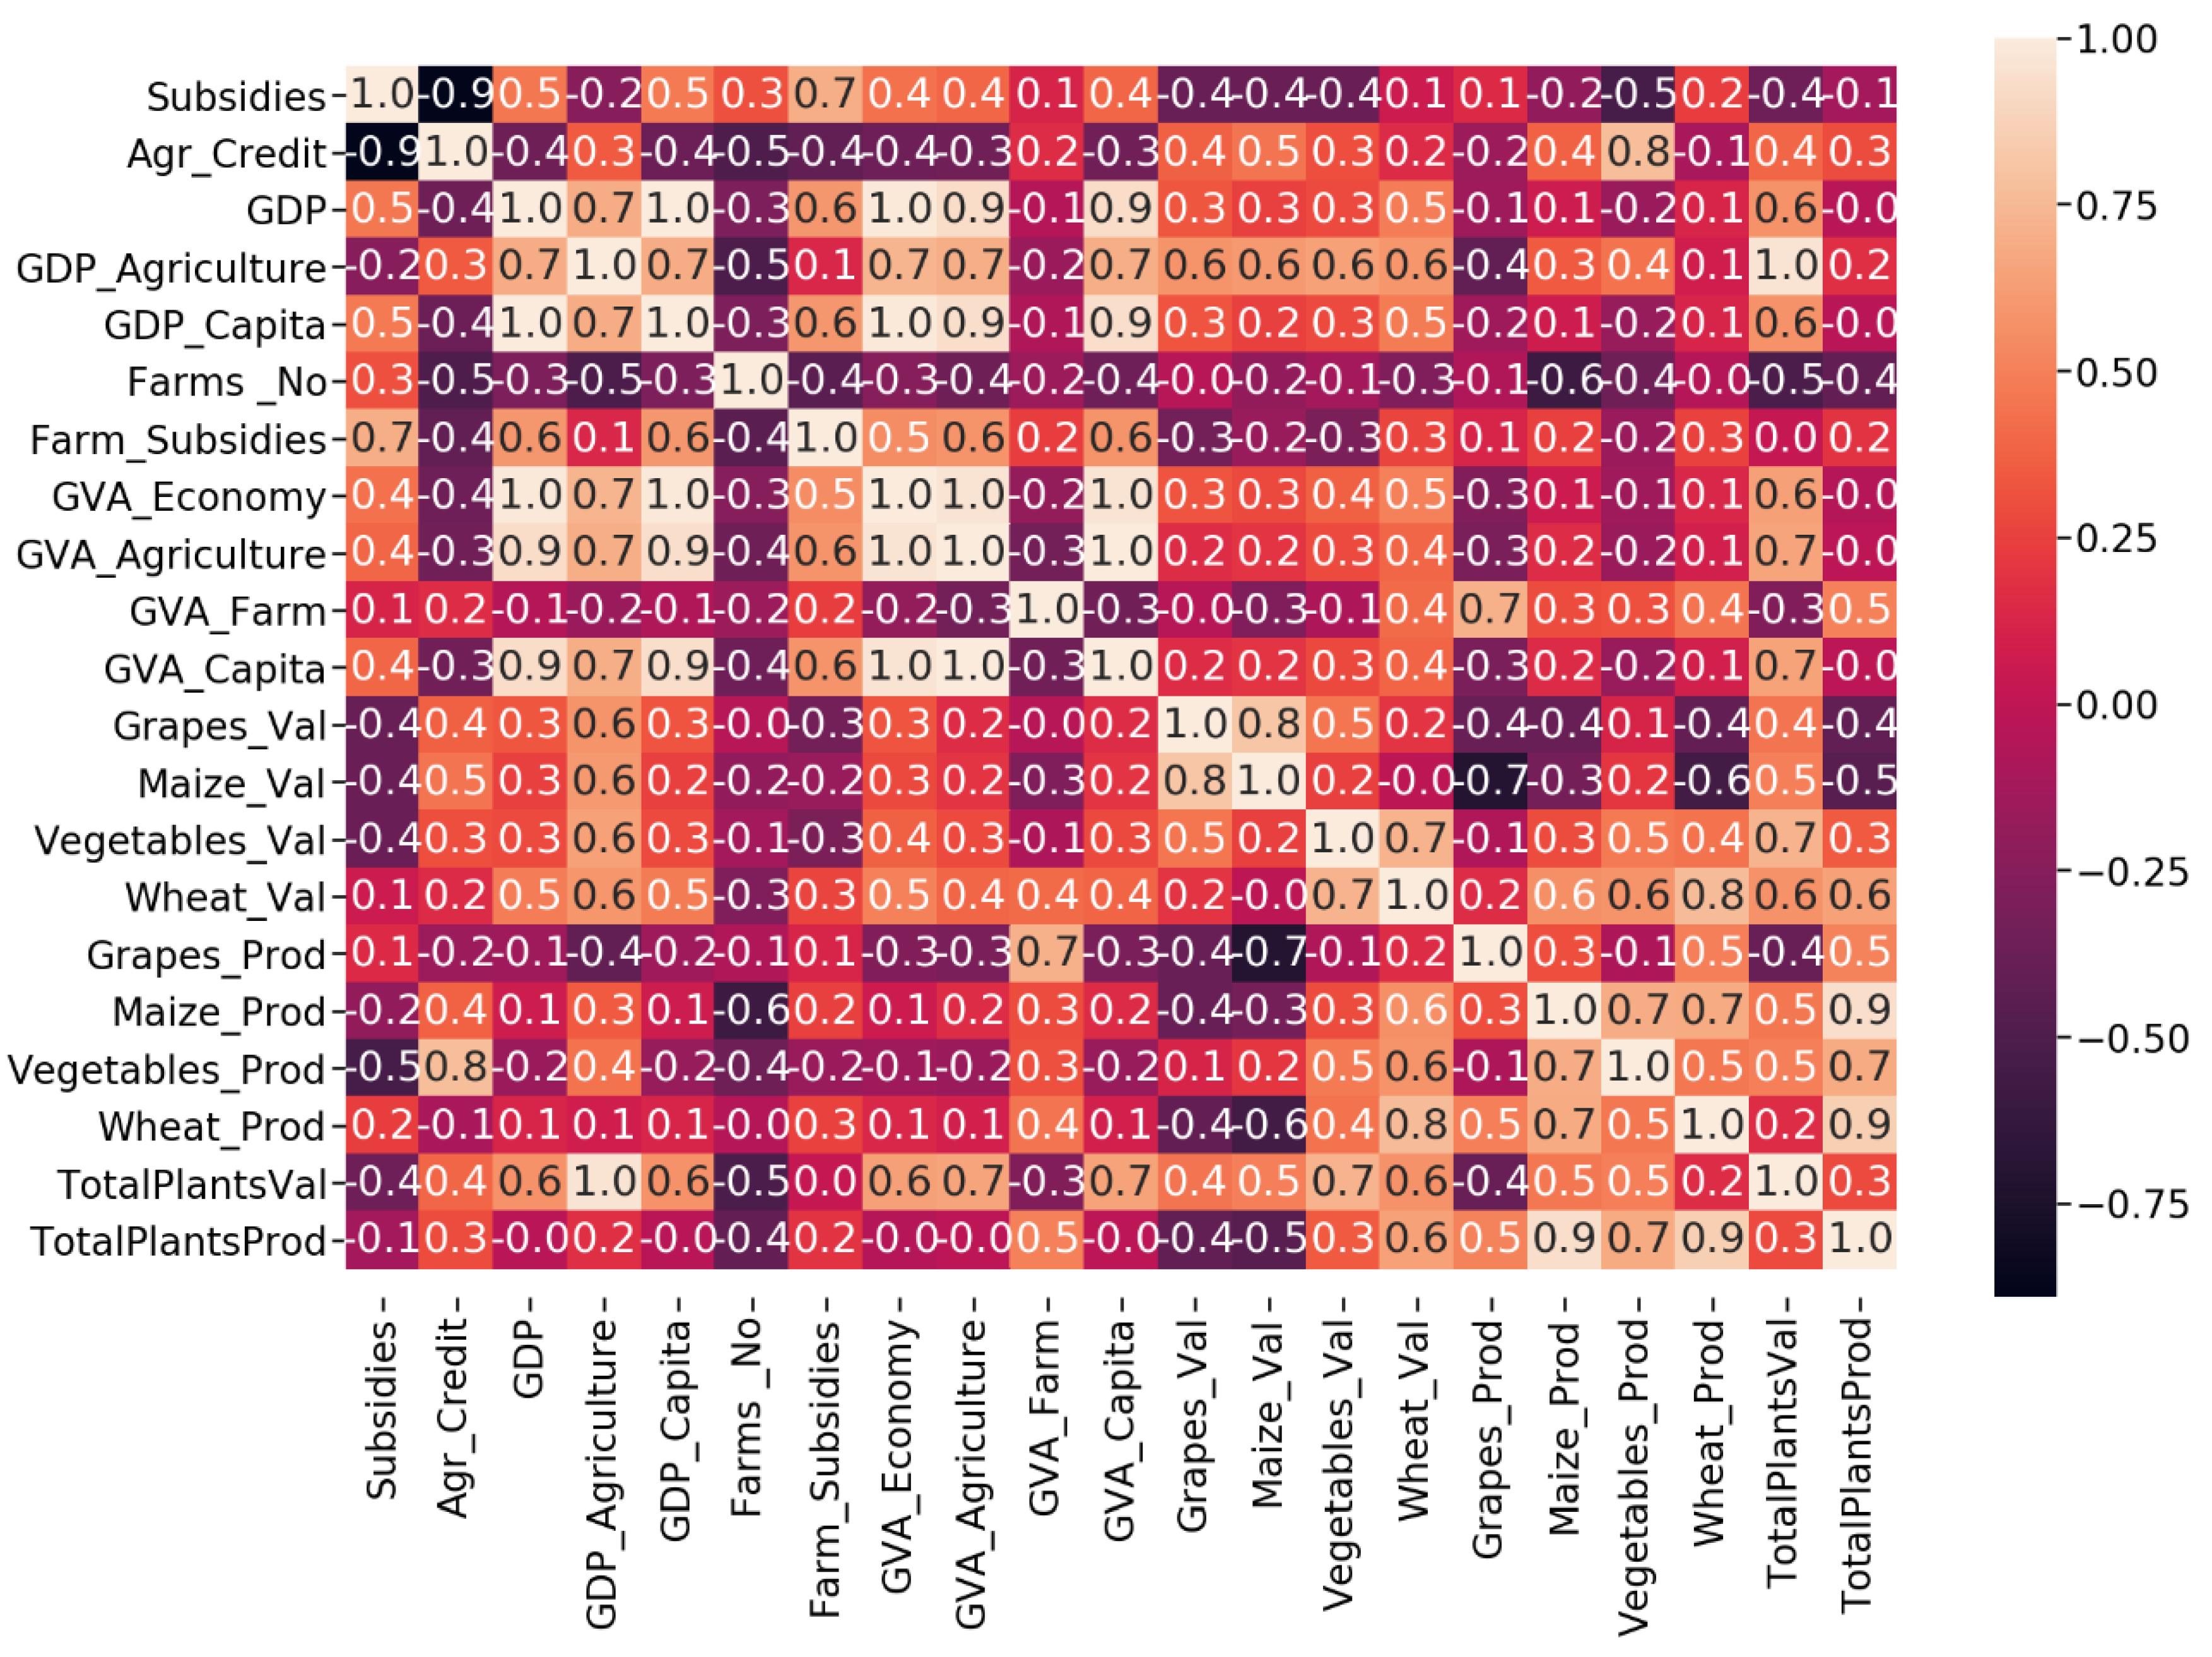
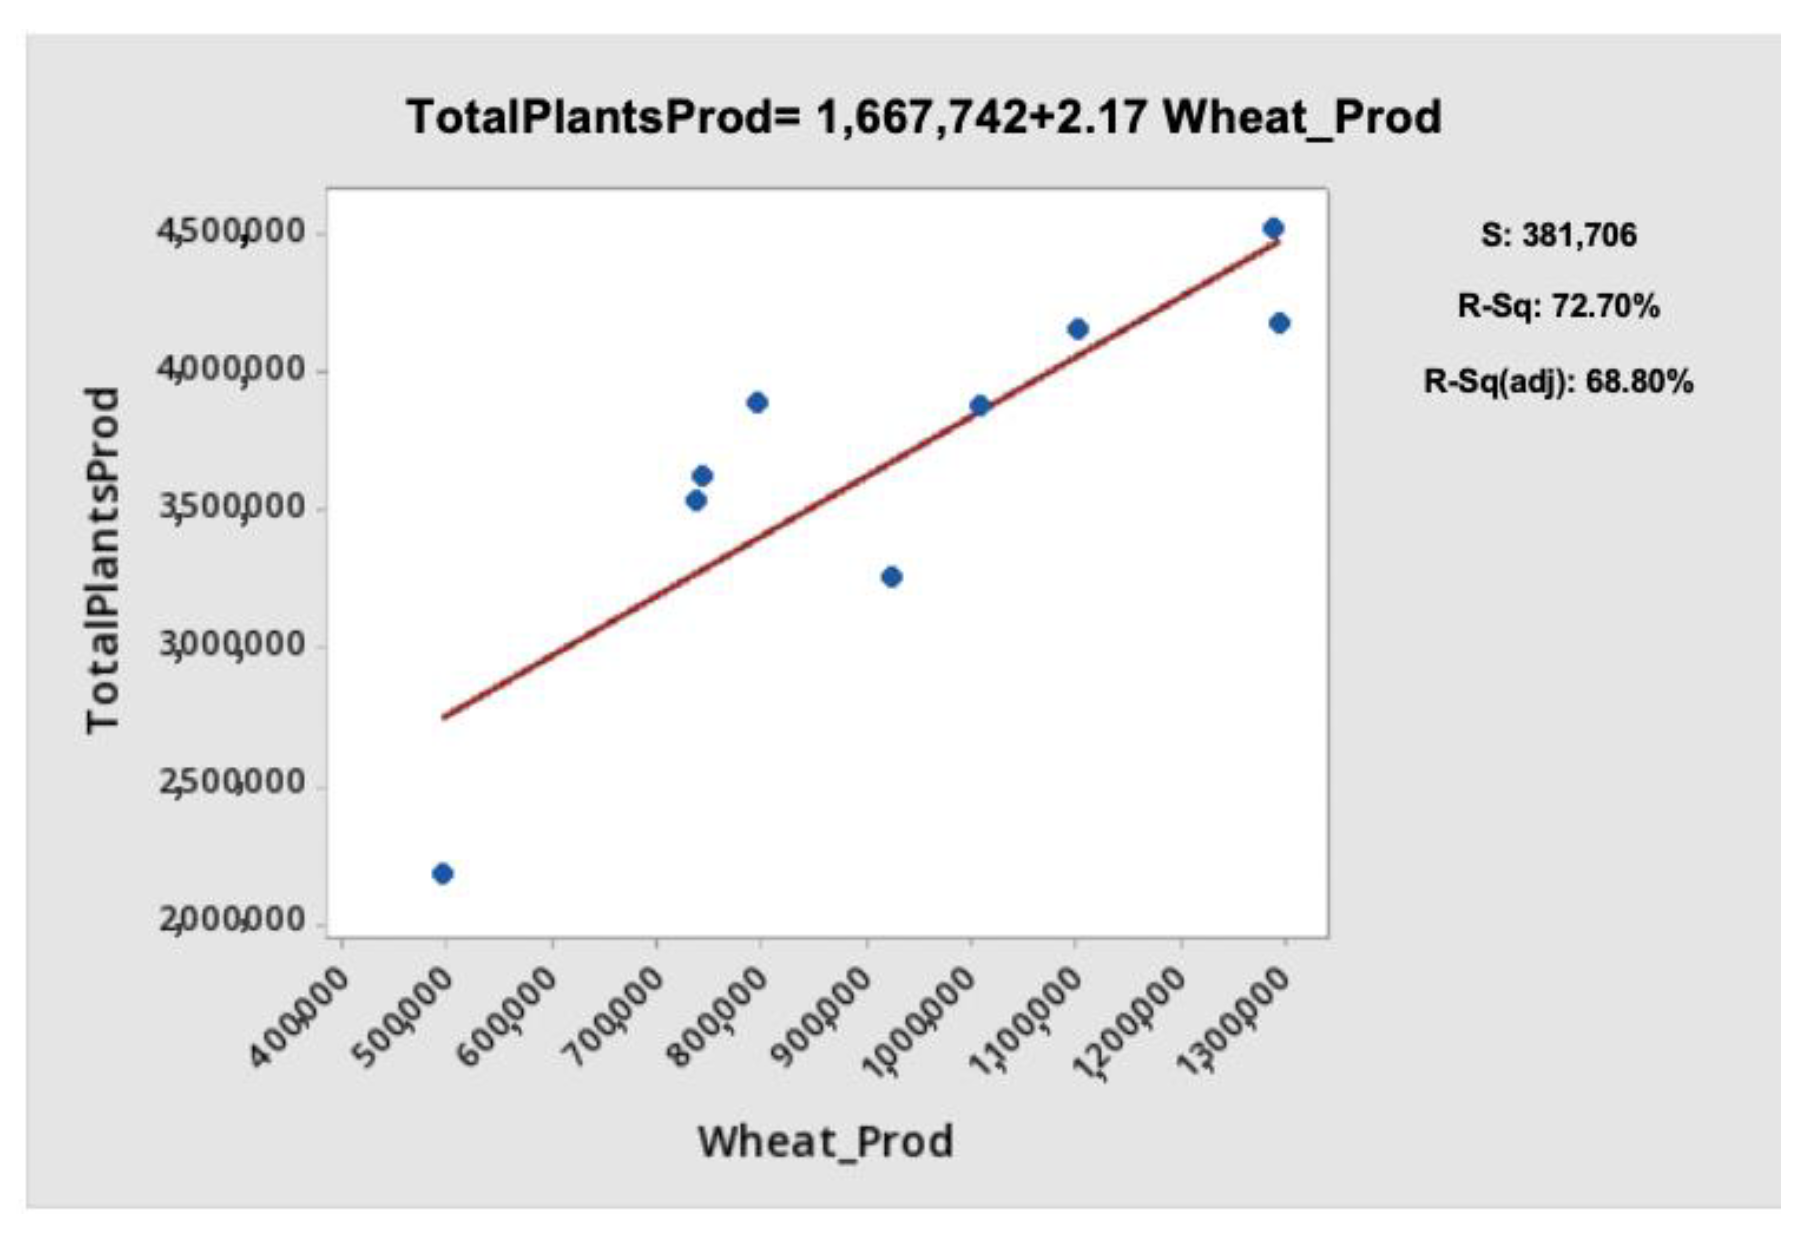
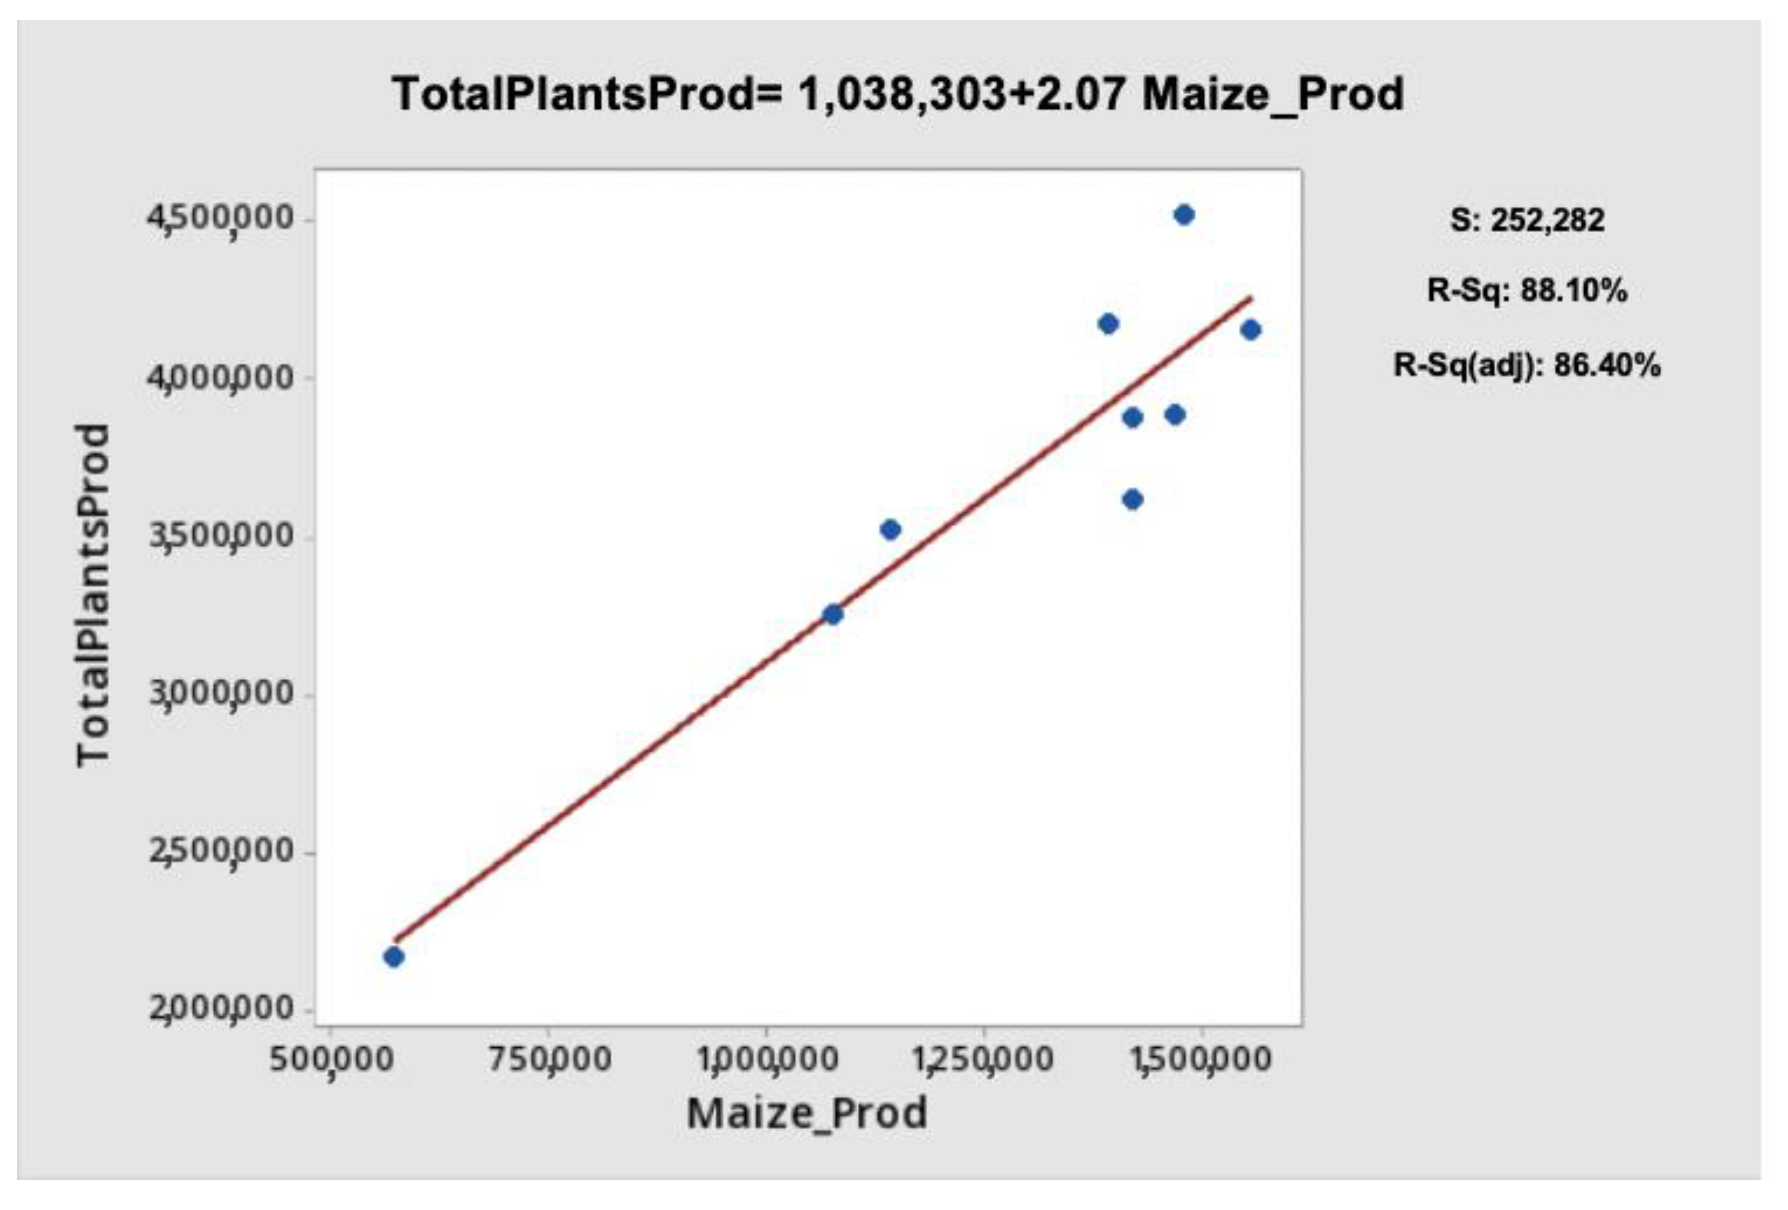
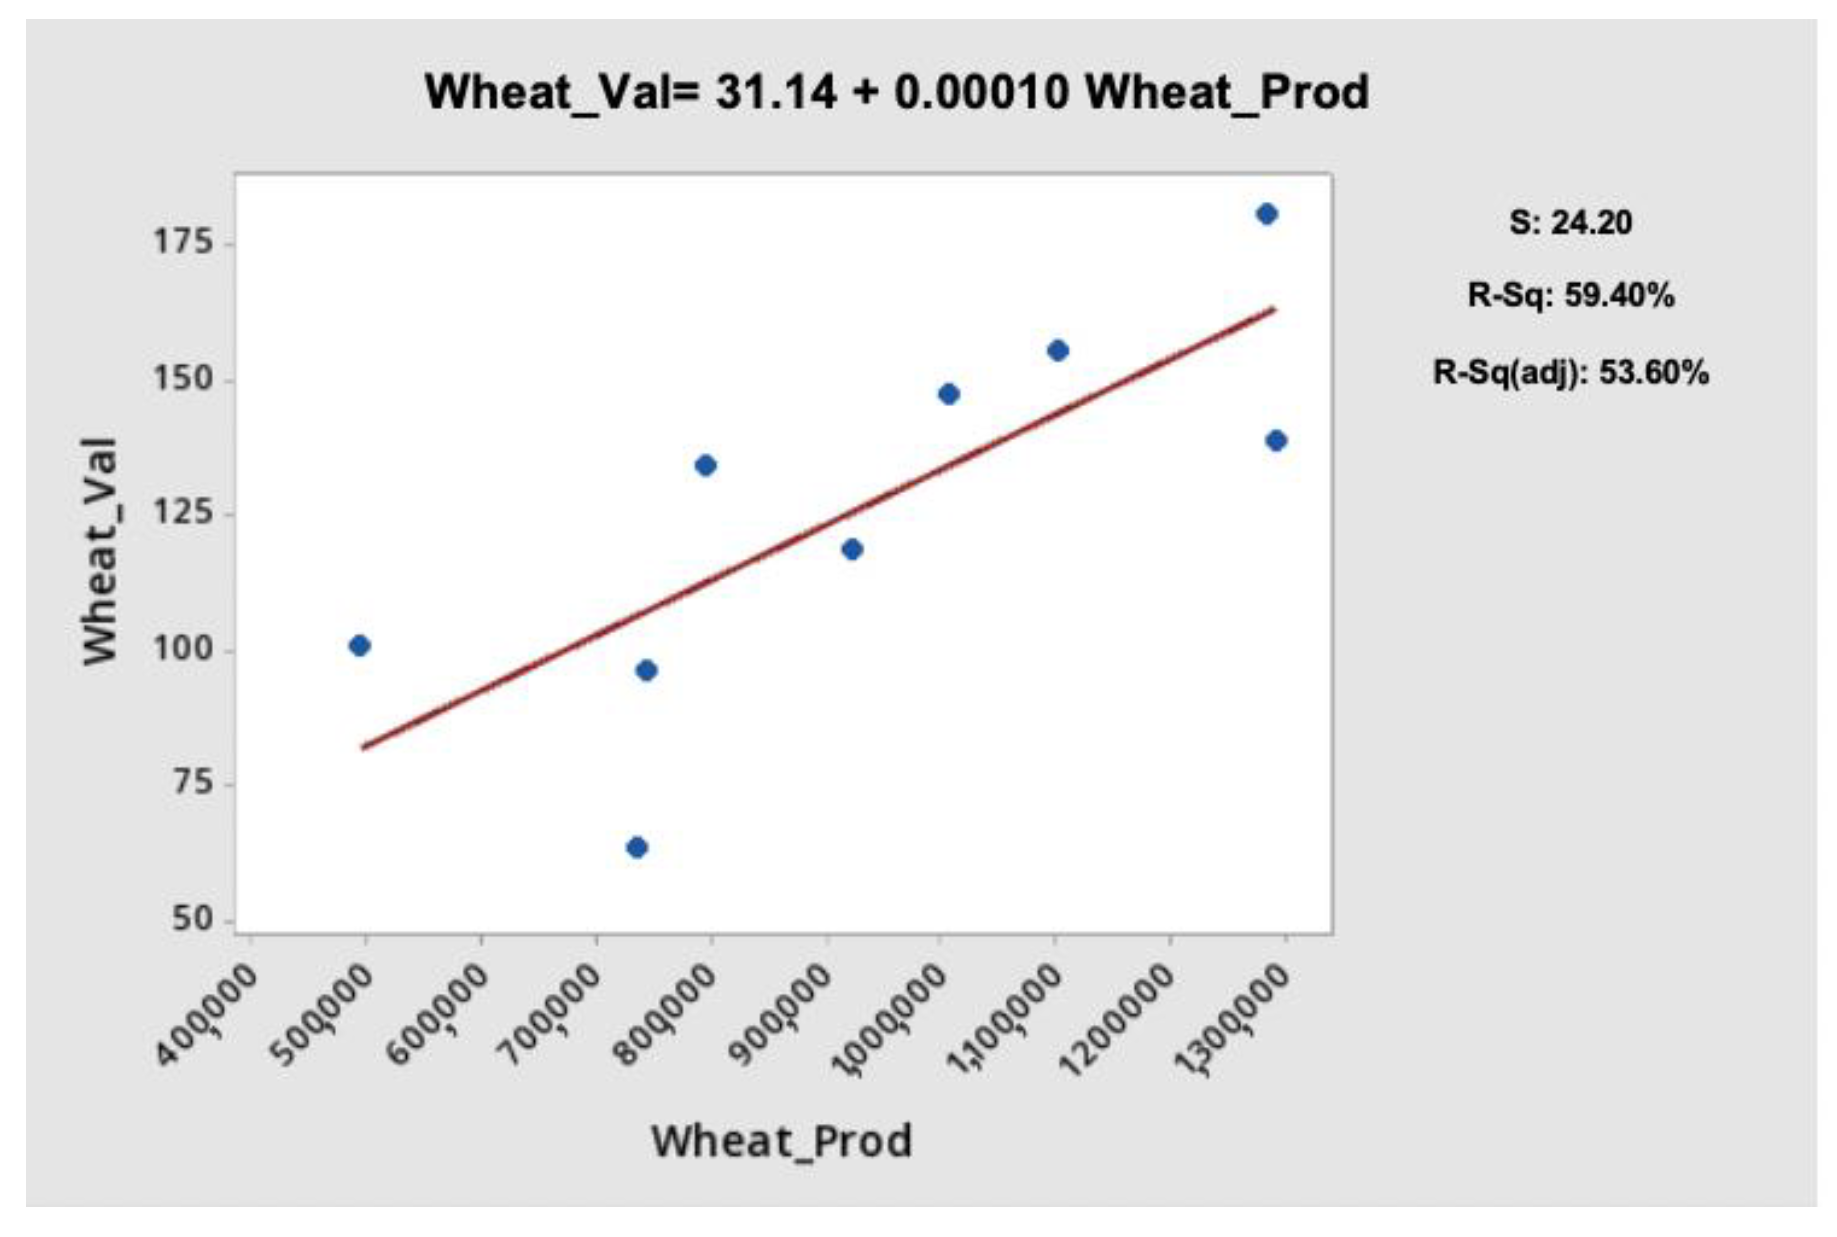
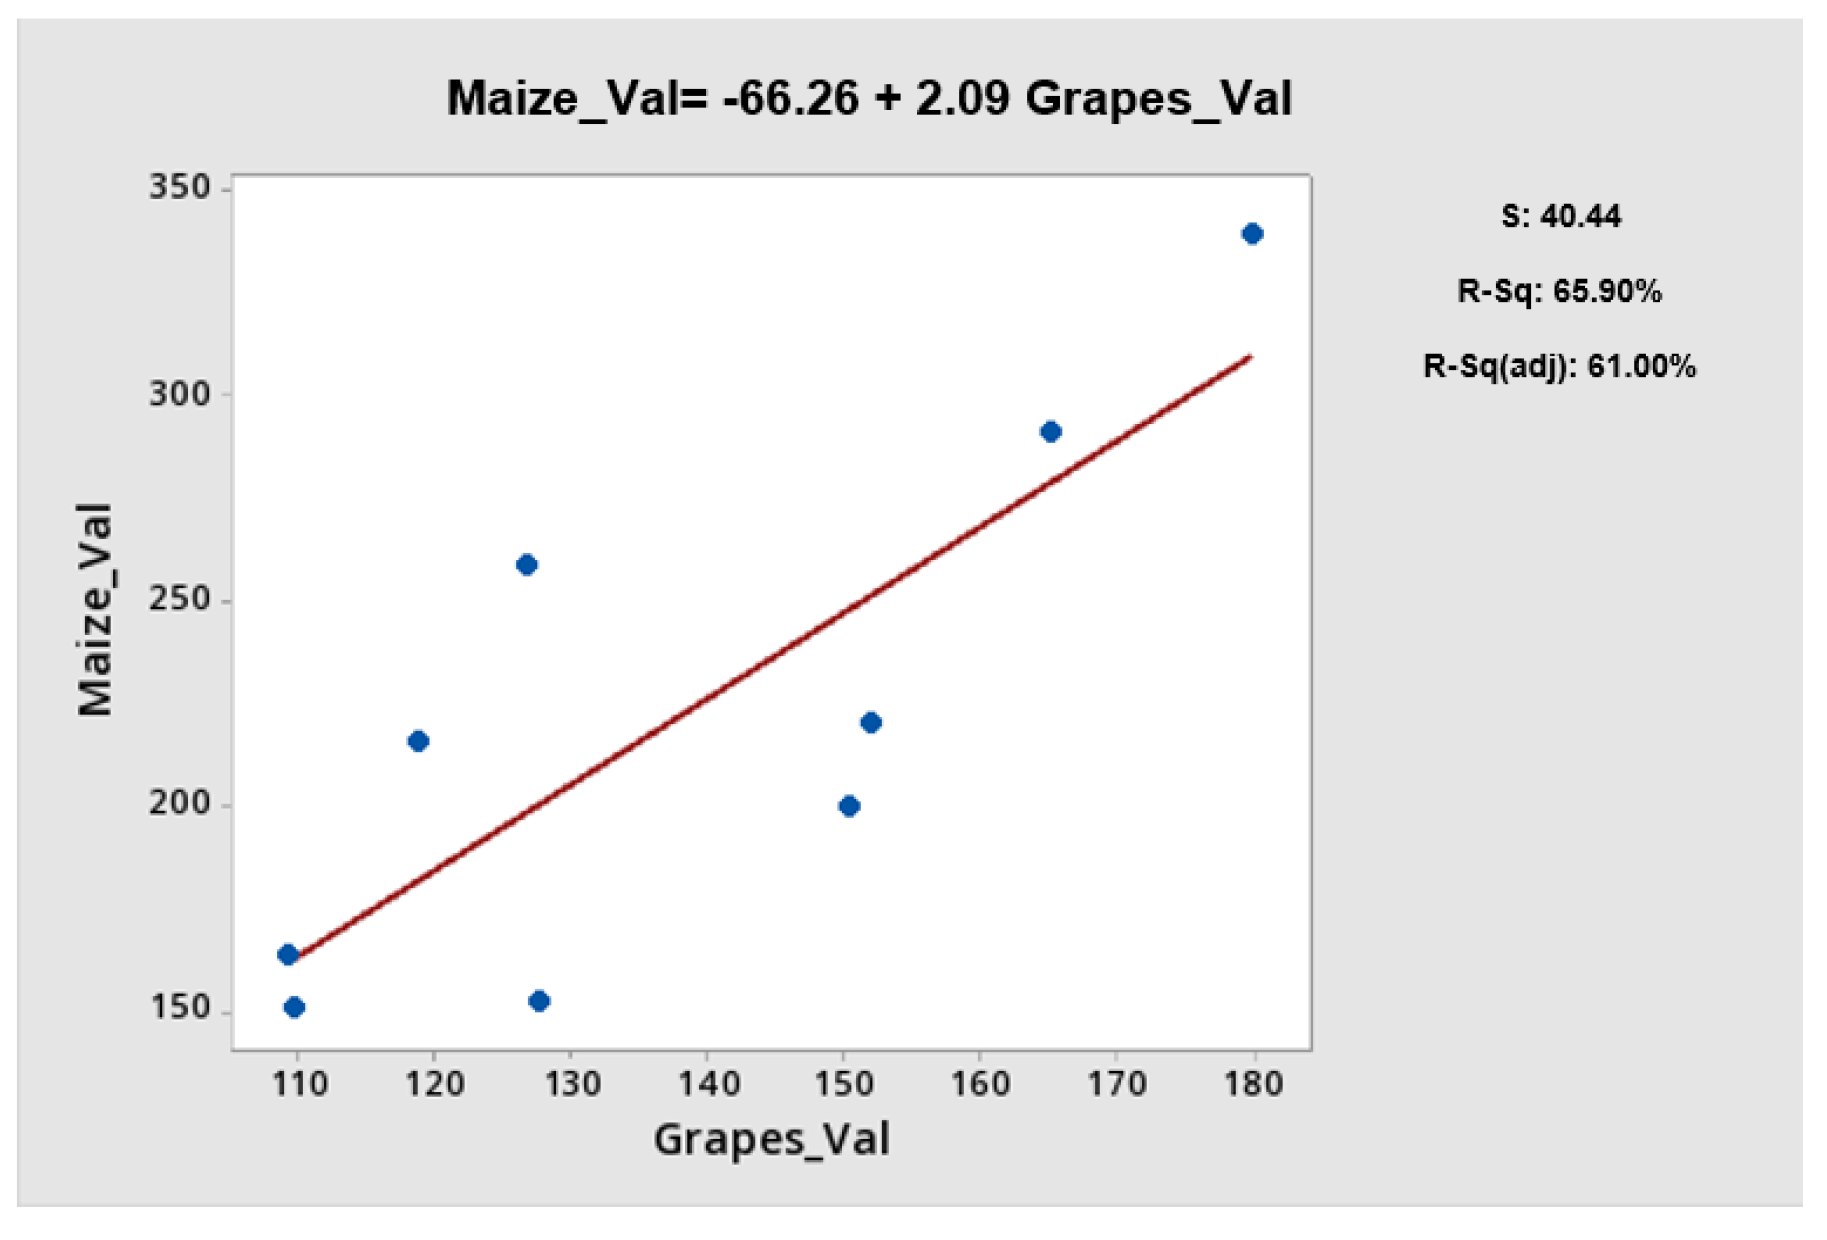
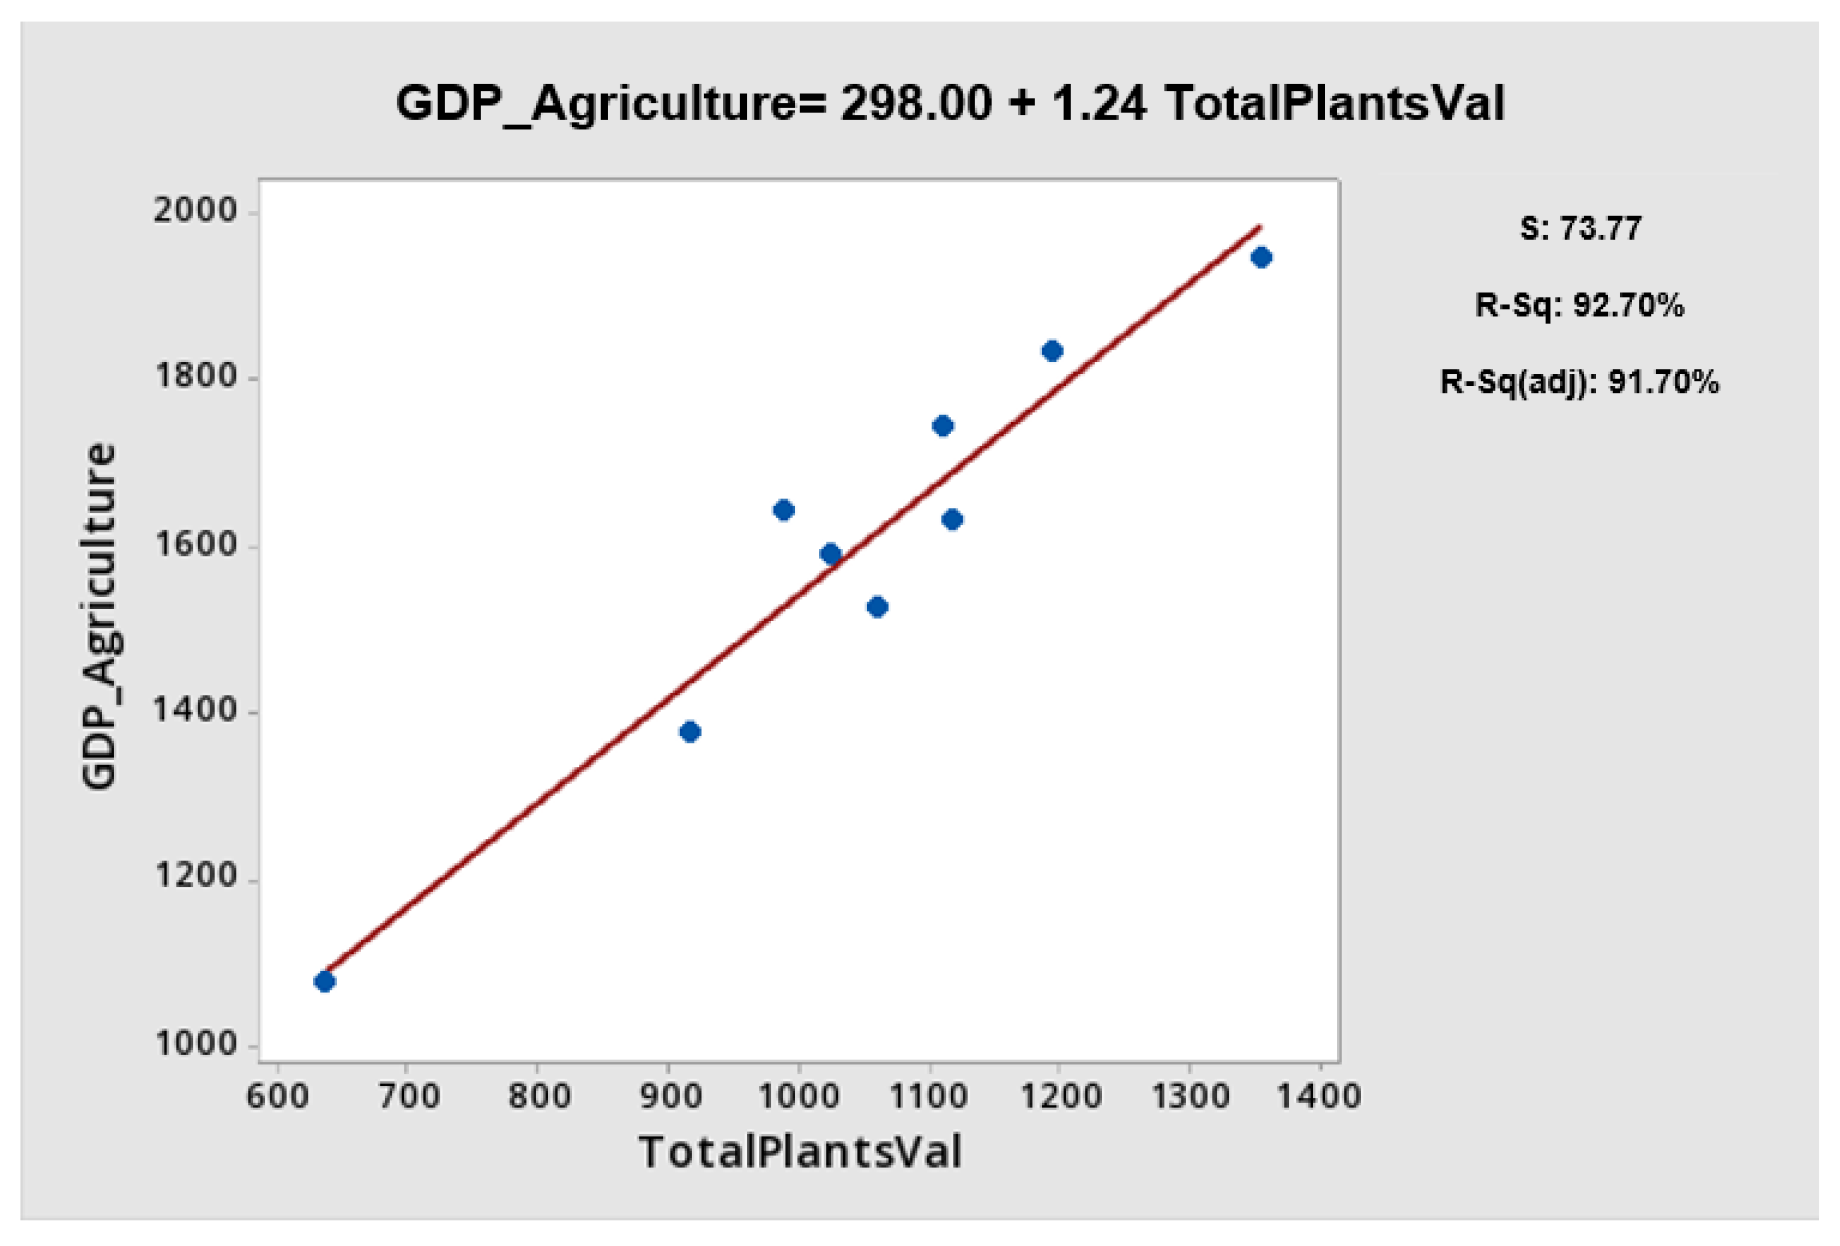
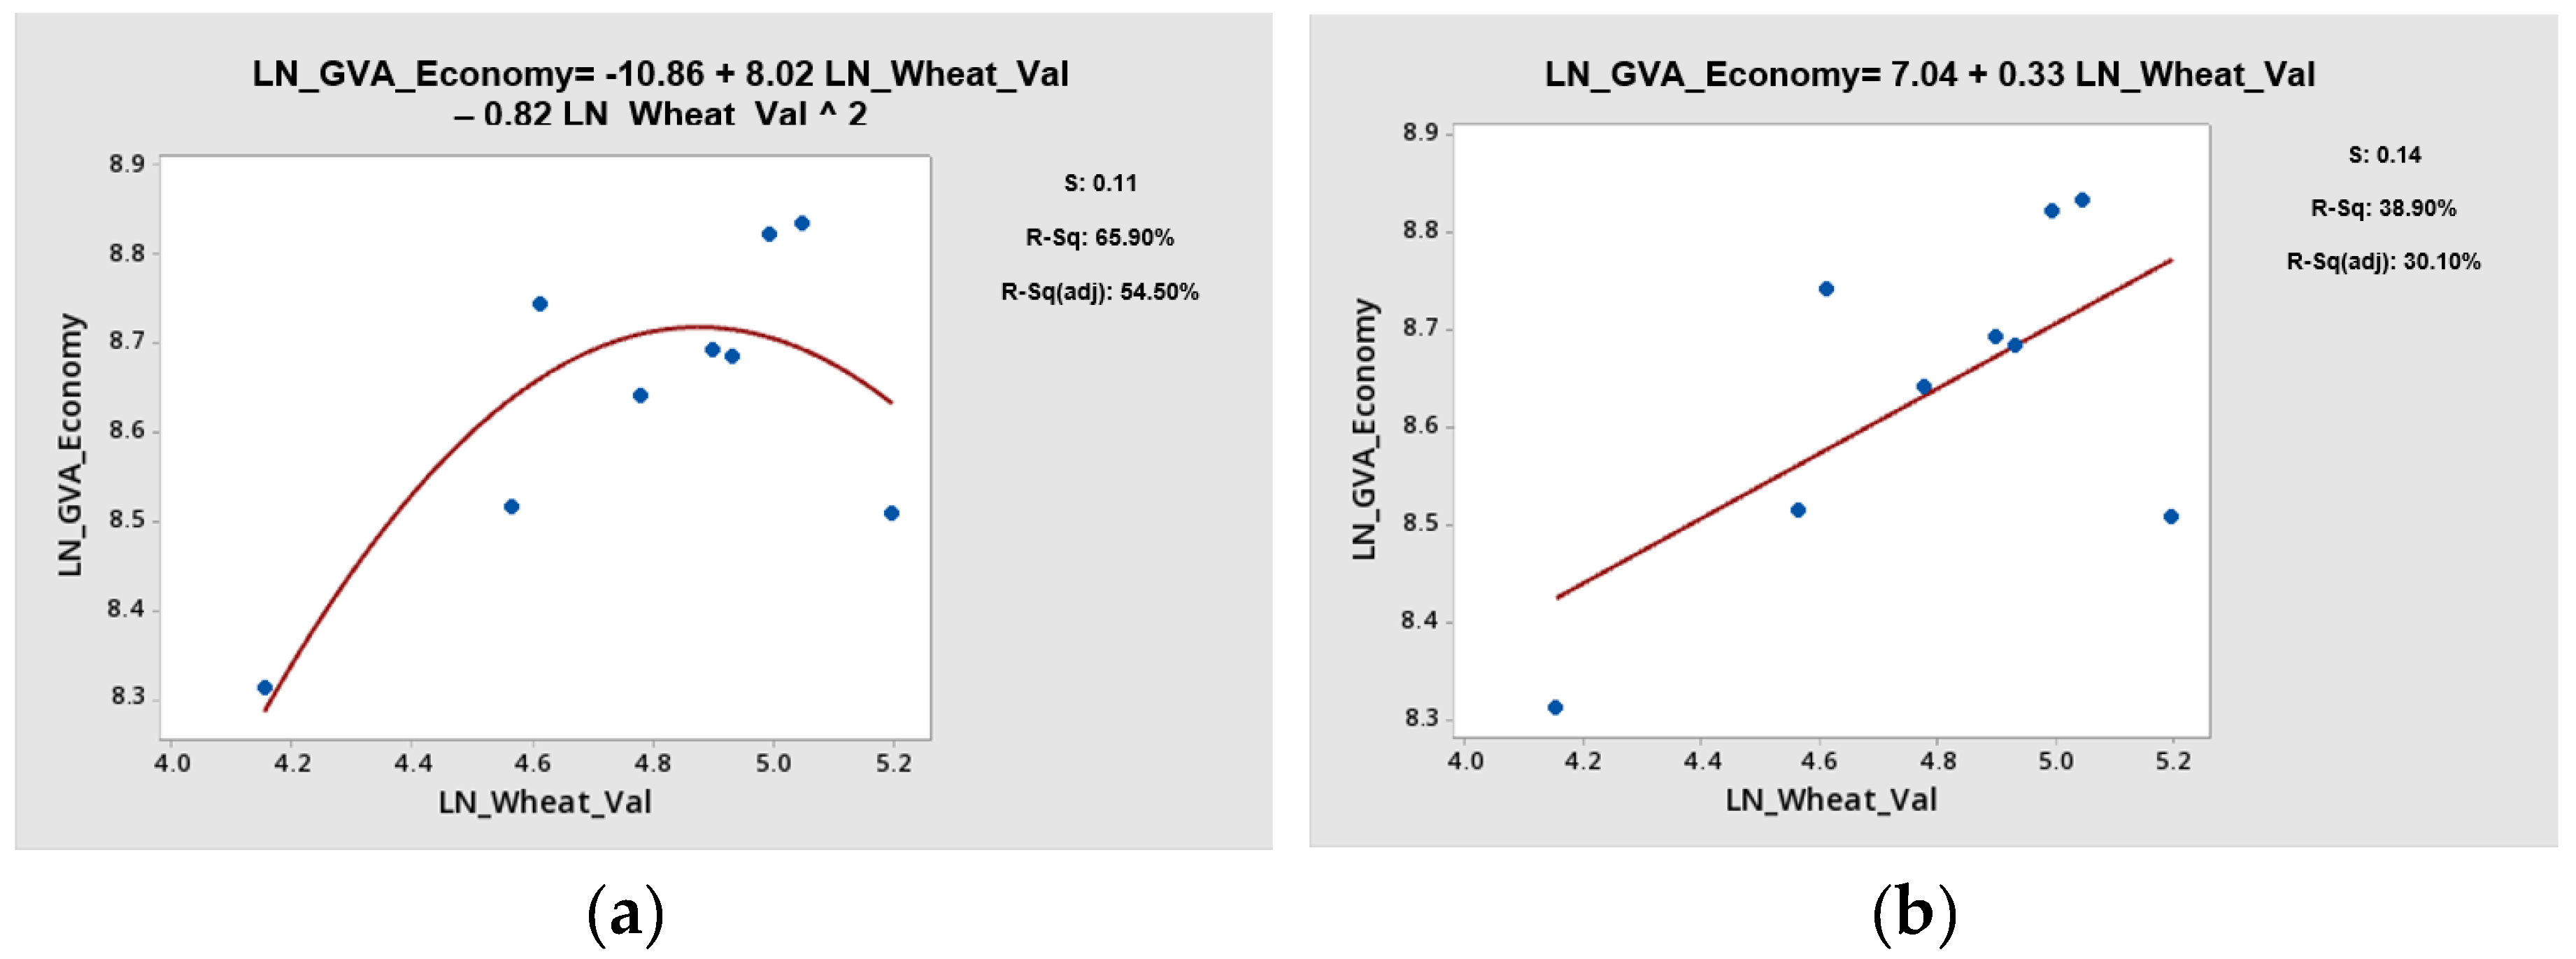
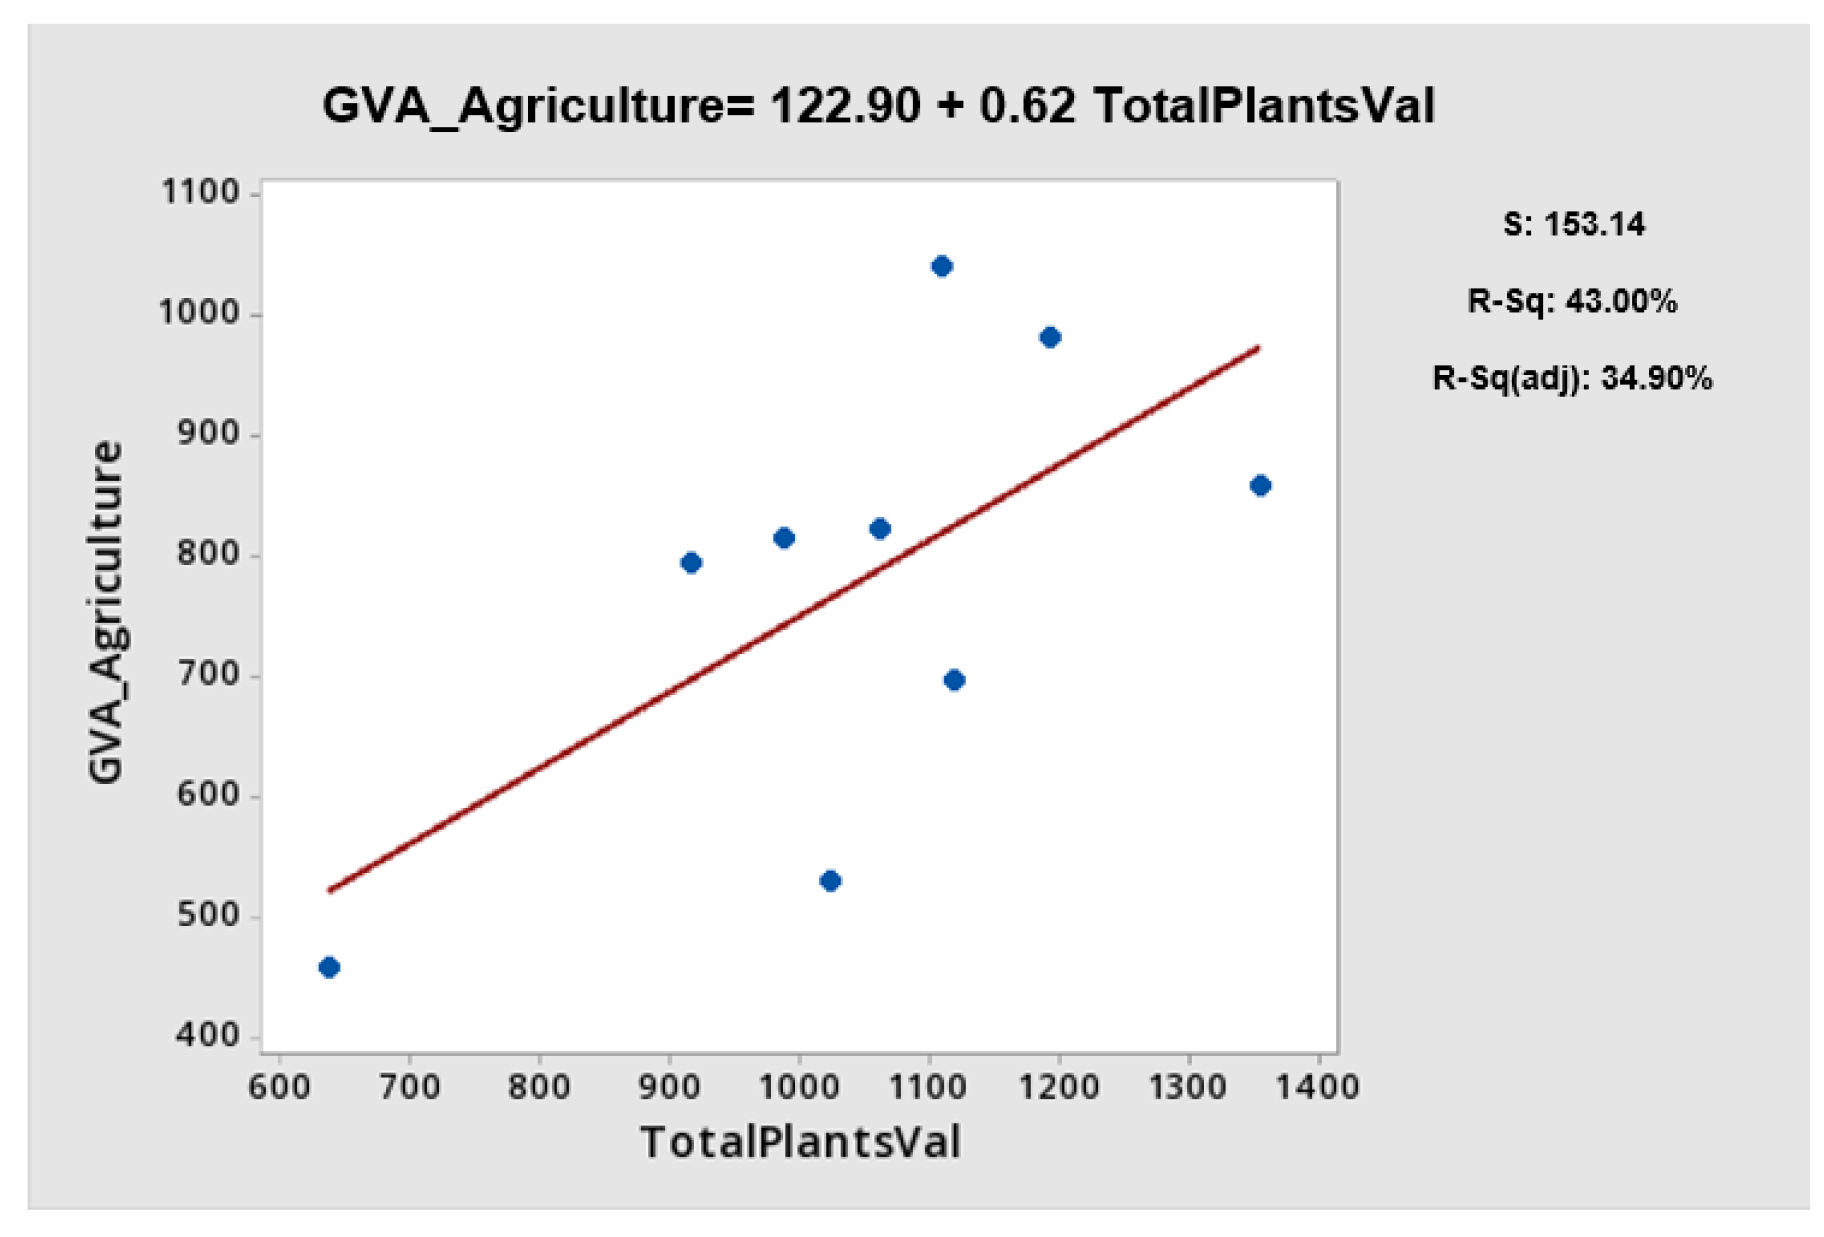
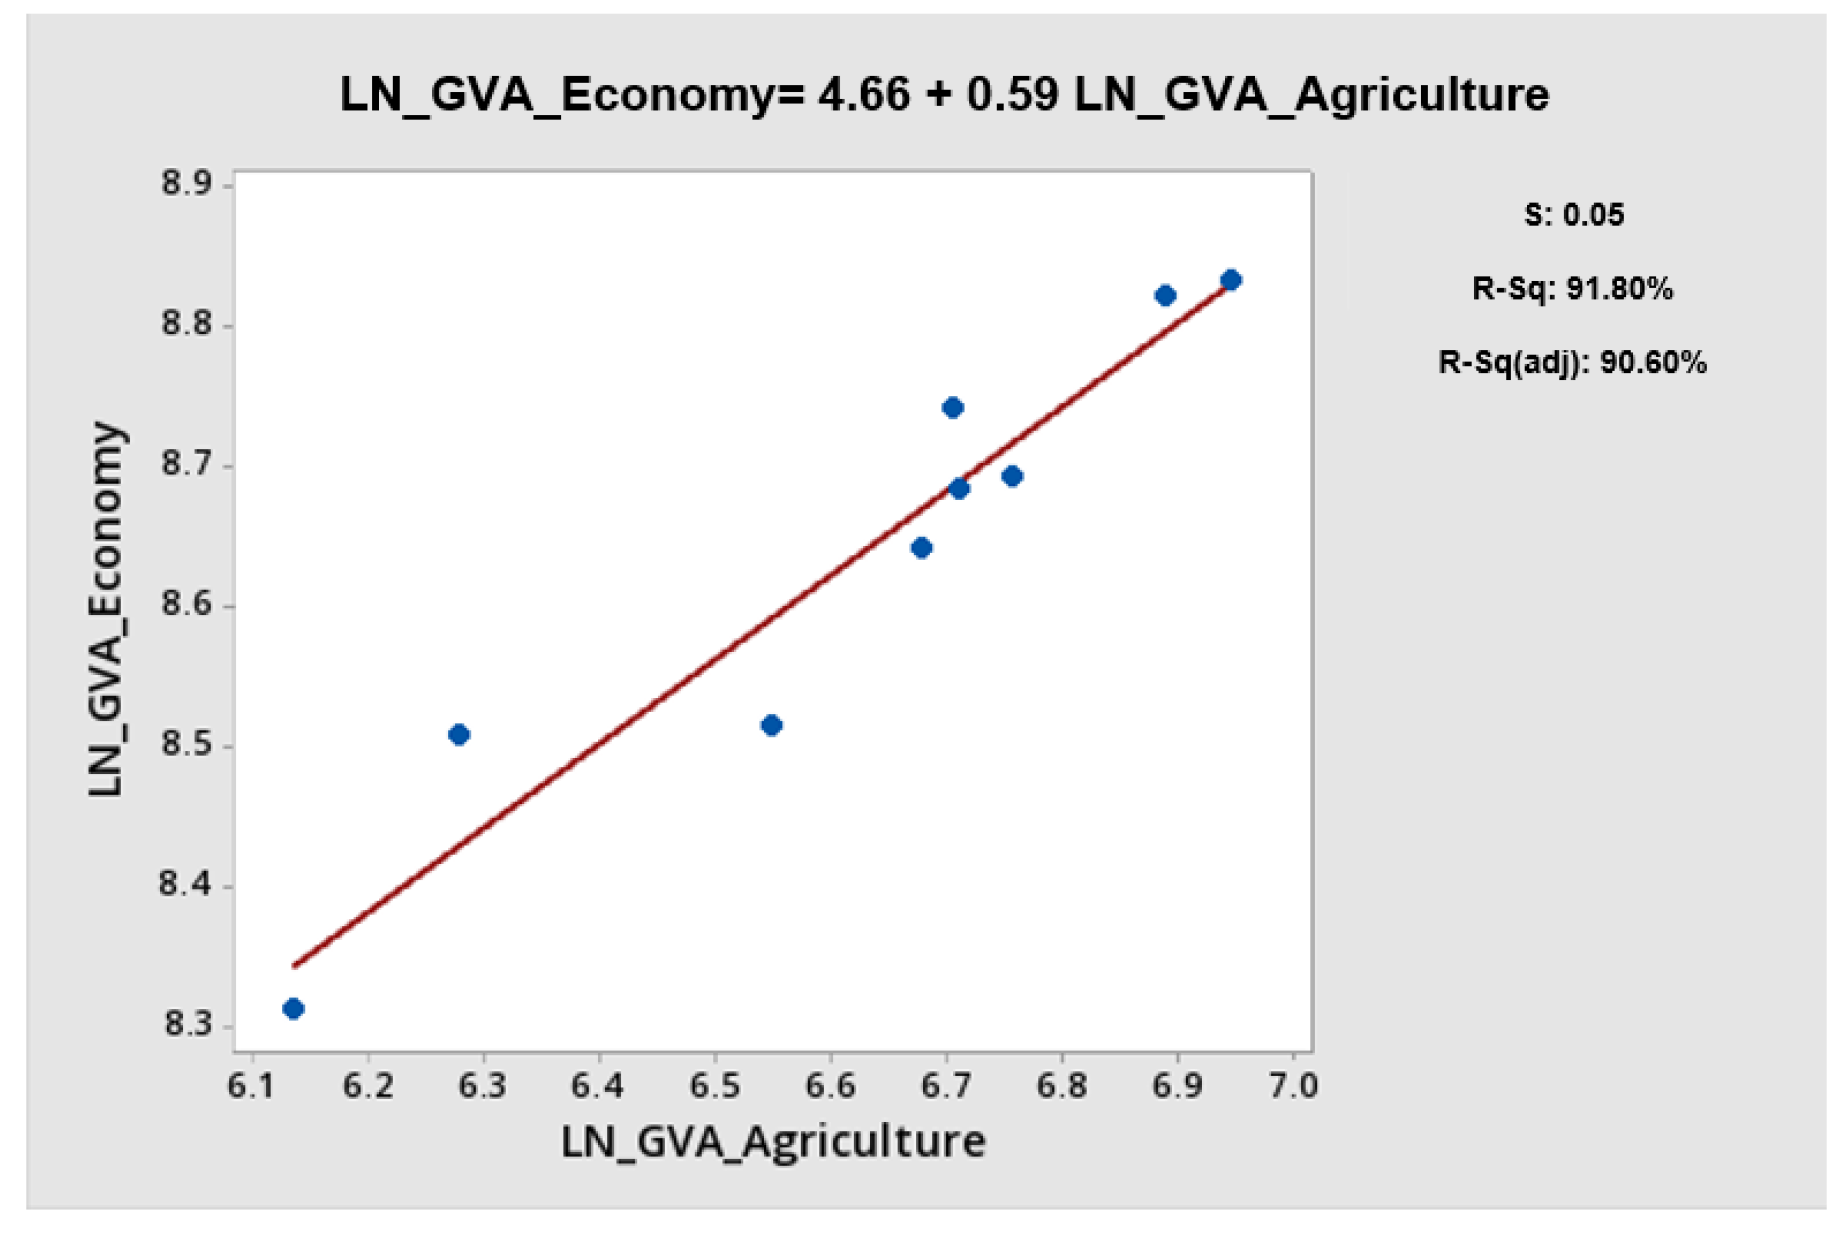
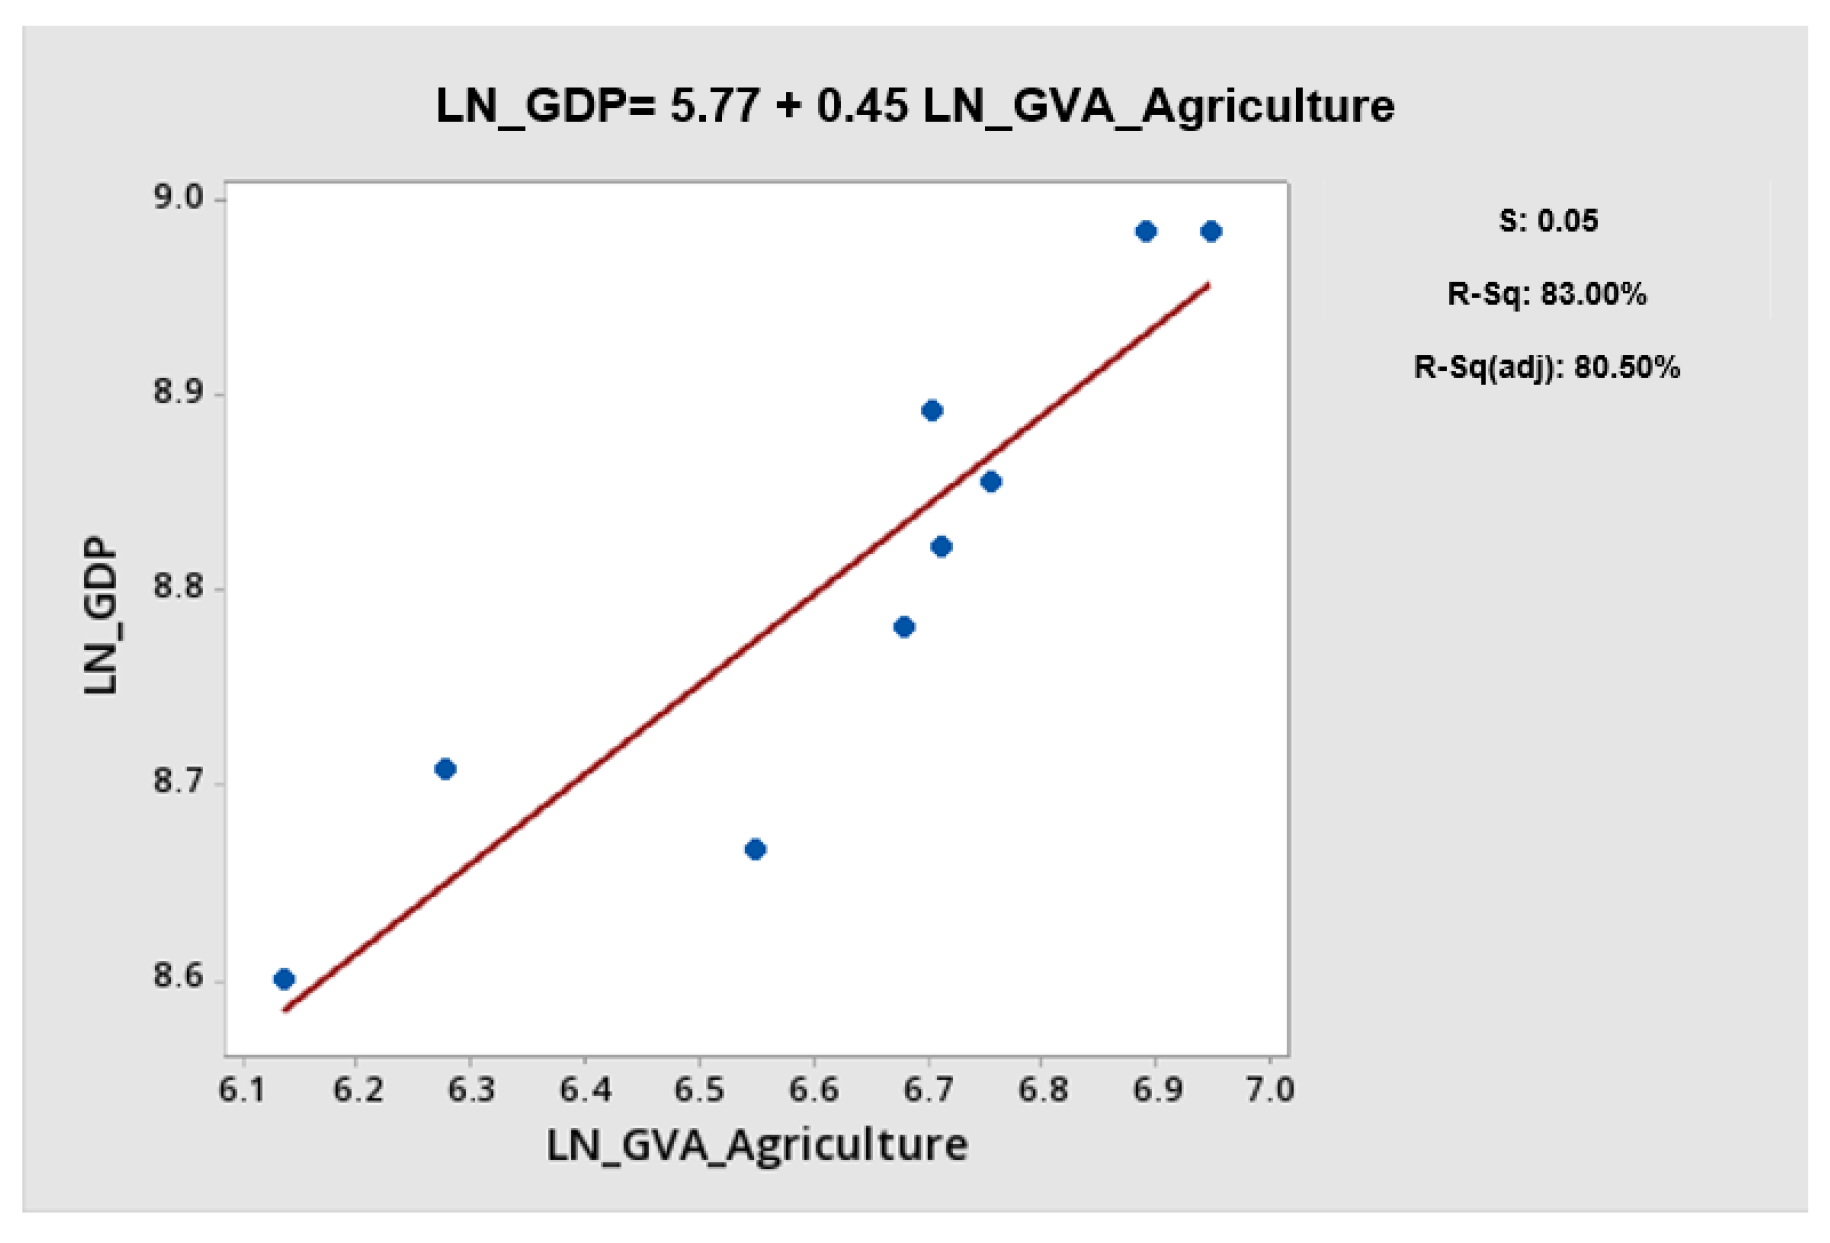
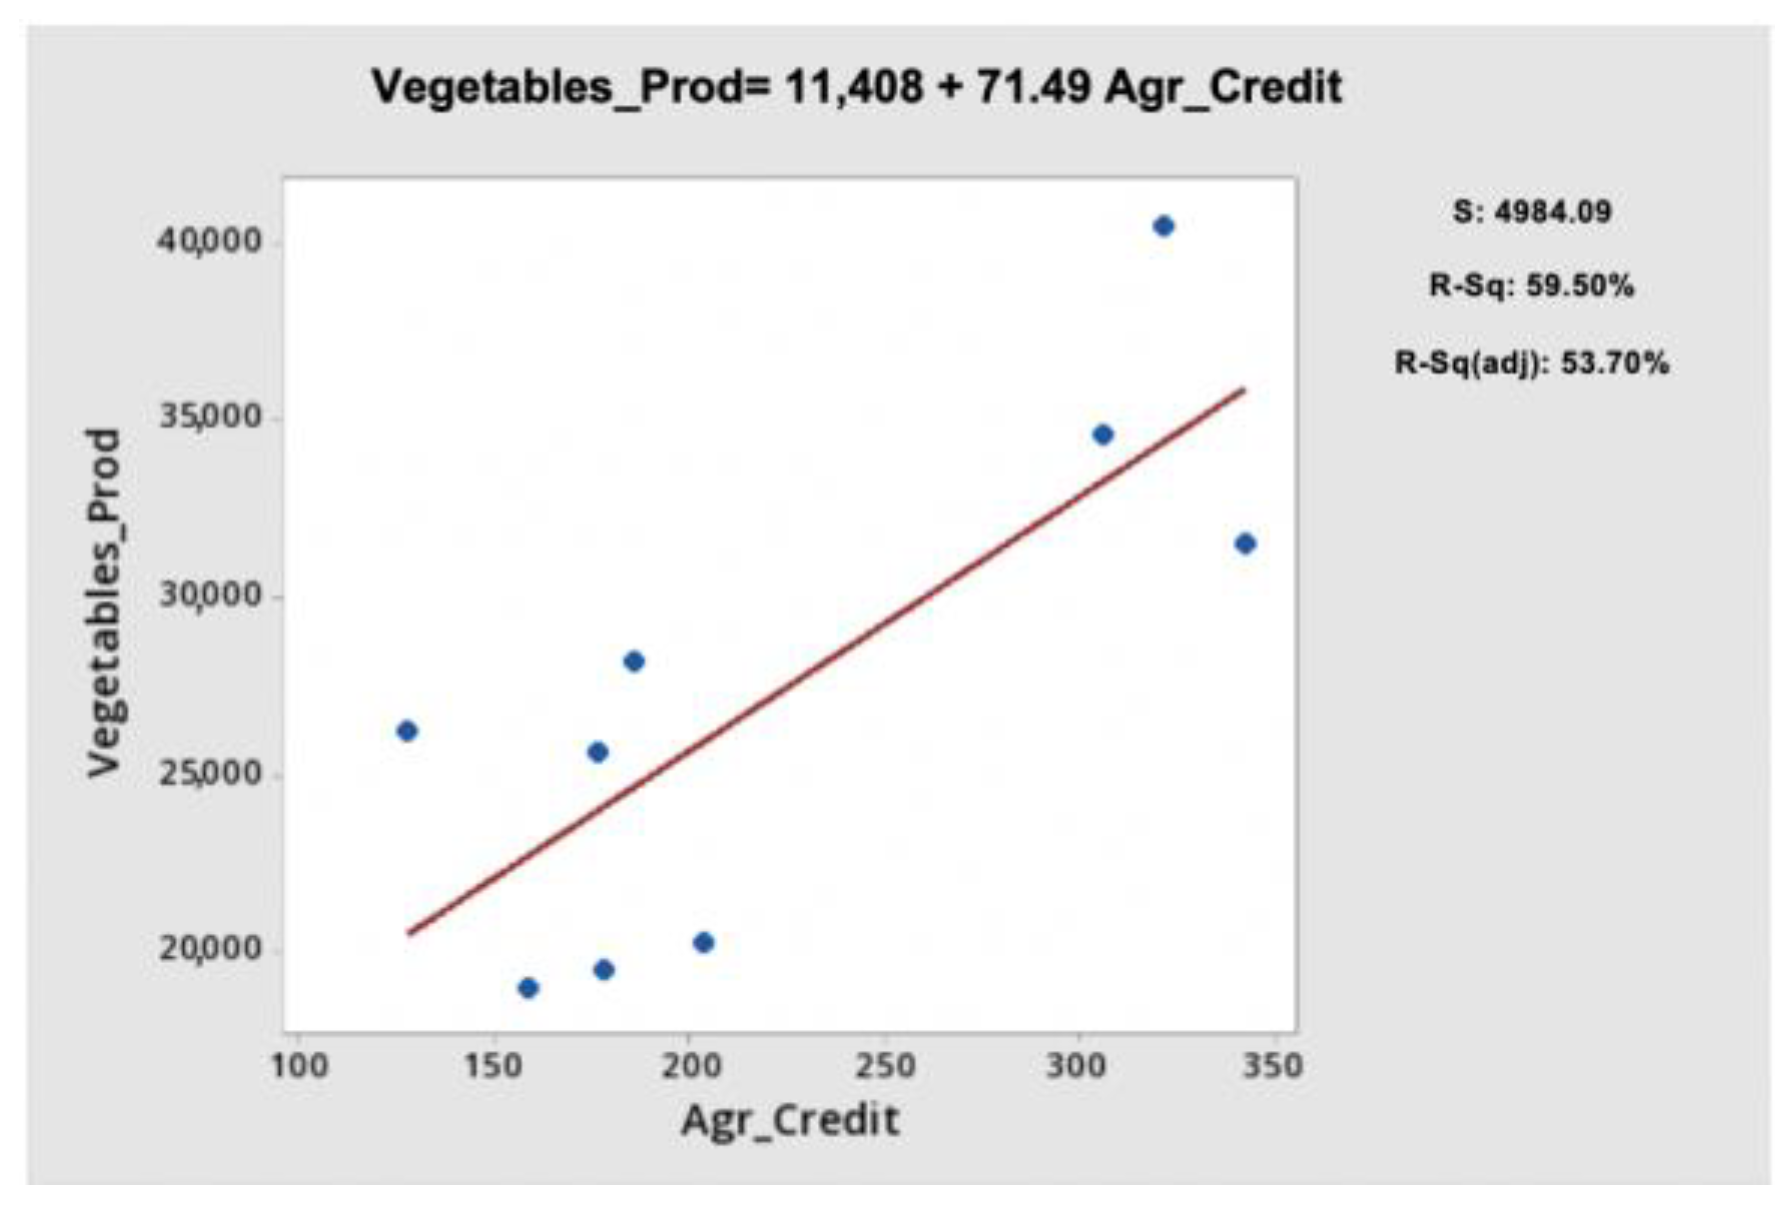
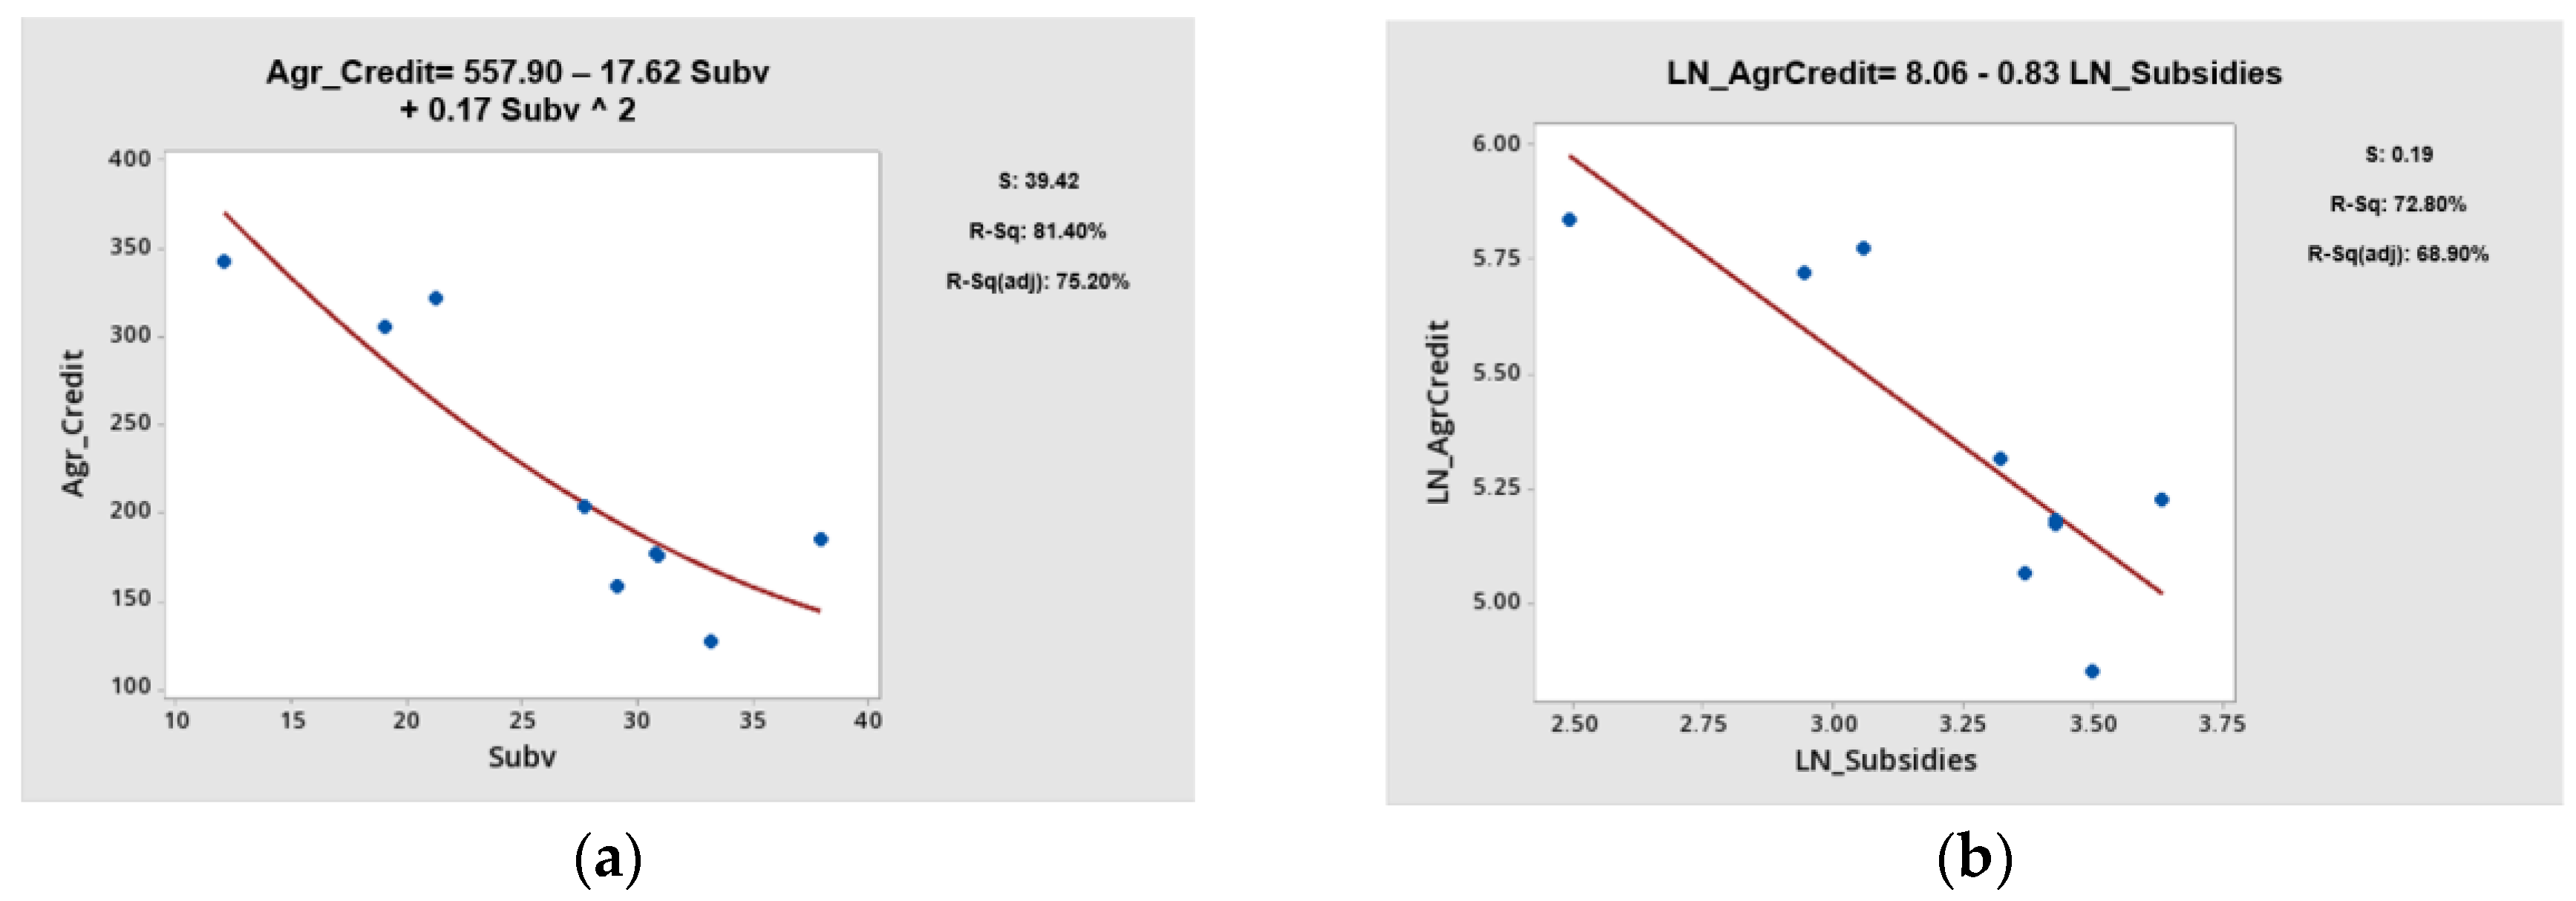
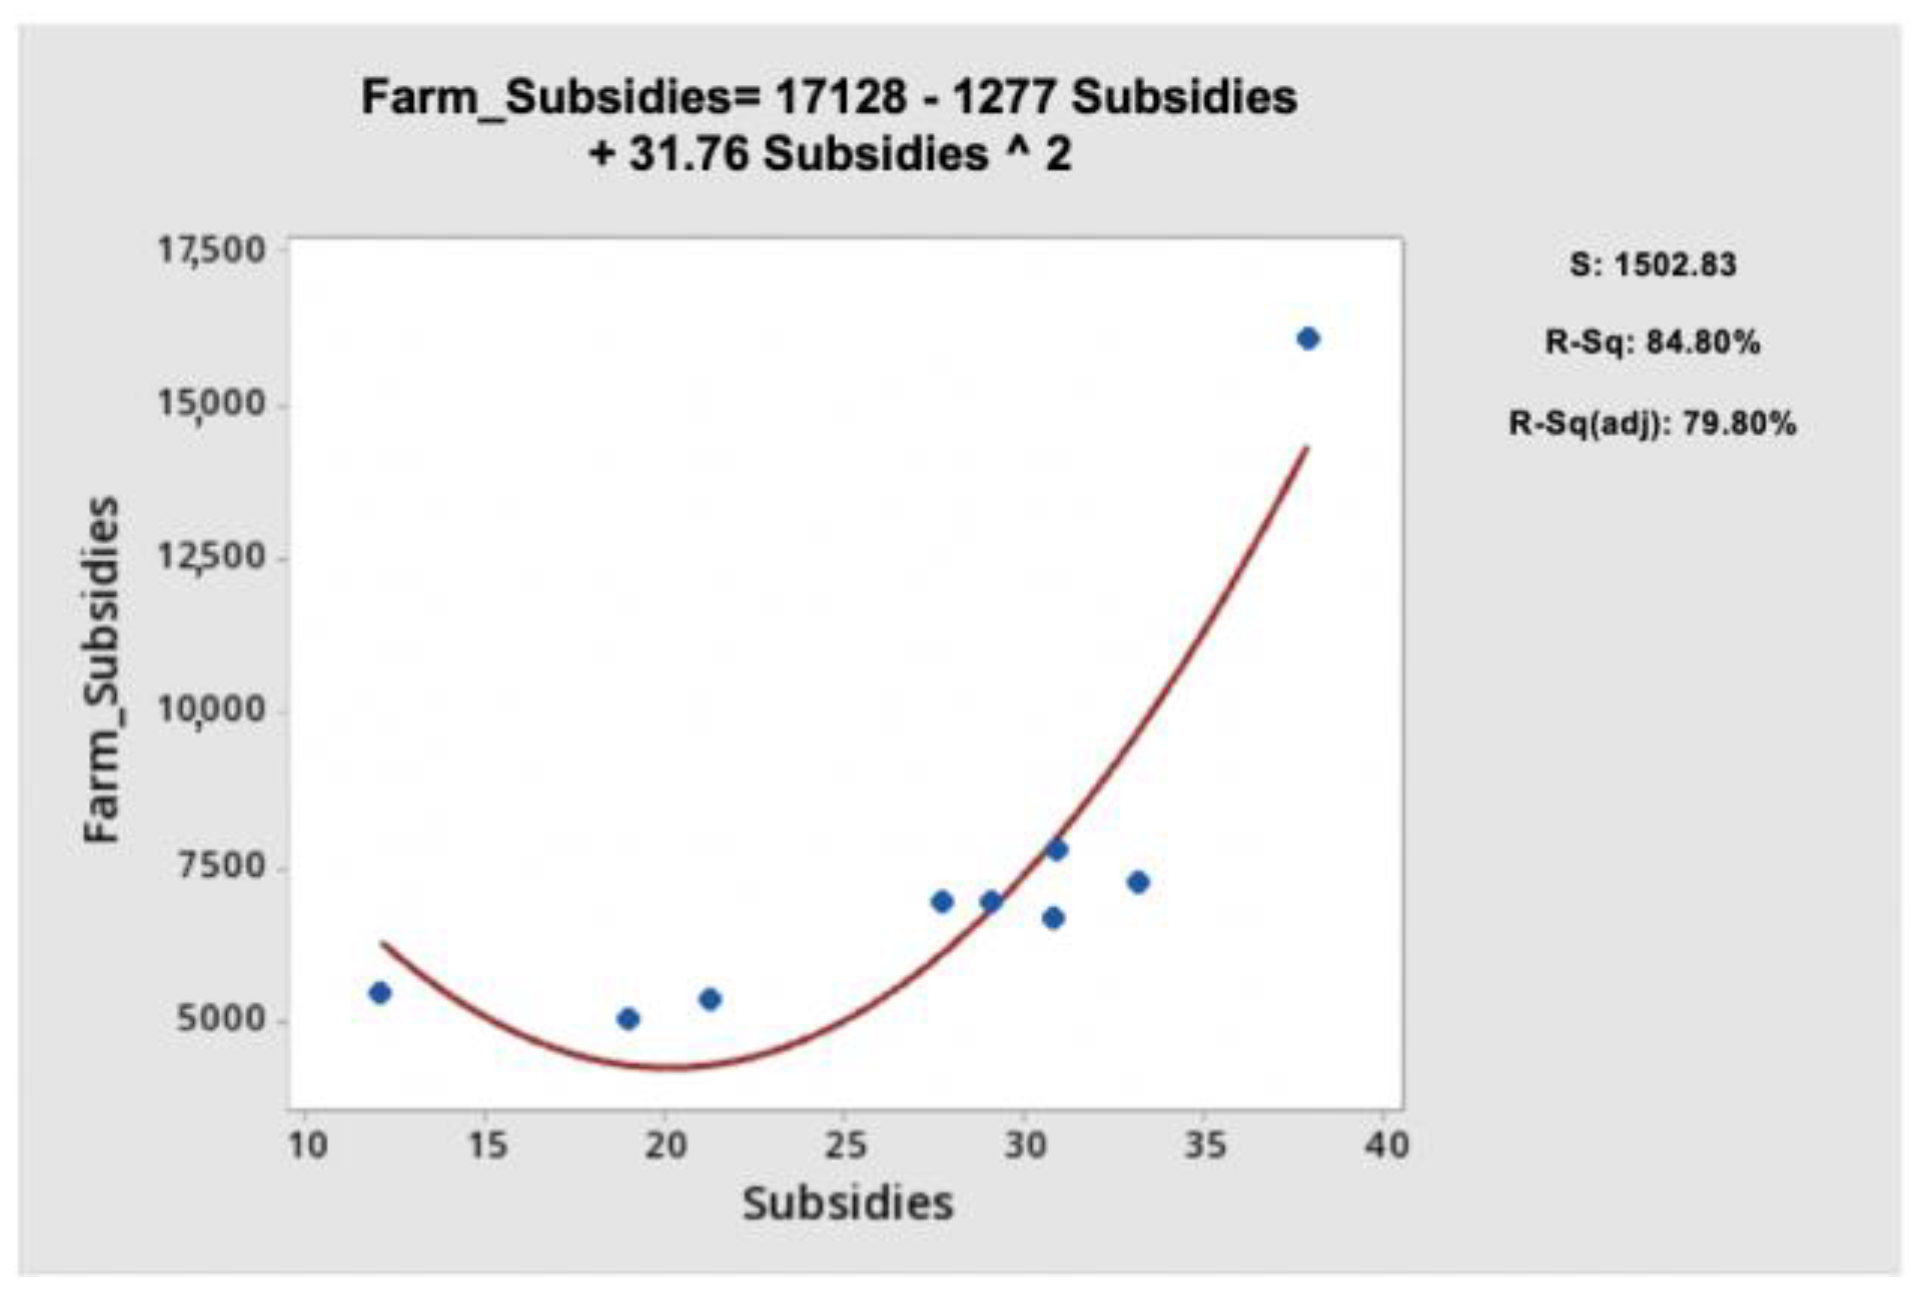
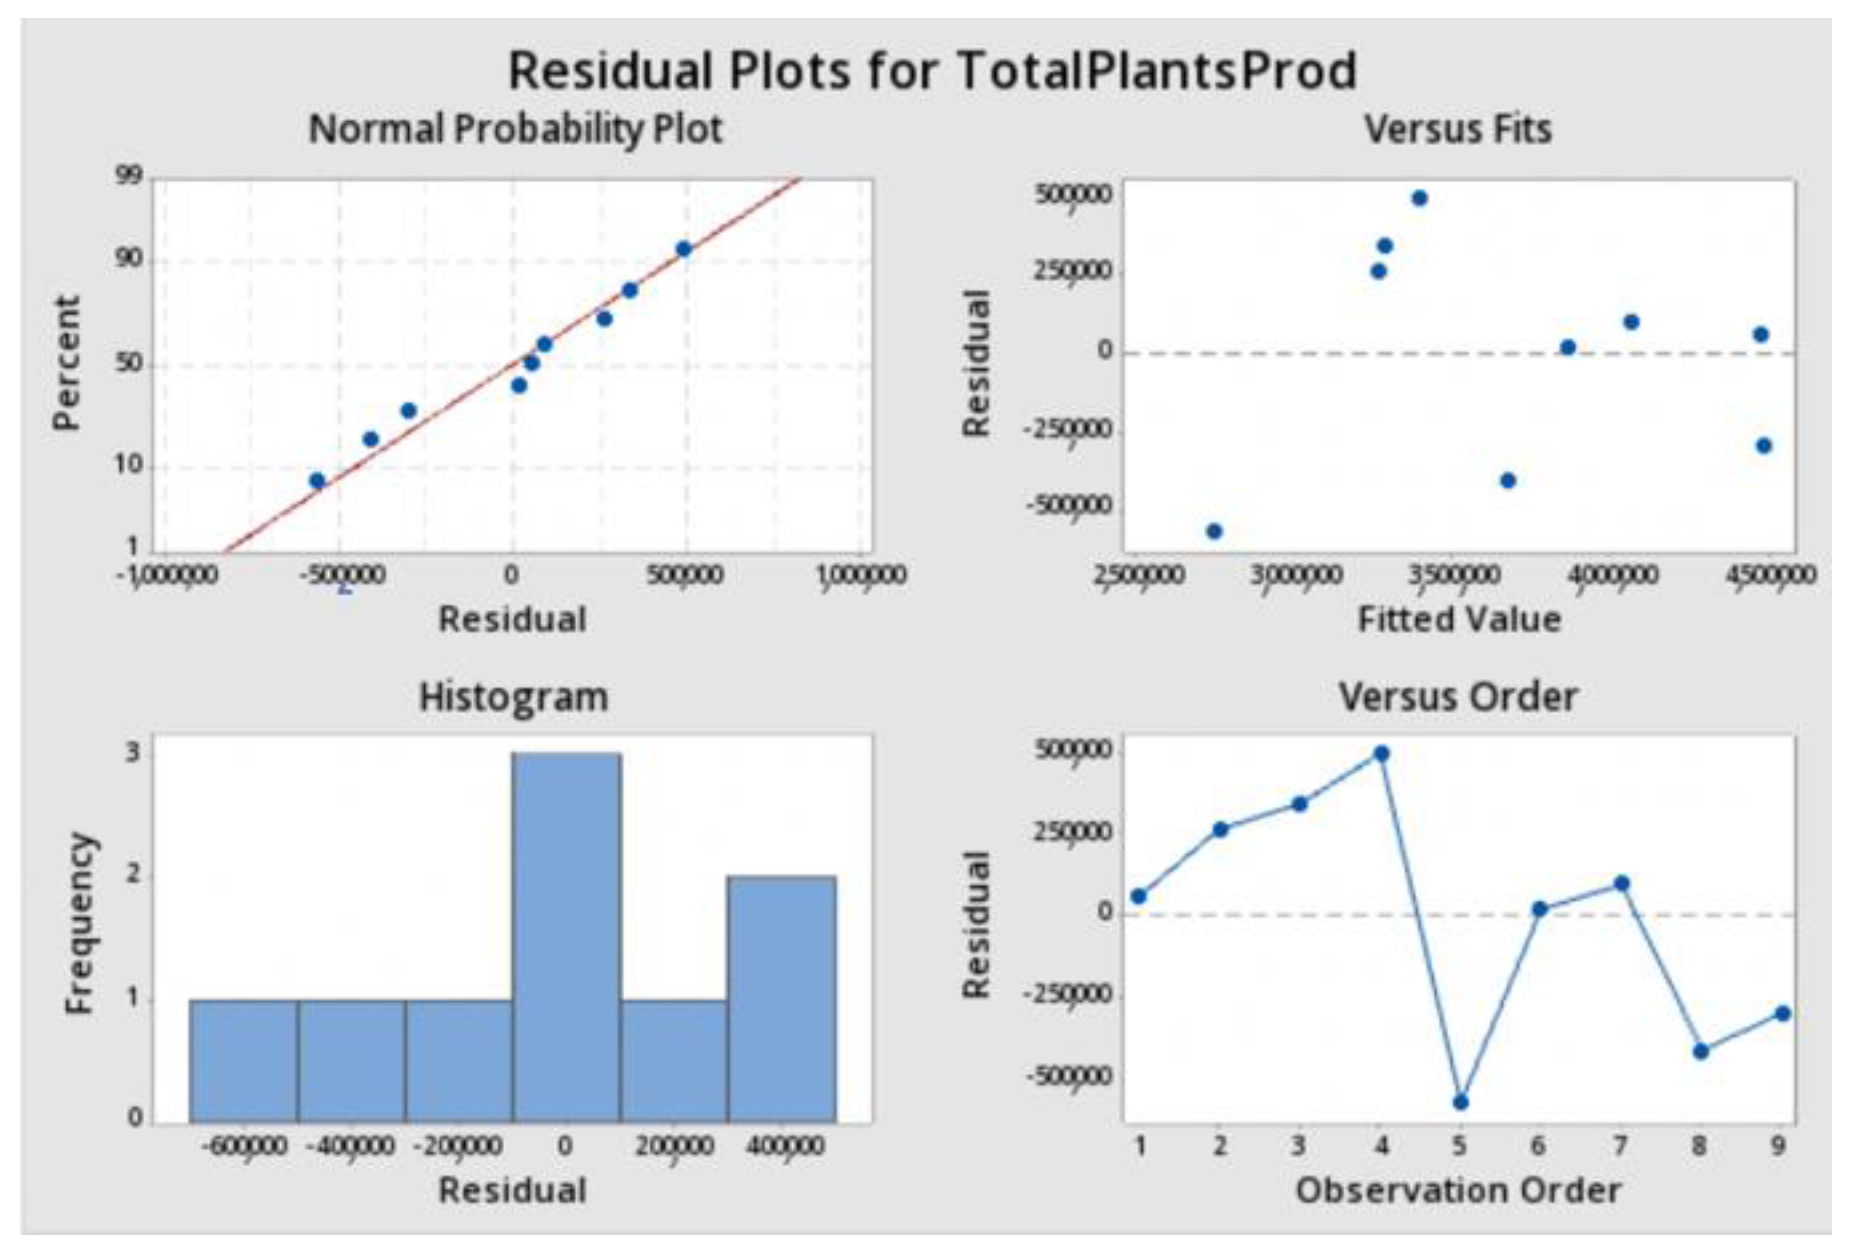
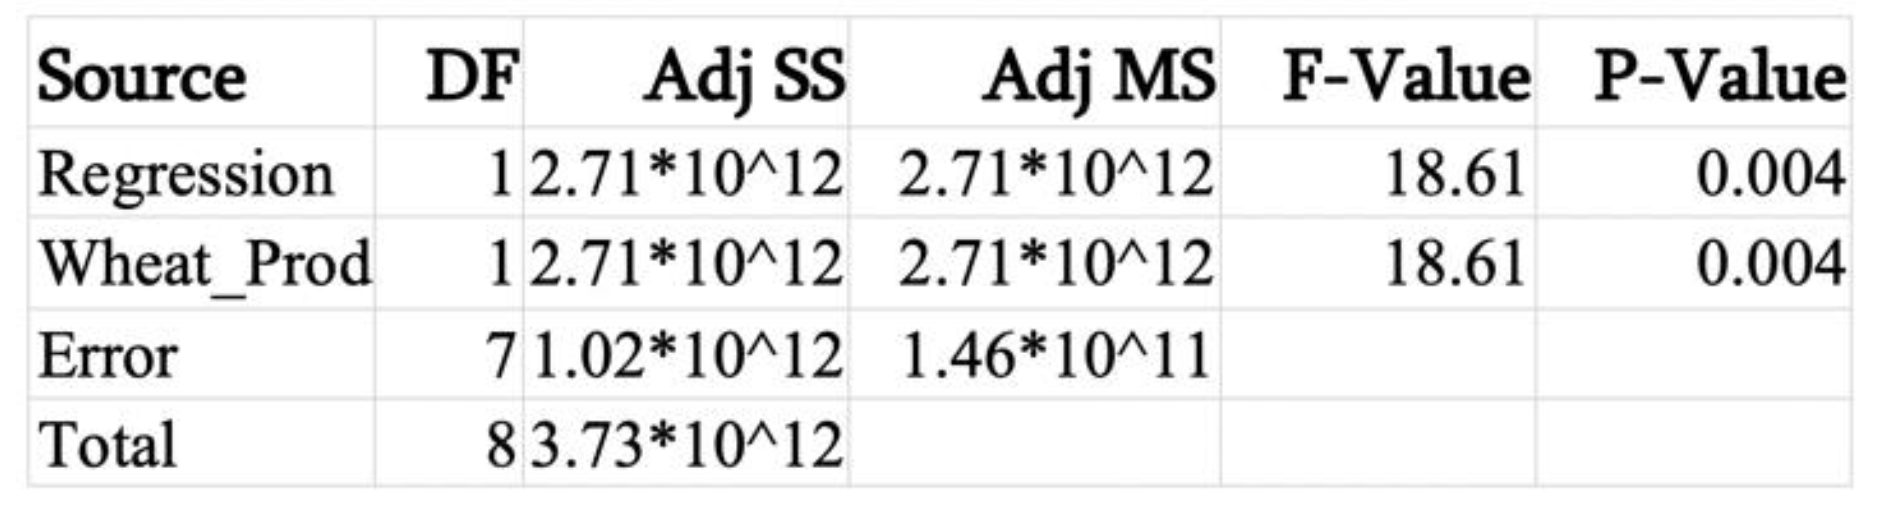
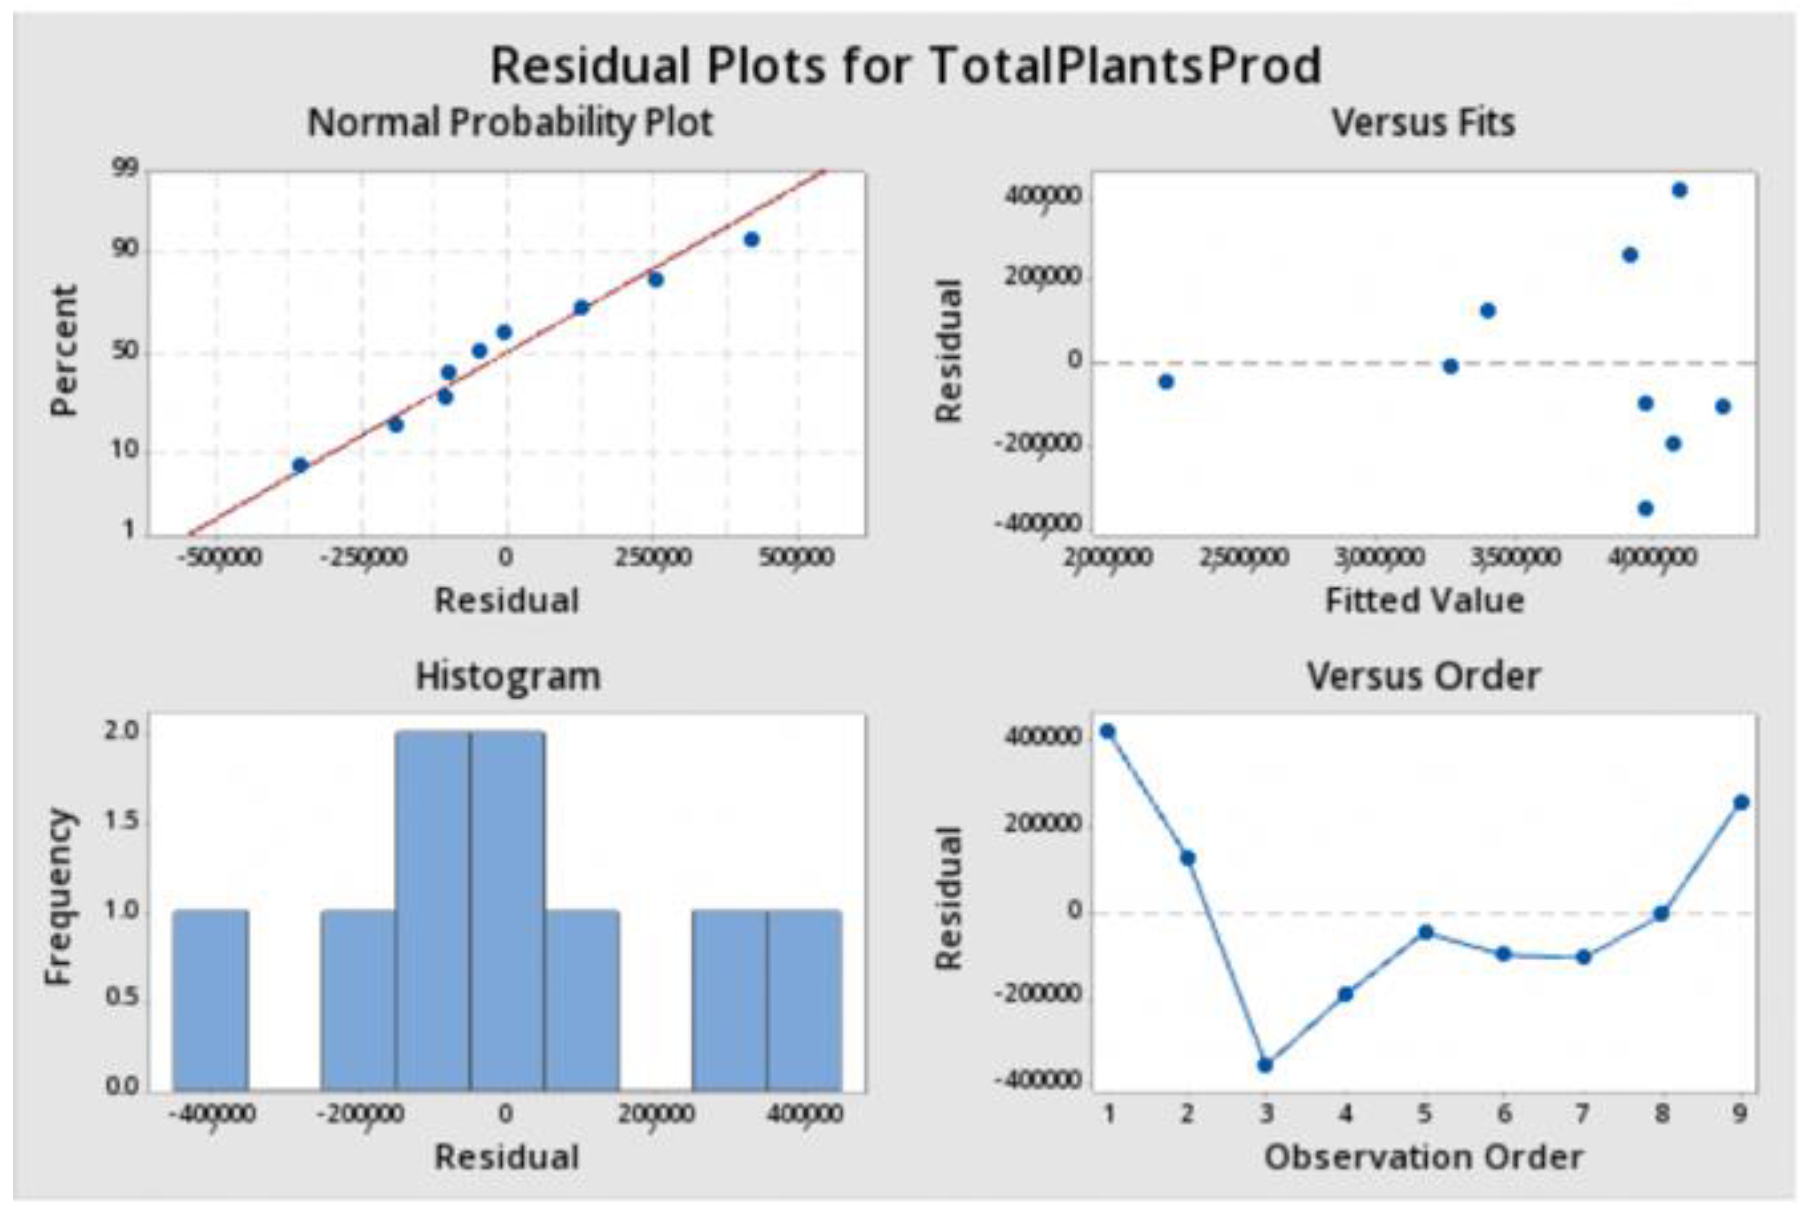
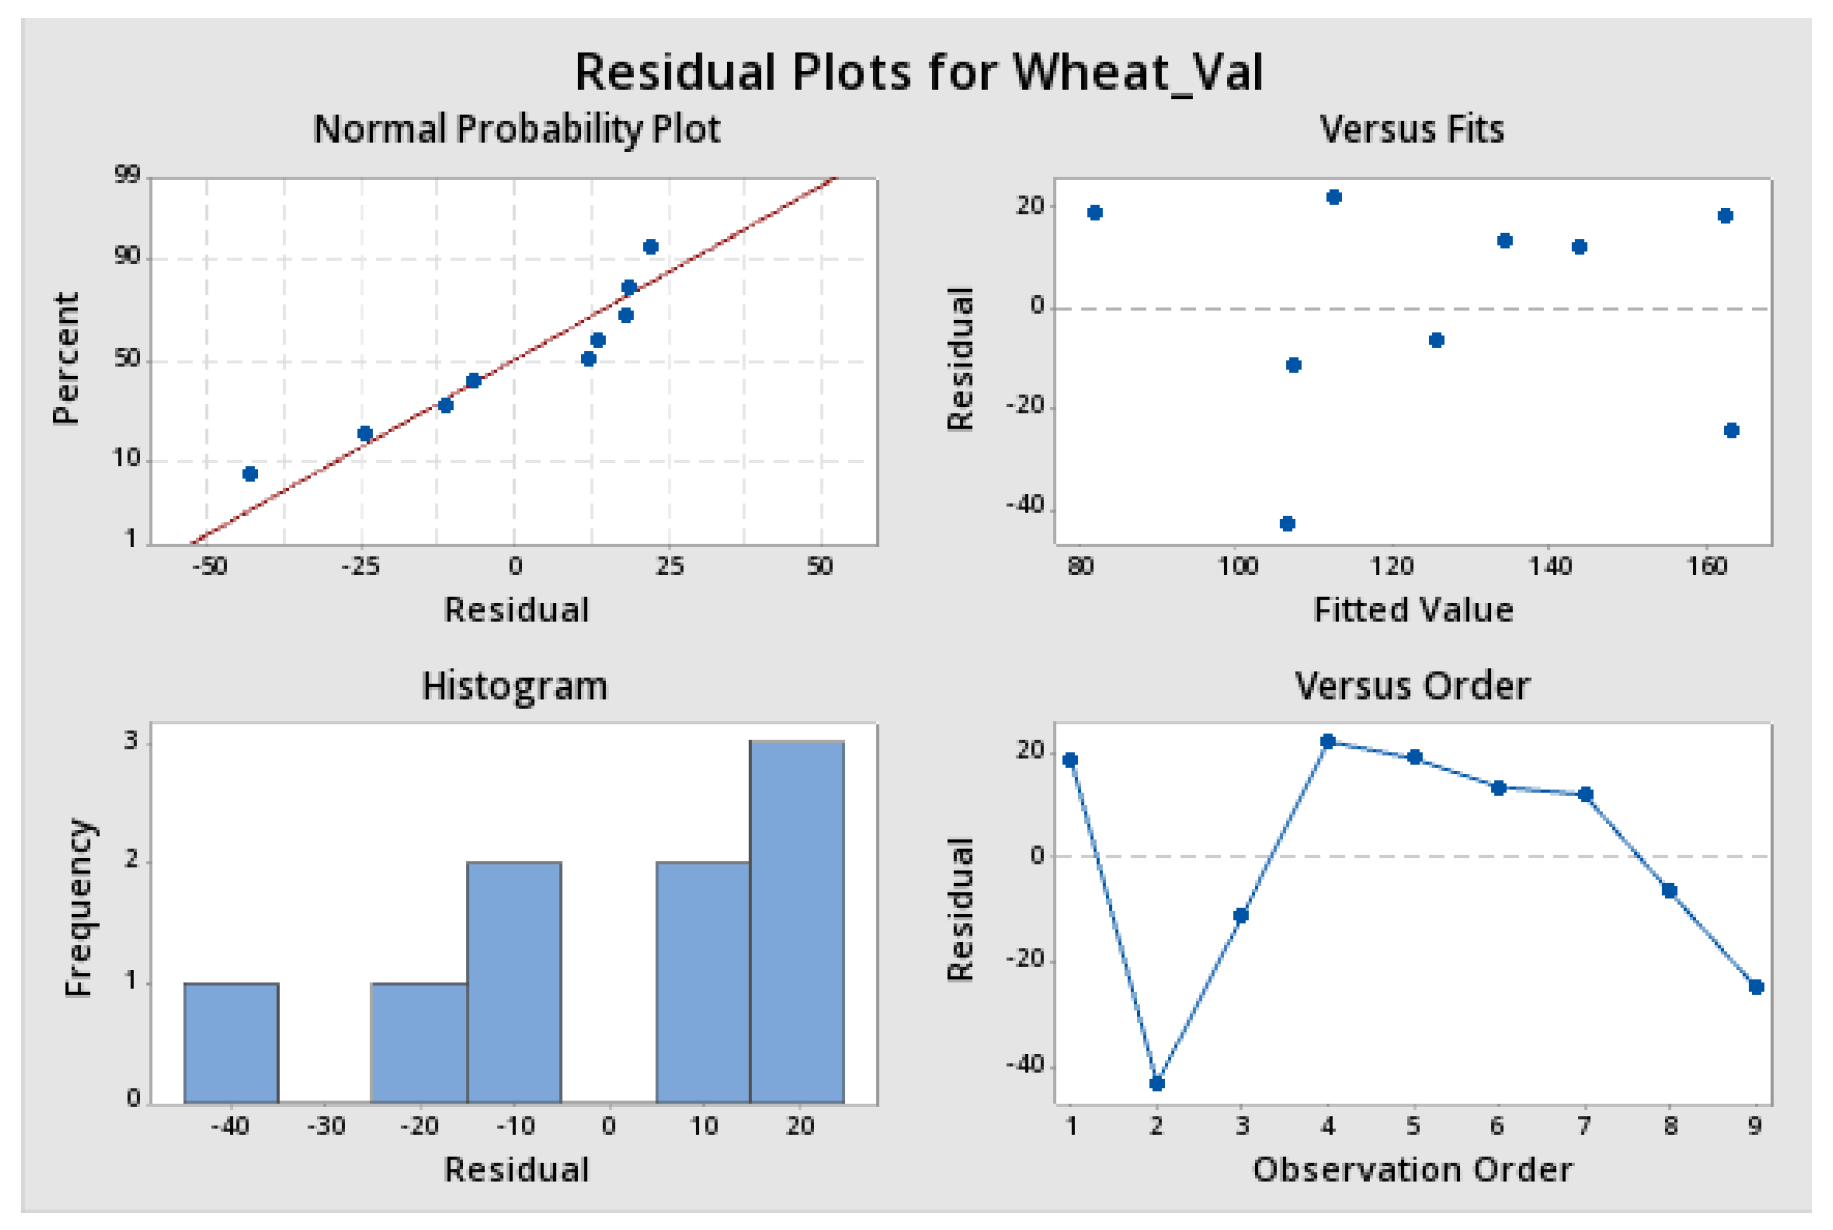
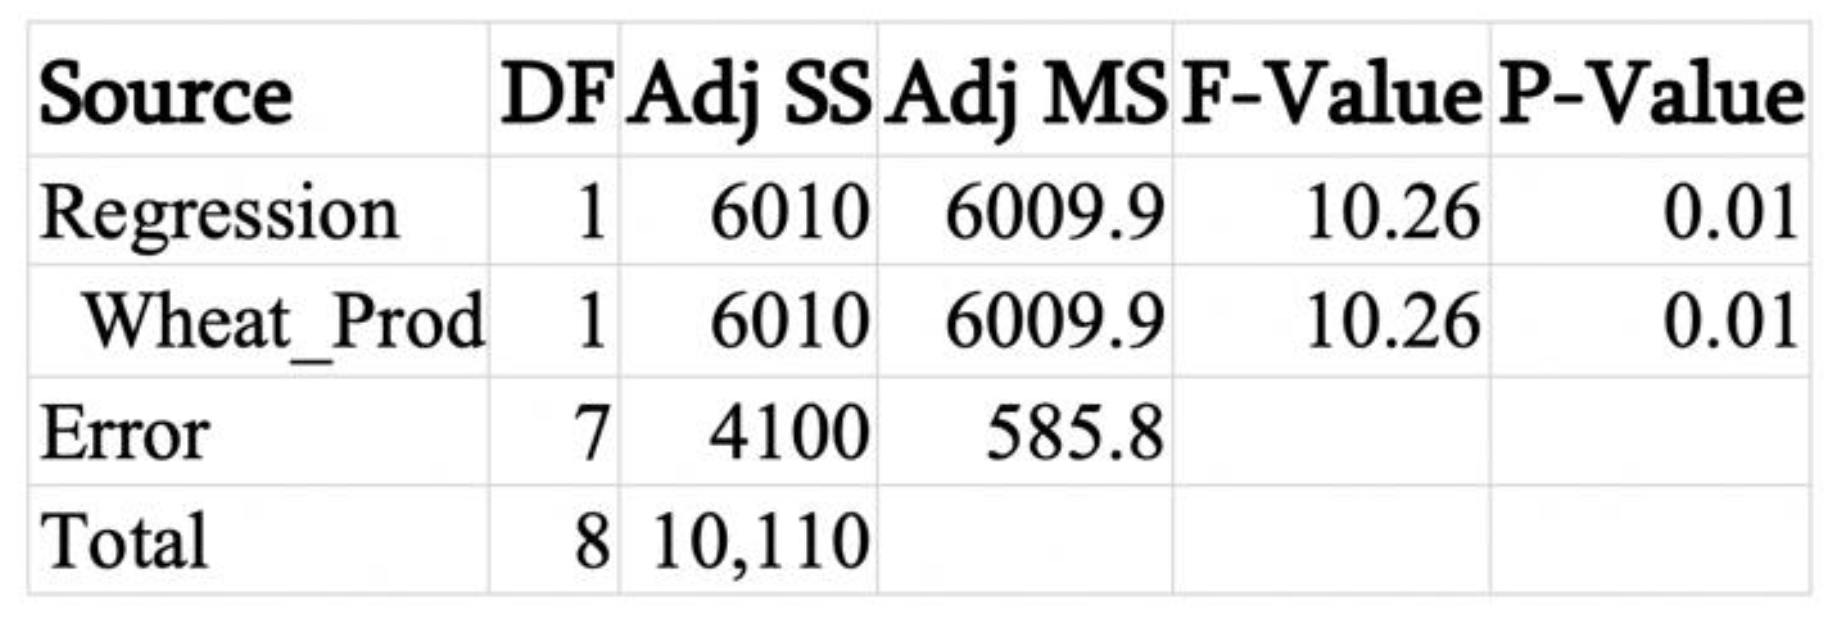
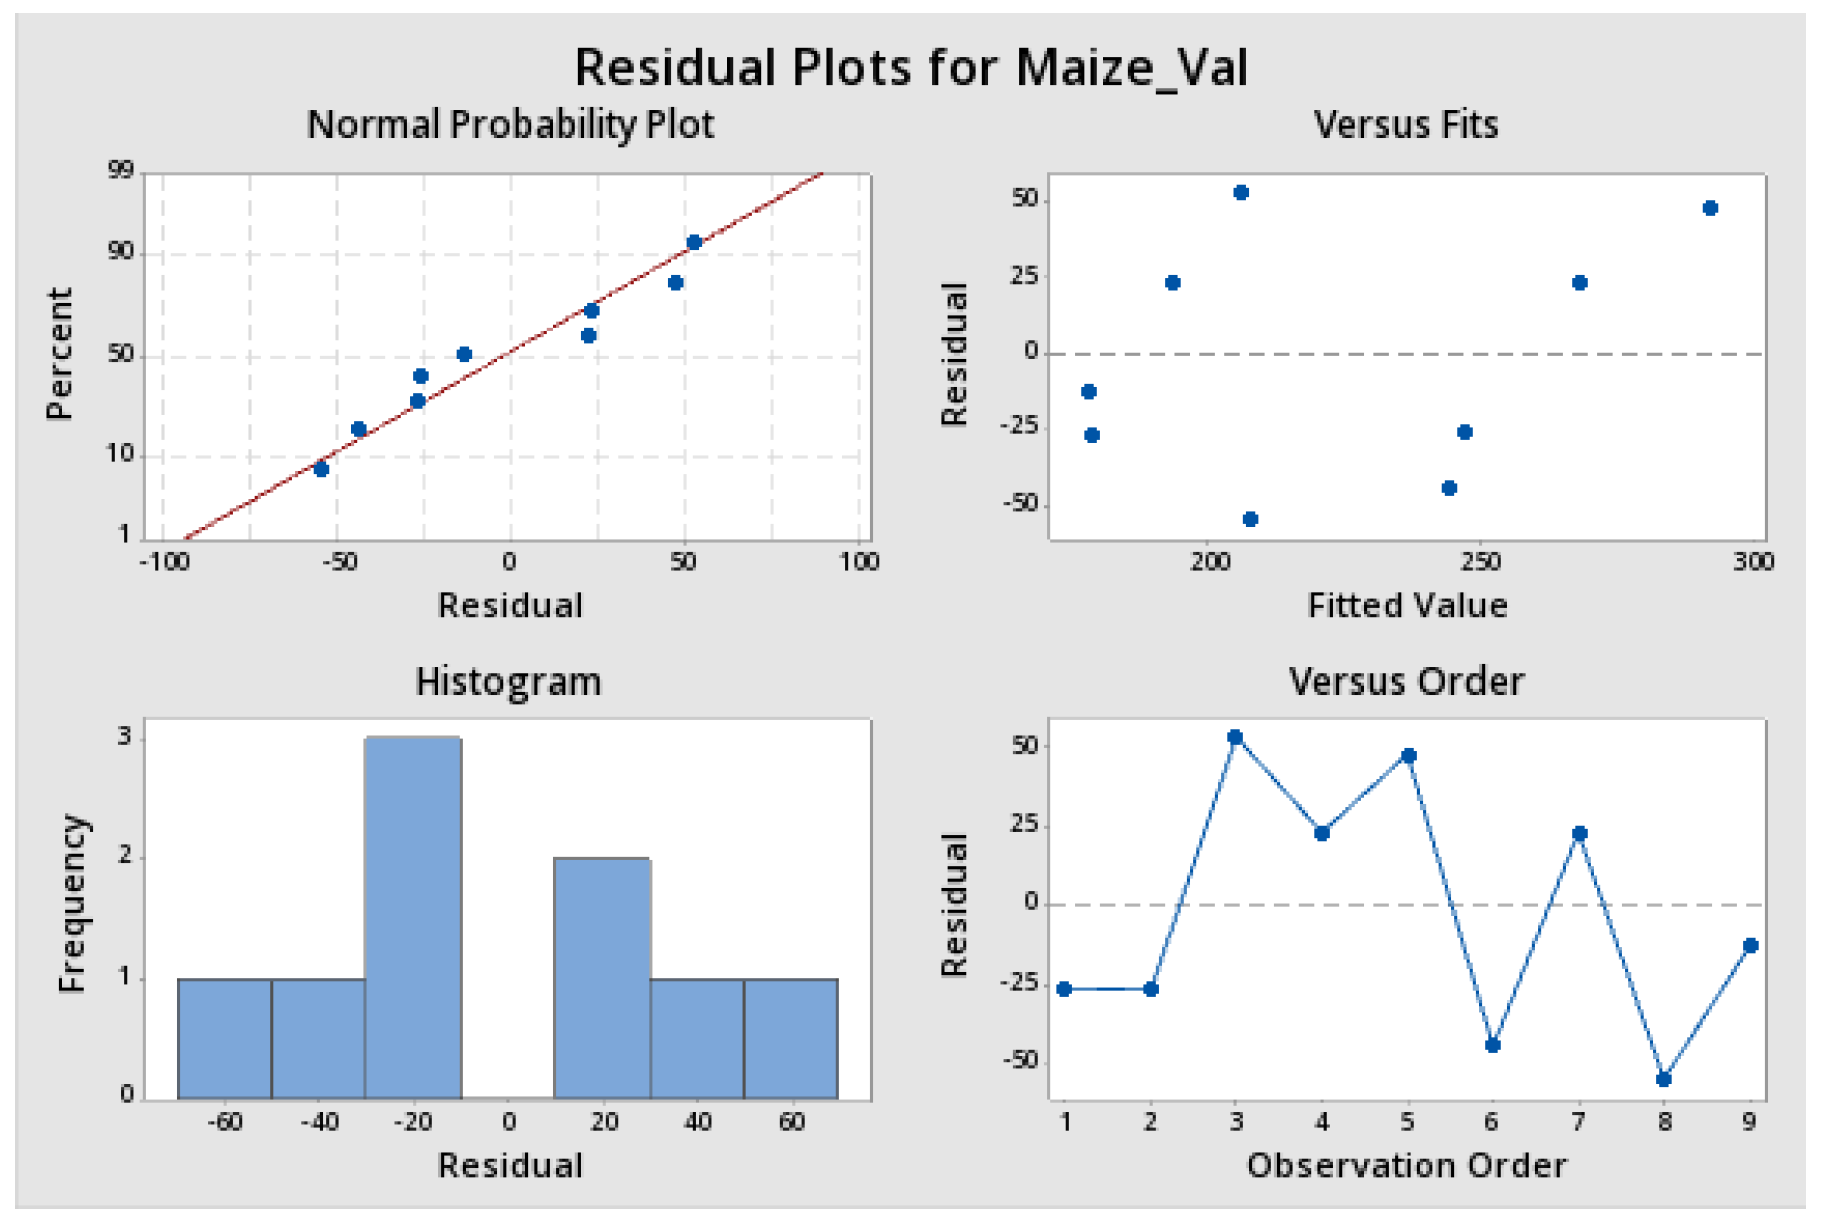
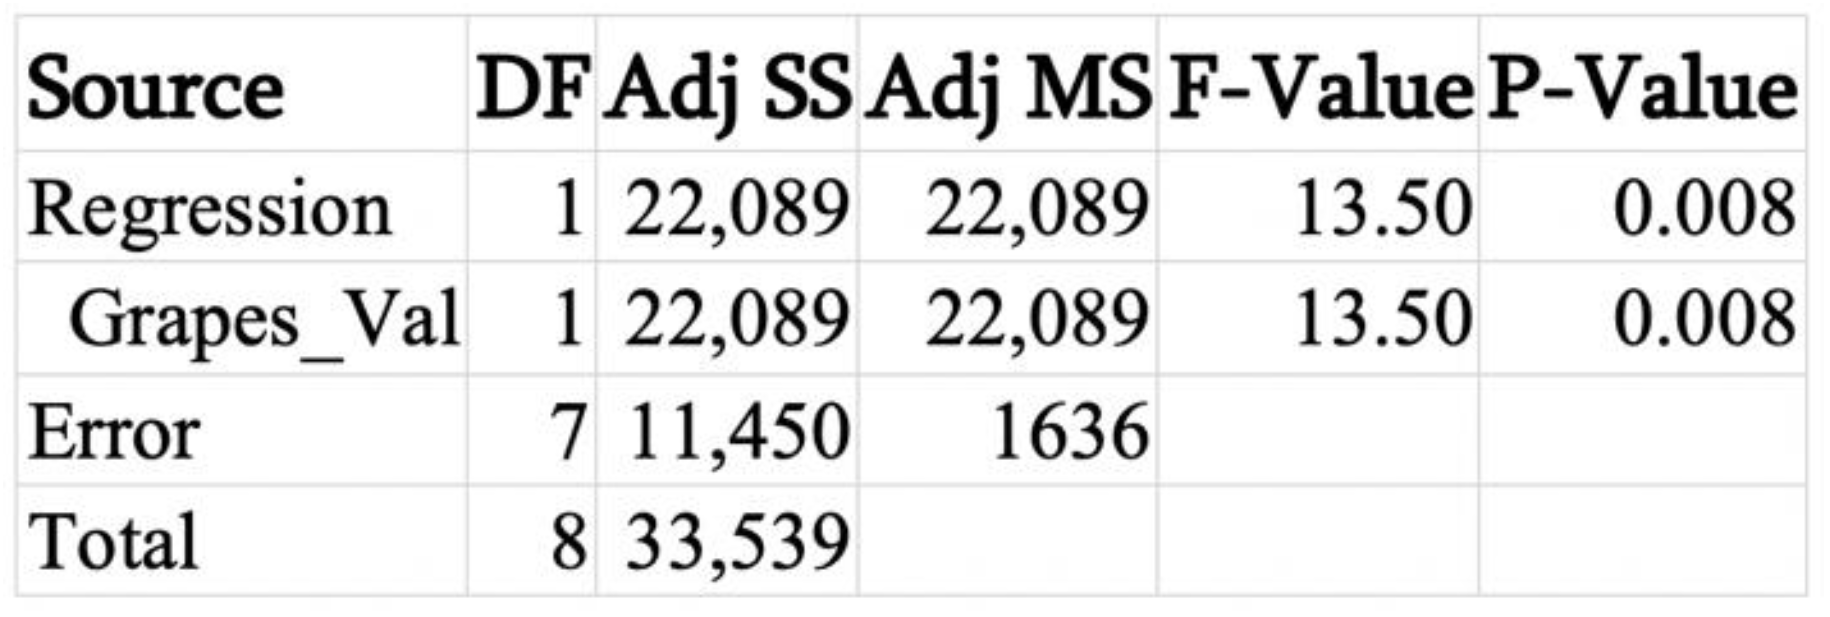
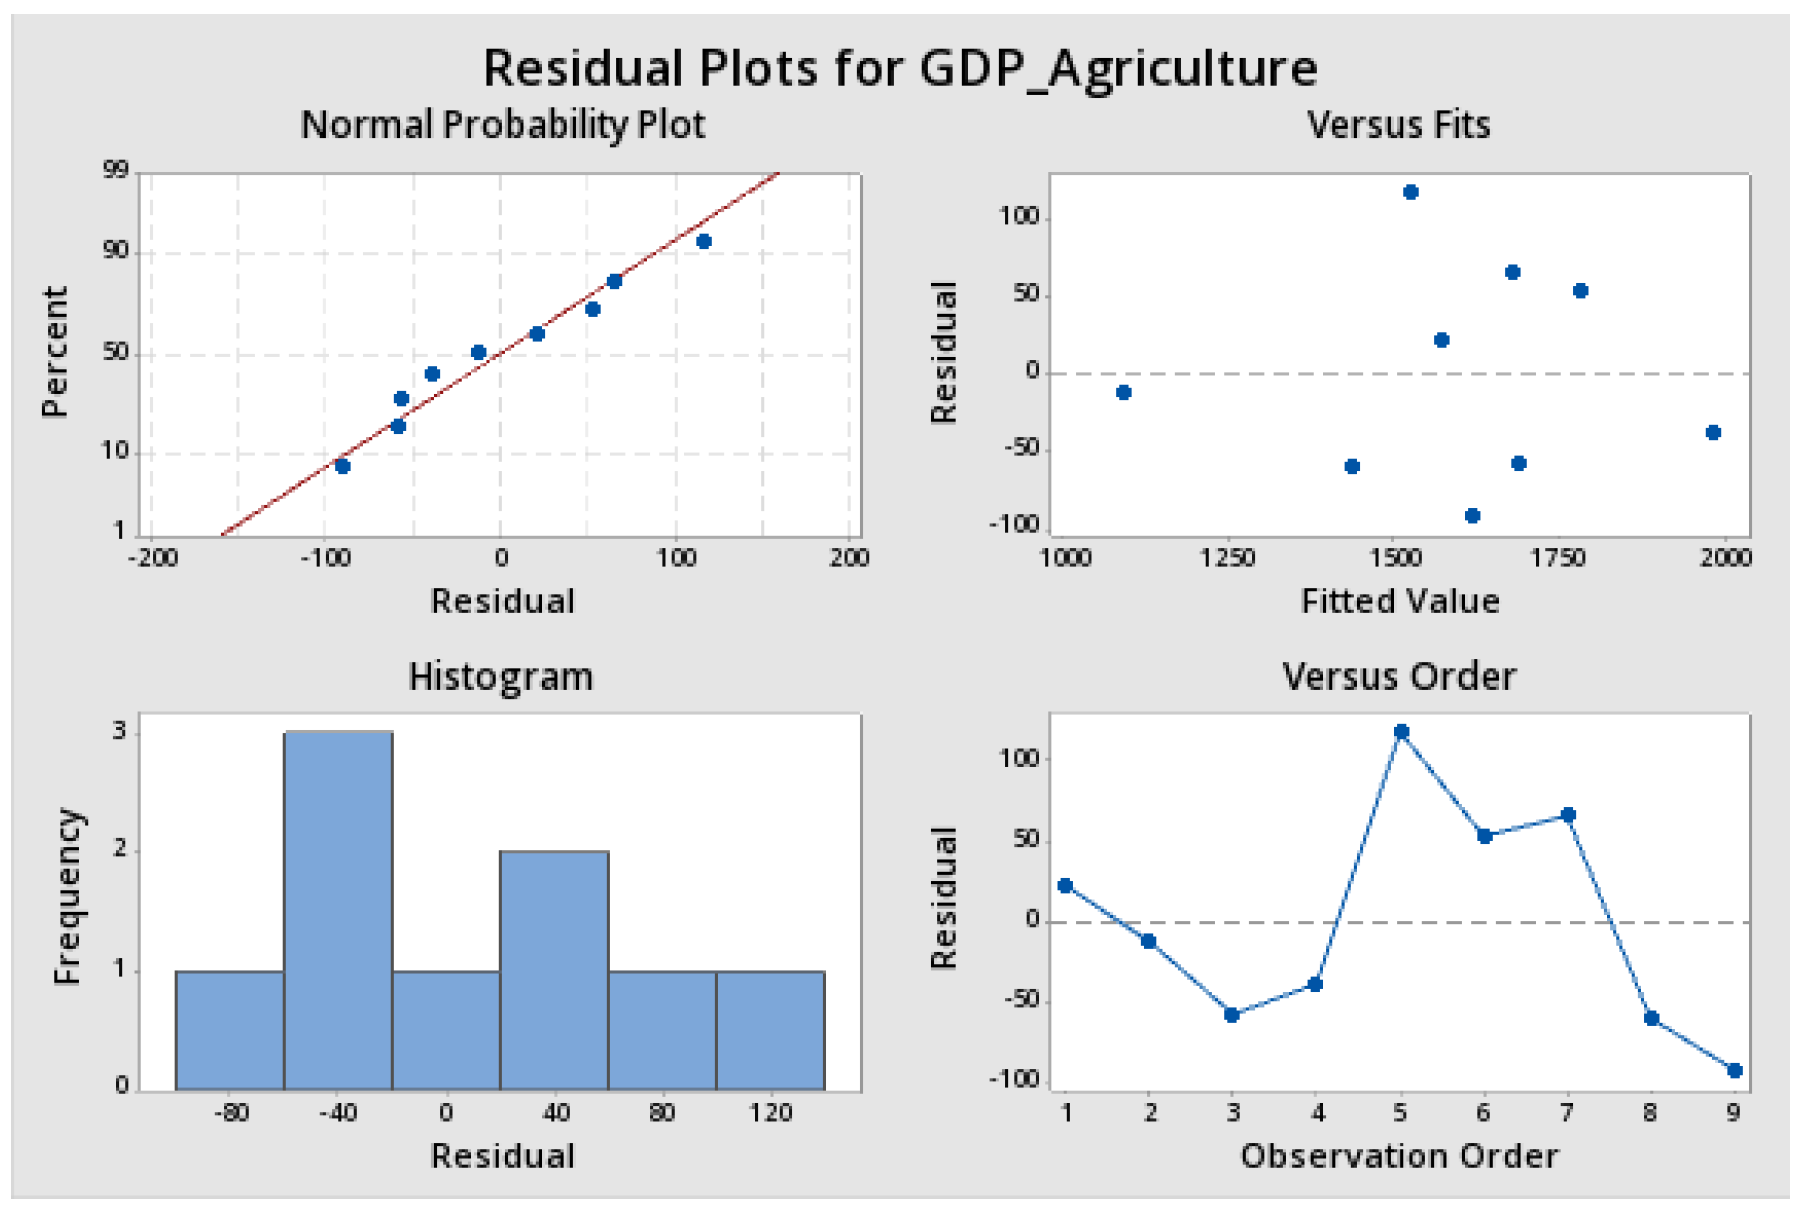
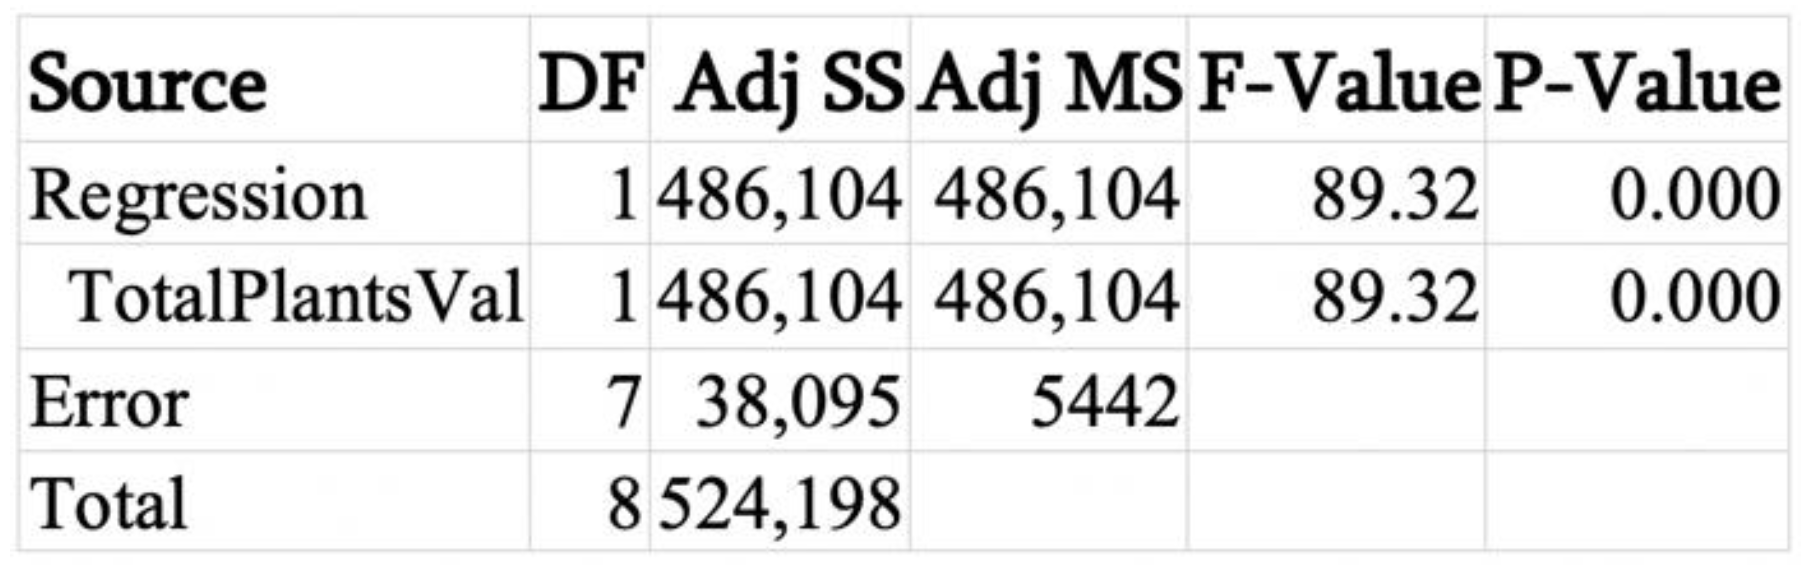
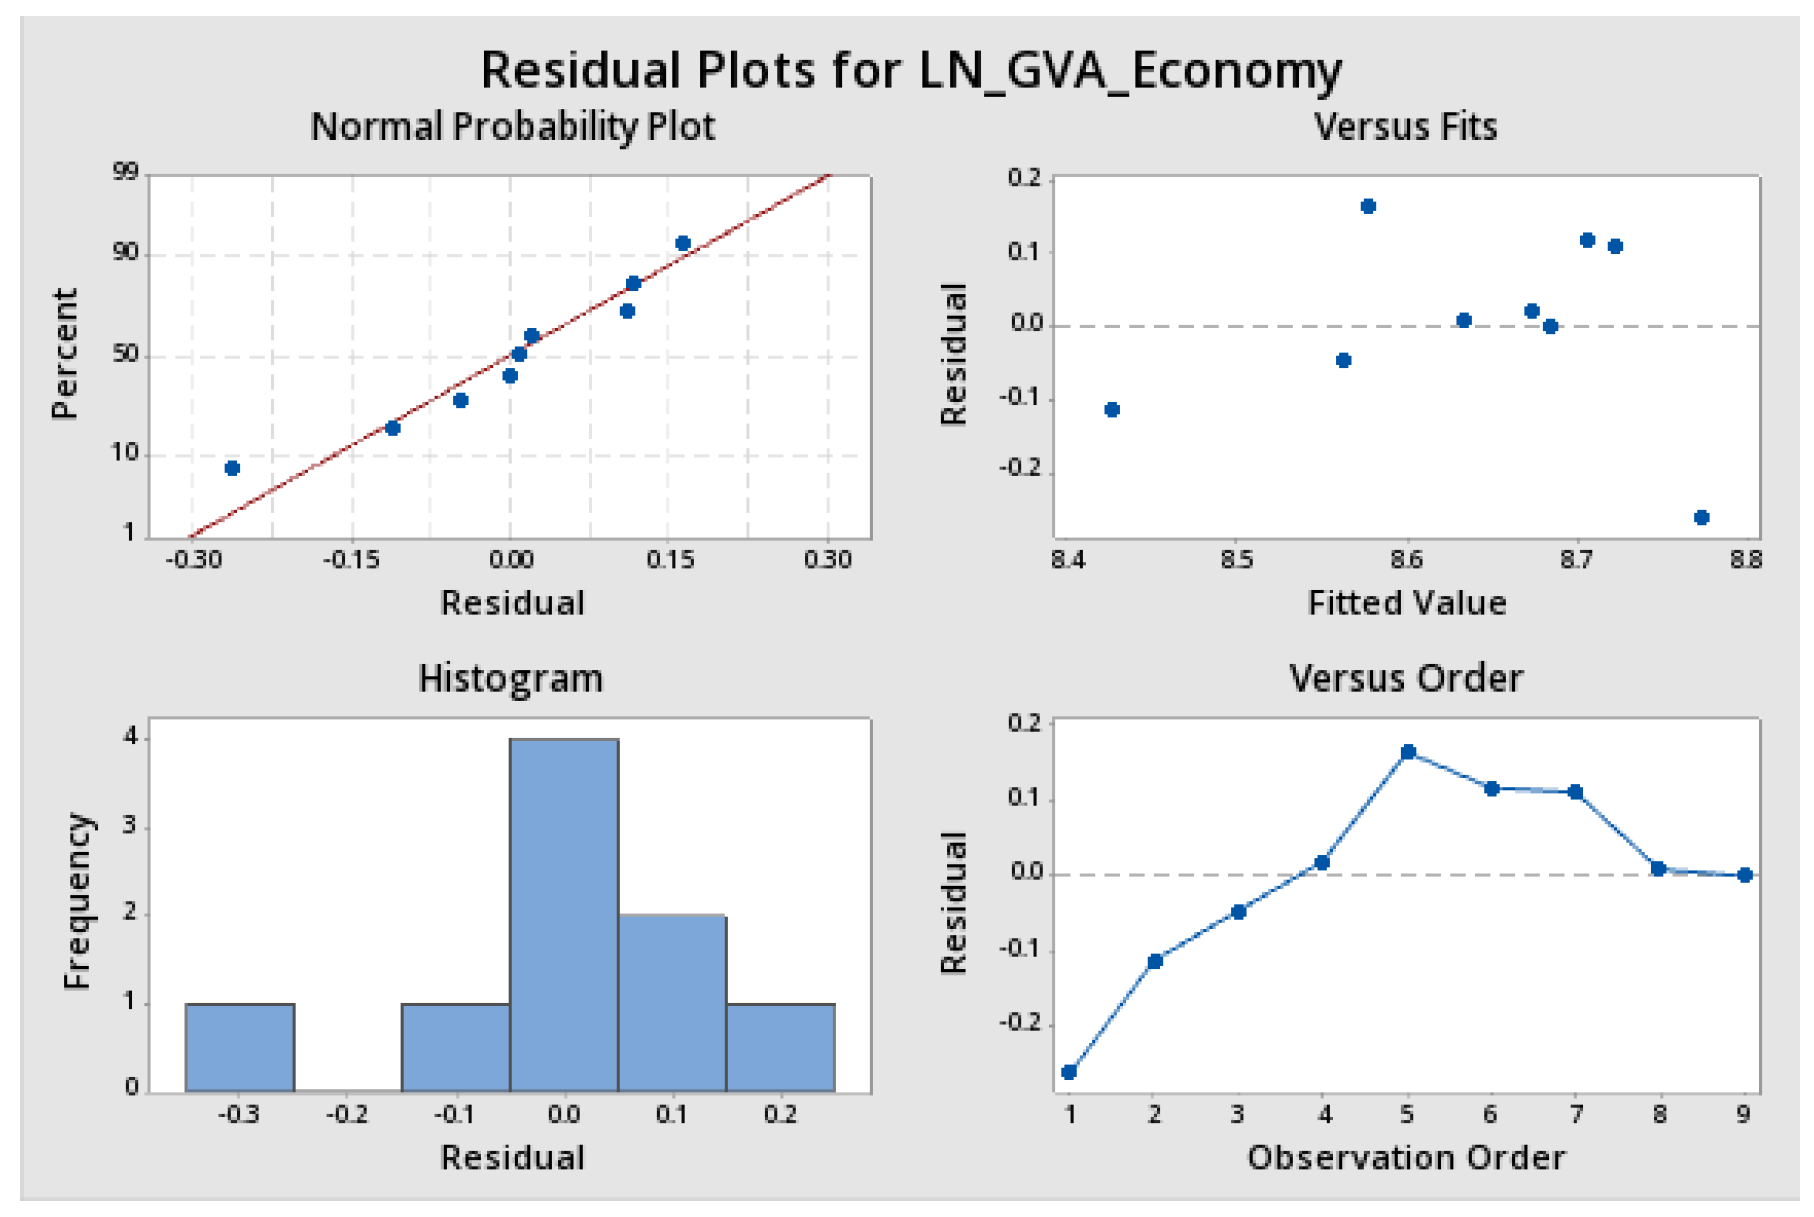
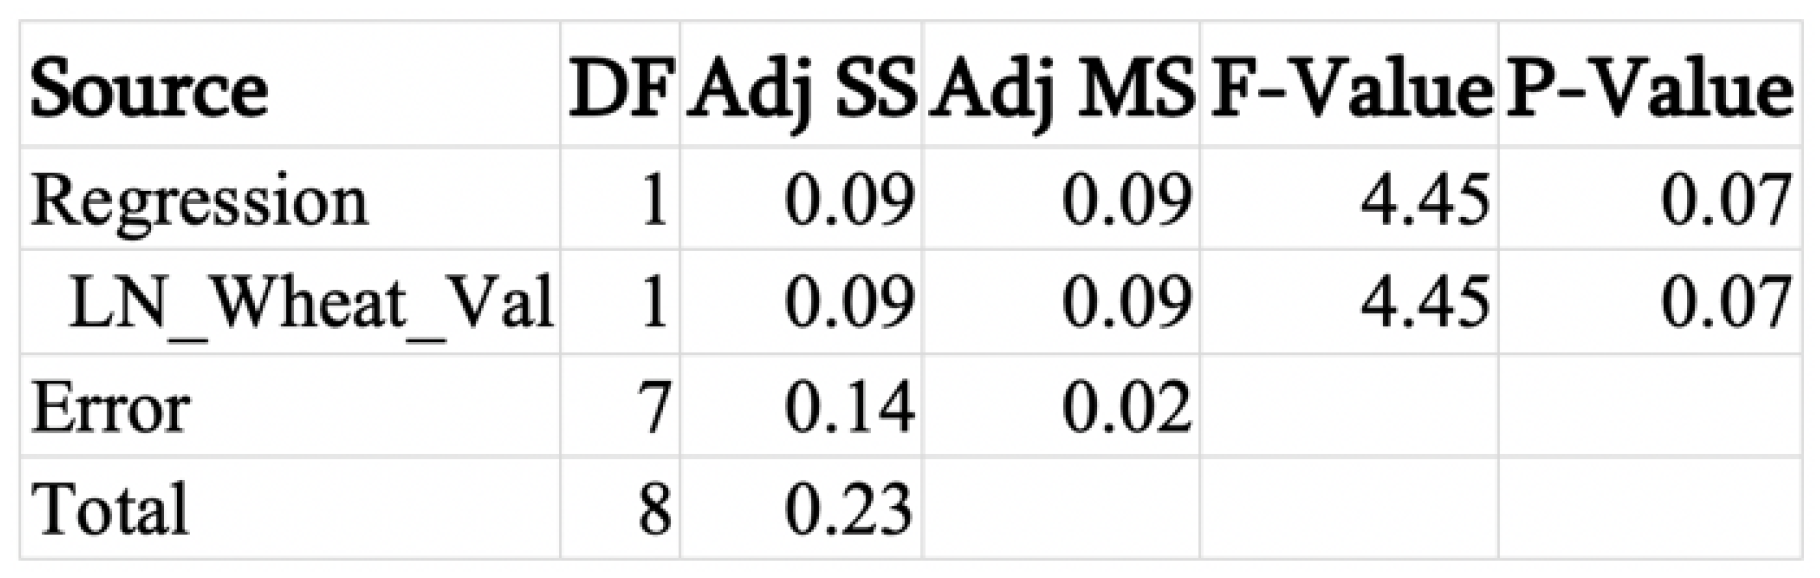
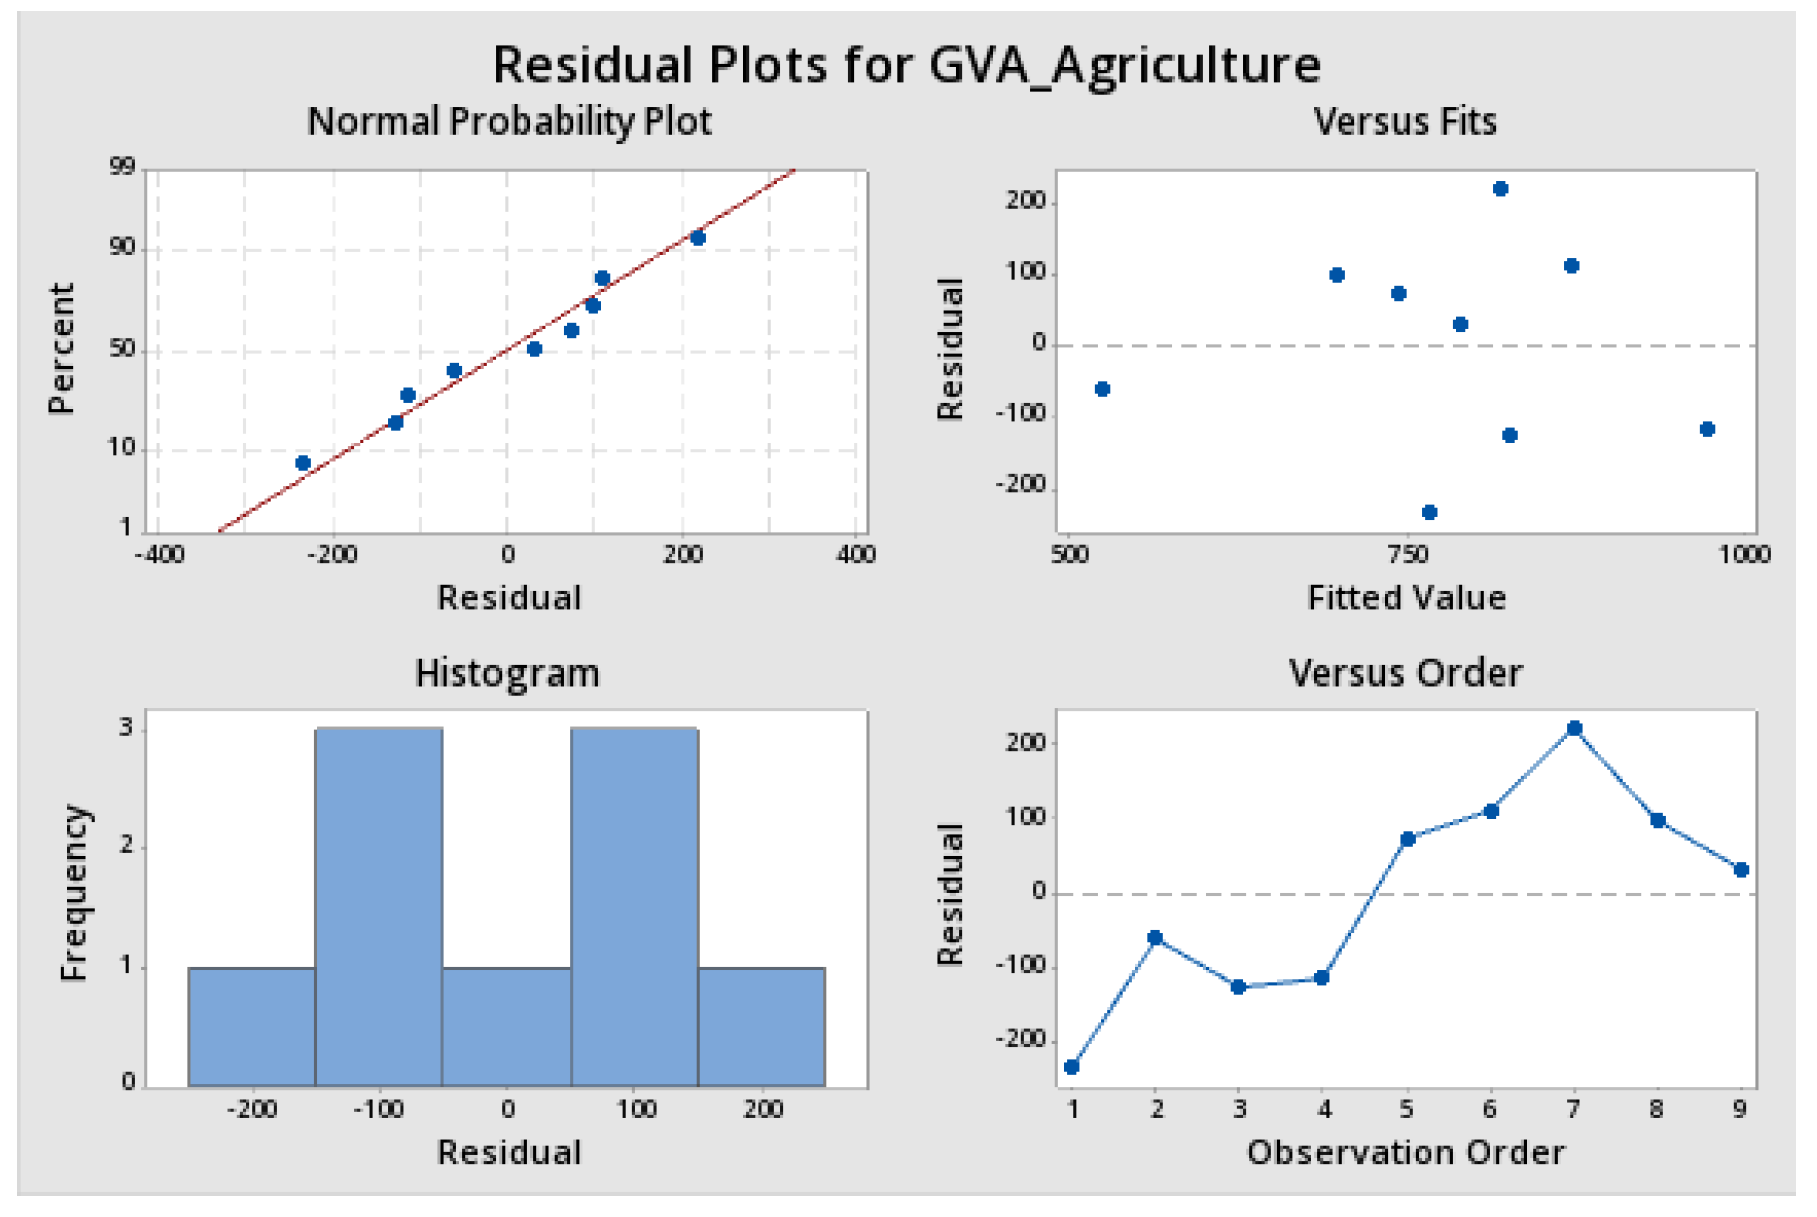
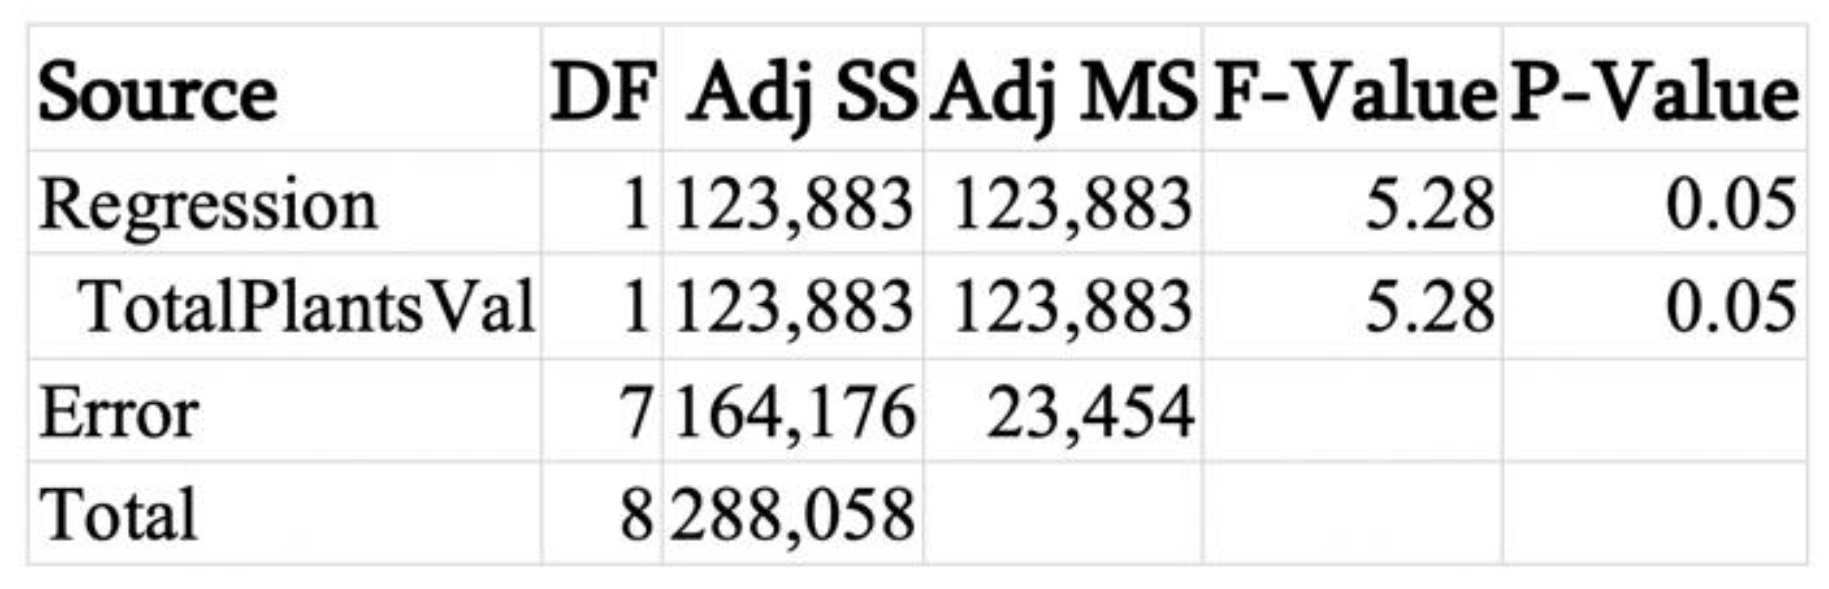
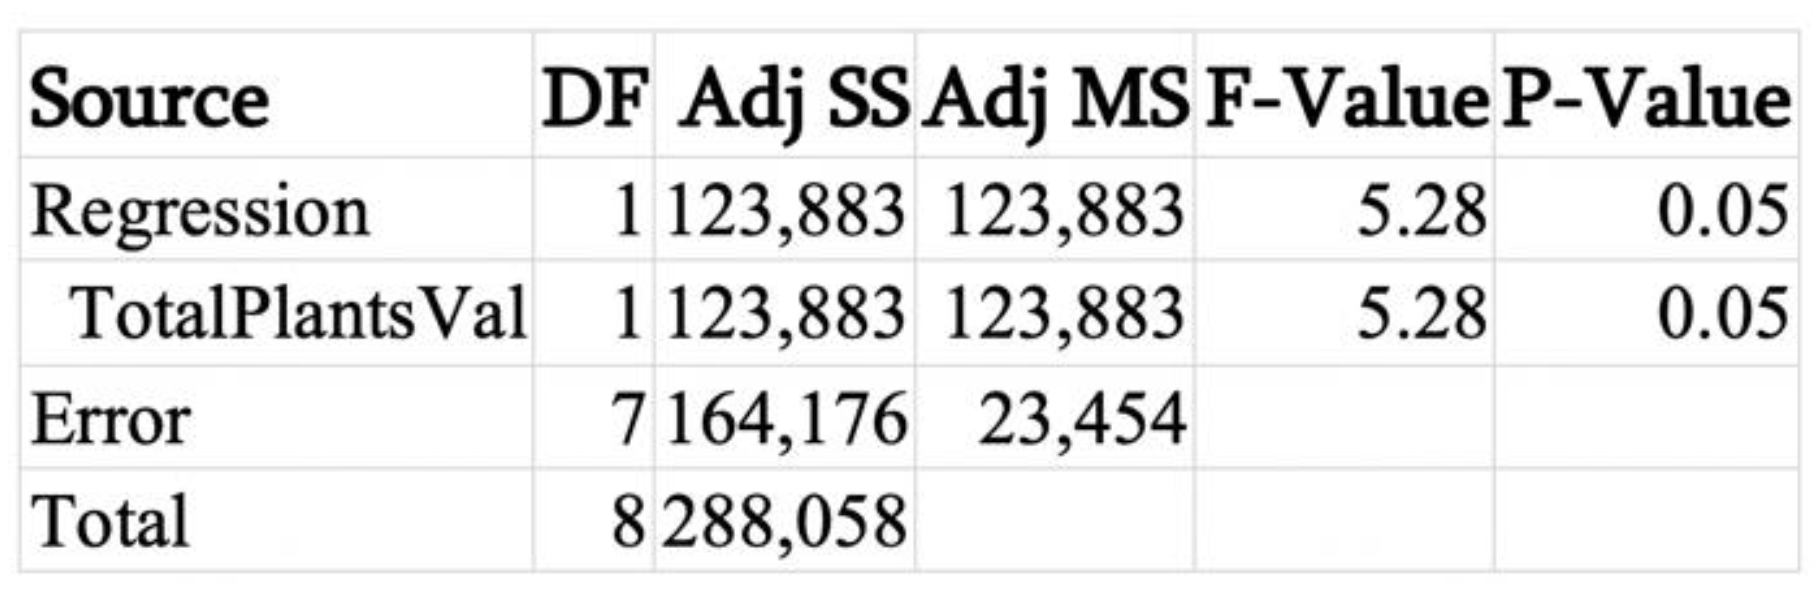
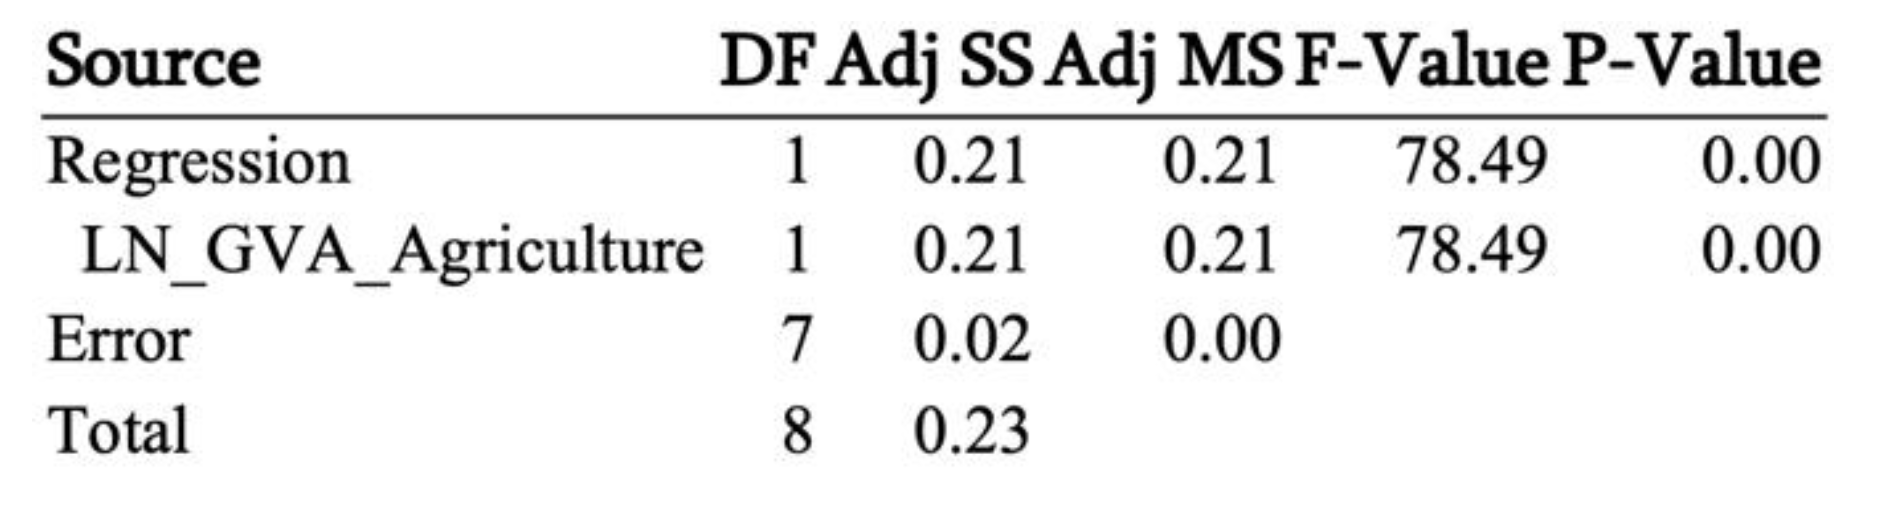
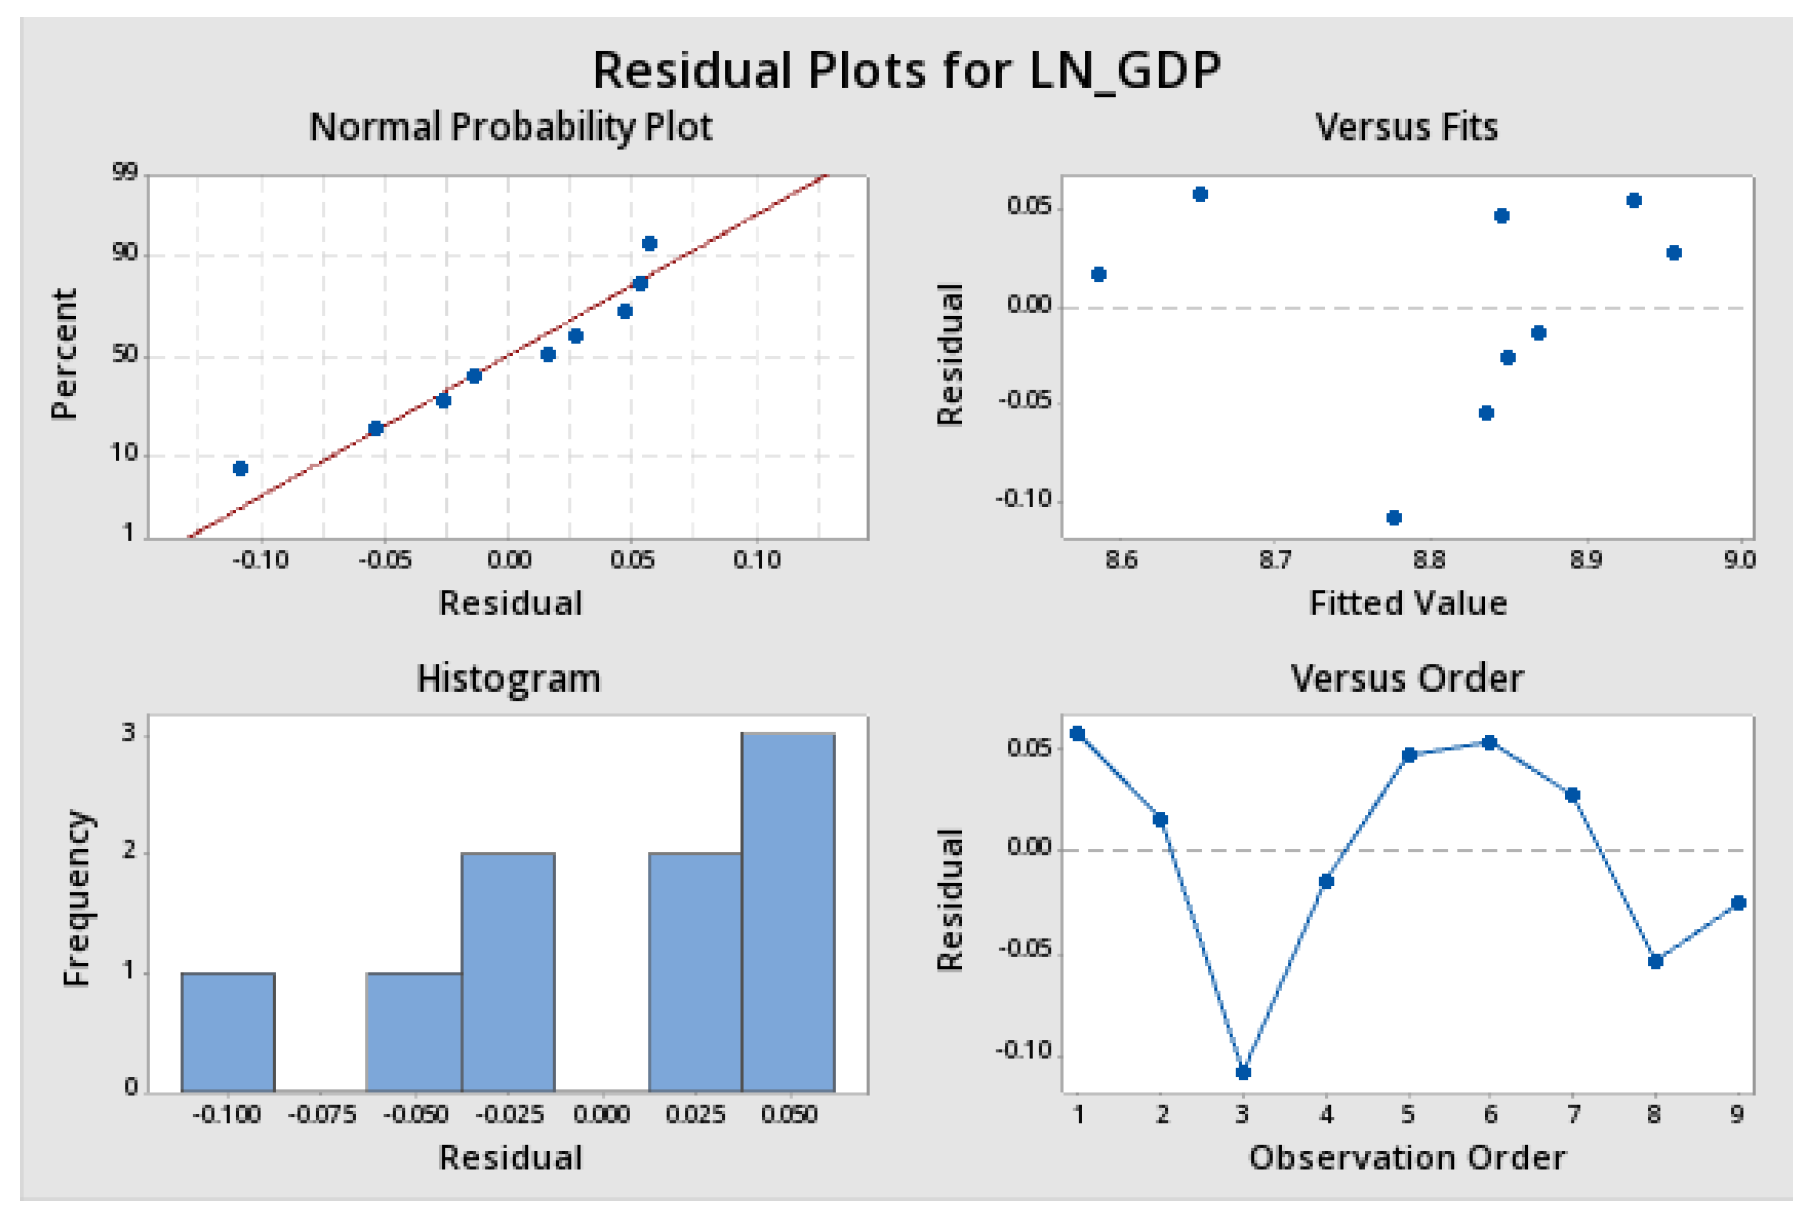
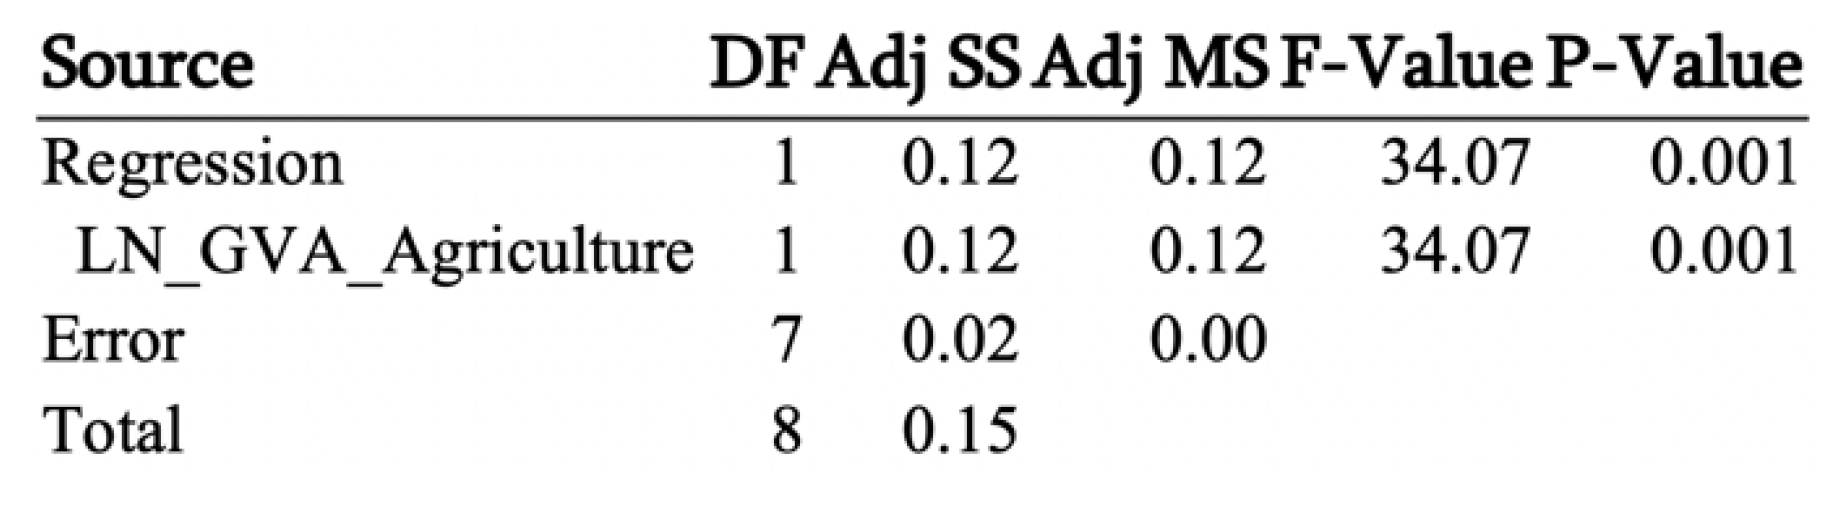
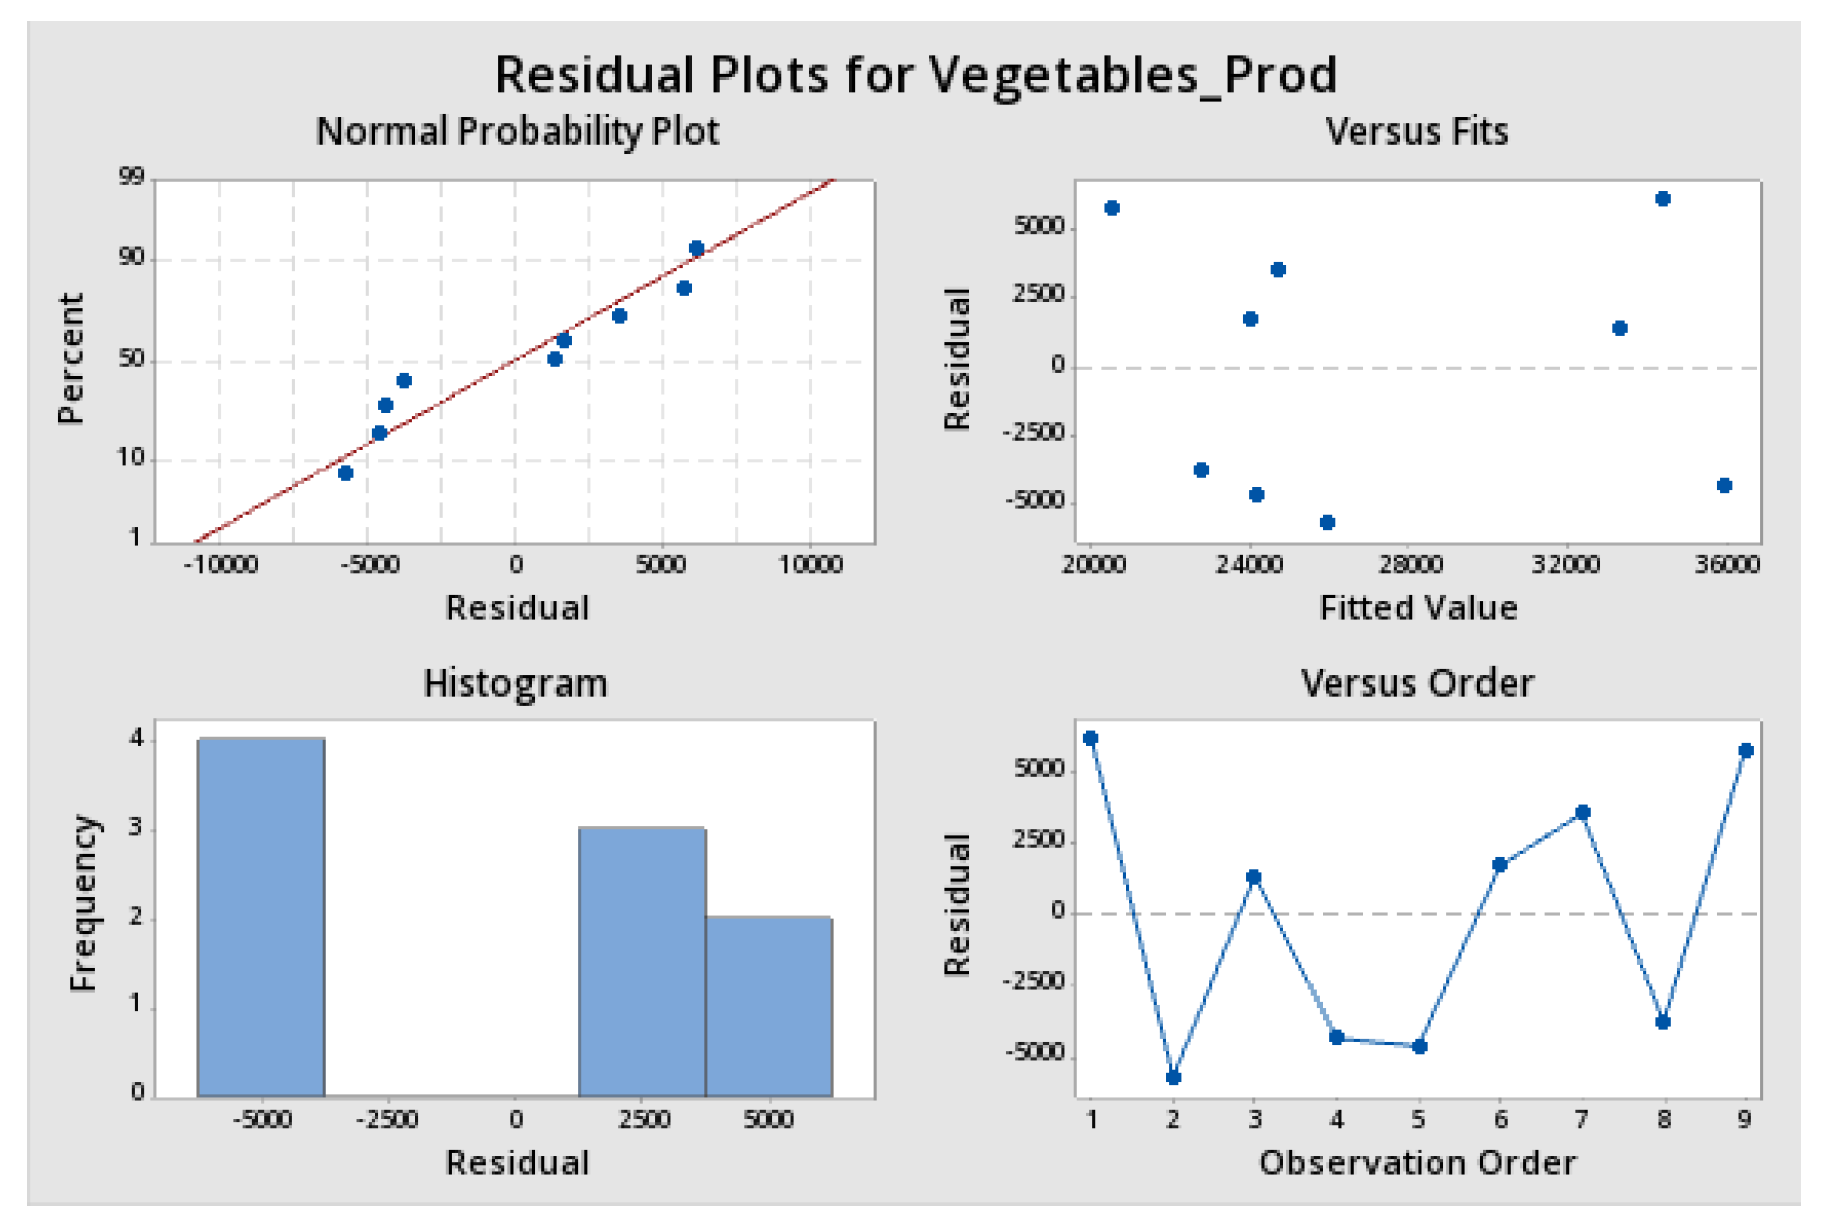
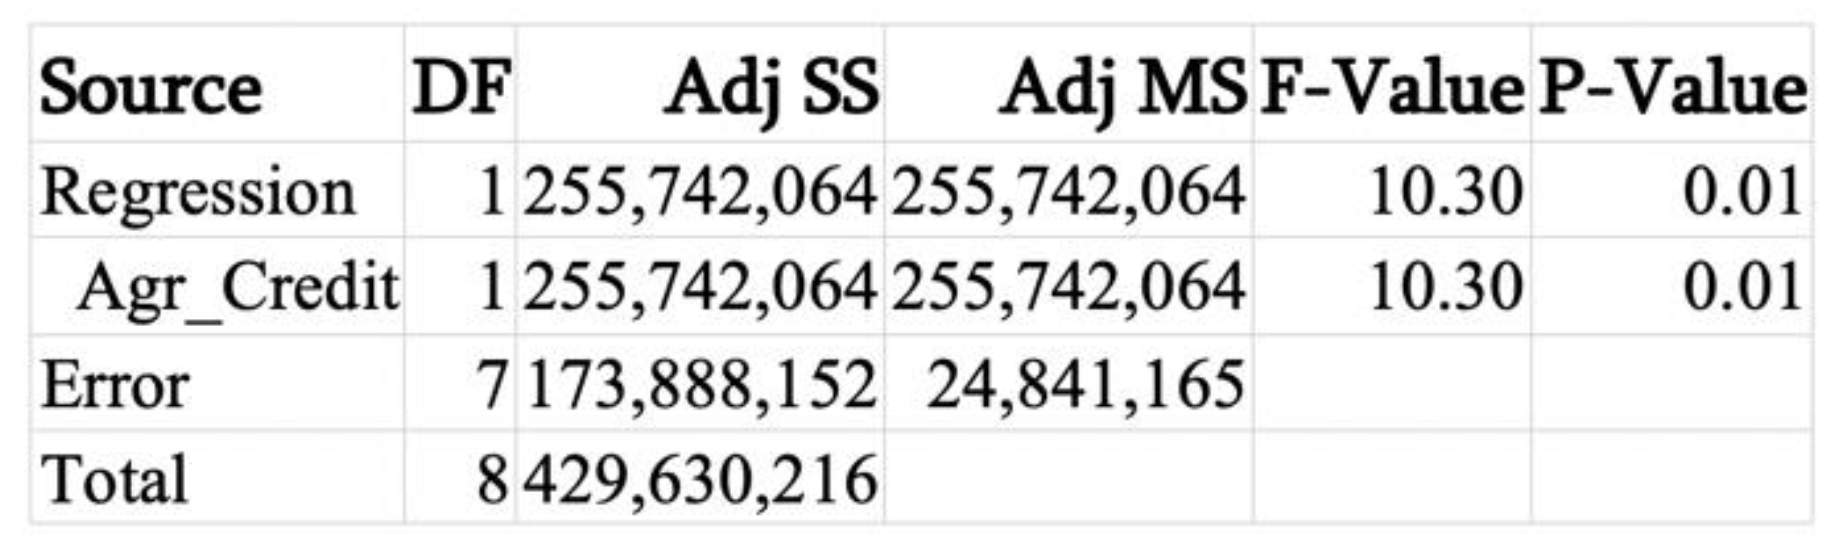
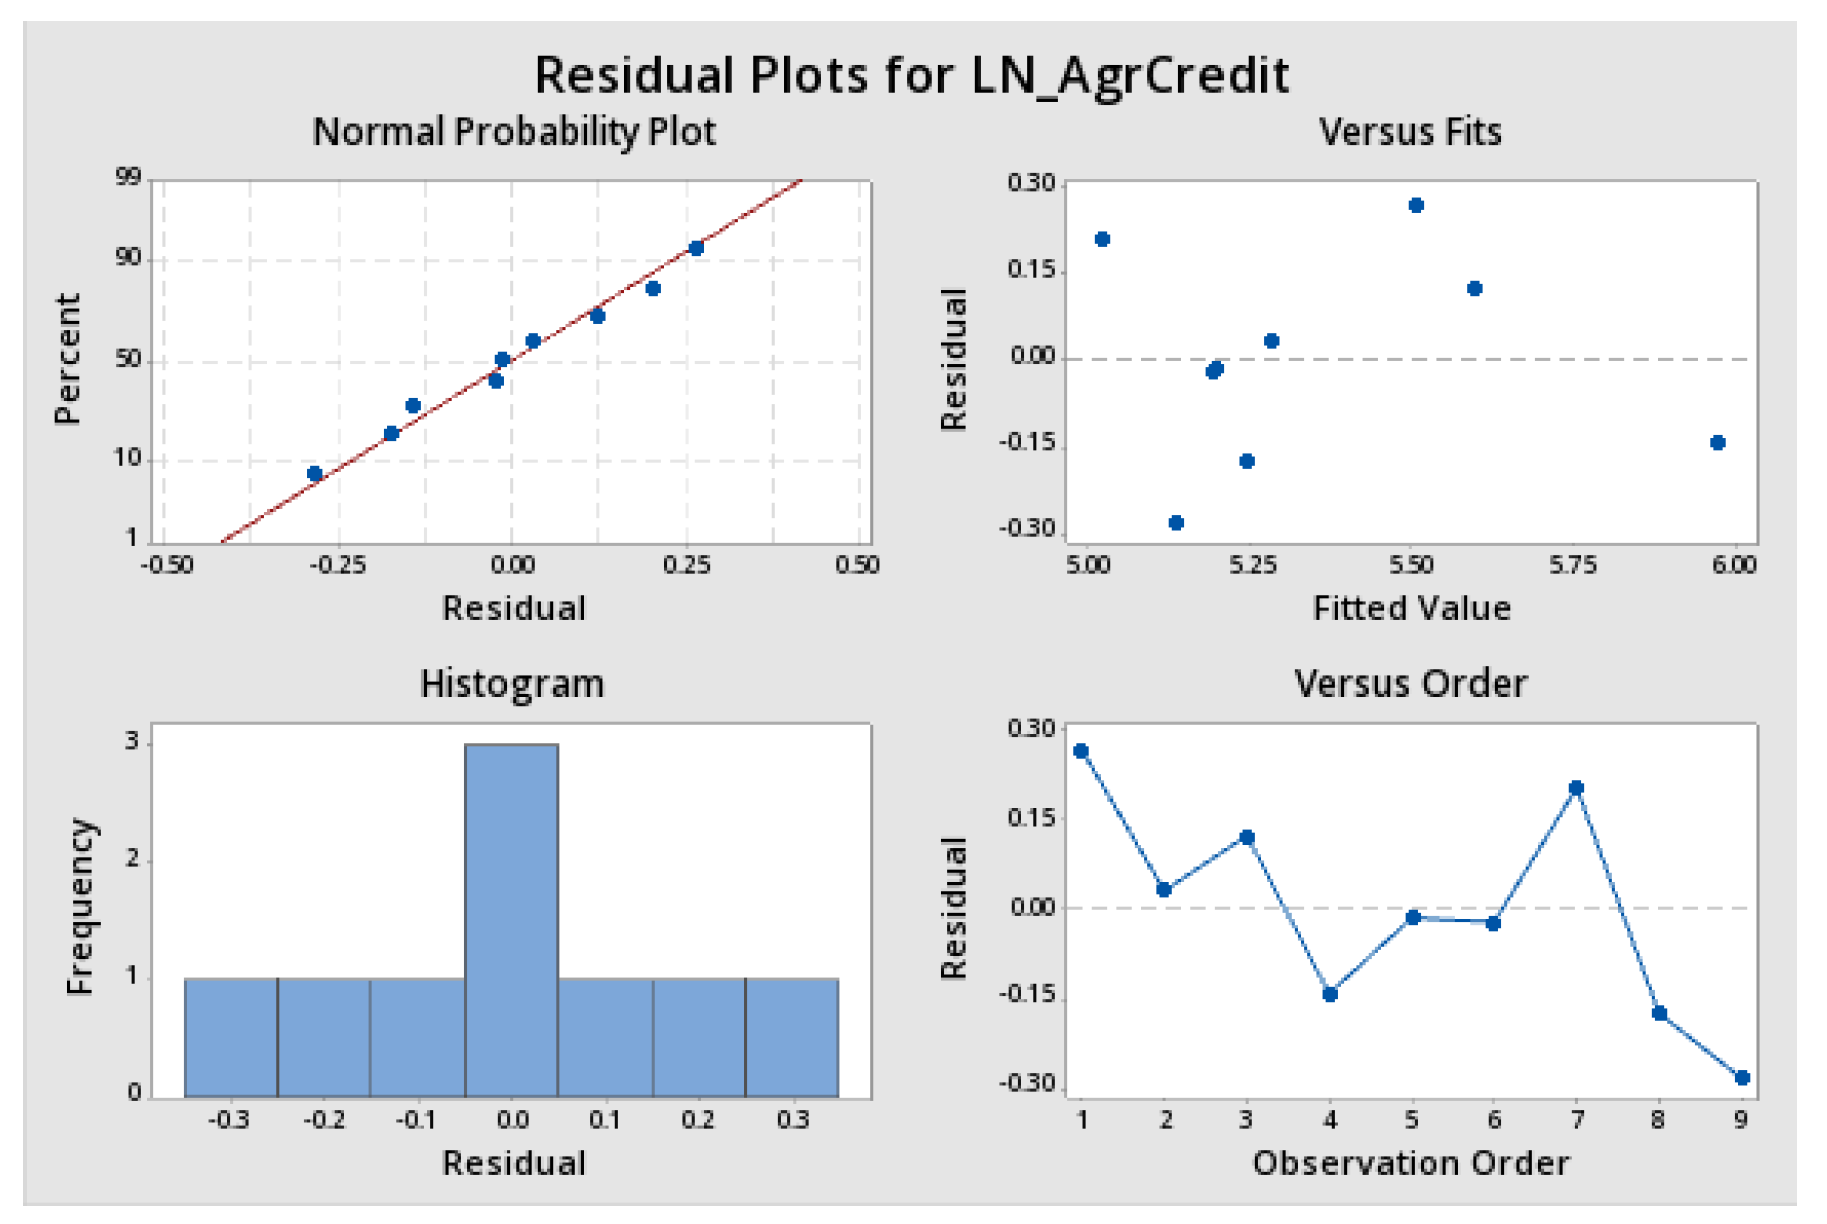
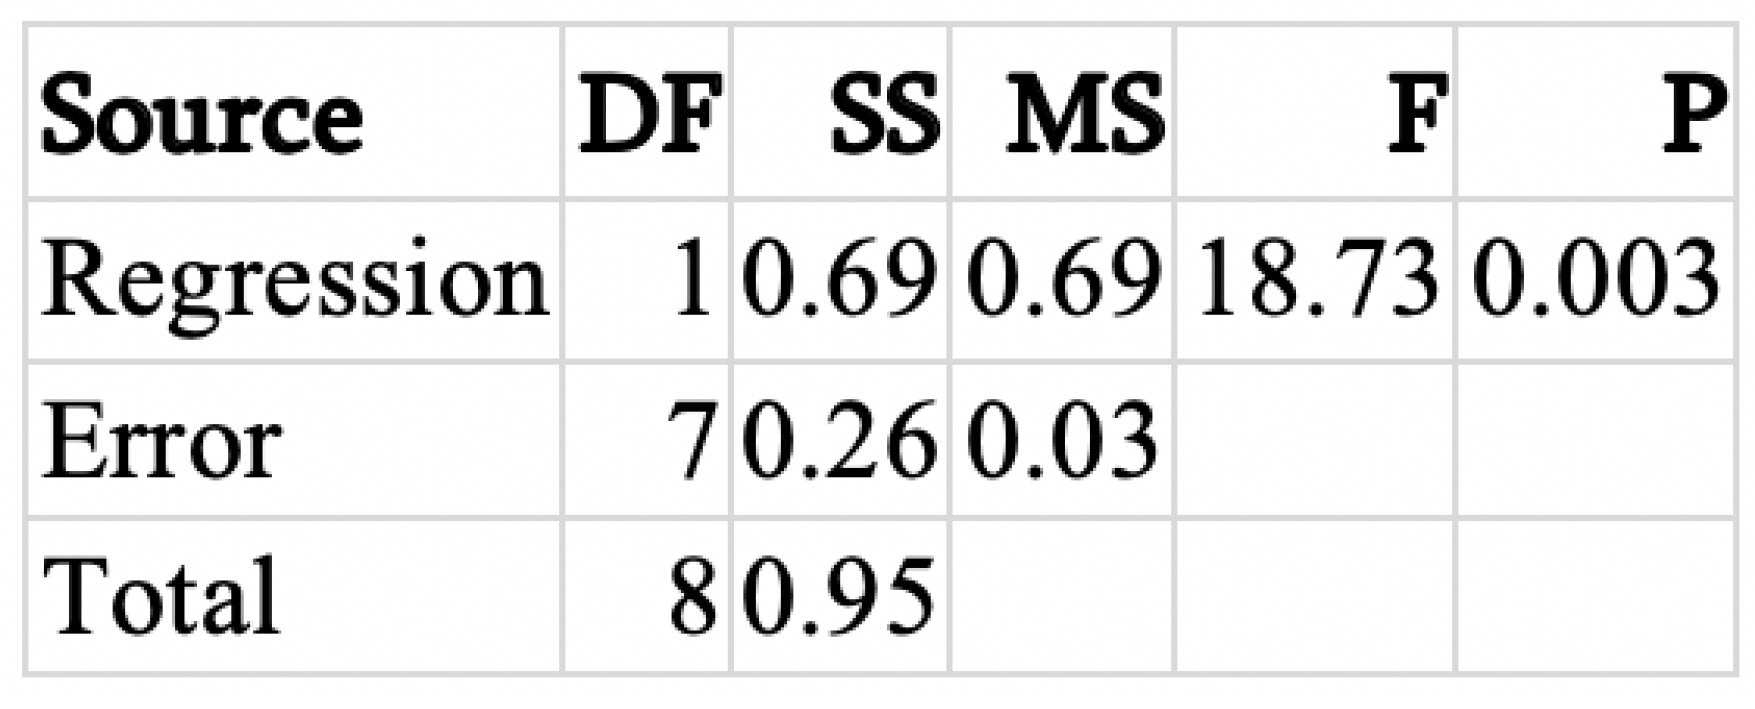
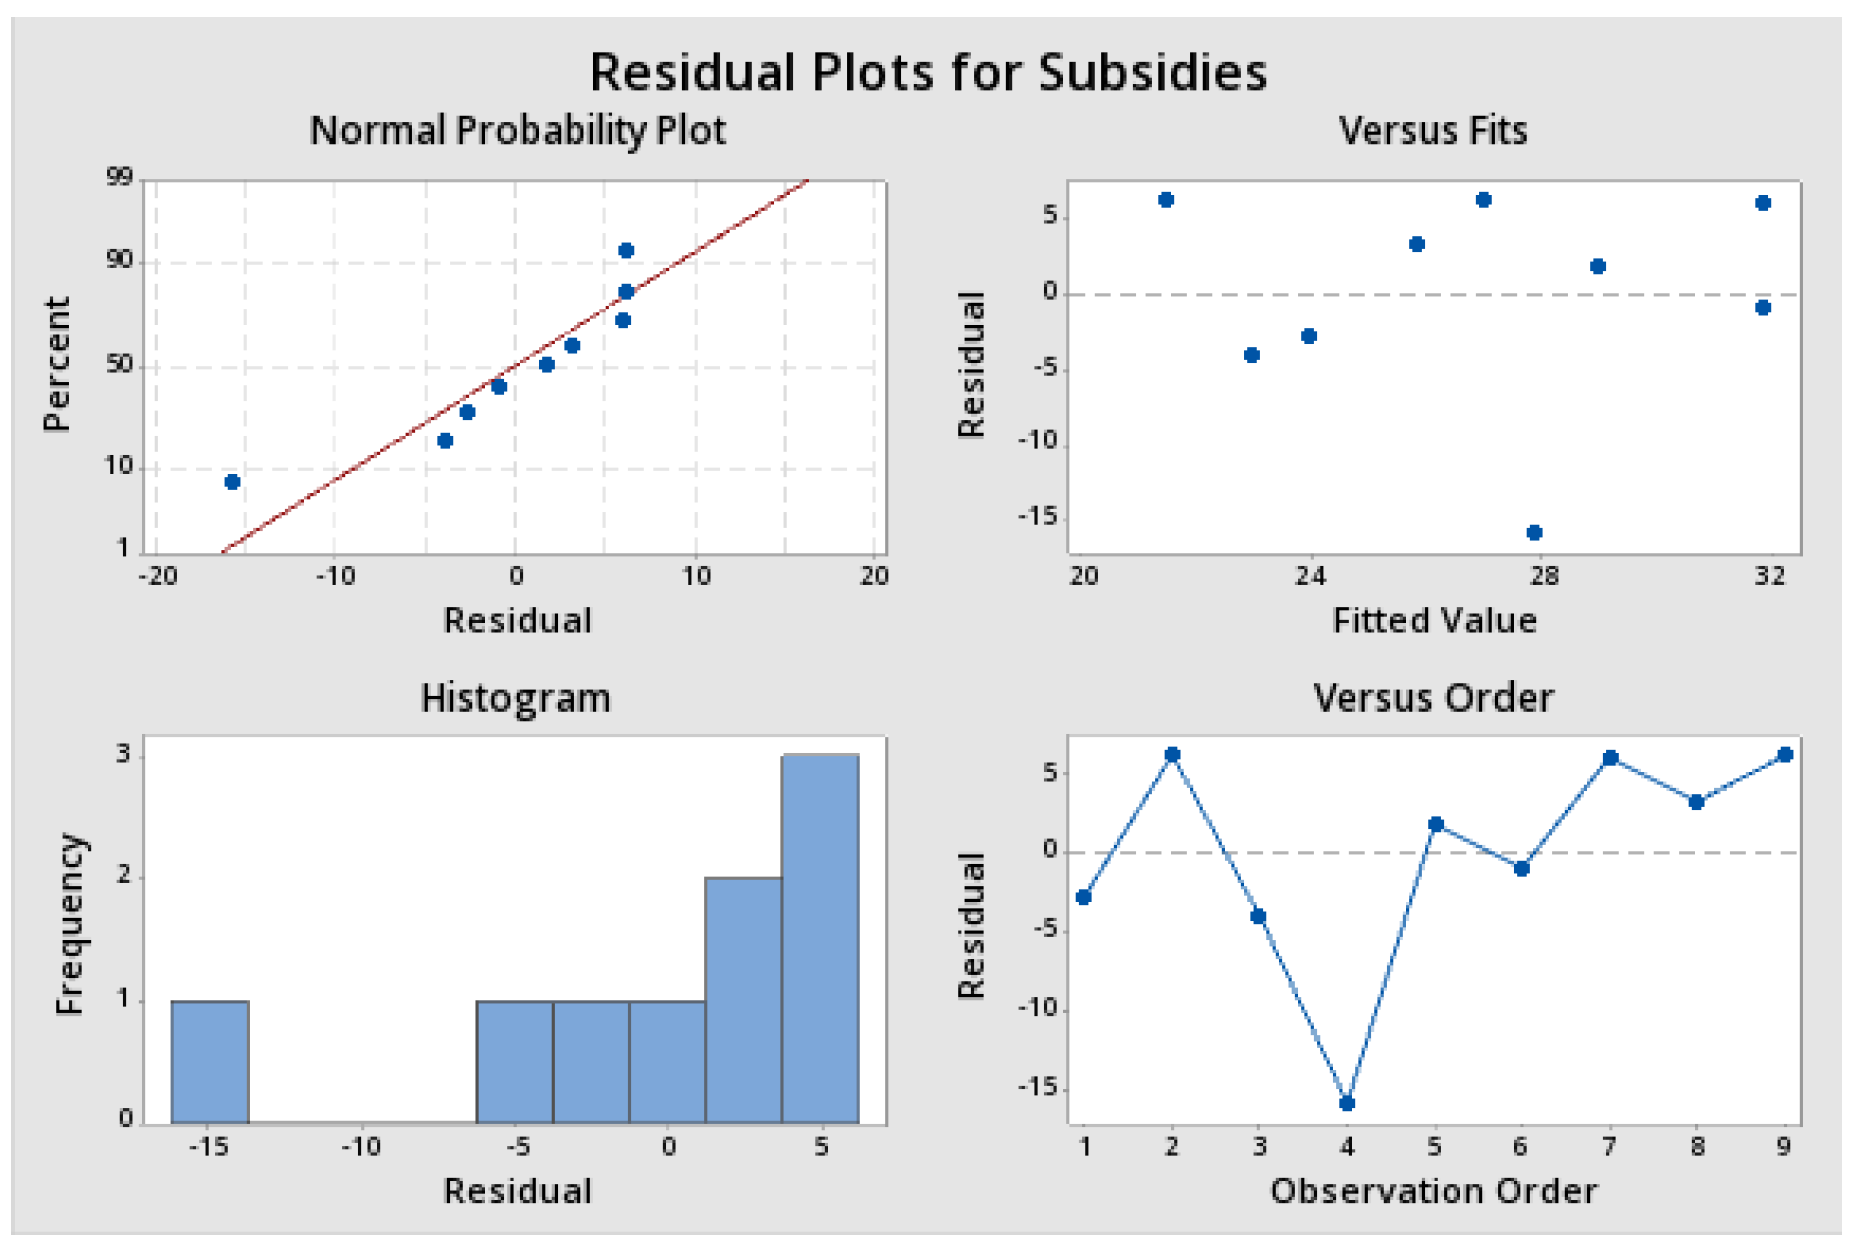
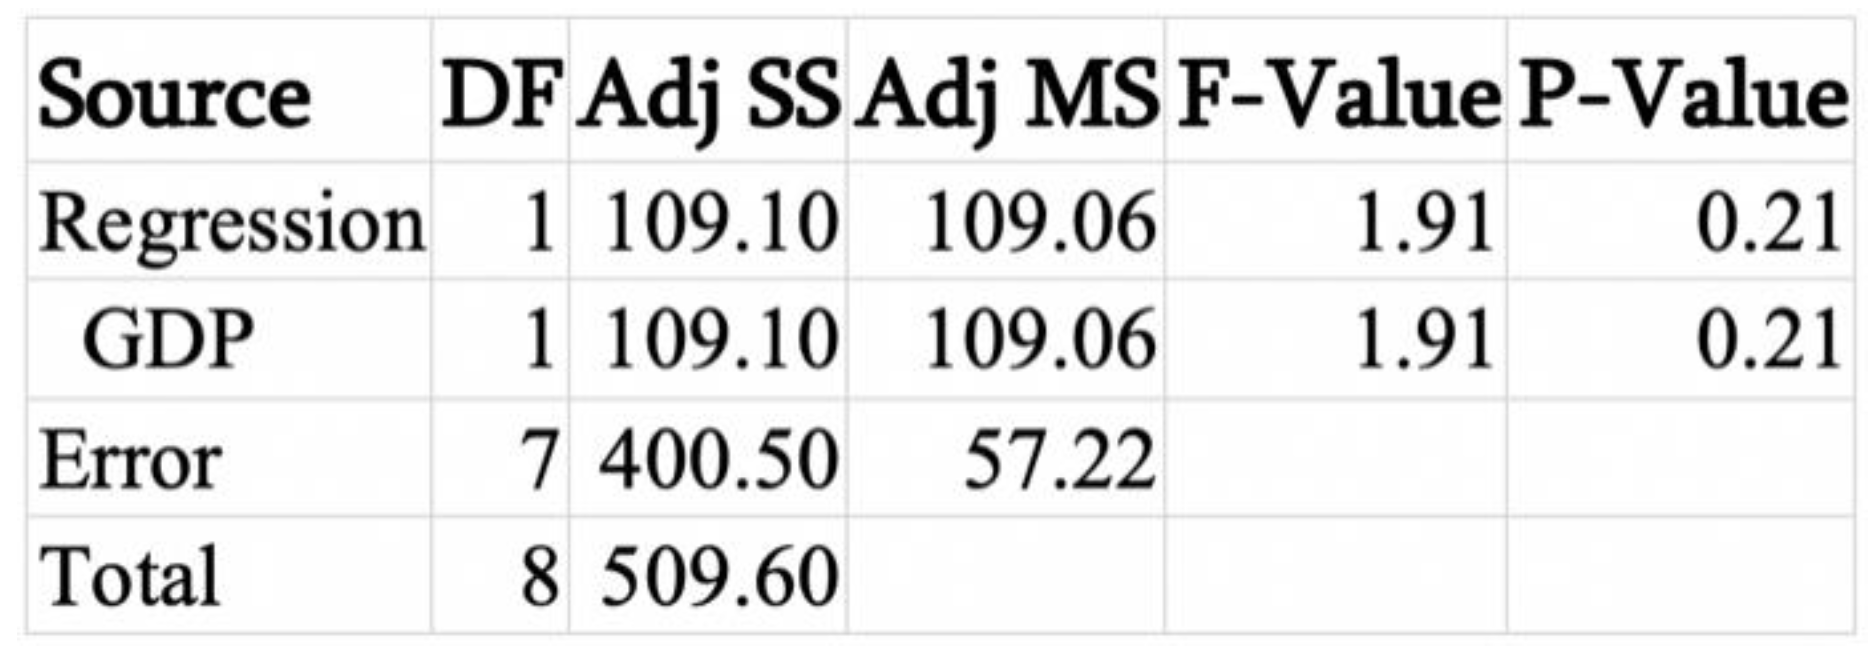
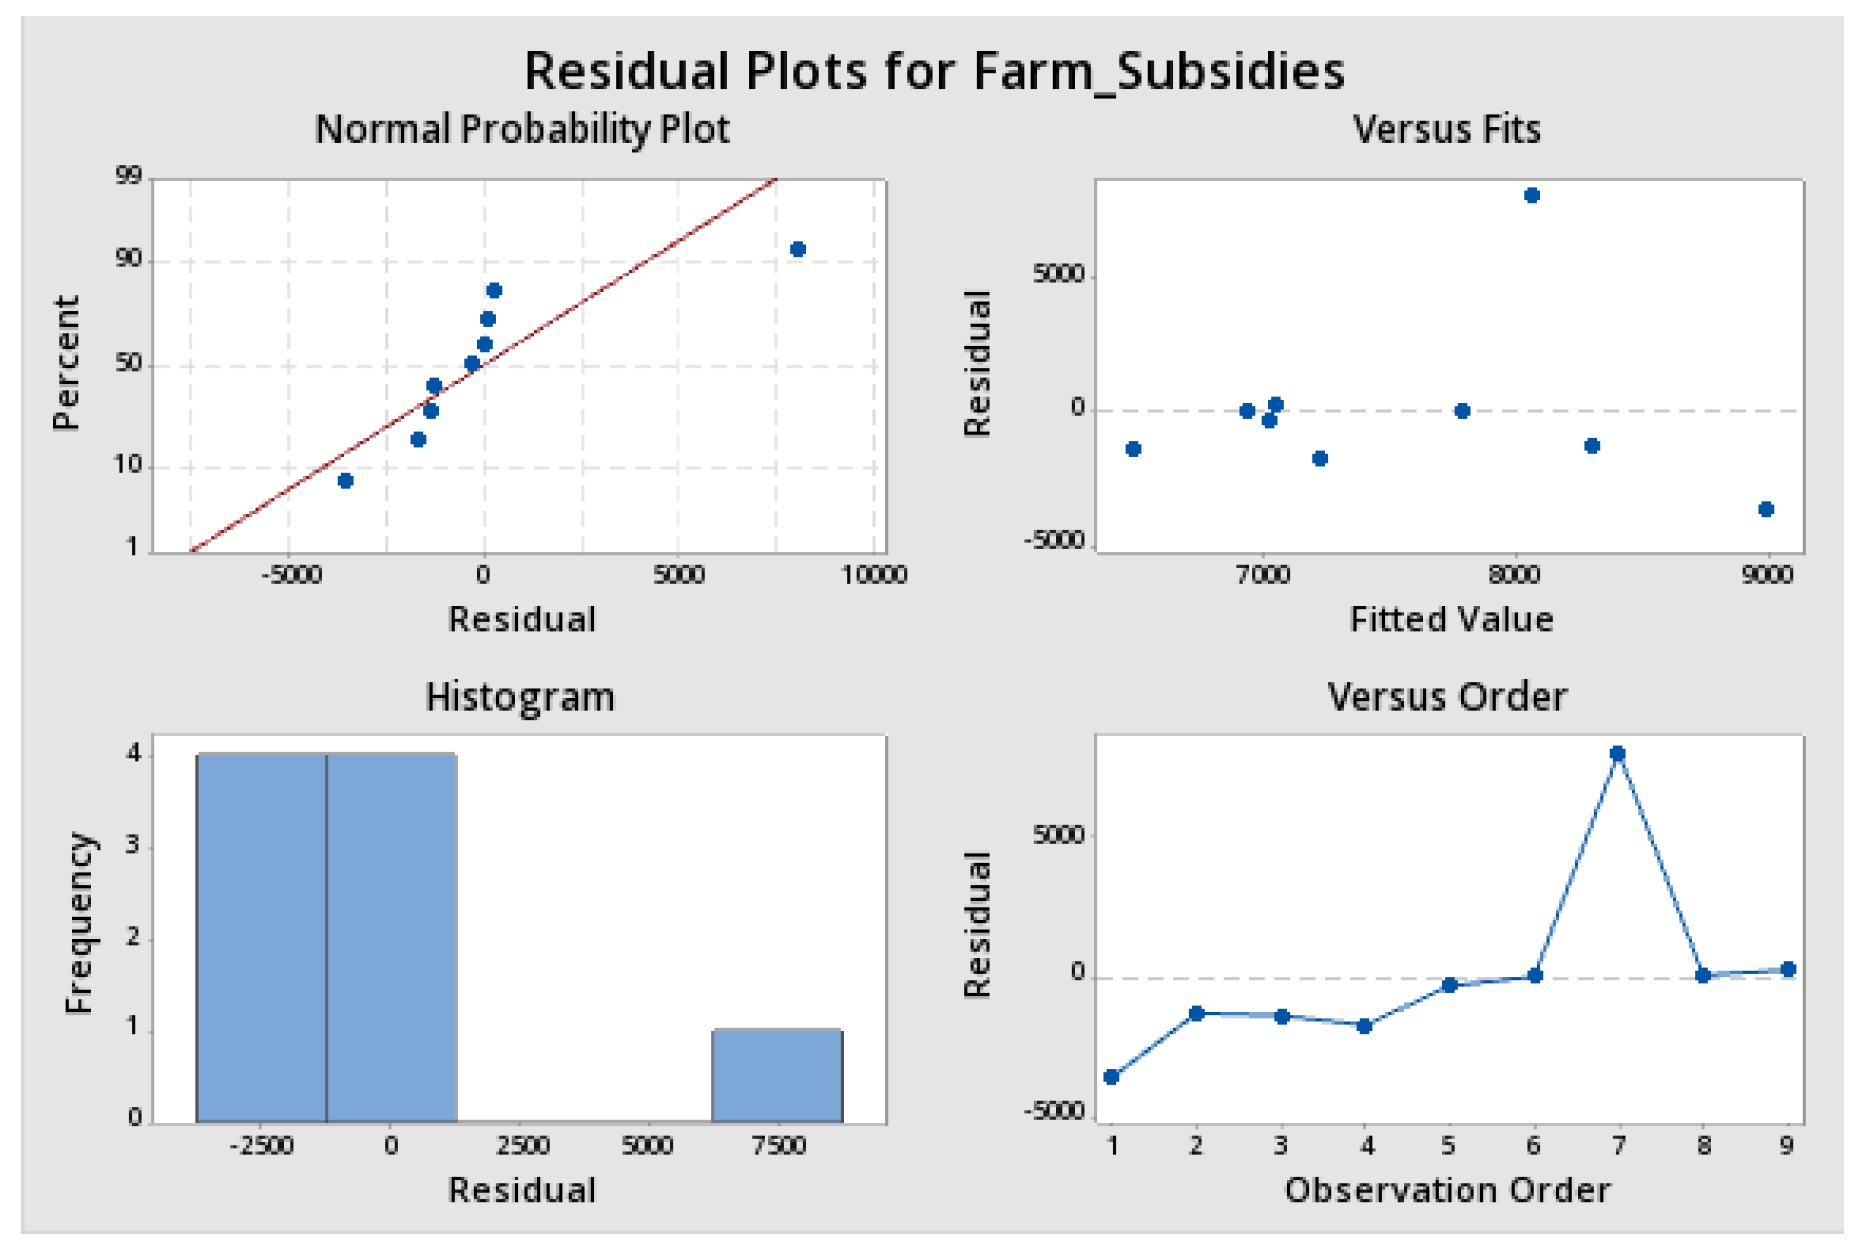
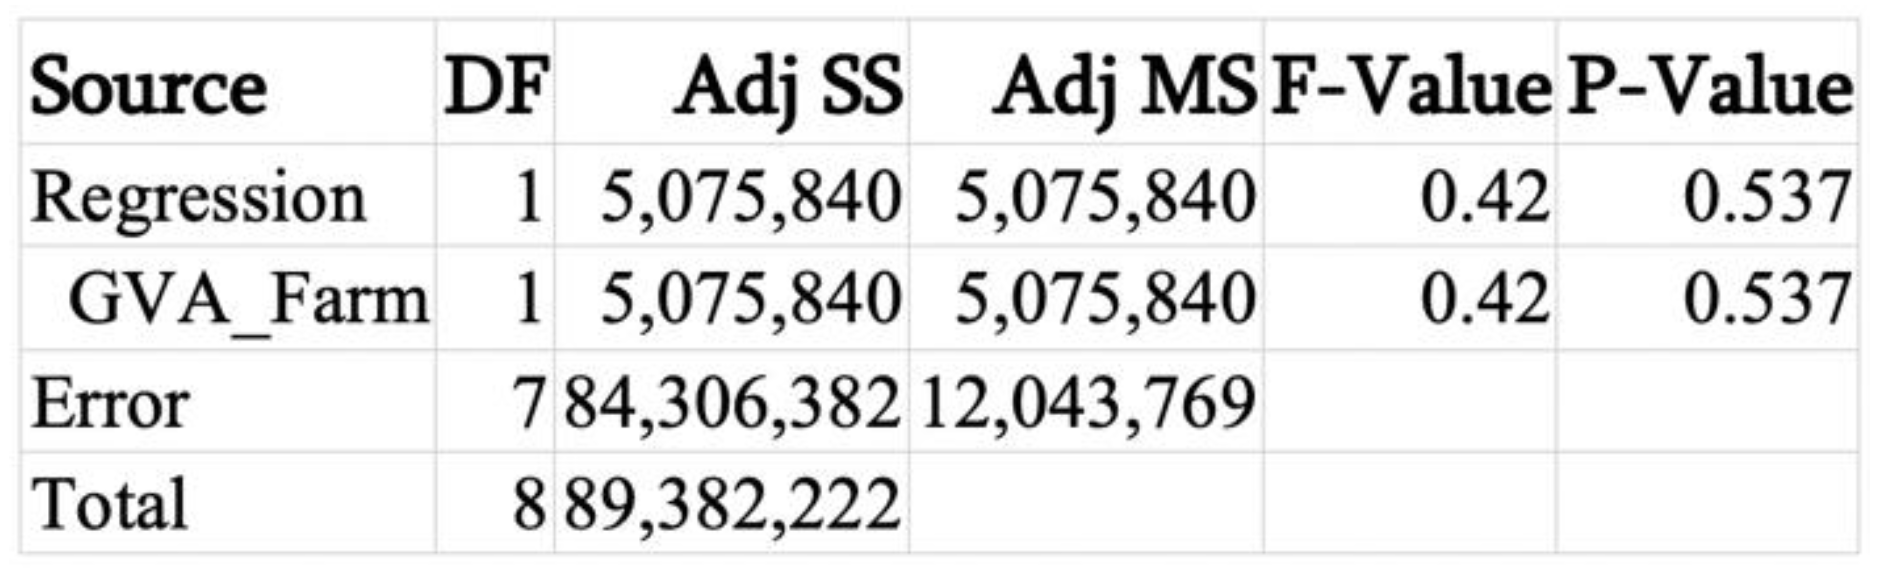
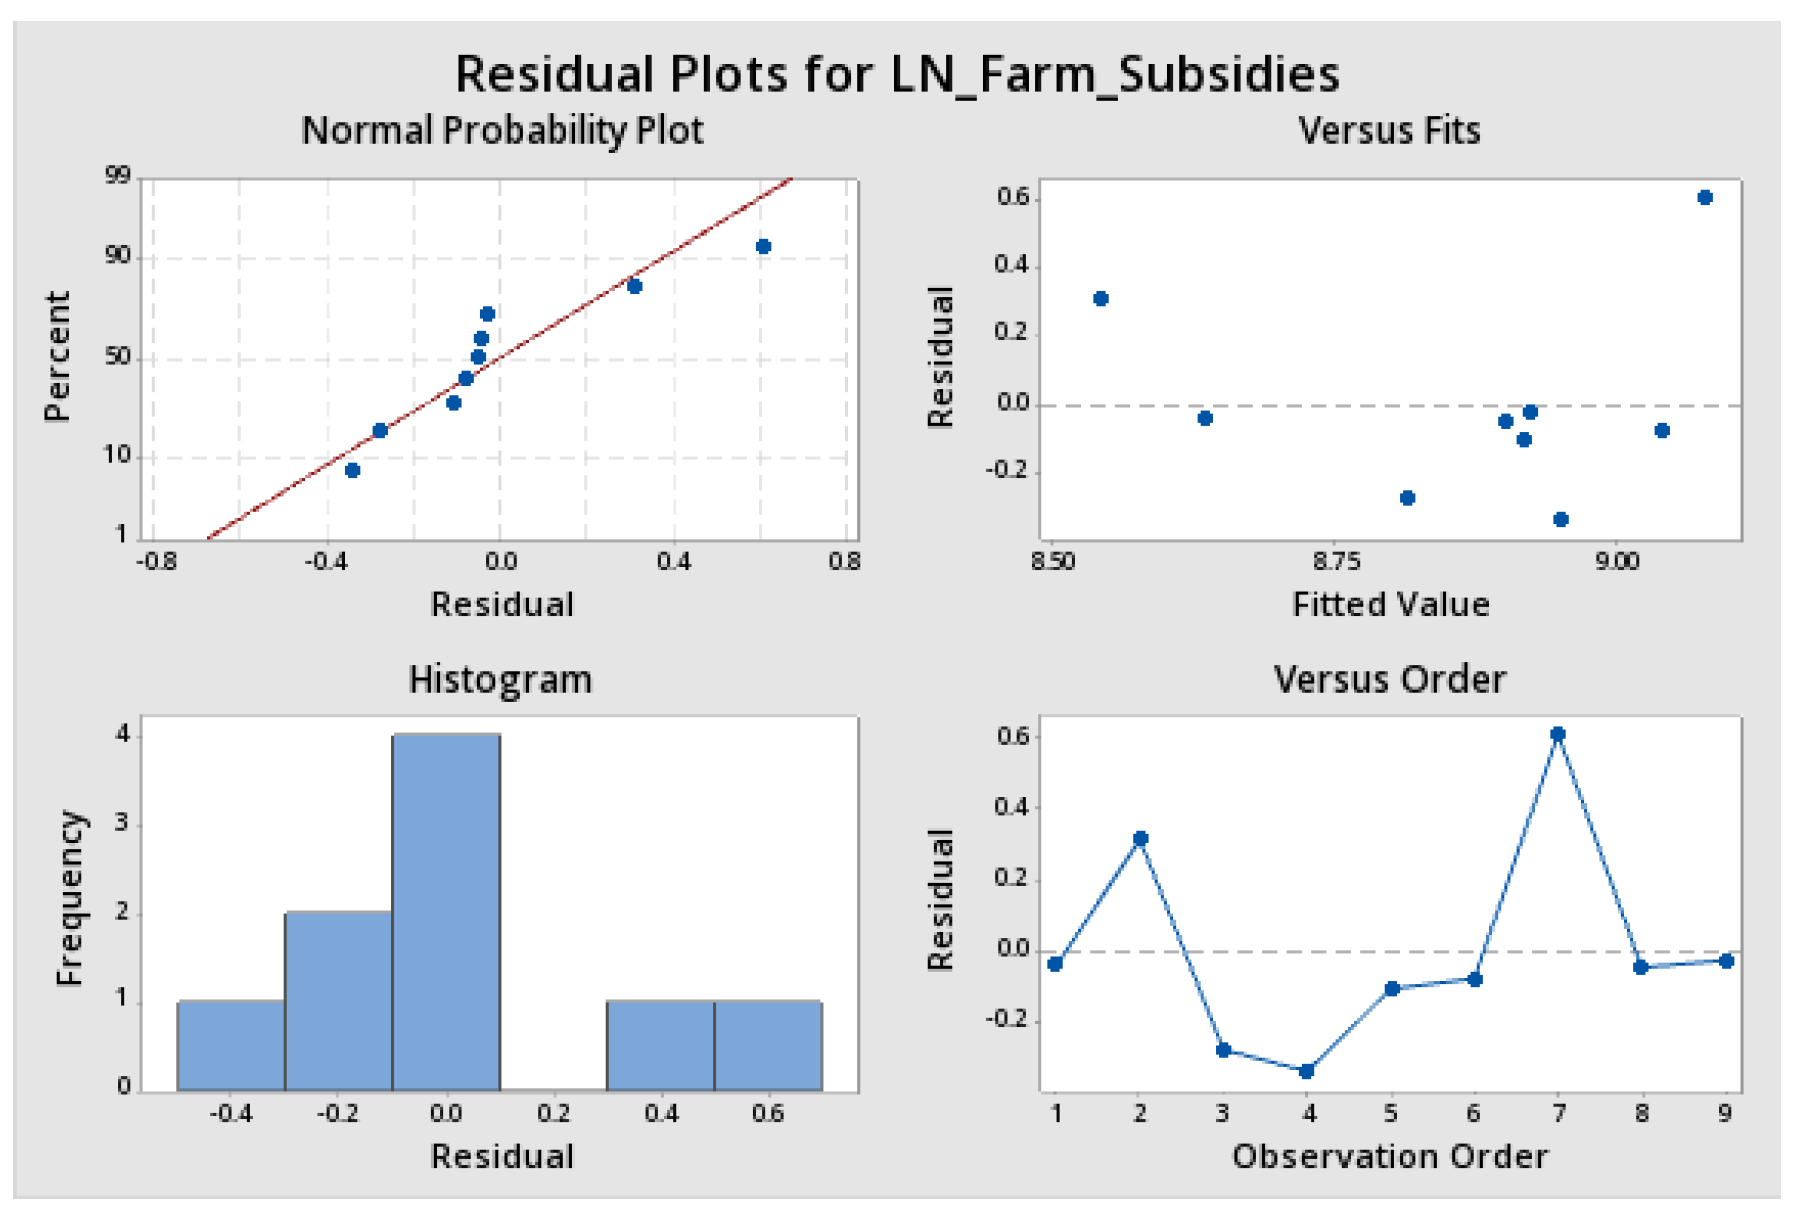
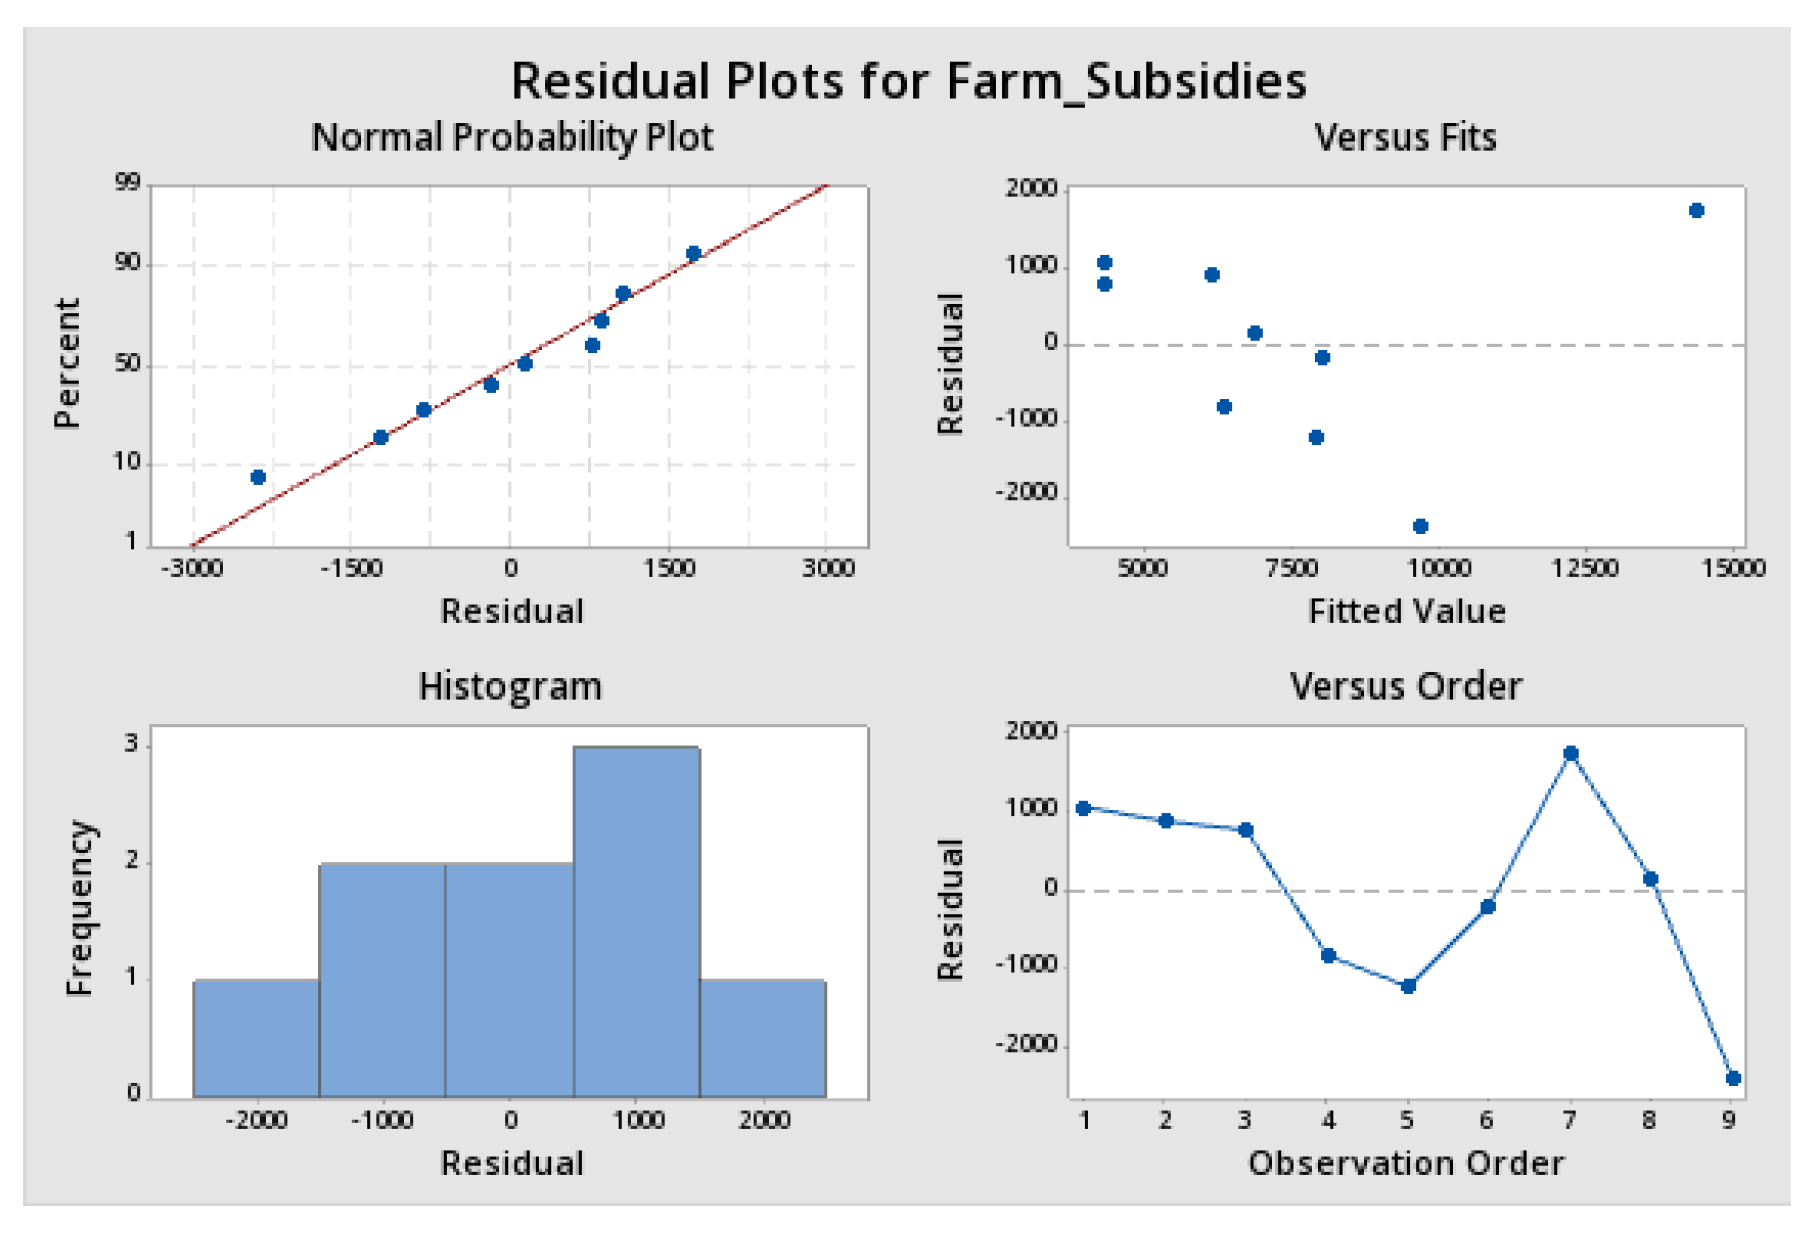
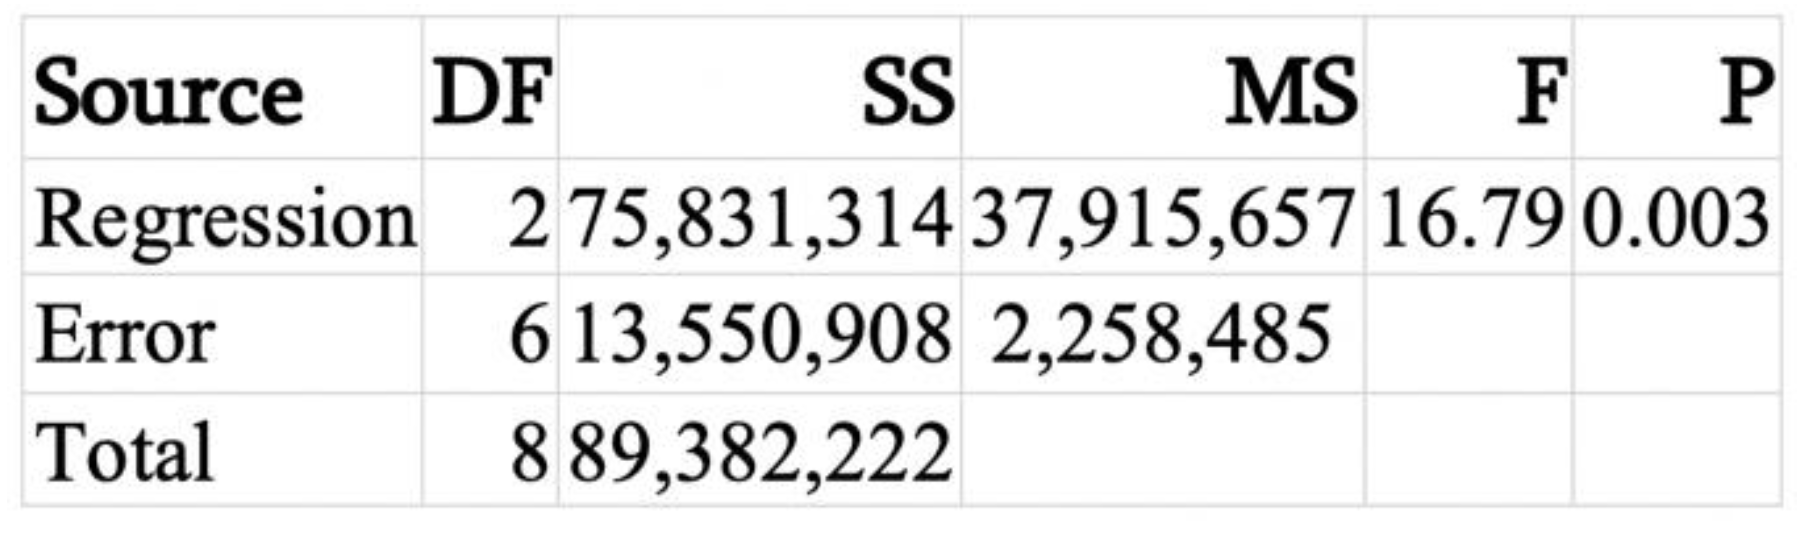


