Mapping and Analysis of Biomass Supply Chains in Andalusia and the Republic of Ireland

 ,
,
Abstract
1. Introduction
2. Materials and Methods
2.1. Bioresource Scoping
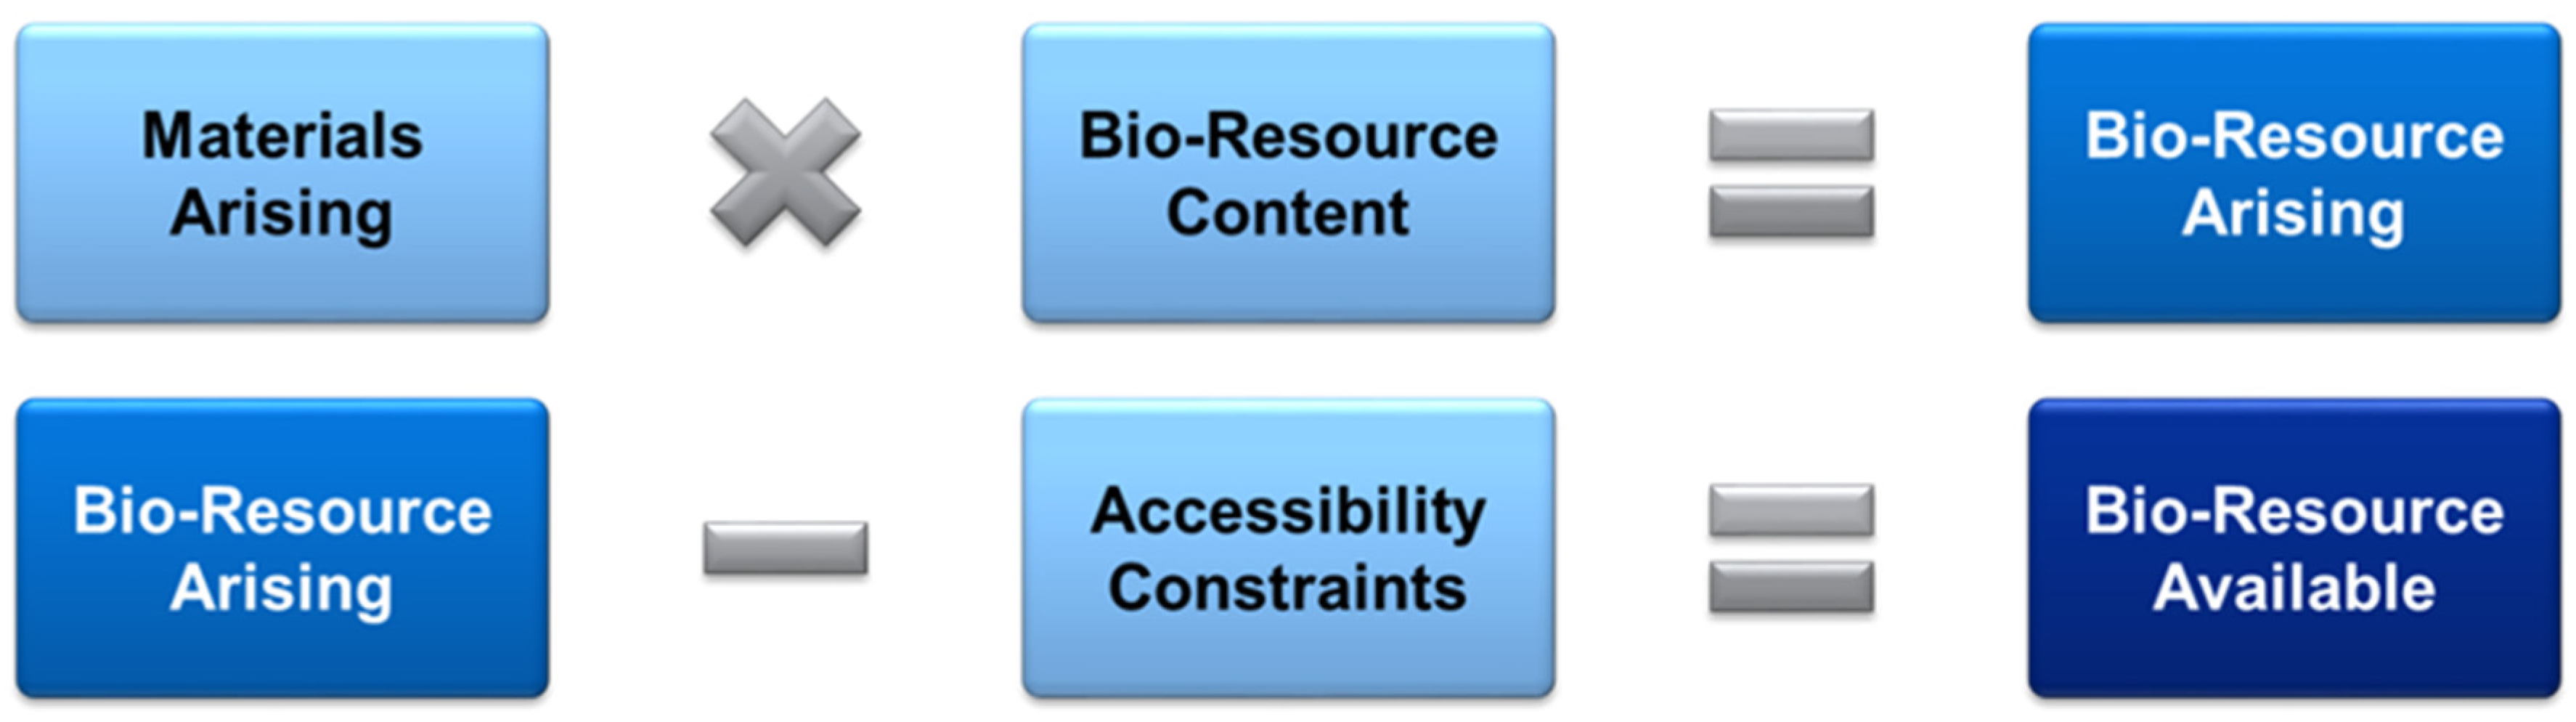
2.2. The Methodology Developed for Bioresource Scoping was a Three-Step Process
- Material arising: material arising from the selected three value chains within each region were quantified with geographical breakdown to county/provincial level
- Characterisation (bioresource content): composition of the bioresource was identified (dry matter, calorific value, protein, fat, carbohydrate, etc.)
- Accessibility: temporal availability (transport) and existing uses and economic constraints were assessed
2.3. Material Arising
2.4. Bioresource Content
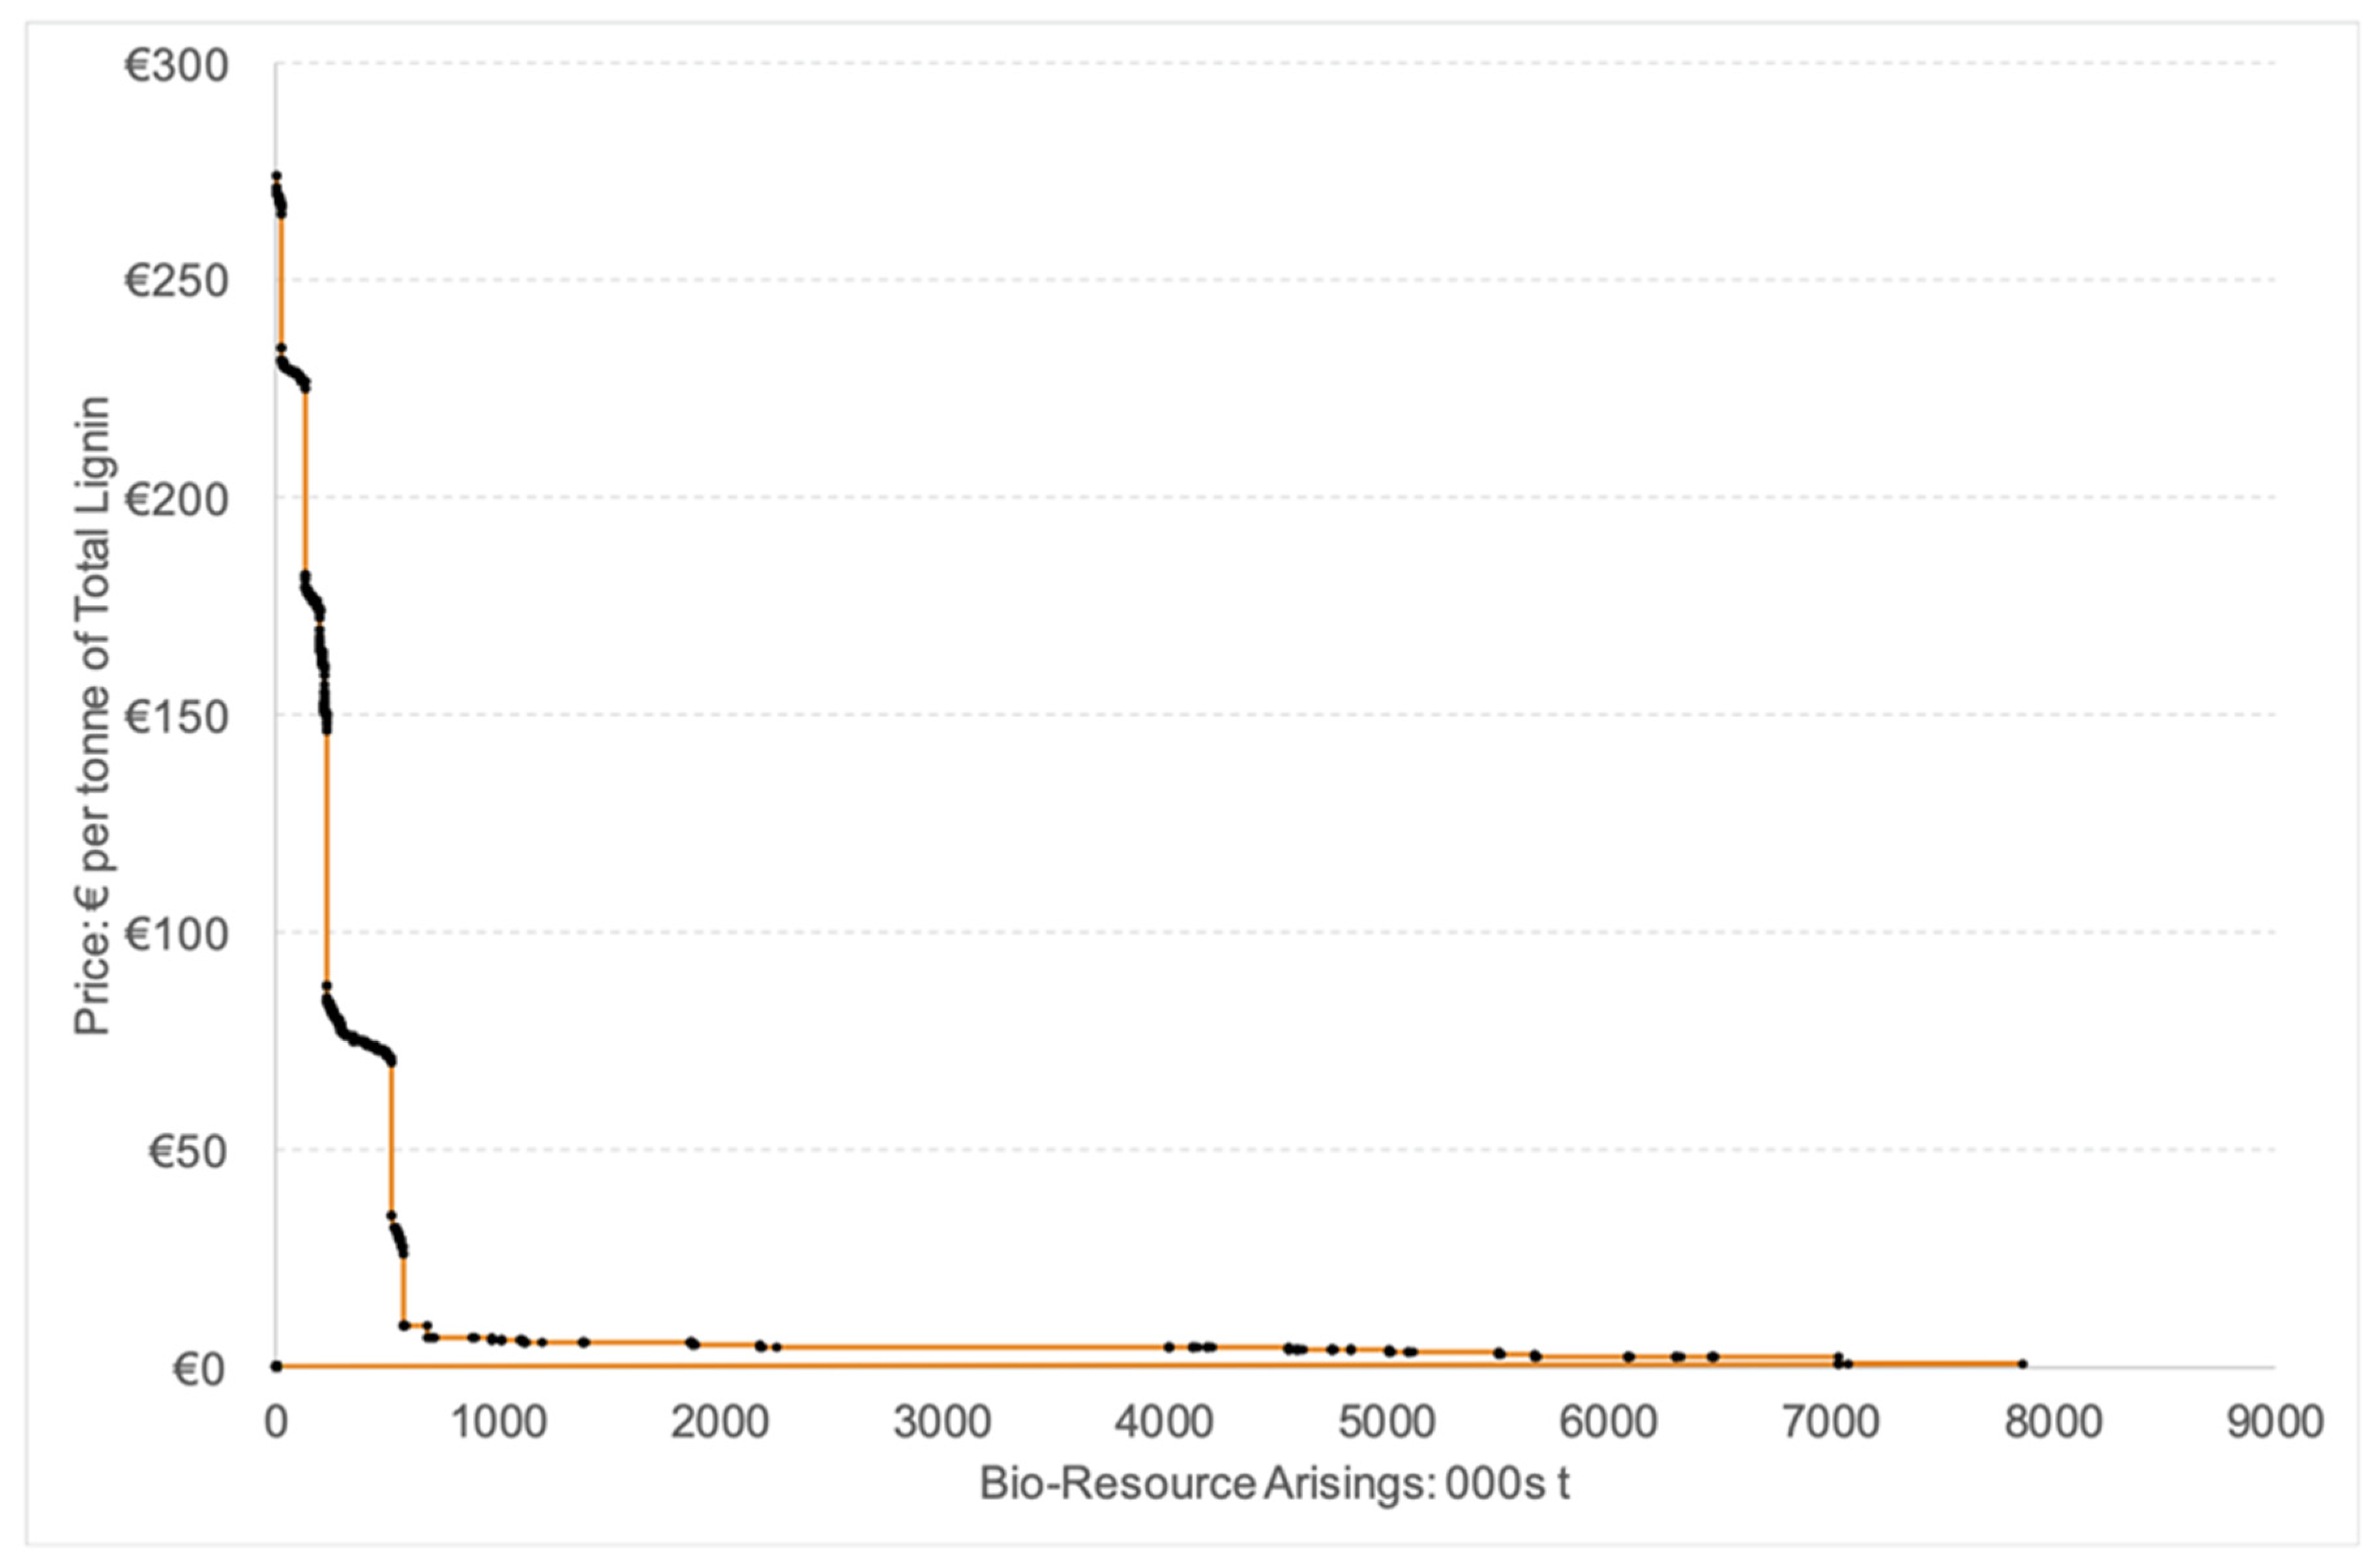
2.5. Material Accessibility
3. Results
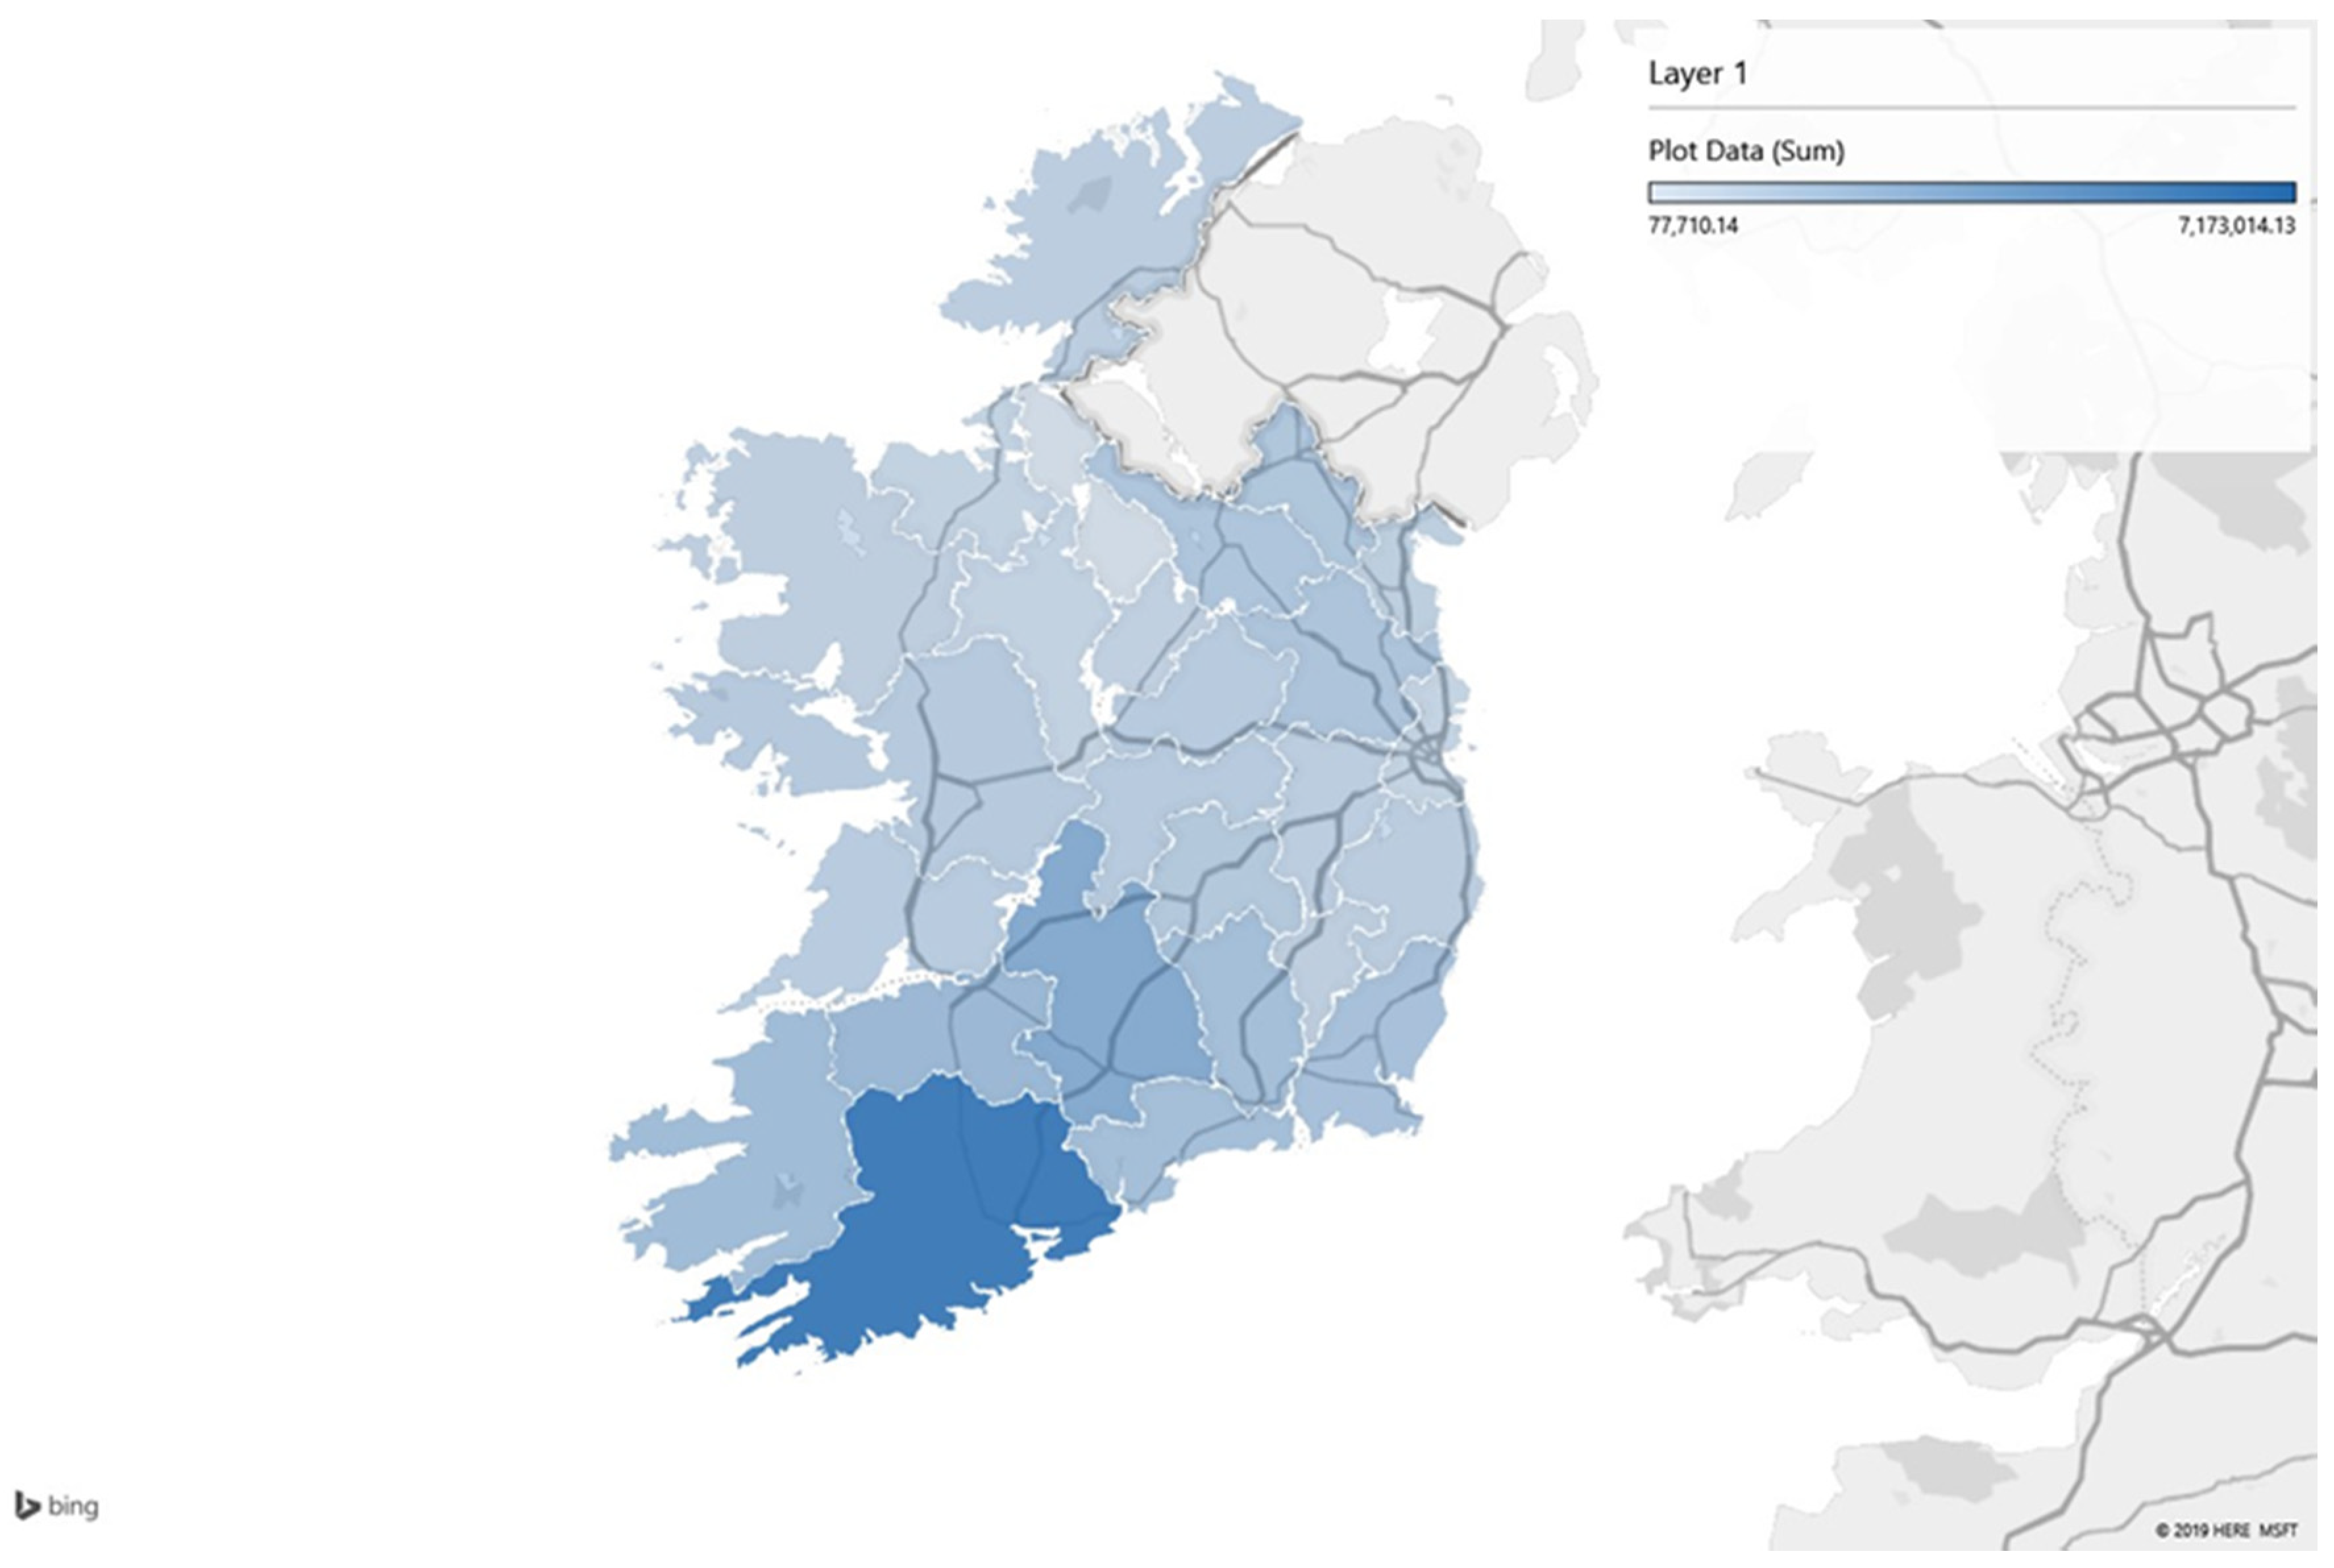
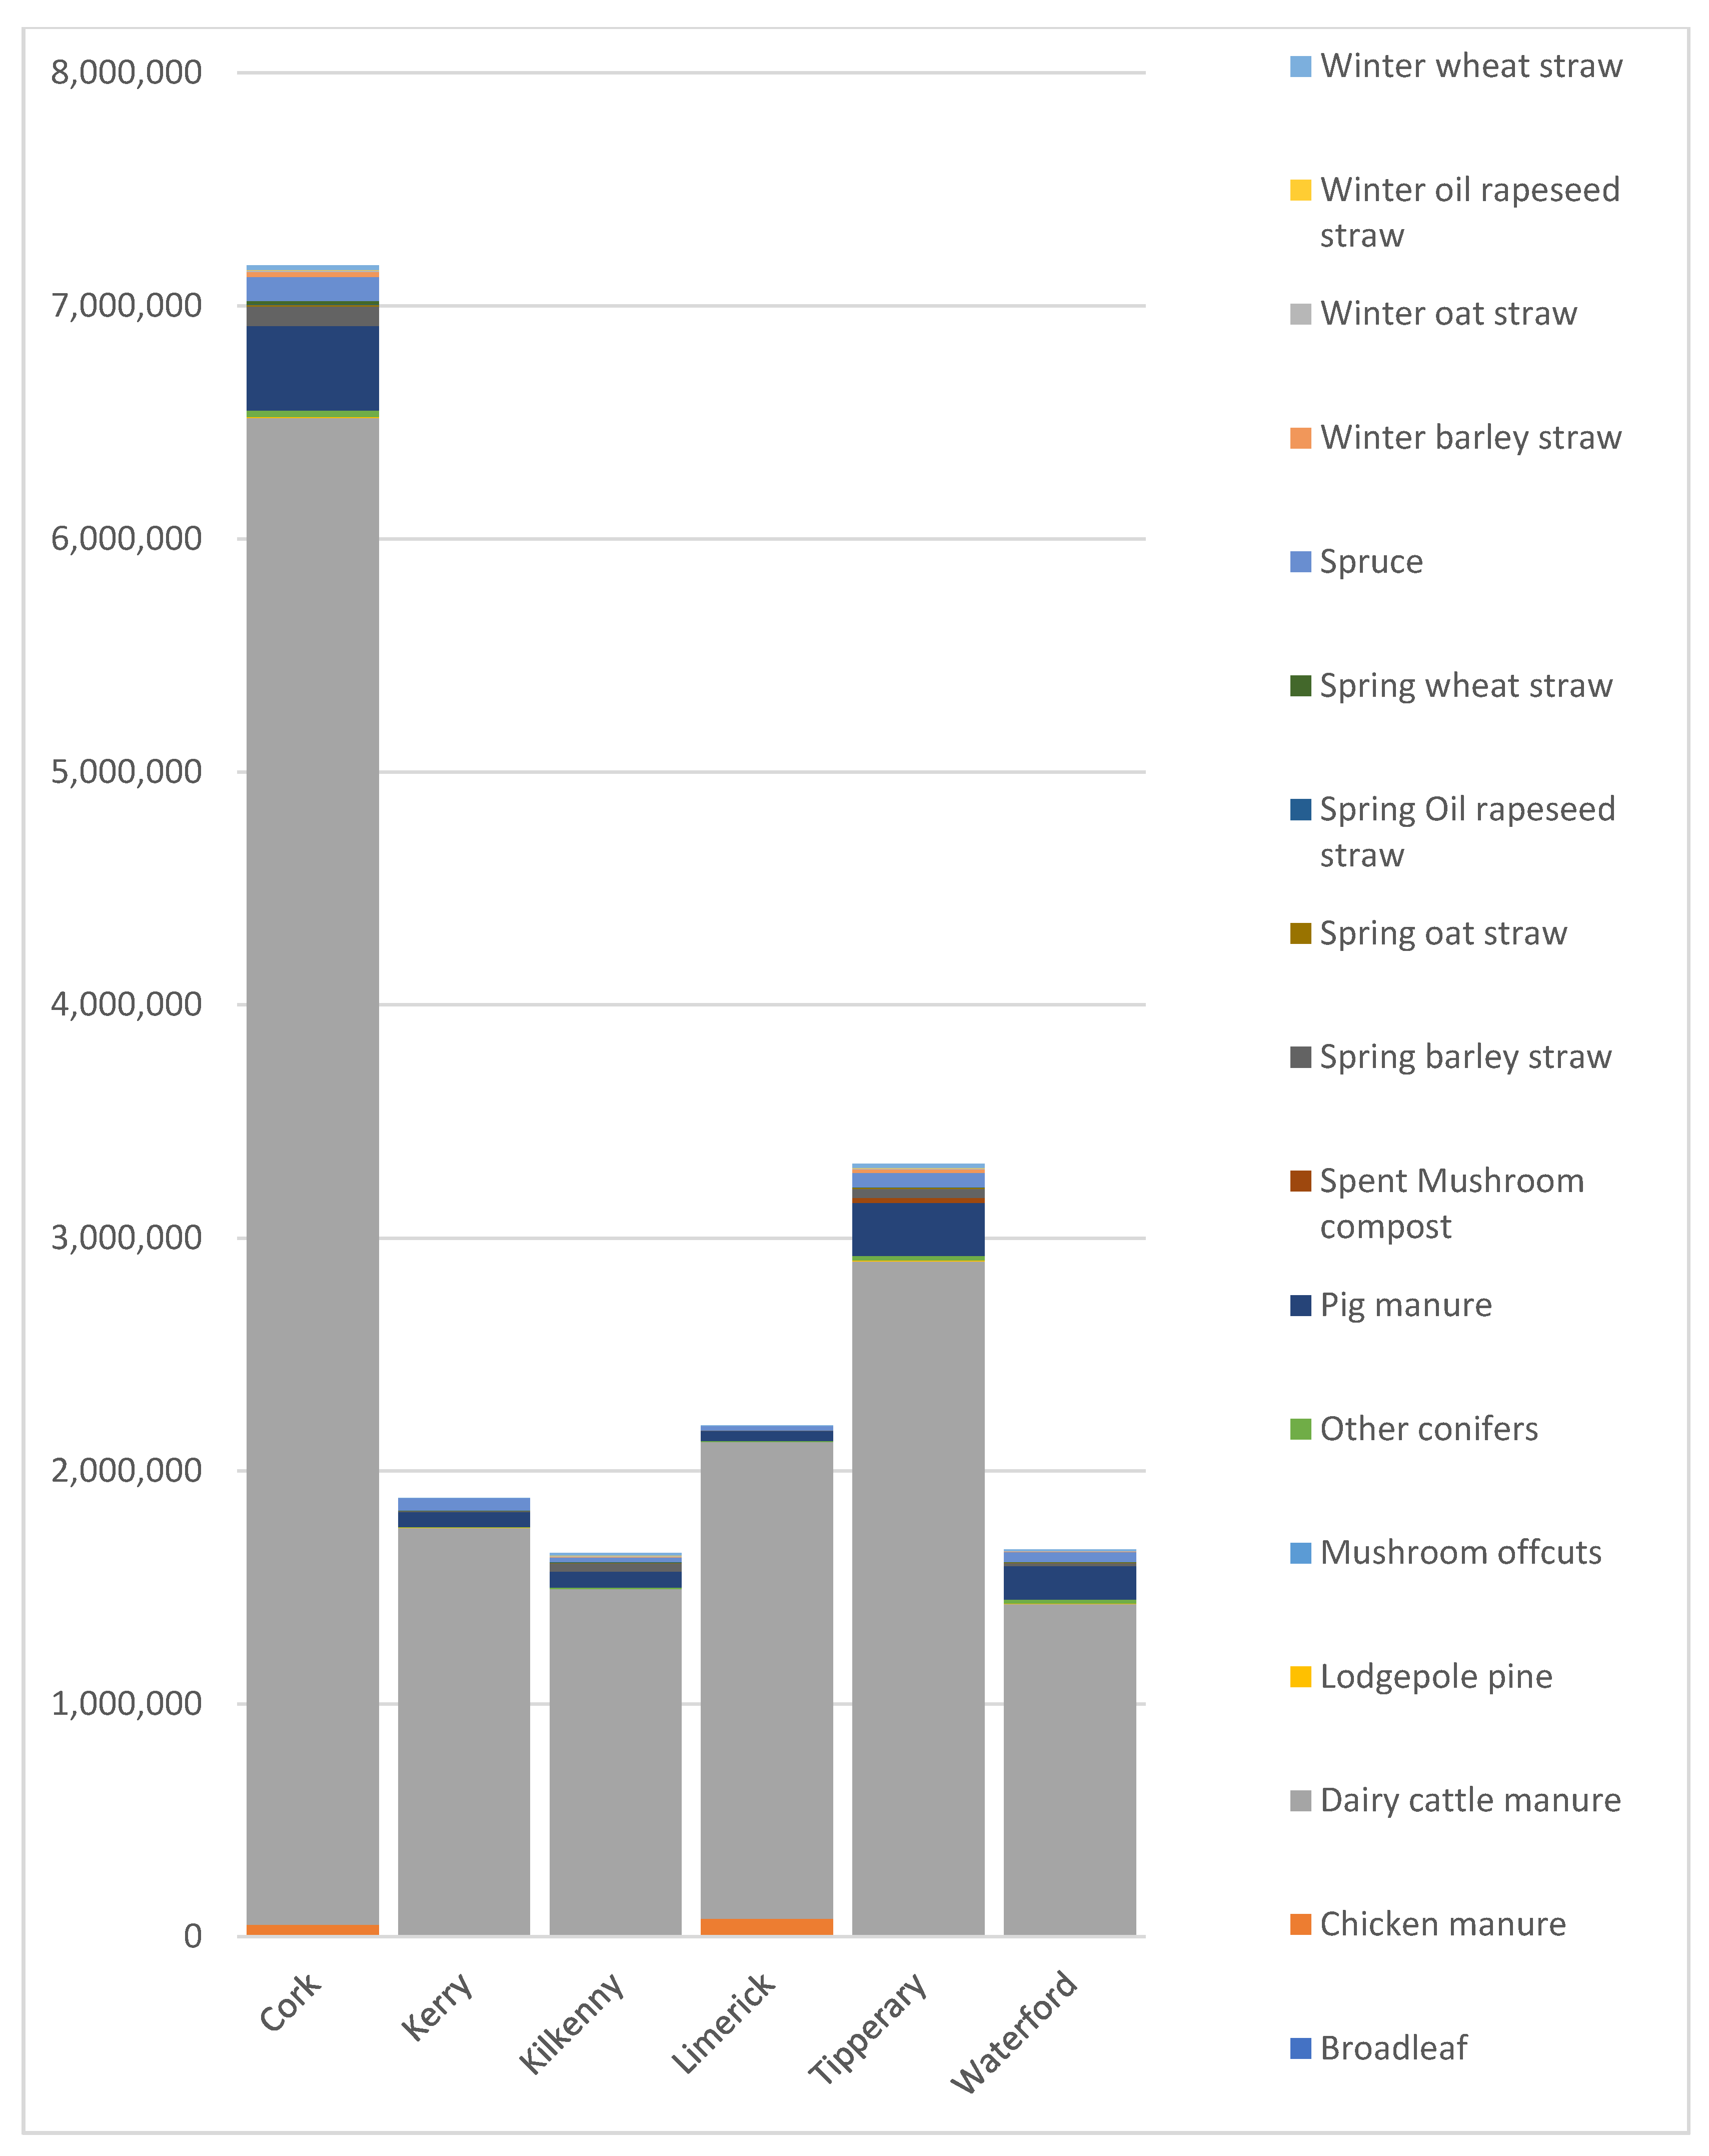
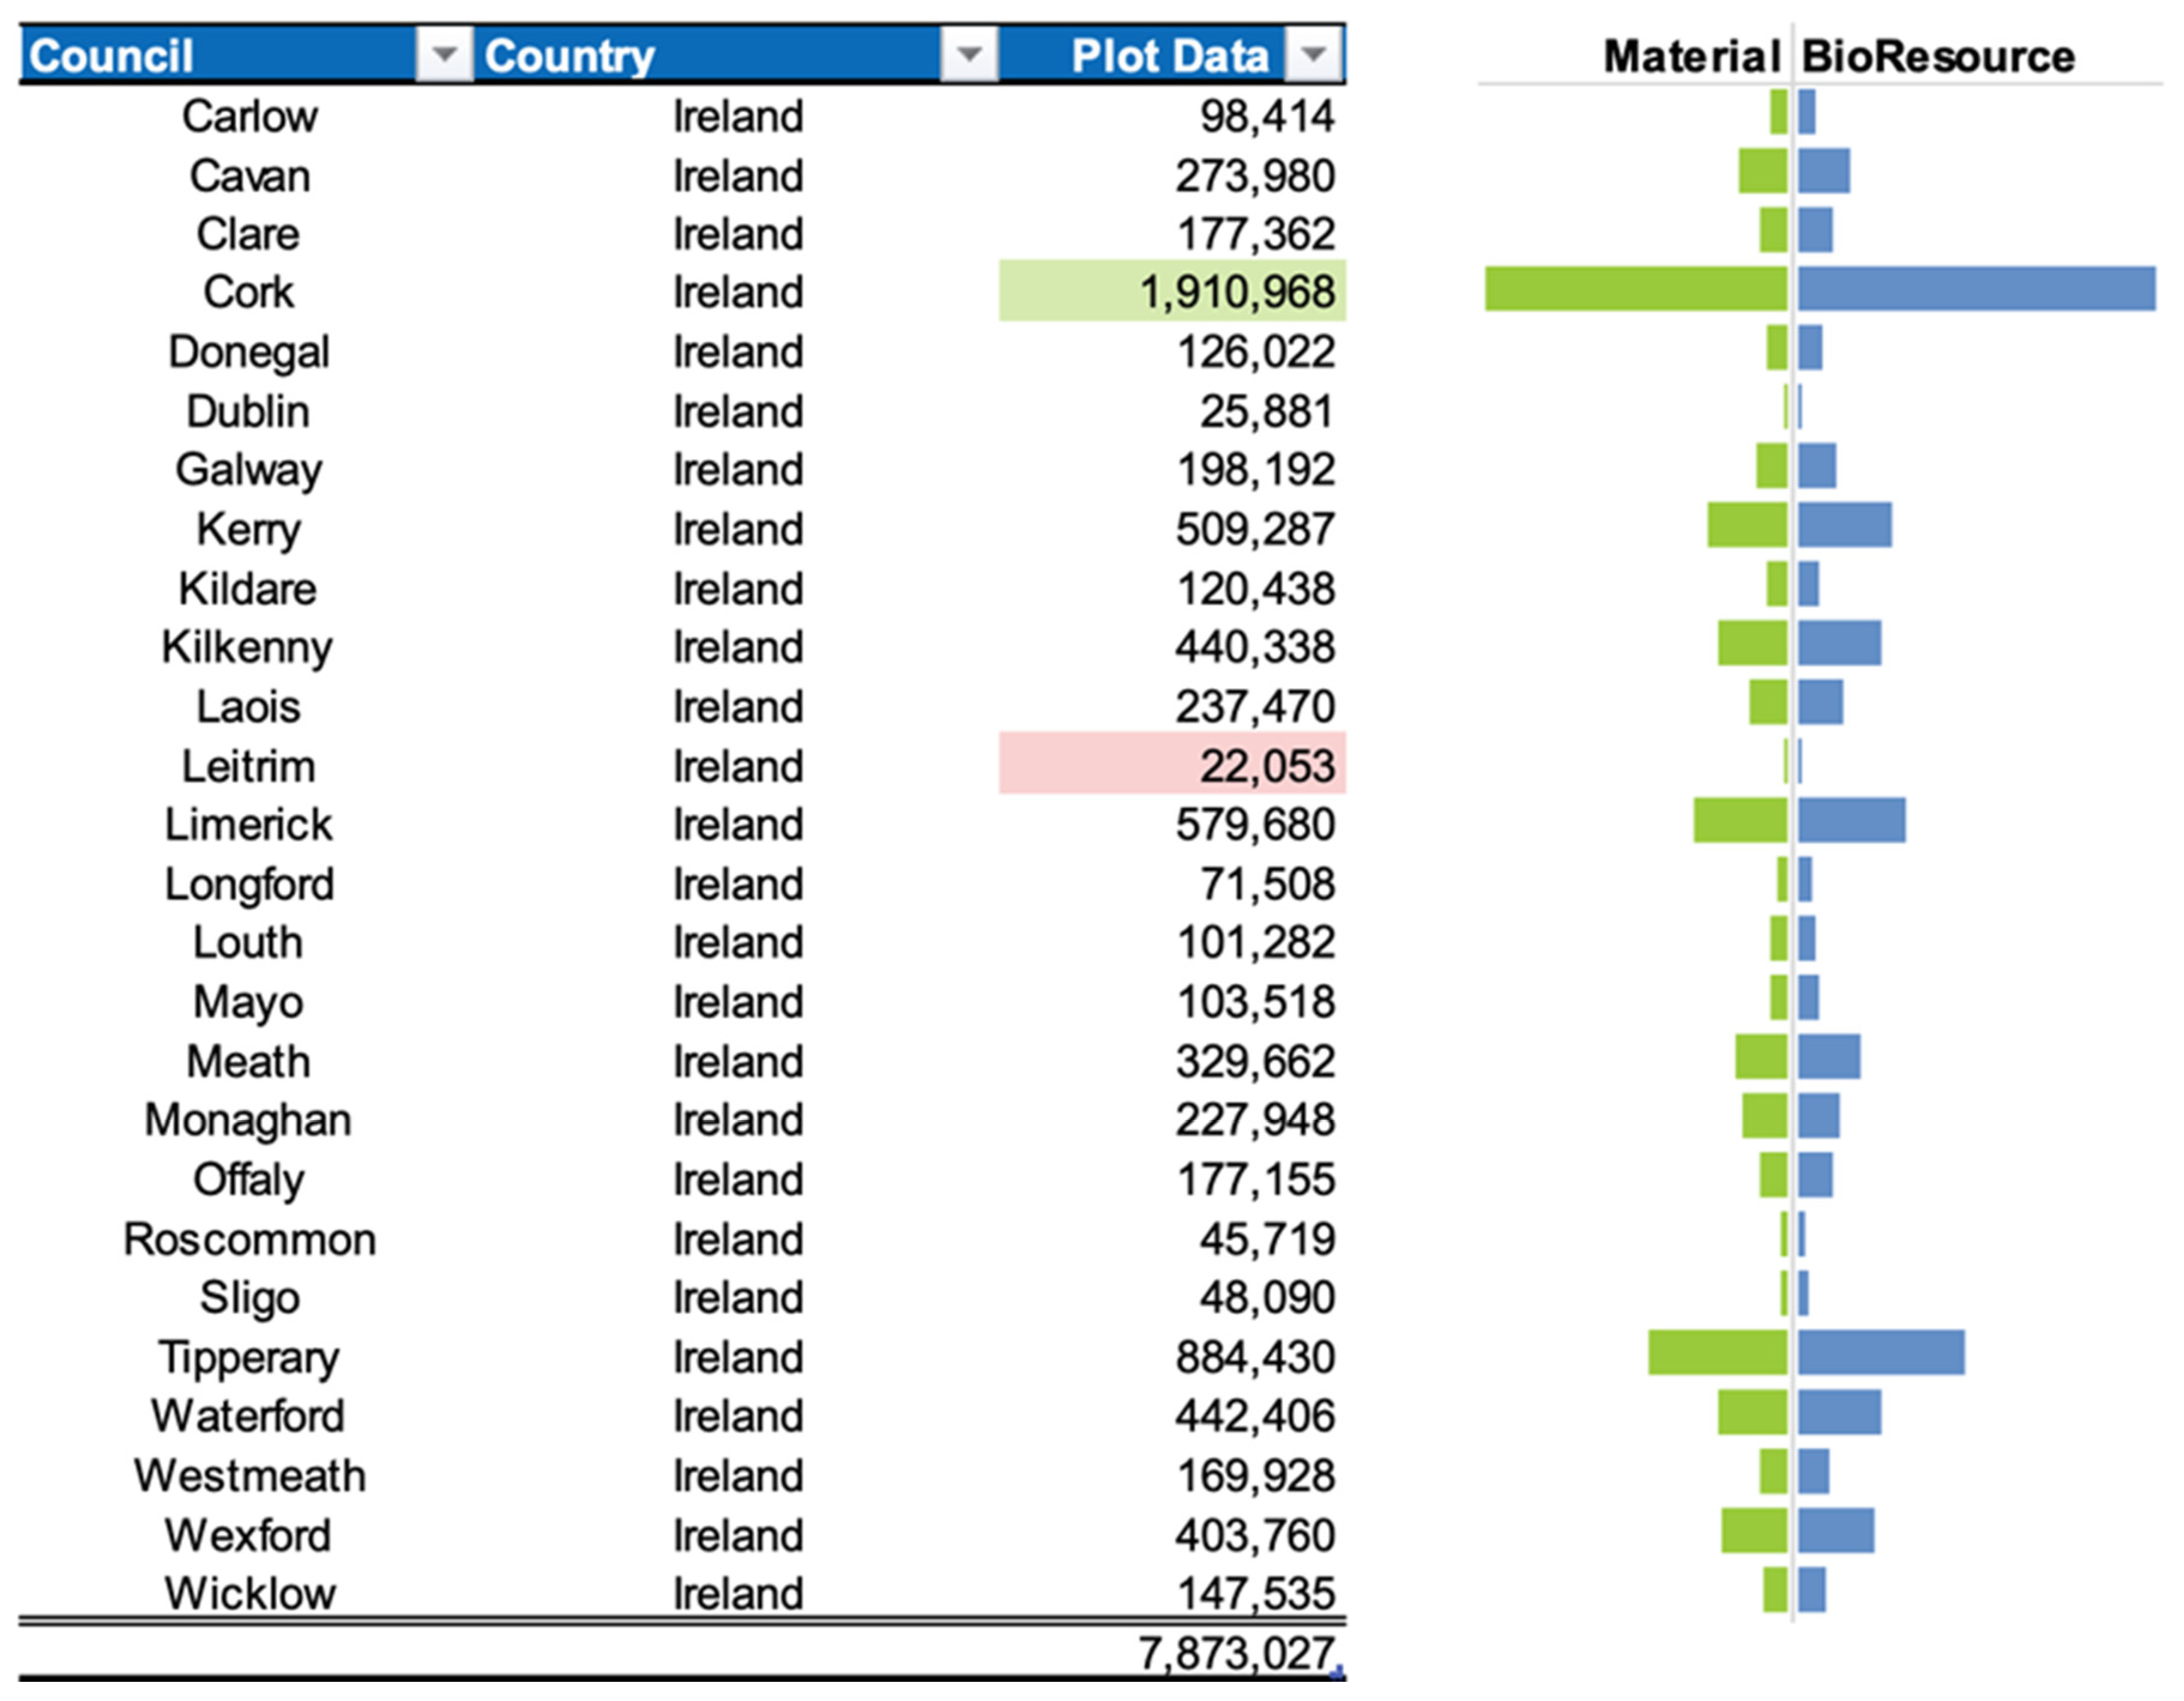
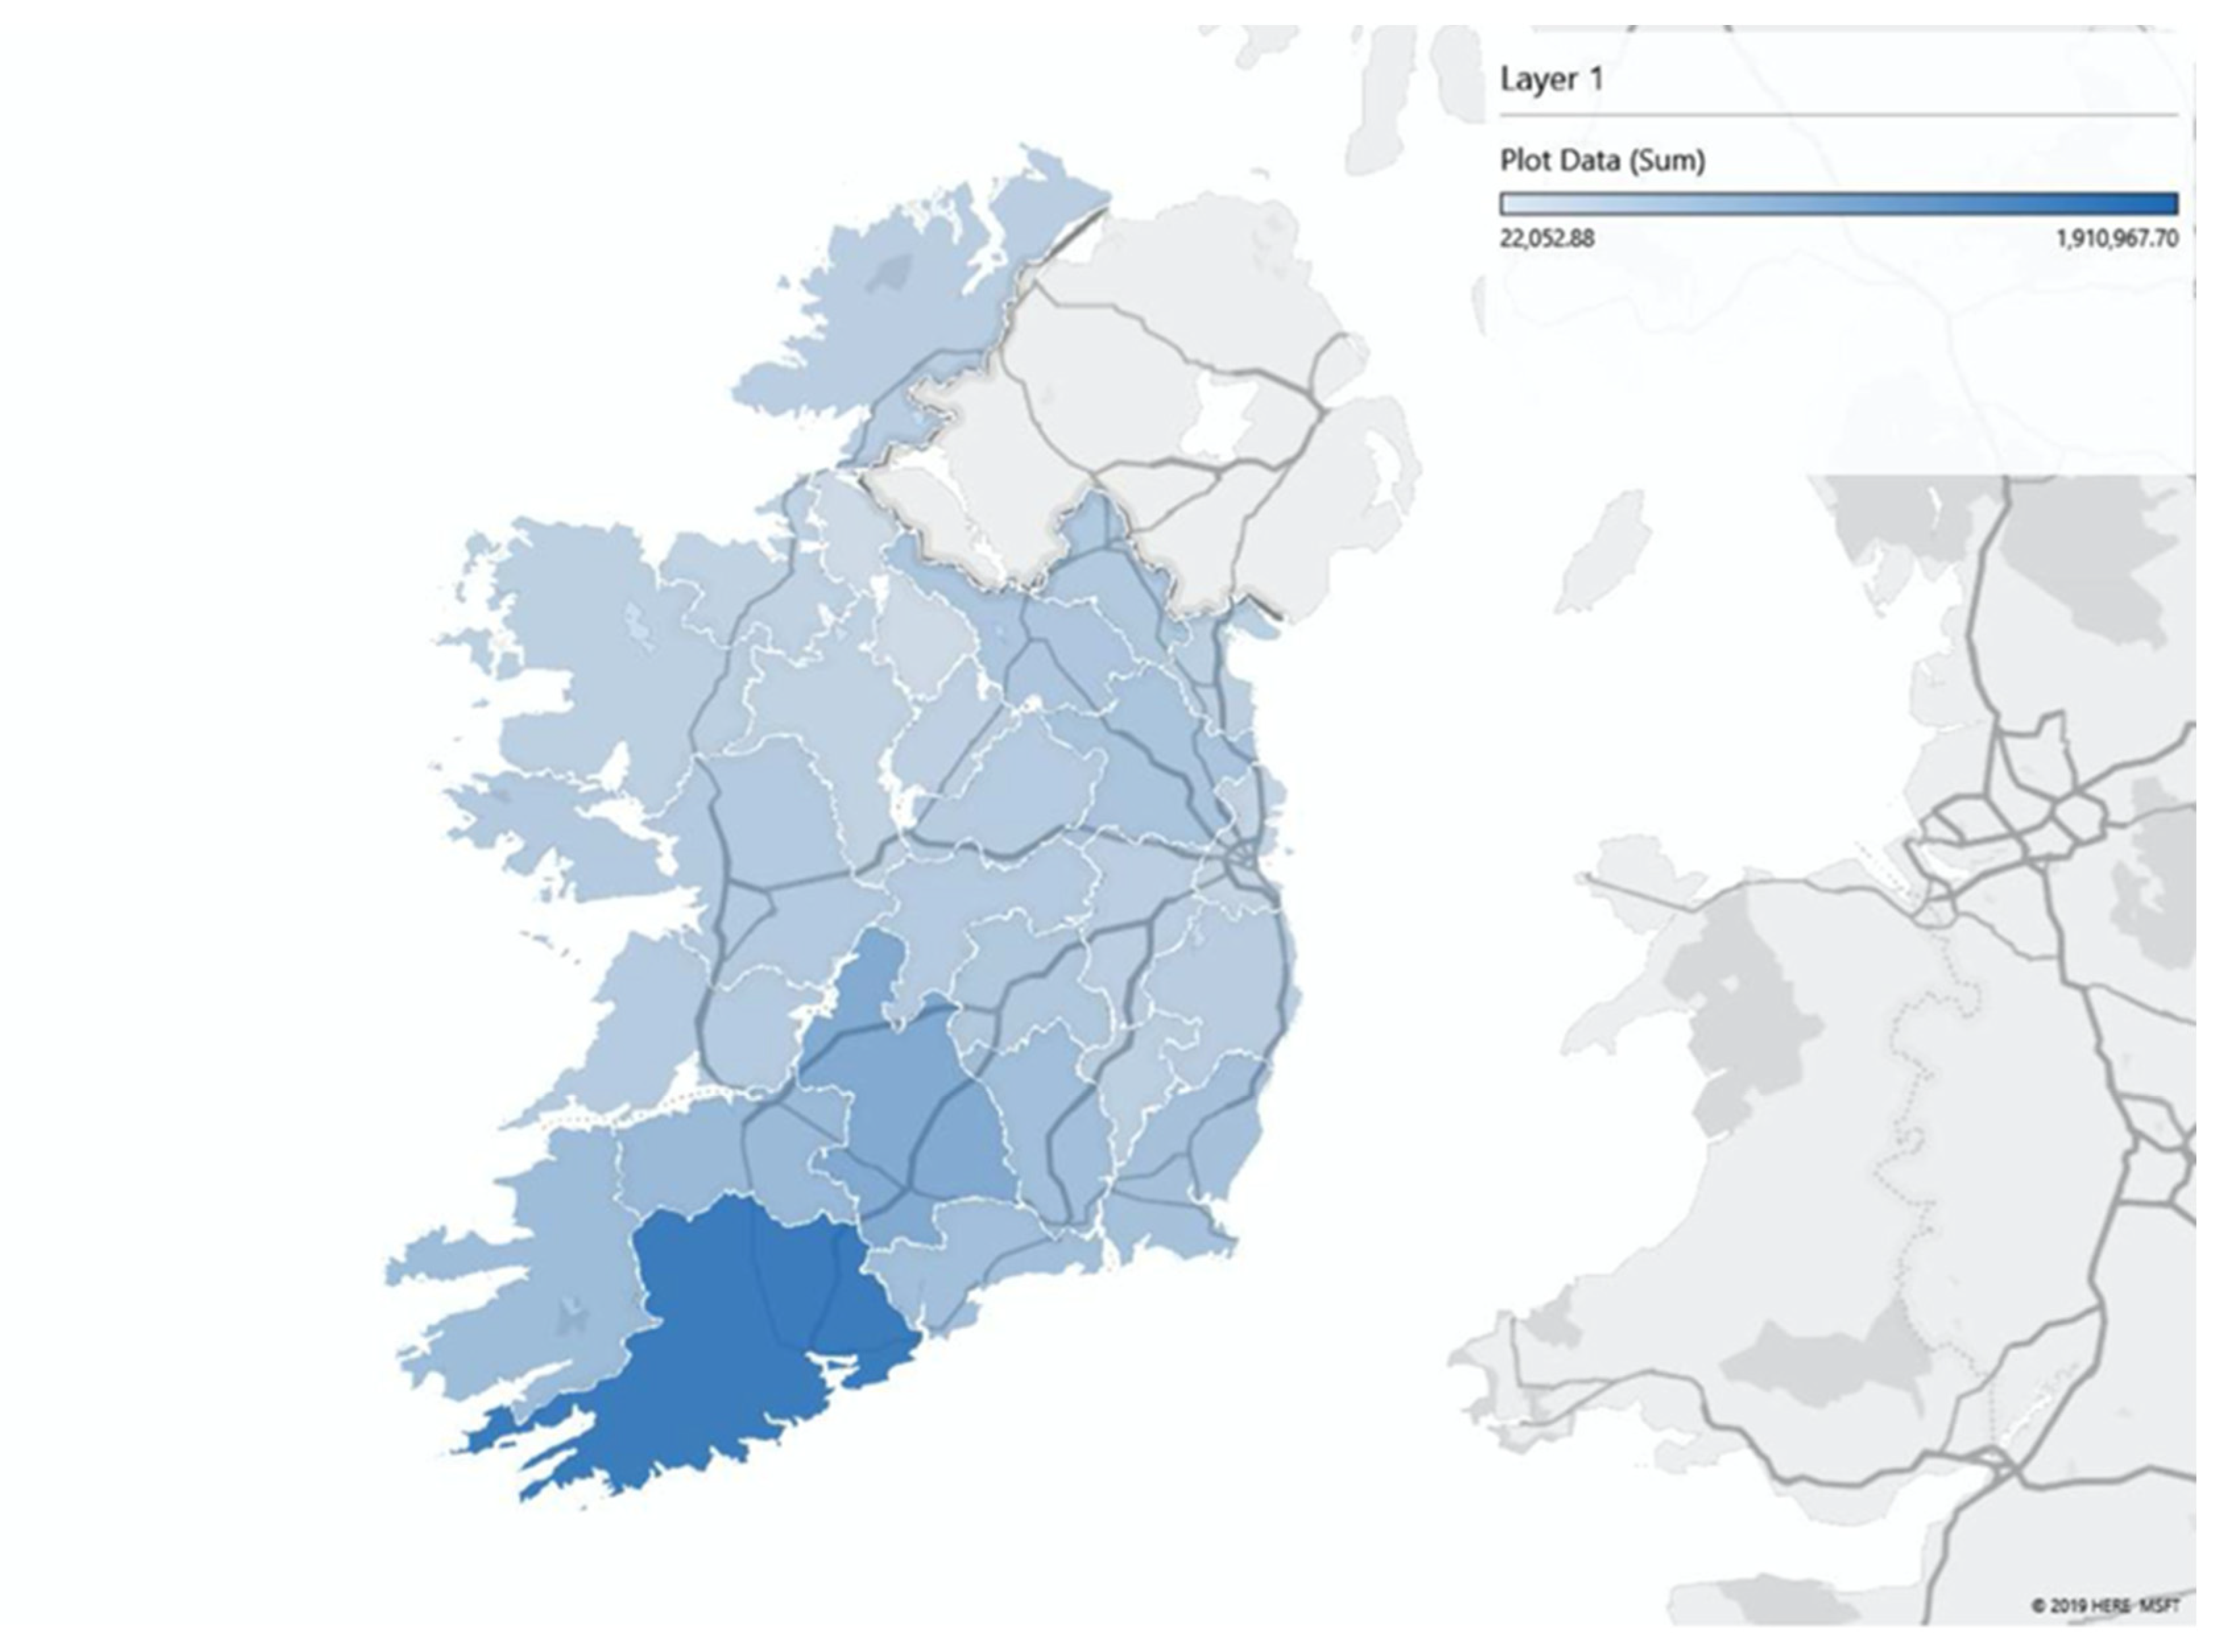
3.1. Bioresource Mapping in Ireland
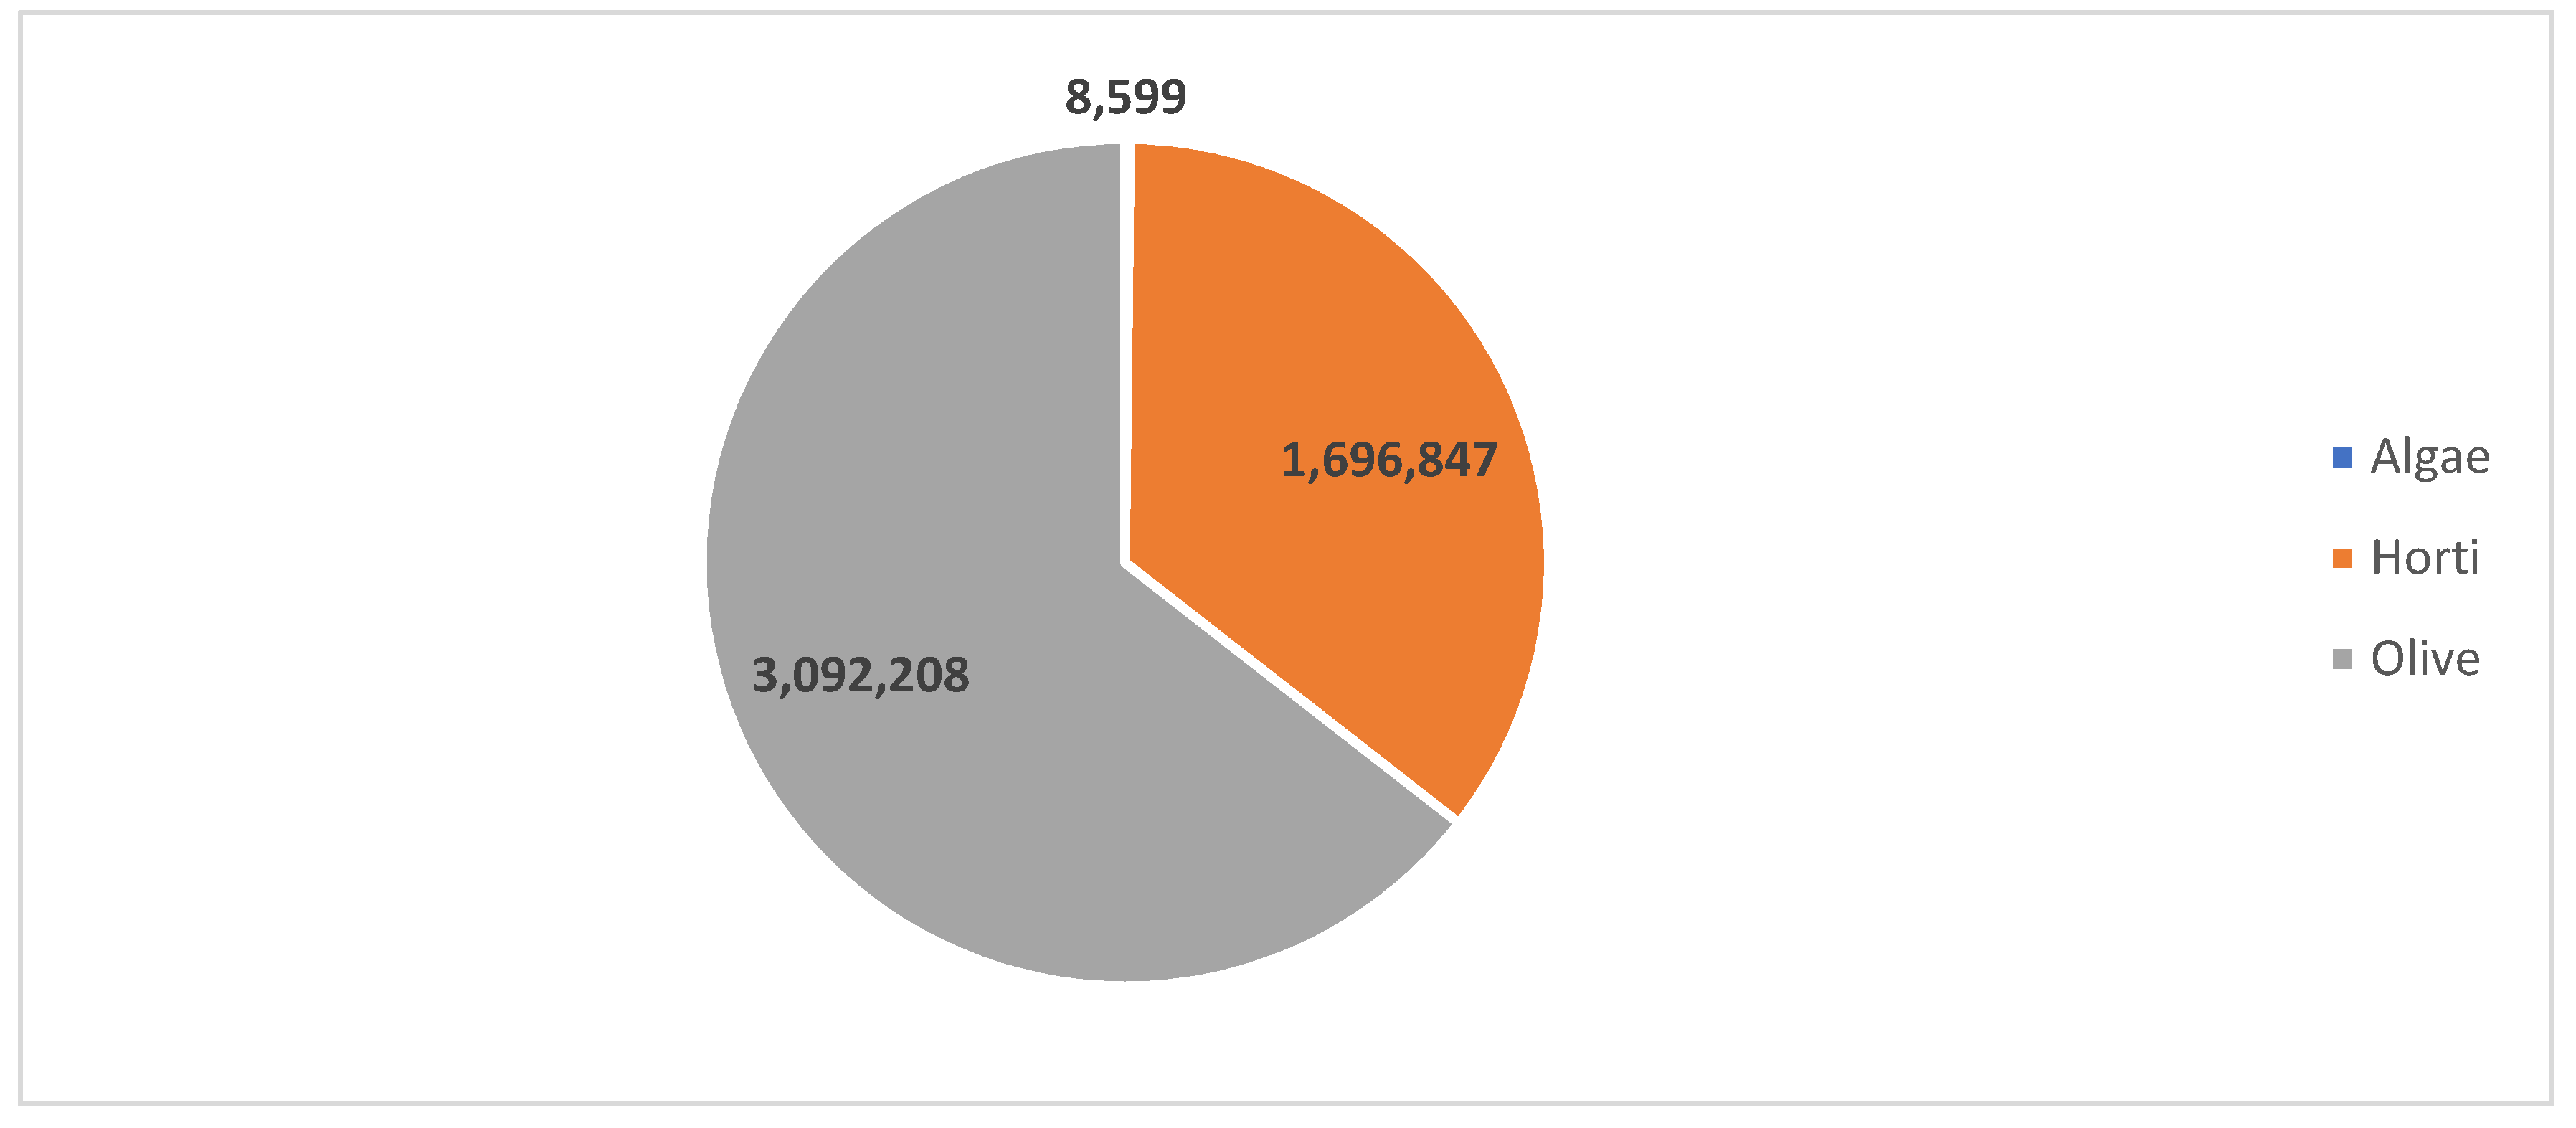
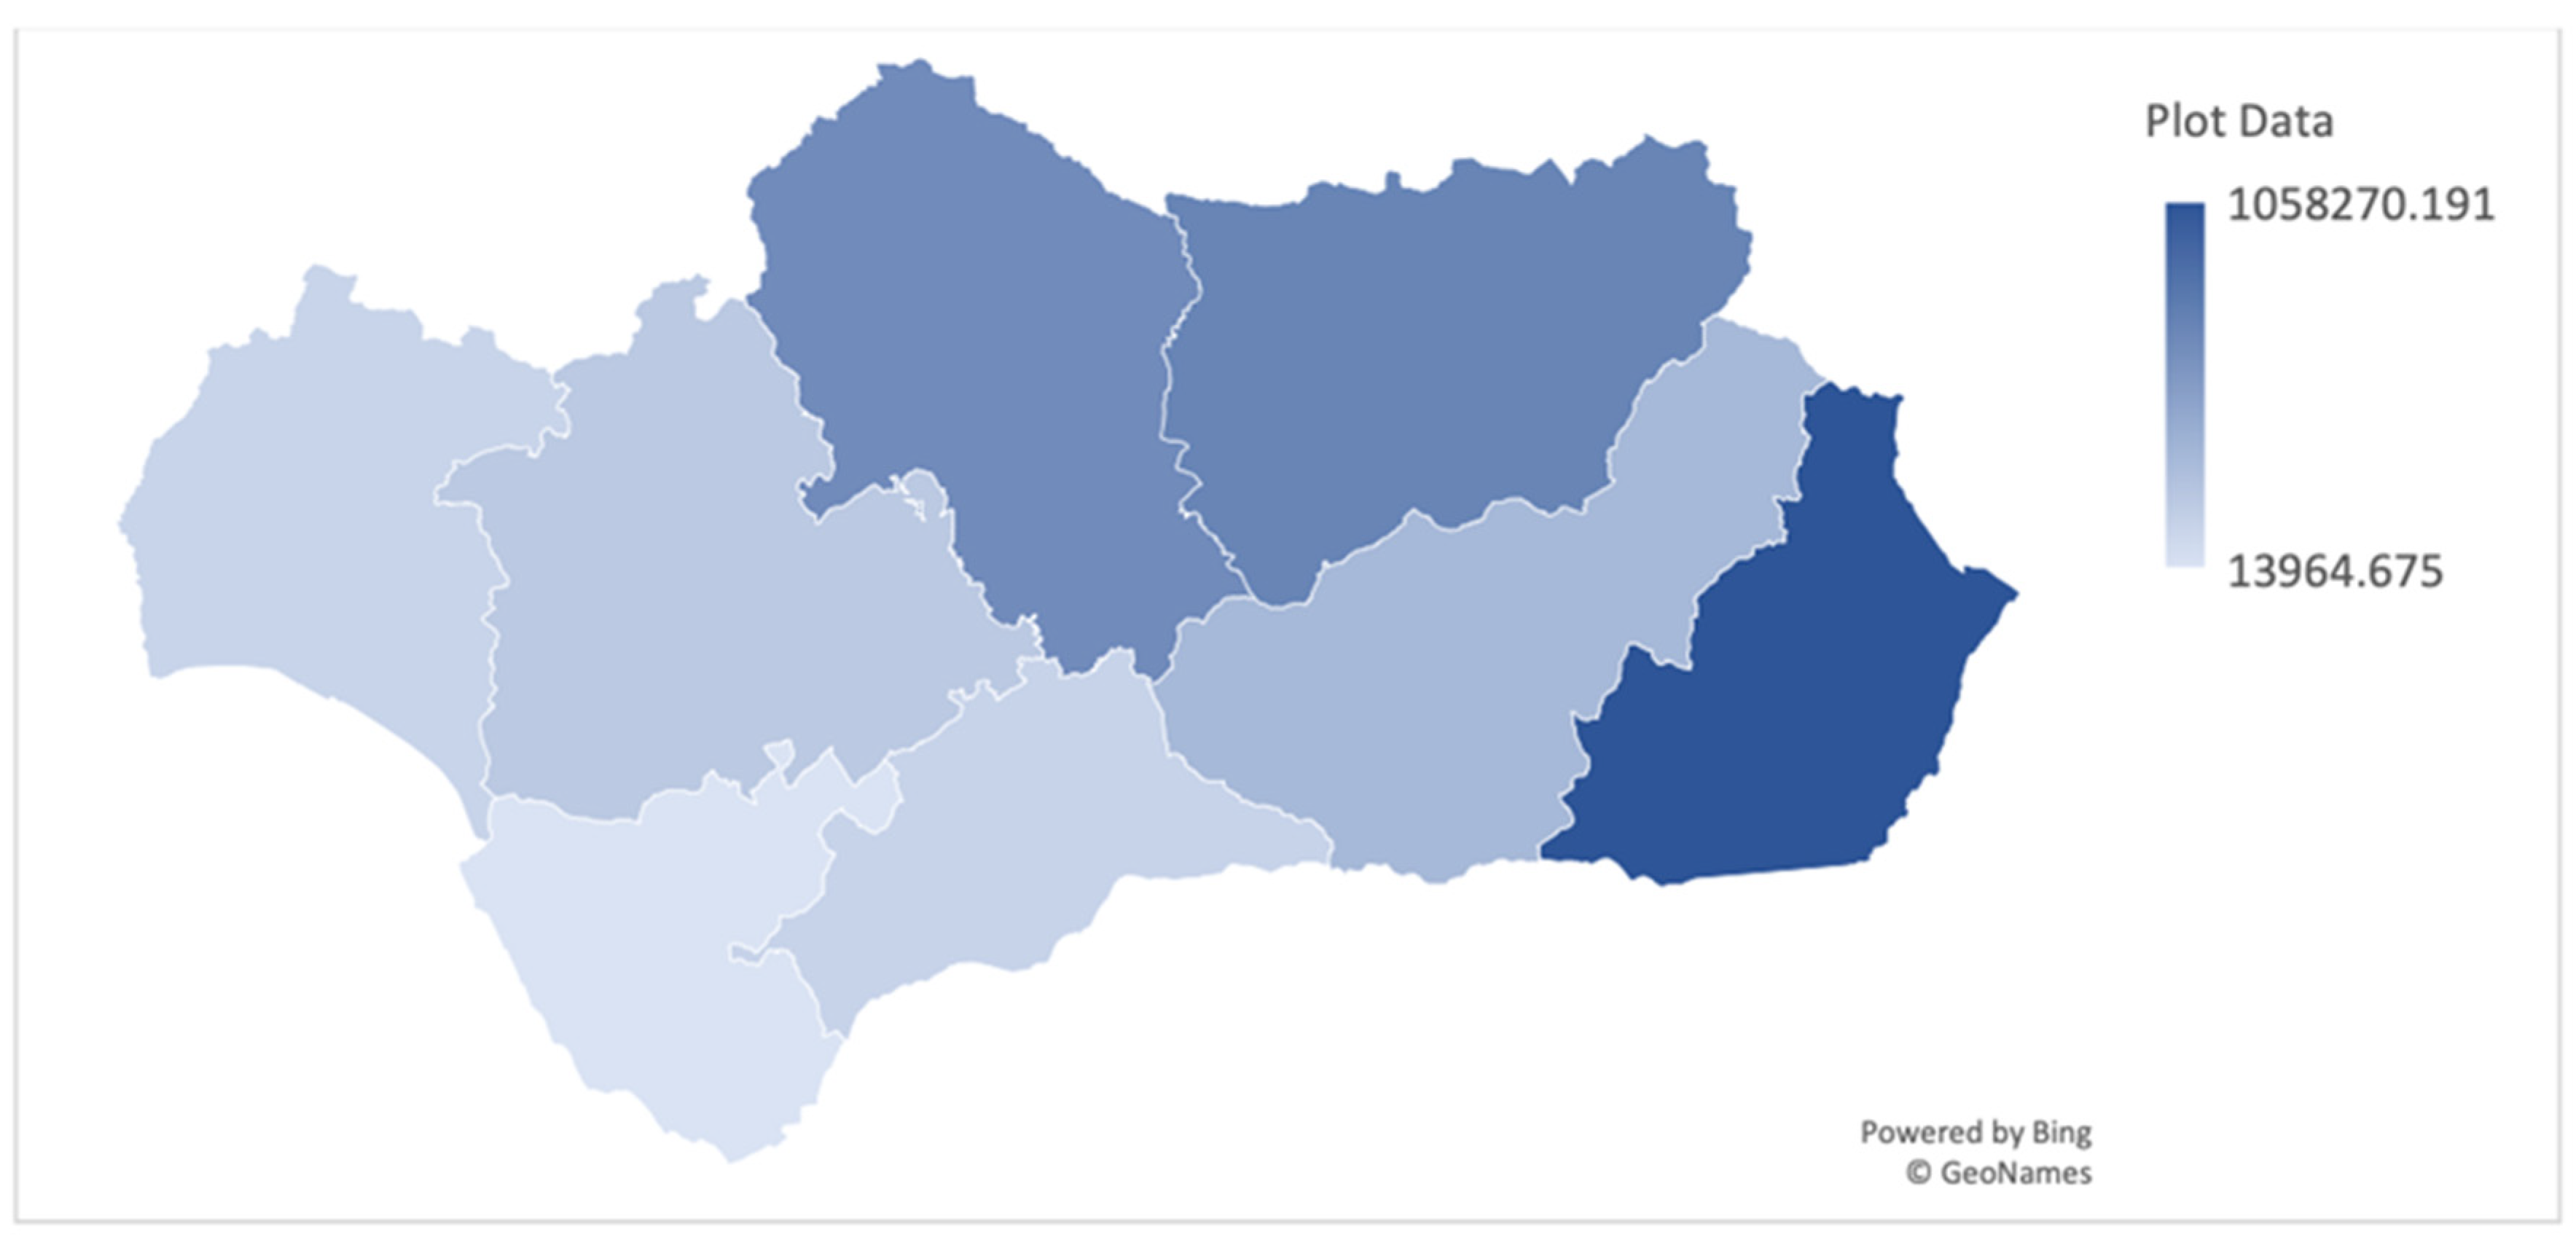
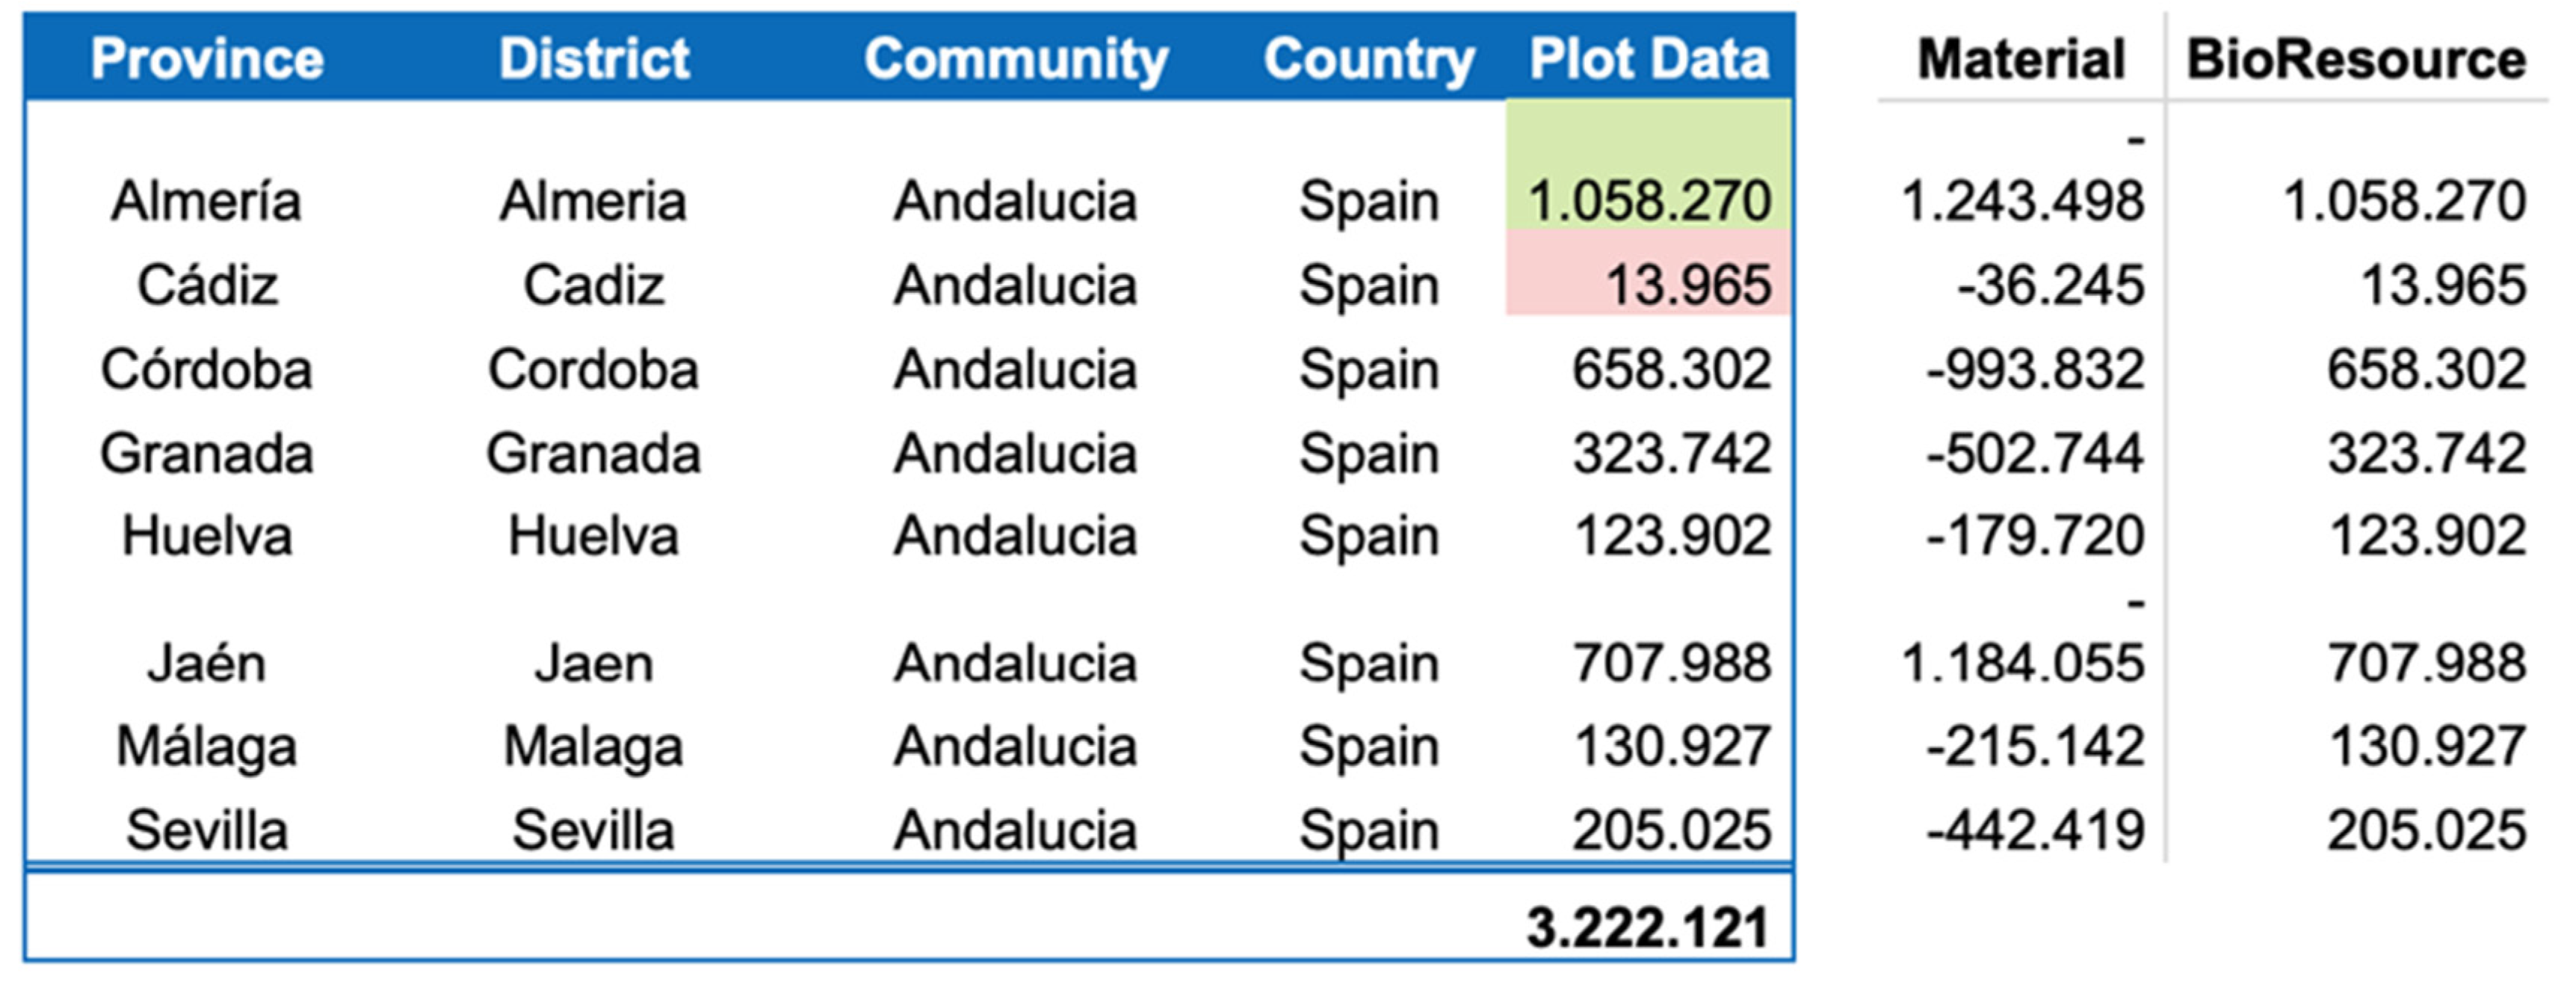
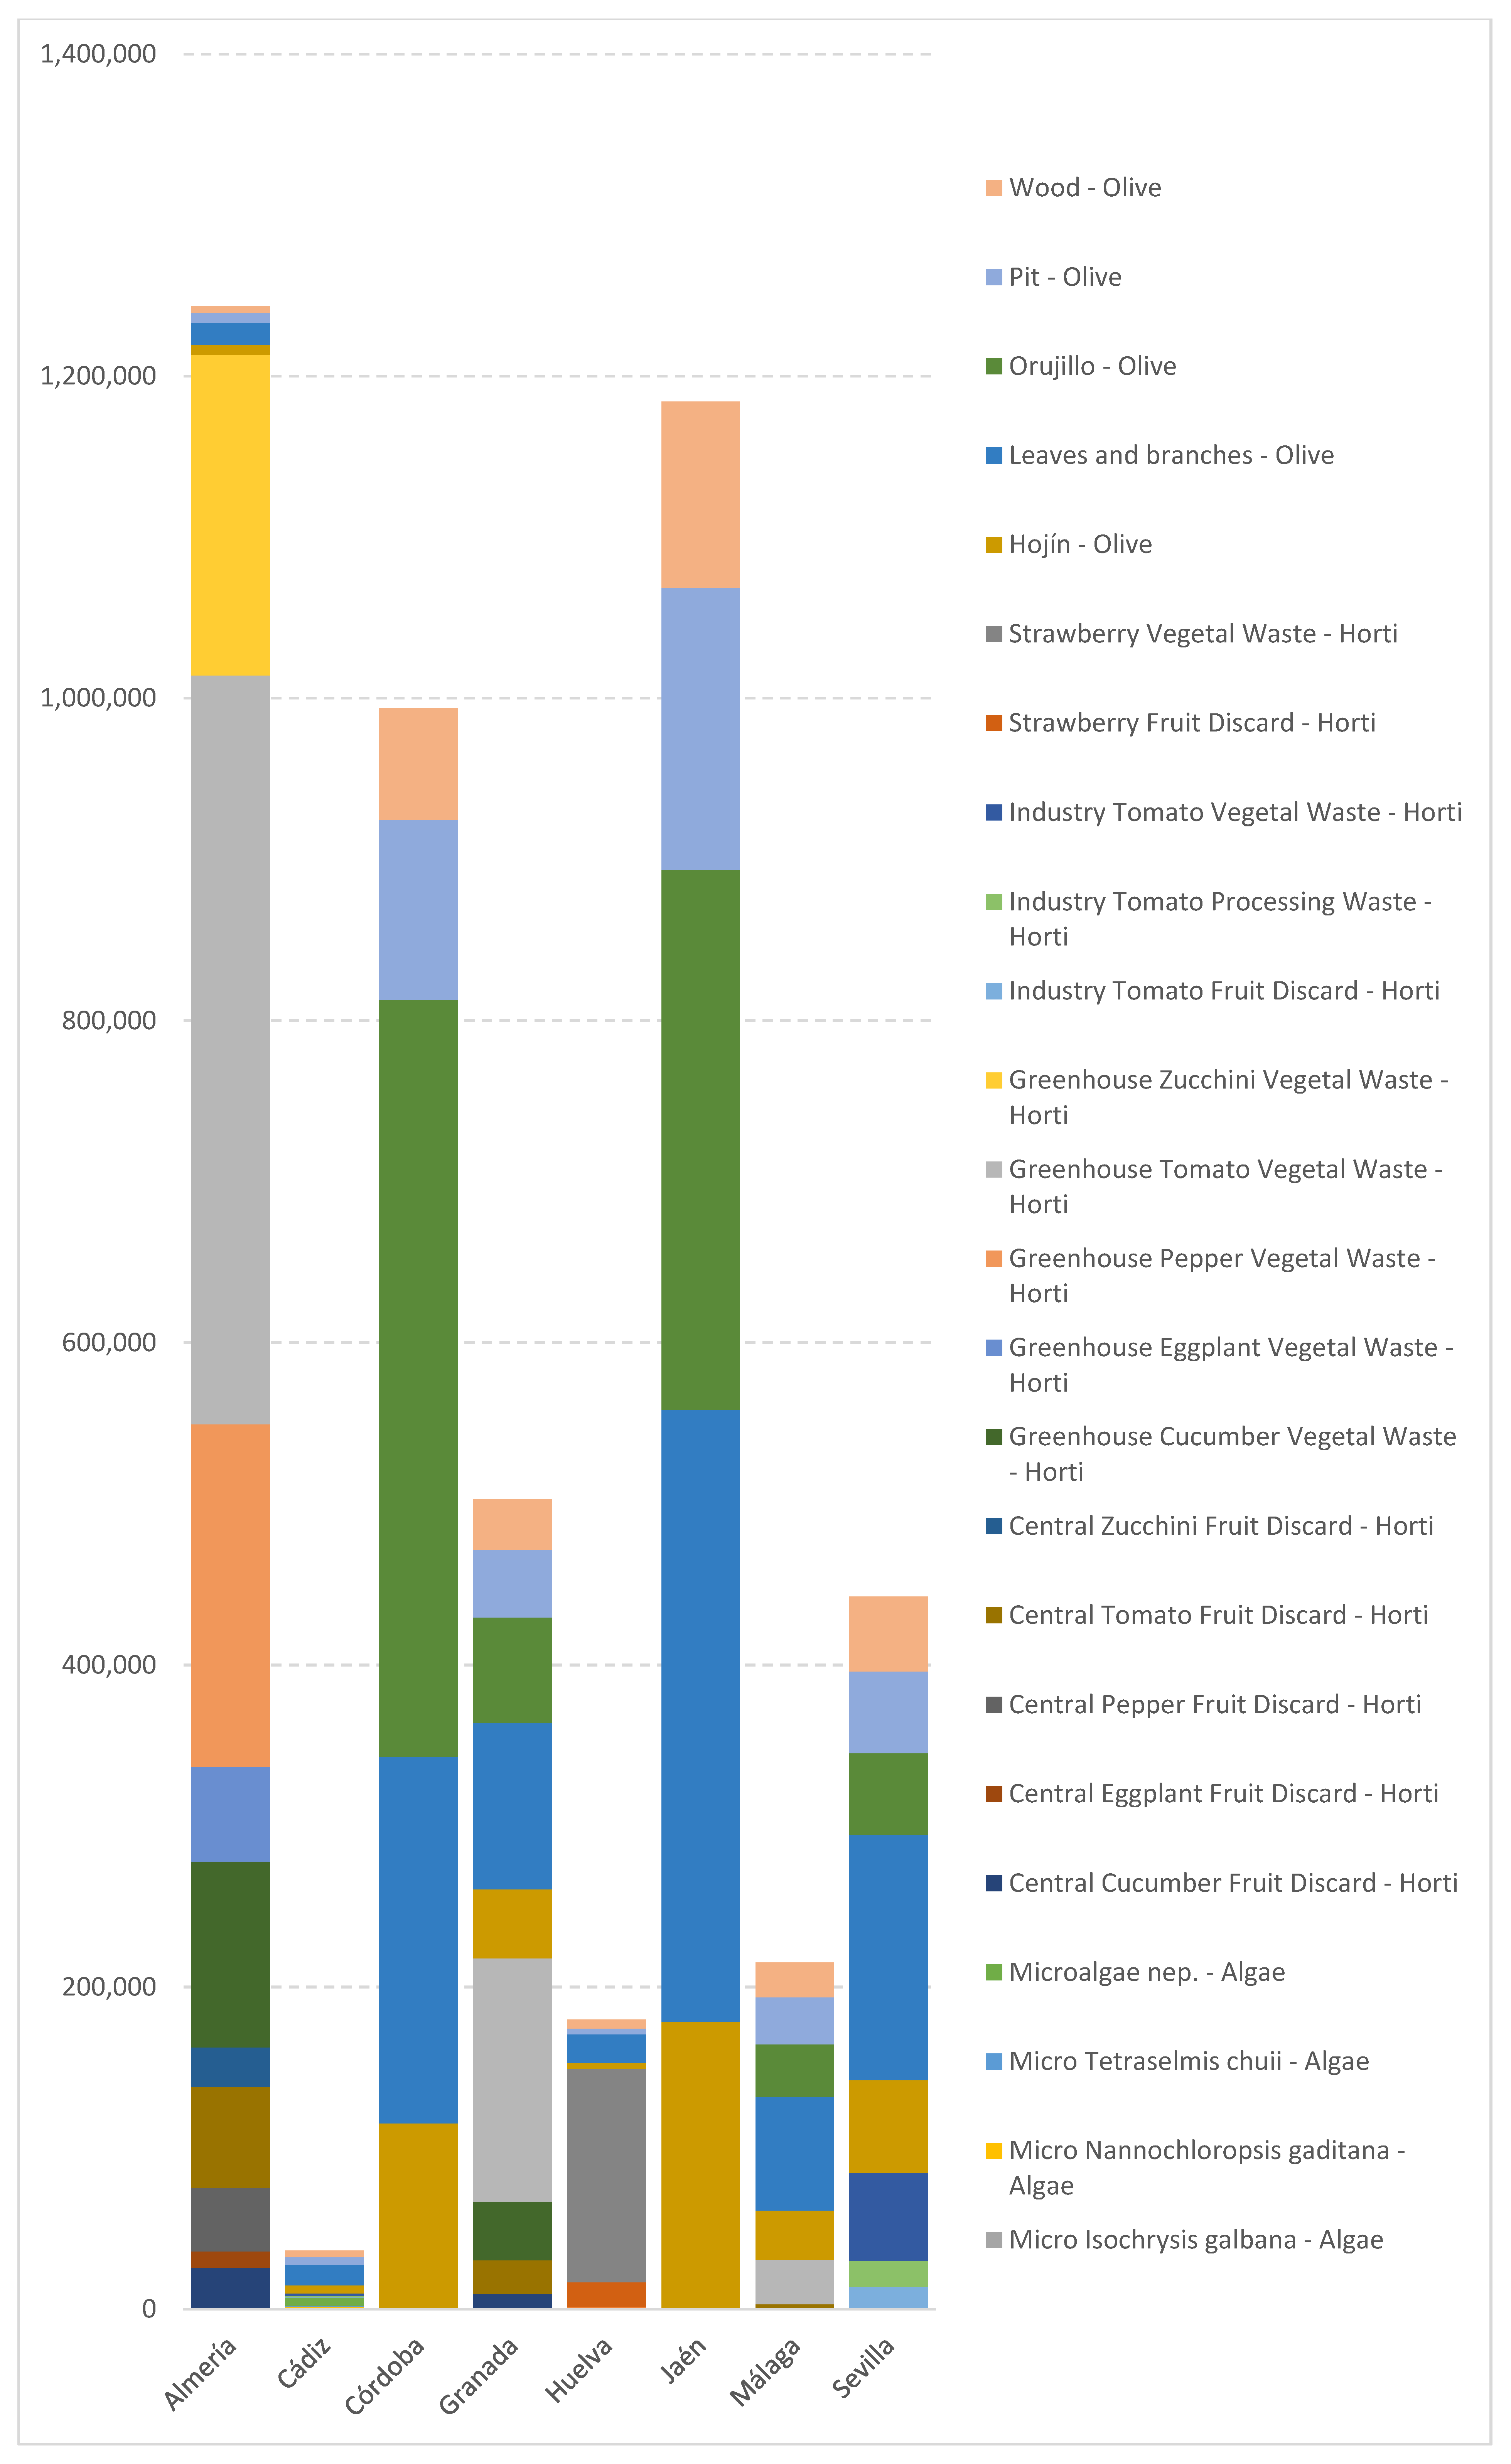
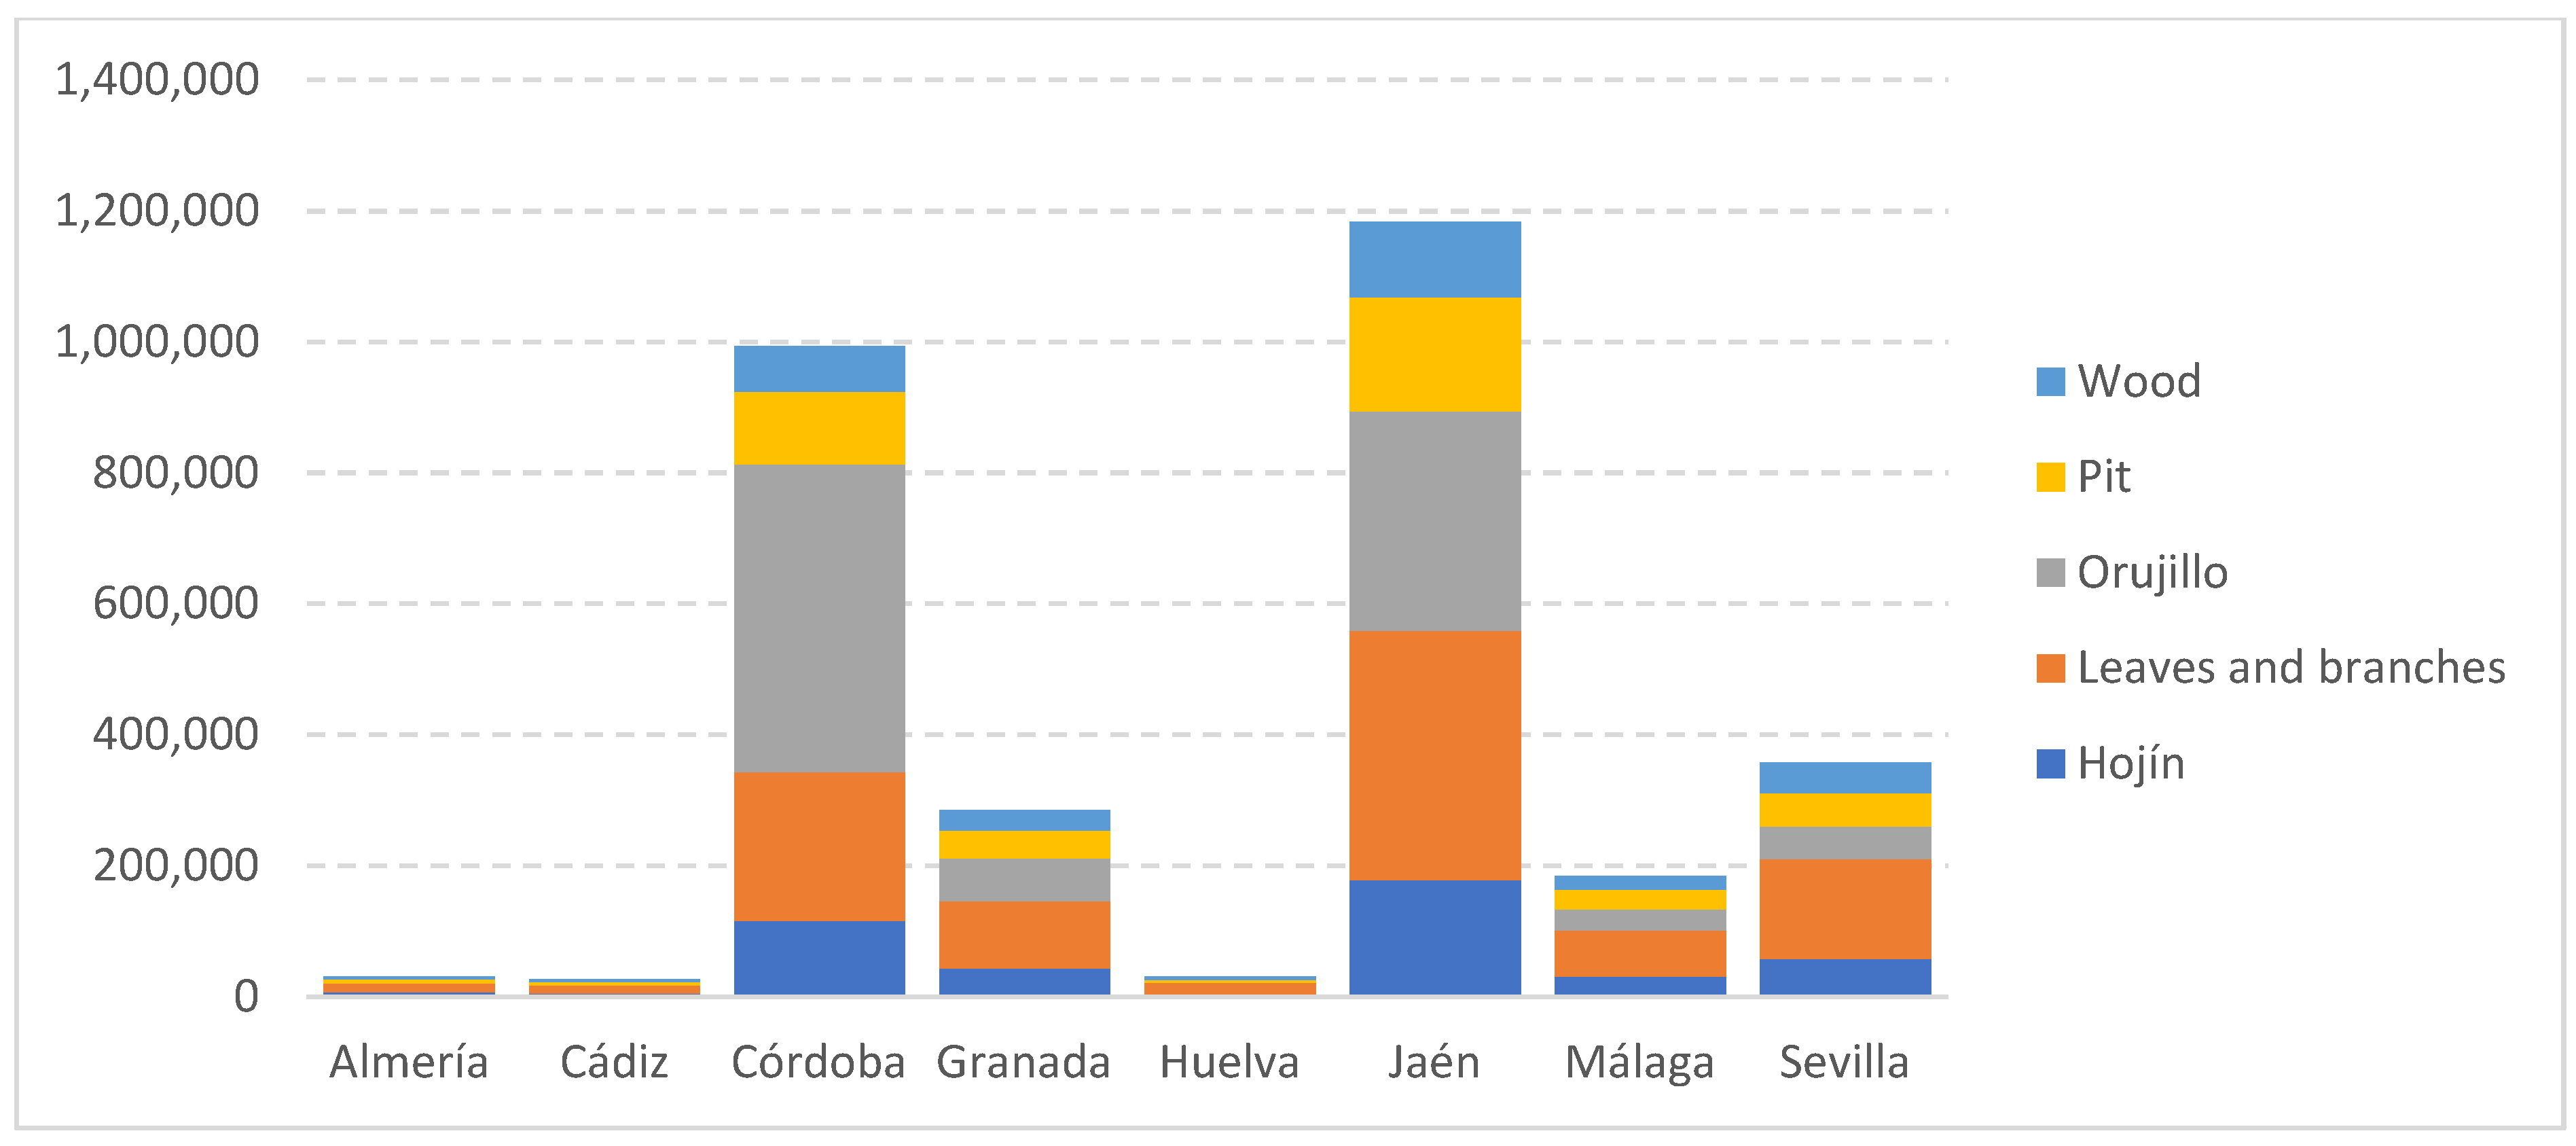
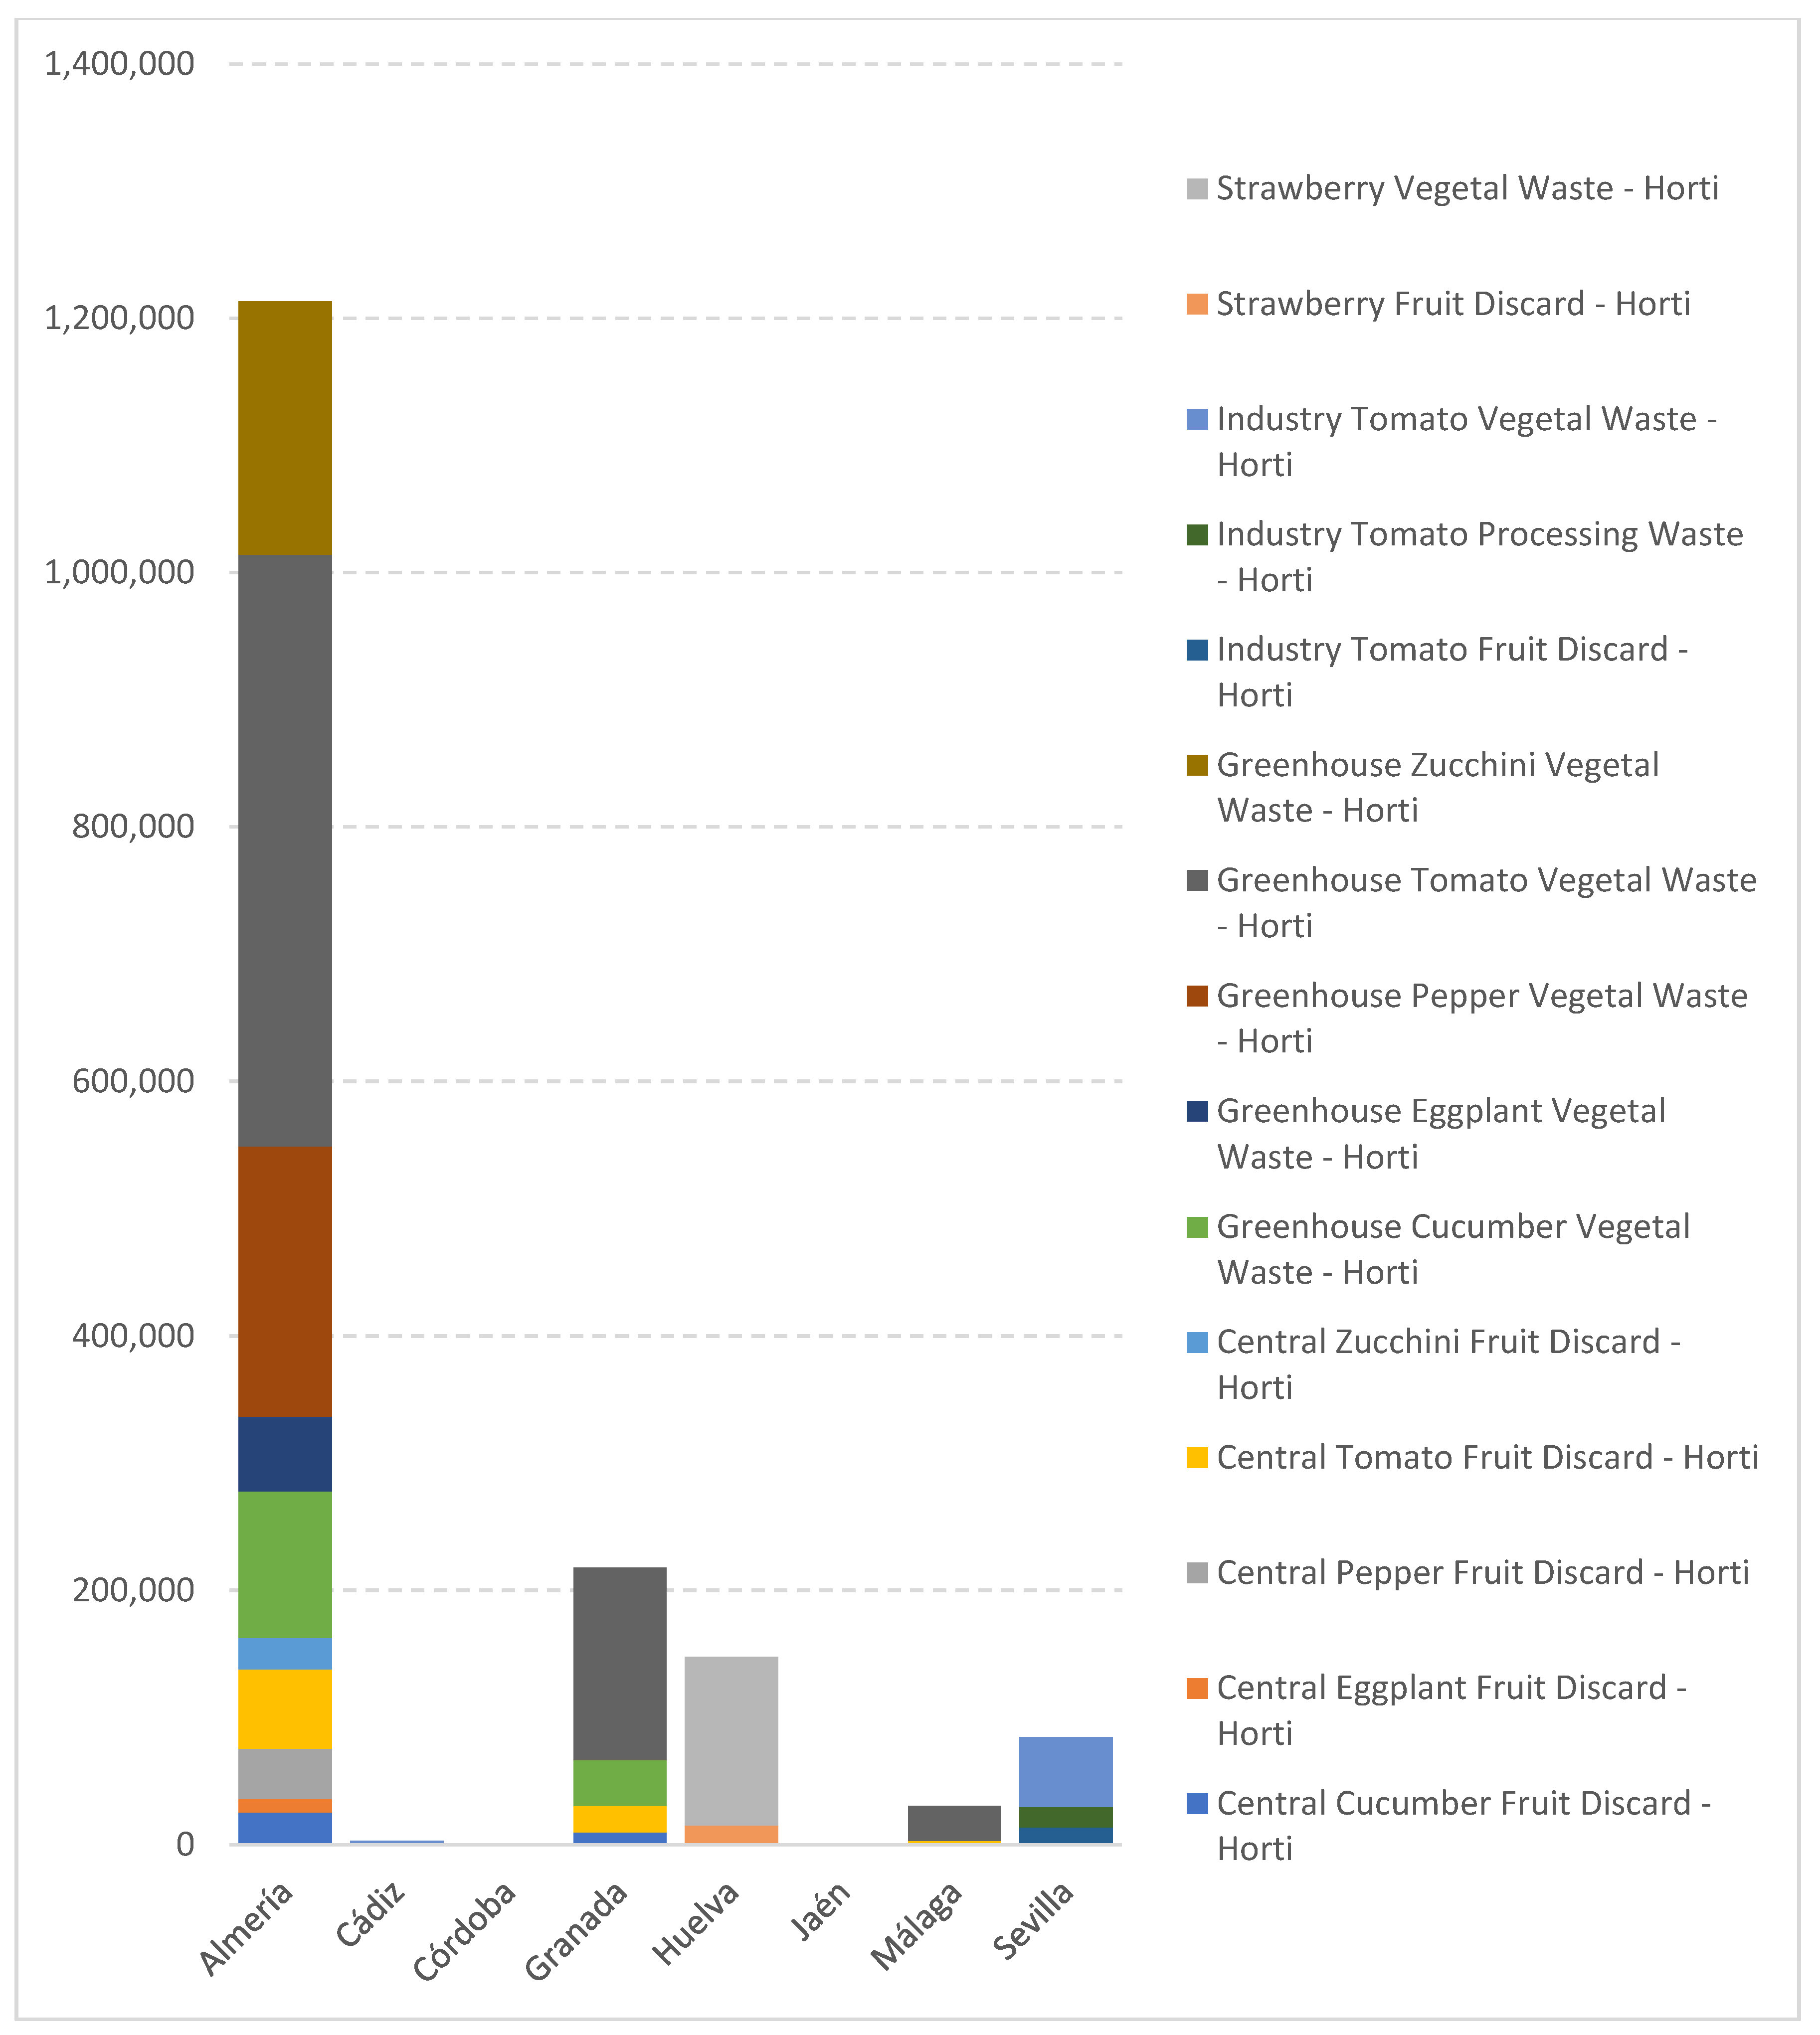
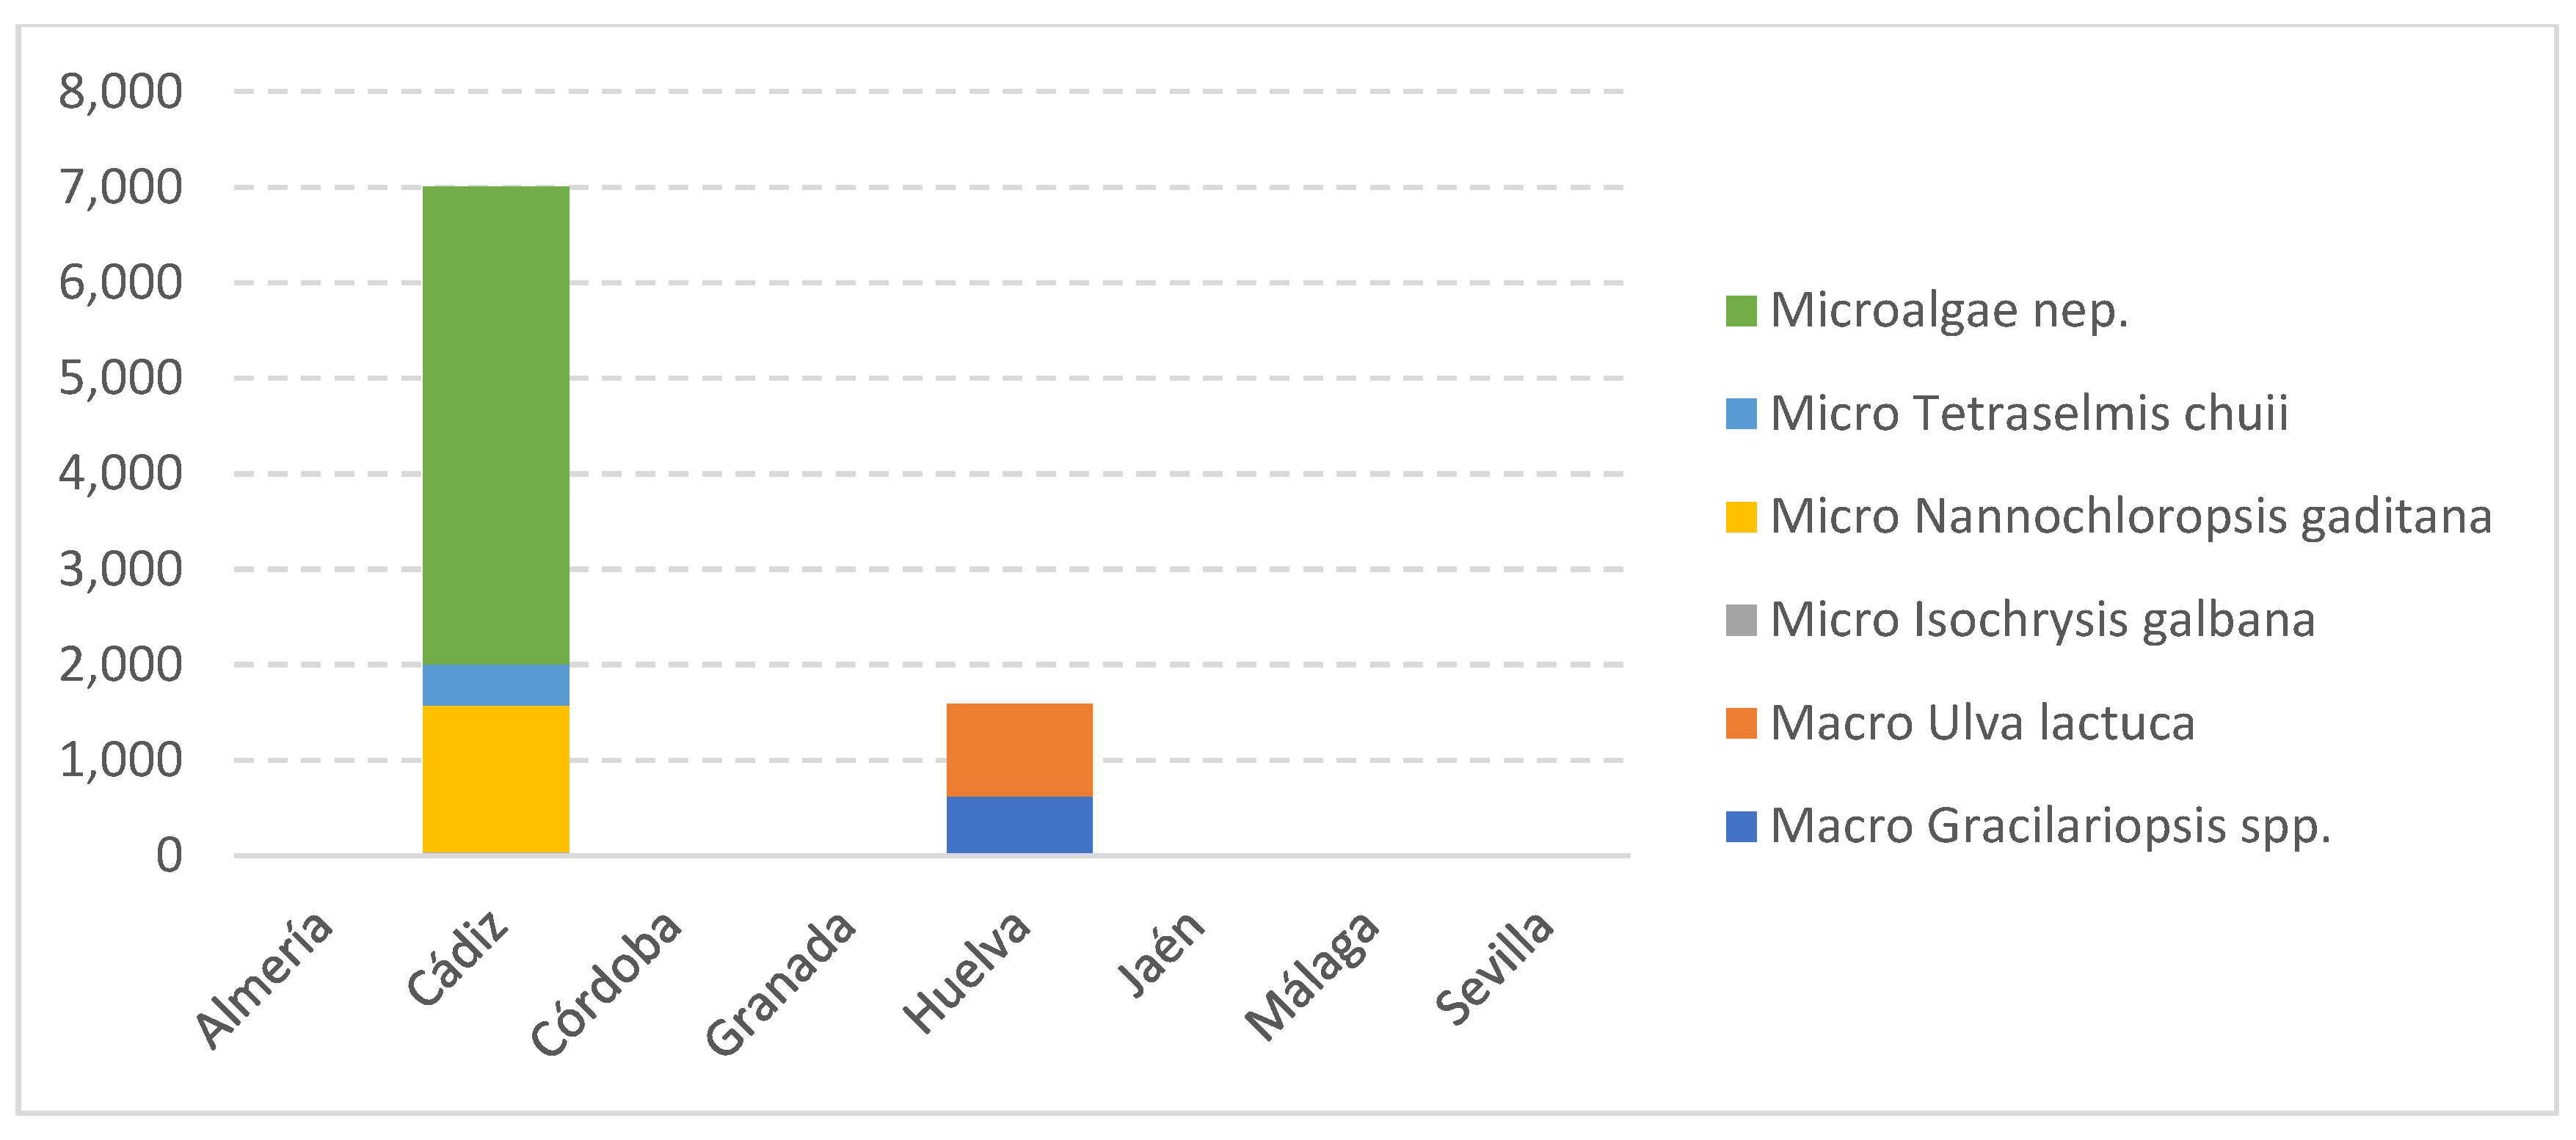
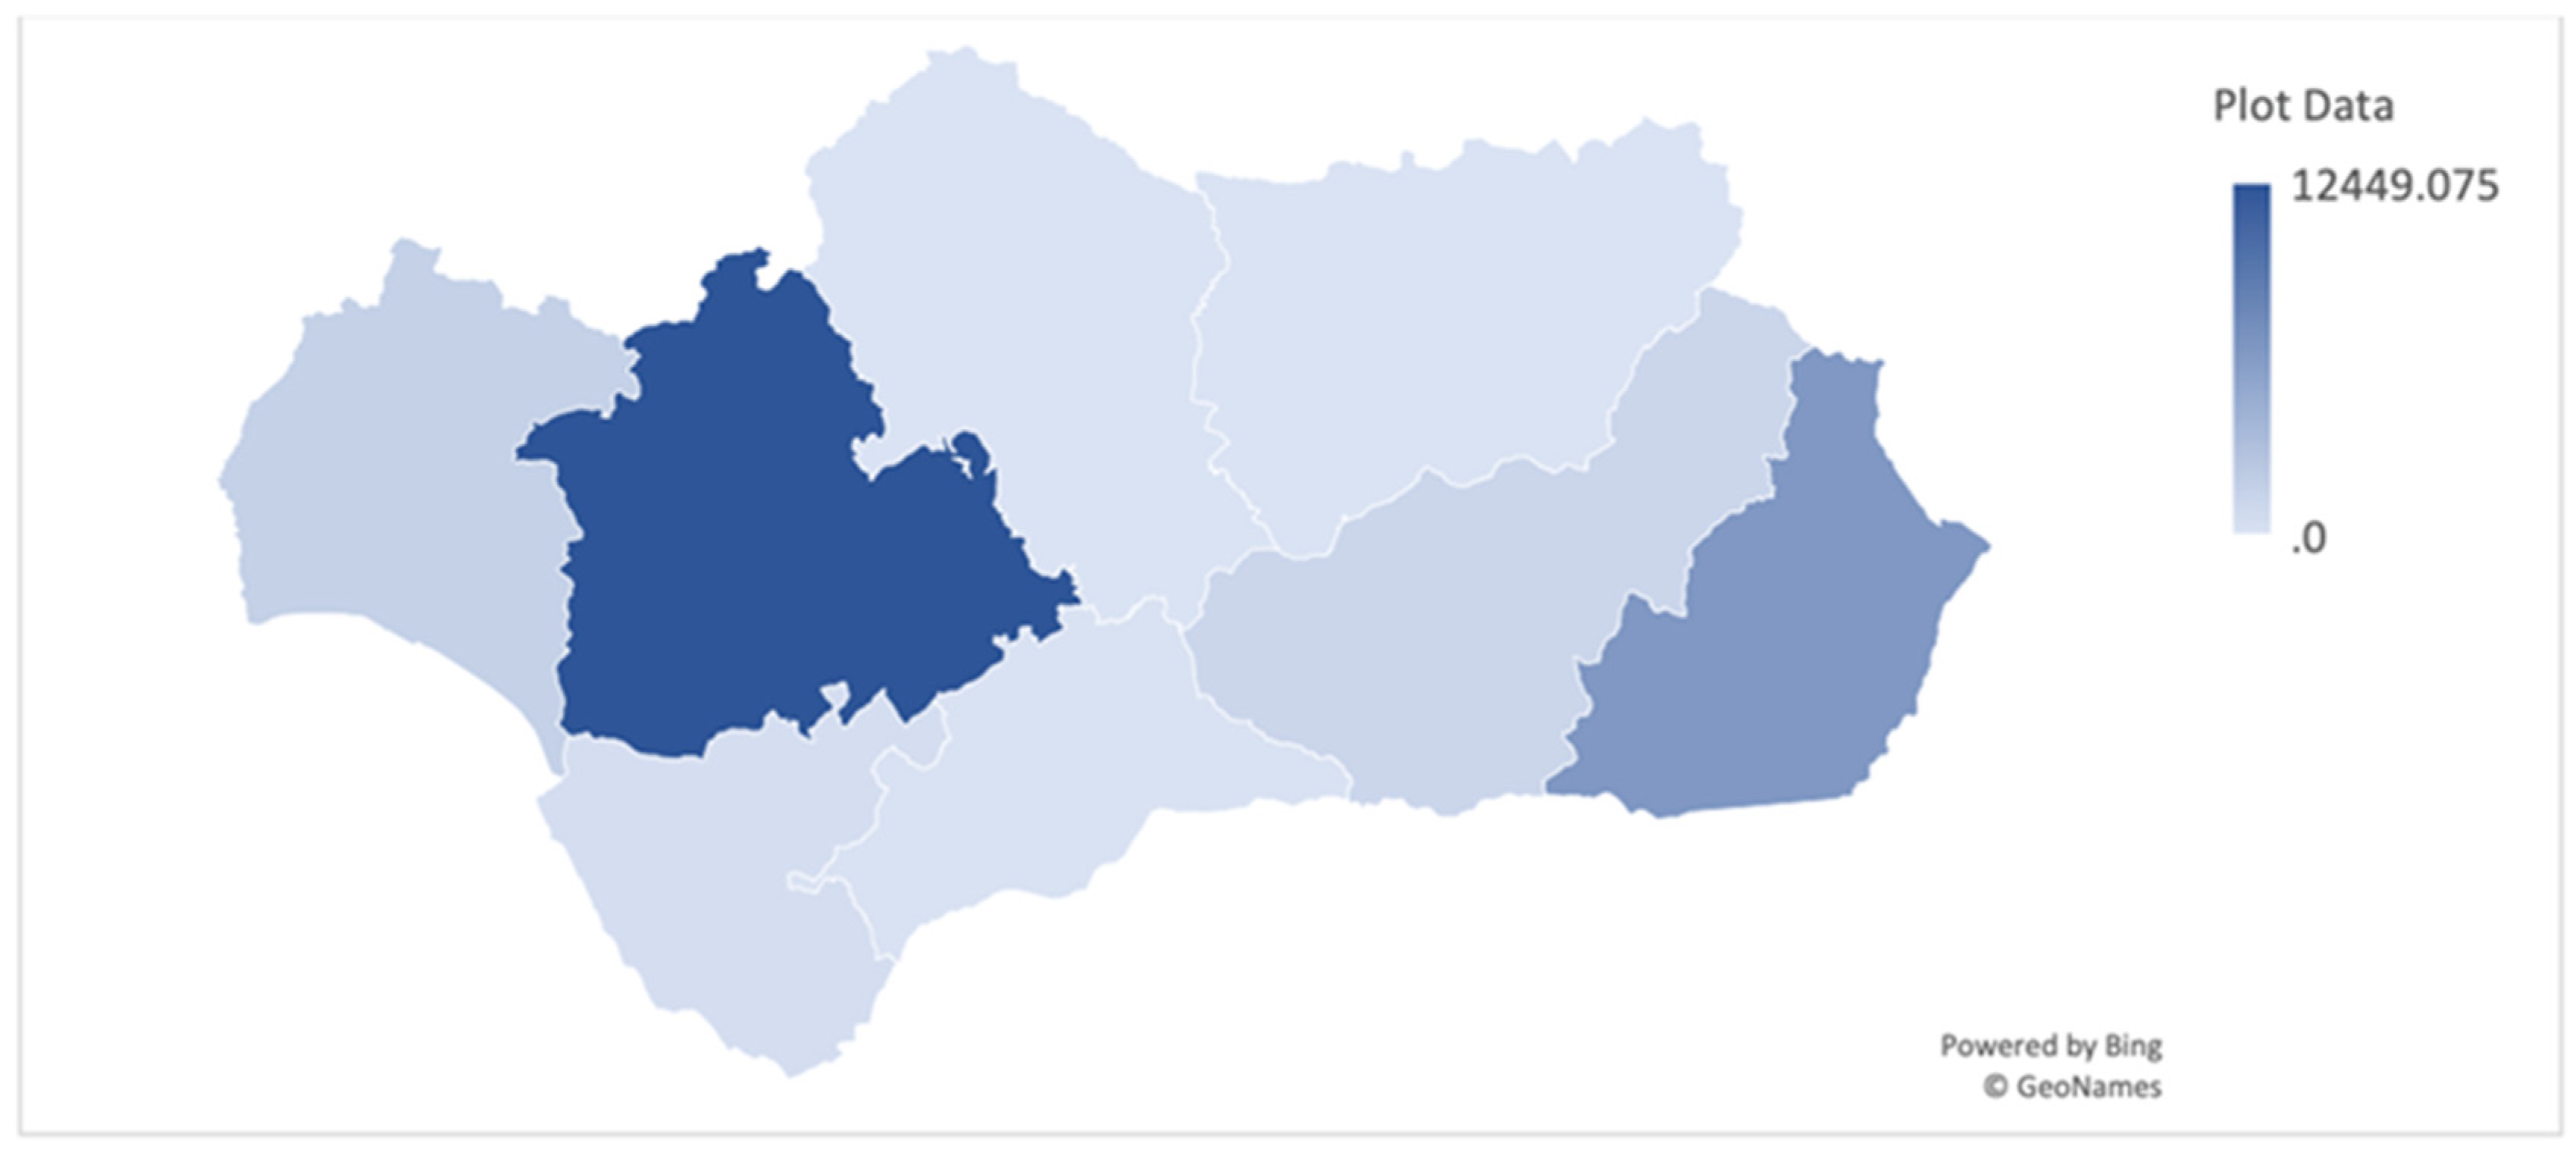
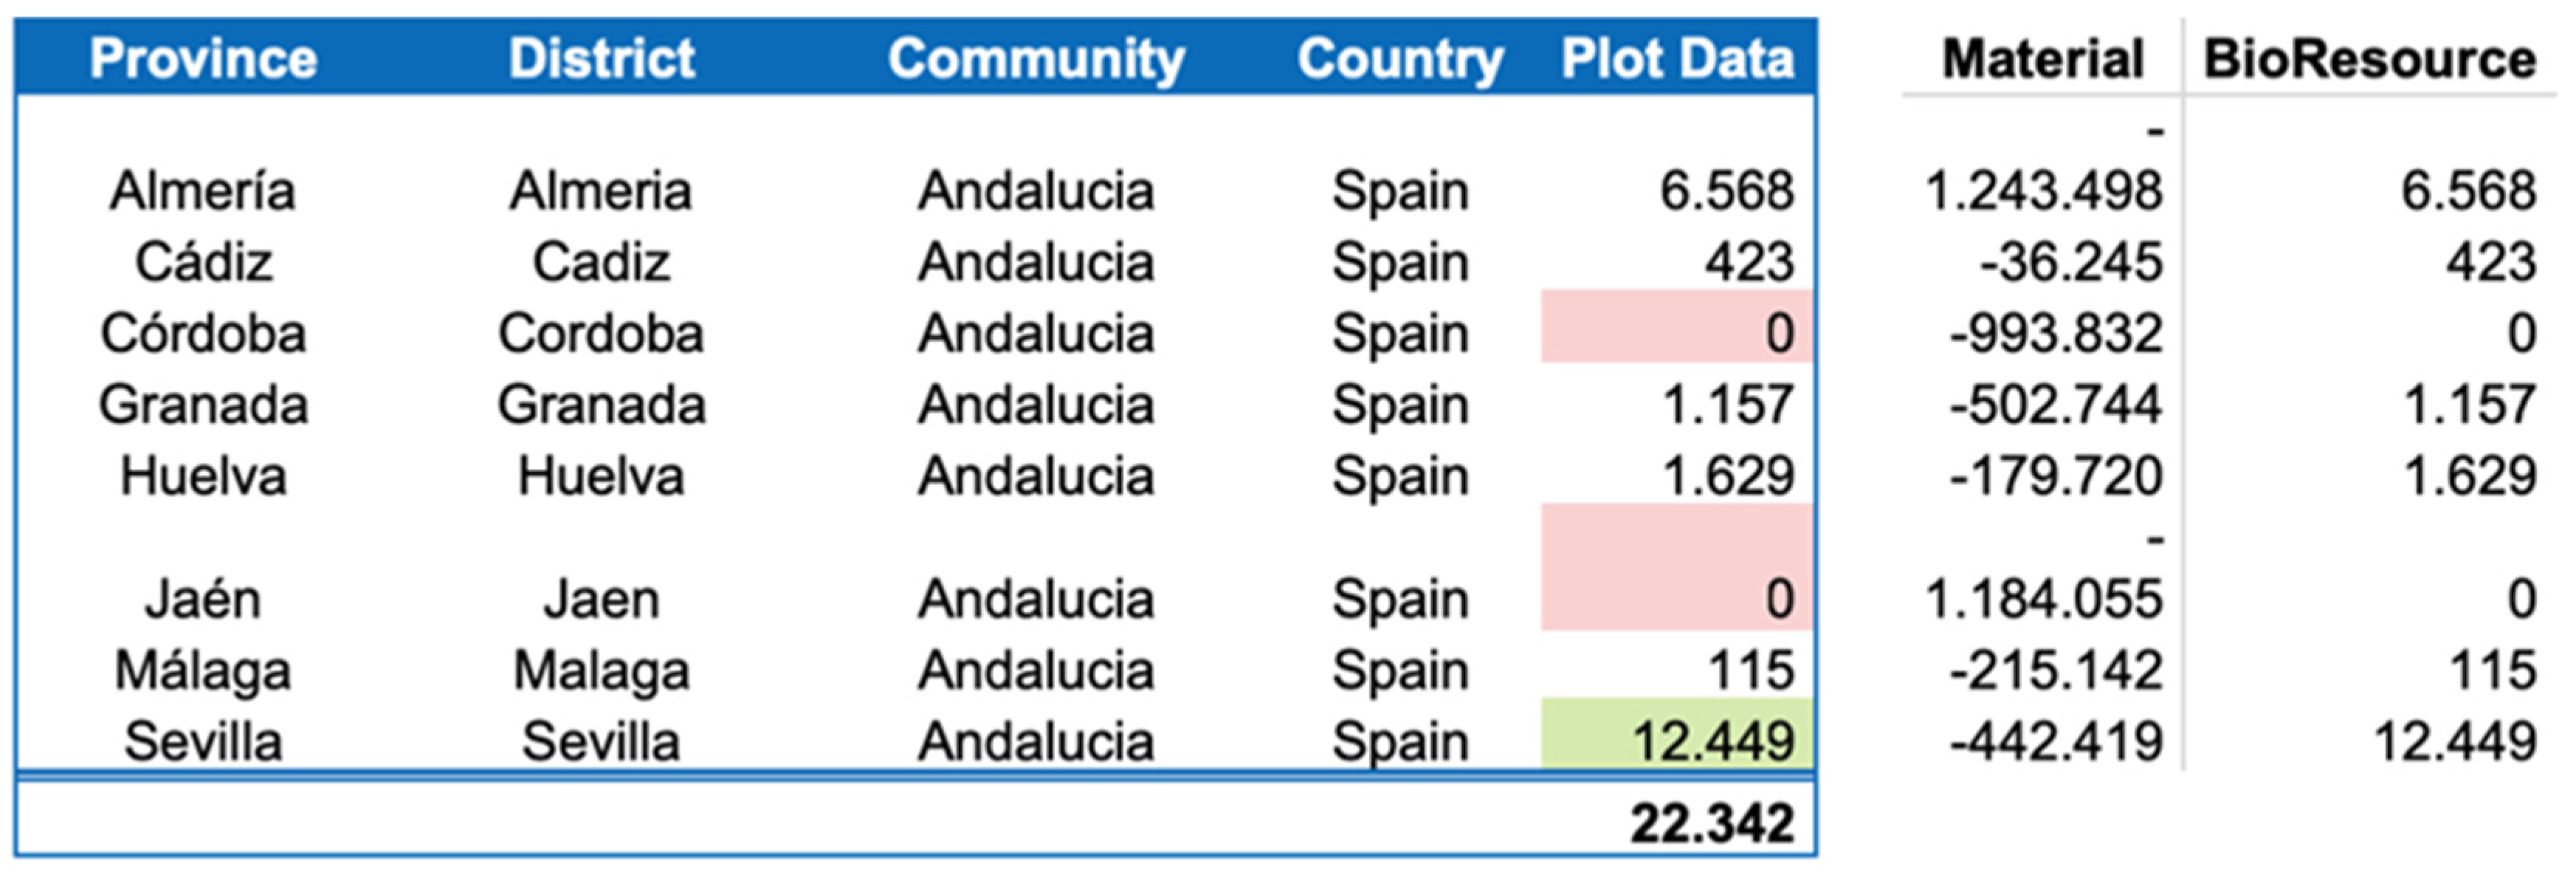
3.2. Bioresource Scoping in Andalusia, Spain
4. Discussion
5. Conclusions
Author Contributions
Funding
Acknowledgments
Conflicts of Interest
References
- Bio-based Industries Consortium. Strategic Innovation & Research Agenda; Bio-based Industries Consortium: Brussels, Belgium, 2017. [Google Scholar]
- USDA Foreign Agricultural Service. EU Bio-Based Economy and Its Inputs; USDA Foreign Agricultural Service: Washington, DC, USA, 2015.
- Joint Research Centre. Biomass Production, Supply, Uses and Flows in the European Union; Joint Research Centre: Ispra, Italy, 2018. [Google Scholar]
- BIO-TIC project. The Bioeconomy Enabled: A Roadmap to a Thriving Industrial Biotechnology Sector in Europe; BIO-TIC project: Brussels, Belgium, 2015. [Google Scholar]
- May-Moulin, T. Sourcing overseas biomass for EU ambitions: Assessing net sustainable export potential from various sourcing countries. Biofuels Bioprod. Bioref. 2018, 13, 293–324. [Google Scholar]
- BIOWAYS Project. Bio-Based Products and Applications Potential; BIOWAYS Project: Bristol, UK, 2019. [Google Scholar]
- EU Commission. Innovating for Sustainable Growth: A Bioeconomy for Europe; EU Commission: Brussels, Belgium, 2012. [Google Scholar]
- De Meyer, A.; Cattrysse, D.; Orshoven, J.V. A generic mathematical model to optimise strategic and tactical decisions in biomass-based supply chains (OPTIMASS). Eur. J. Oper. Res. 2015, 245, 247–264. [Google Scholar] [CrossRef]
- Scholz, J.; De Meyer, A.; Marques, A.; Pinho, T.M.; Cunha, J.; Orshoven, J.; Rosset, C.; Künzi, J.; Jaakkola, K.; Nummila, K. Digital technologies for forest supply chain optimization: Existing solutions and future trends. Environ. Manag. Environ. Manag. 2018, 62, 1–58. [Google Scholar] [CrossRef] [PubMed]
- Smith, S.; Safferman, S.I.; Saffron, C.M. Development and application of a decision support tool for biomass co-firing in existing coal-fired power plants. J. Clean. Prod. 2019, 236, 117375. [Google Scholar] [CrossRef]
- Leduc, S.; Starfelt, F.; Dotzauer, E.; Kindermann, G.; McCallum, I.; Obersteiner, M.; Lundgren, J. Optimal Location of Lignocellulosic Ethanol Refineries with Polygeneration in Sweden. Energy 2010, 35, 2709–2716. [Google Scholar] [CrossRef]
- Sosa, A.; Acuna, M.; McDonnell, K.; Devlin, G. Controlling moisture content and truck configurations to model and optimise biomass supply chain logistics in Ireland. Appl. Energy 2015, 137, 338–351. [Google Scholar] [CrossRef]
- Alam, M.; Pulkki, R.; Shahi, C. Road network optimization model for supplying woody biomass feedstock for energy production in Northwestern Ontario. Open For. Sci. 2012, 5, 1–14. [Google Scholar] [CrossRef]
- Peterson, S.; Peck, C.; Stright, D.; Newes, E.; Inman, D.; Vimmerstedt, L.; Hsu, D.; Bush, B. An Overview of the Biomass Scenario Model; National Renewable Energy Laboratory: Golden, CO, USA, 2013. [Google Scholar]
- S2Biom. Available online: https://www.s2biom.eu/en/ (accessed on 28 May 2020).
- AGROinLOG. Available online: http://agroinlog-h2020.eu/en/home/ (accessed on 28 May 2020).
- Zero Waste Scotland. Biorefining Potential for Scotland; Zero Waste Scotland: Stirling, Scotland, 2018. [Google Scholar]
- Kumar, A.; Adamopoulos, S.; Jones, D.; Amiandamhen, S.O. Forest biomass availability and utilization potential in Sweden: A review. Waste Biomass Valoriz. 2020. [Google Scholar] [CrossRef]
- Chiani, F.; Corradi, C.A.R.; Perugini, V.R.; Rappuoli, V.; Valentini, R.; Angelova, E.; Nestorovski, L. Biomass Availability in the Republic of Macedonia; University of Tuscia: Viterbo, Italy; University of Cyril and Methodius of Skopje: Skopje, Macedonia, 2010. [Google Scholar]
- Kory, K.A.; Latawiec, A.E.; Grotkiewicz, K.; Kuboń, M. The review of biomass potential for agricultural biogas production in Poland. Sustainability 2019, 11, 6515. [Google Scholar] [CrossRef]
- Walsh, E.; McDonnell, K.; Henchion, M.; Devaney, L.; Shanahan, U.; O’hUiginn, P.; Gaffey, J.; Bonsall, B.; LeMass, O.; O’Flaherty, V.; et al. The Irish Bioeconomy Definition, Structure, and Situational Analysis, Ireland; BioÉire: Dublin, Ireland, 2017. [Google Scholar]
- AgroCycle Project. Database/Inventory of the ANIMALS AWCB Value Chain; AgroCycle: Dublin, Ireland, 2017. [Google Scholar]
- AgroCylce Project. Database/Inventory of the CEREALS AWCB Value Chain; AgroCycle: Dublin, Ireland, 2017. [Google Scholar]
- AgroCycle Project. Database/Inventory of the FRUIT AWCB Value Chain; AgroCycle: Dublin, Ireland, 2017. [Google Scholar]
- Laineza, M.; González, J.M.; Aguilarc, A.; Vela, C. Spanish strategy on bioeconomy: Towards a knowledge based sustainable innovation. New Biotechnol. 2017, 40, 87–95. [Google Scholar] [CrossRef] [PubMed]
- Rosua, J.M.; Pasadas, M. Biomass potential in Andalusia, from grapevines, olives, fruit trees and poplar, for providing heating in homes. Renew. Sustain. Energy Rev. 2012, 16, 4190–4195. [Google Scholar] [CrossRef]
- Hernández Díaz-Ambrona, C.G.; Sanchez, F. The quantification of no-food biomass production to obtain energy in Spain. Inf. Tecnica Econ. Agragria 2011, 107, 209–225. [Google Scholar]
- Manzanares, P.; Ballesteros, I.; Negro, M.; Gonzalez, A.; Oliva, J.M.; Ballesteros, M. Processing of extracted olive oil pomace residue by hydrothermal or dilute acid pretreatment and enzymatic hydrolysis in a biorefinery context. Renew. Energy 2020, 145, 1235–1245. [Google Scholar] [CrossRef]
- Sustainable Energy Authority of Ireland. Bioenergy Supply in Ireland 2015–2035; Sustainable Energy Authority of Ireland: Dublin, Ireland, 2016. [Google Scholar]
- Heras-Saizarbitoriaa, I.; Sáezb, L.; Allura, E.; Morandeirab, J. The emergence of renewable energy cooperatives in Spain: A review. Renew. Sustain. Energy Rev. 2018, 94, 1036–1043. [Google Scholar] [CrossRef]
- Netherlands Enterprise Energy. Market Opportunities for Biomass in Spain; Netherlands Enterprise Agency: The Hague, The Netherlands, 2014.
- European Commission. Top Emerging Bio-Based Products, Their Properties and Industrial Applications; Ecologic Institute: Berlin, Germany, 2018. [Google Scholar]
- Ayeni, A.O.; Elehinafe, F.B.; Ejekwu, O.; Daramoa, M.O.; Agboola, O. Fuels and chemicals from lignocelluloses: A short overview. J. Phys. Conf. Ser. 2019, 1378, 042057. [Google Scholar] [CrossRef]
- Yang, J.; Ching, Y.C.; Chuah, C.H. Applications of lignocellulosic fibers and lignin in bioplastics: A review. Polymers 2018, 11, 751. [Google Scholar] [CrossRef] [PubMed]
- Francik, S.; Knapczyk, A.; Francik, R.; Slipek, Z. Analysis of Possible Application of Olive Pomace as Biomass Source. In Renewable Energy Sources, Engineering, Technology, Innovations, Springer Proceedings in Energy; Mudryk, K., Werle, S., Eds.; Springer International Publishing AG: Cham, Switzerland, 2018; pp. 583–592. [Google Scholar]
- Cheba, B.A. Olive waste valorization for food biotechnological applications (Mini-Review). WAS Sci. Nat. J. 2020, 1, 14–20. [Google Scholar]
- Farcas, A.C.; Socaci, S.A.; Michiu, D.; Biris, S.; Tofana, M. Tomato waste as a source of biologically active compounds. Bull. UASVM Food Sci. Technol. 2018, 76, 85–89. [Google Scholar]
- Taha, I.; Elkafafy, M.S.; Mously, H.E. Potential of utilizing tomato stalk as raw material for particleboards. Ain Shams Eng. J. 2016, 9, 1457–1464. [Google Scholar] [CrossRef]


| Ireland | Andalusia |
|---|---|
| Lignocellulose | Olive |
| Horticulture | Horticulture |
| Manure | Algae |
© 2020 by the authors. Licensee MDPI, Basel, Switzerland. This article is an open access article distributed under the terms and conditions of the Creative Commons Attribution (CC BY) license (http://creativecommons.org/licenses/by/4.0/).
Share and Cite
Attard, J.; McMahon, H.; Doody, P.; Belfrage, J.; Clark, C.; Anda Ugarte, J.; Pérez-Camacho, M.N.; Cuenca Martín, M.d.S.; Giráldez Morales, A.J.; Gaffey, J. Mapping and Analysis of Biomass Supply Chains in Andalusia and the Republic of Ireland. Sustainability 2020, 12, 4595. https://doi.org/10.3390/su12114595
Attard J, McMahon H, Doody P, Belfrage J, Clark C, Anda Ugarte J, Pérez-Camacho MN, Cuenca Martín MdS, Giráldez Morales AJ, Gaffey J. Mapping and Analysis of Biomass Supply Chains in Andalusia and the Republic of Ireland. Sustainability. 2020; 12(11):4595. https://doi.org/10.3390/su12114595
Chicago/Turabian StyleAttard, Jennifer, Helena McMahon, Pat Doody, Johan Belfrage, Catriona Clark, Judit Anda Ugarte, Maria Natividad Pérez-Camacho, María del Sol Cuenca Martín, Antonio José Giráldez Morales, and James Gaffey. 2020. "Mapping and Analysis of Biomass Supply Chains in Andalusia and the Republic of Ireland" Sustainability 12, no. 11: 4595. https://doi.org/10.3390/su12114595
APA StyleAttard, J., McMahon, H., Doody, P., Belfrage, J., Clark, C., Anda Ugarte, J., Pérez-Camacho, M. N., Cuenca Martín, M. d. S., Giráldez Morales, A. J., & Gaffey, J. (2020). Mapping and Analysis of Biomass Supply Chains in Andalusia and the Republic of Ireland. Sustainability, 12(11), 4595. https://doi.org/10.3390/su12114595