1. Introduction
We consider the concept of transparency as the information opening from the government about public resources management. In this way, transparency is negatively correlated with corruption and positively correlated with economic development [
1], and at the same time, existing published research of the relationship between budget transparency and fiscal performance, confirms the expectations that higher budget transparency is associated with smaller budget deficits and lower public debt [
2], which is also known as fiscal sustainability. Although not without challenges [
3], for a number of years governments are adopting the use of open data in the public administration, as a mechanism of transparency, making it a practice increasingly adopted by institutions of different spheres [
4,
5,
6,
7,
8,
9,
10], and being of greater citizen interest those related to the expenditure of public funds, mainly because these are financed by taxes. In fact, the open data publishing can reduce corruption by increasing accountability and strengthening democracy, allowing voters to make better informed decisions [
11].
In Chile, the National Budget Agency—Dirección de Presupuestos (DIPRES) (
https://www.dipres.gob.cl)—publishes yearly a set of countable processable XML files with the national budget description, and it publishes monthly an update of the execution in detail for each public body. The content of these files is defined by the budget law [
12] (a long and complex document with hundreds of pages), where it is detailed how the public funds are distributed during the year in Chile. The budget law, unlike other laws, is discussed annually in the National Congress, and attracts great media interest, since it determines in practice the government priorities, detailing the distribution of expenses and income that are required by the organisms and programs of the state. This complexity of government structure is transferred to budget law, what makes the legislative discussion laborious, and at the same time, makes it difficult for citizens to understand.
In this scenario, the Chilean Library of Congress (BCN) (BCN comes from Biblioteca del Congreso Nacional in Spanish) has developed a tool for making the law understandable, both for legislators and general community, publishing jointly the budget law, a visualization tool (
https://www.bcn.cl/presupuesto) and the data used for their construction as linked open data following the principles exposed by Tim Berners-Lee [
13], which are based on Resource Description Framework (RDF) [
14], the de facto standard in the semantic web.
In this way, we pretend to provide the next level of transparency for citizens, to offer a useful tool for legislators and to enable new actors such as non-governmental organizations or universities, the empowerment and reuse of public data for control or research studies. That being said, the main goal of this article is to present the technical solution for developing a tool that allows to facilitate the decision making and contributes the implementation of sustainable policies in terms of public finances. For validating our approach, in a first step, similar projects in the world are compared regarding key aspects for promoting transparency usage, then the technical solution is presented with emphasis in linked open data and user interface of the tool, next we describe and compare with previous years the scenario of usage during a political crisis period in Chile, which partially concludes with a set of budgetary reforms that affect the public purse.
2. Related Work
The chilean experience about development of tools for visualizing and to share data about the national budget is not an isolated reality. Organizations like OECD promote principles such as proactive disclosure [
15] (information must be publicly available prior to public request) that lead the way for opening government data. Indeed, in many countries have been developed tools and published data as a way for improving their transparency. Thereupon, some of the most relevant initiatives that we found, related to scientific publications, are mentioned, likewise
Table 1 shows a comparison of the reviewed experiences.
In [
16] is described a Russian project (
http://budget.lenobl.ru) about the budget of the Leningrad Government. This project publishes budgetary data in an ad-hoc Open Budget Format as well as a data visualization for a more comprehensive citizen format.
The German open budget project (
https://offenerhaushalt.de) is an honorary project of the Open Knowledge Foundation Germany, which describes in detail how much money the state spends on what. This project delivers a treemap based graphic representation of the budget for each federal government, as well as the data used in open formats.
The government of Mexico has developed a portal about budgetary transparency (
https://www.transparenciapresupuestaria.gob.mx) where they published a set of informative multimedia documents, in addition to a budget visualization and access to budget open data.
The USA Spending portal (
https://usaspending.gov) tracks federal spending to ensure taxpayers can see how their money is being used in communities across America, using mainly a treemap chart. All the data visualized are published as open data and also as SQL dump archives, with information since 2001 to date.
Finally, the Uruguay government has published a visualization of the national budget (
https://datos.hacienda.gov.py/visualizacion/presupuesto) as part of their national open data portal. This portal offers a complete high level description of the budget execution. Additionally, this portal offers an API for data consume.
3. Working with Data
3.1. Open Data Consume
The Chilean Budget Office (called DIPRES (DIPRES comes from Dirección de Presupuestos in Spanish)) publishes monthly in open data formats (XML, PDF and XLS) a set of reports that describe both the allocation of funds by the government and their execution reported by all state institutions. To achieve this, the public administration offices must report monthly to DIPRES about the state and use of these funds, which is specified in the instructions for application of the budget law of each year [
21].
In this context, for developing this visualization tool, BCN has implemented two data harvesting processes associated with the information that DIPRES publishes:
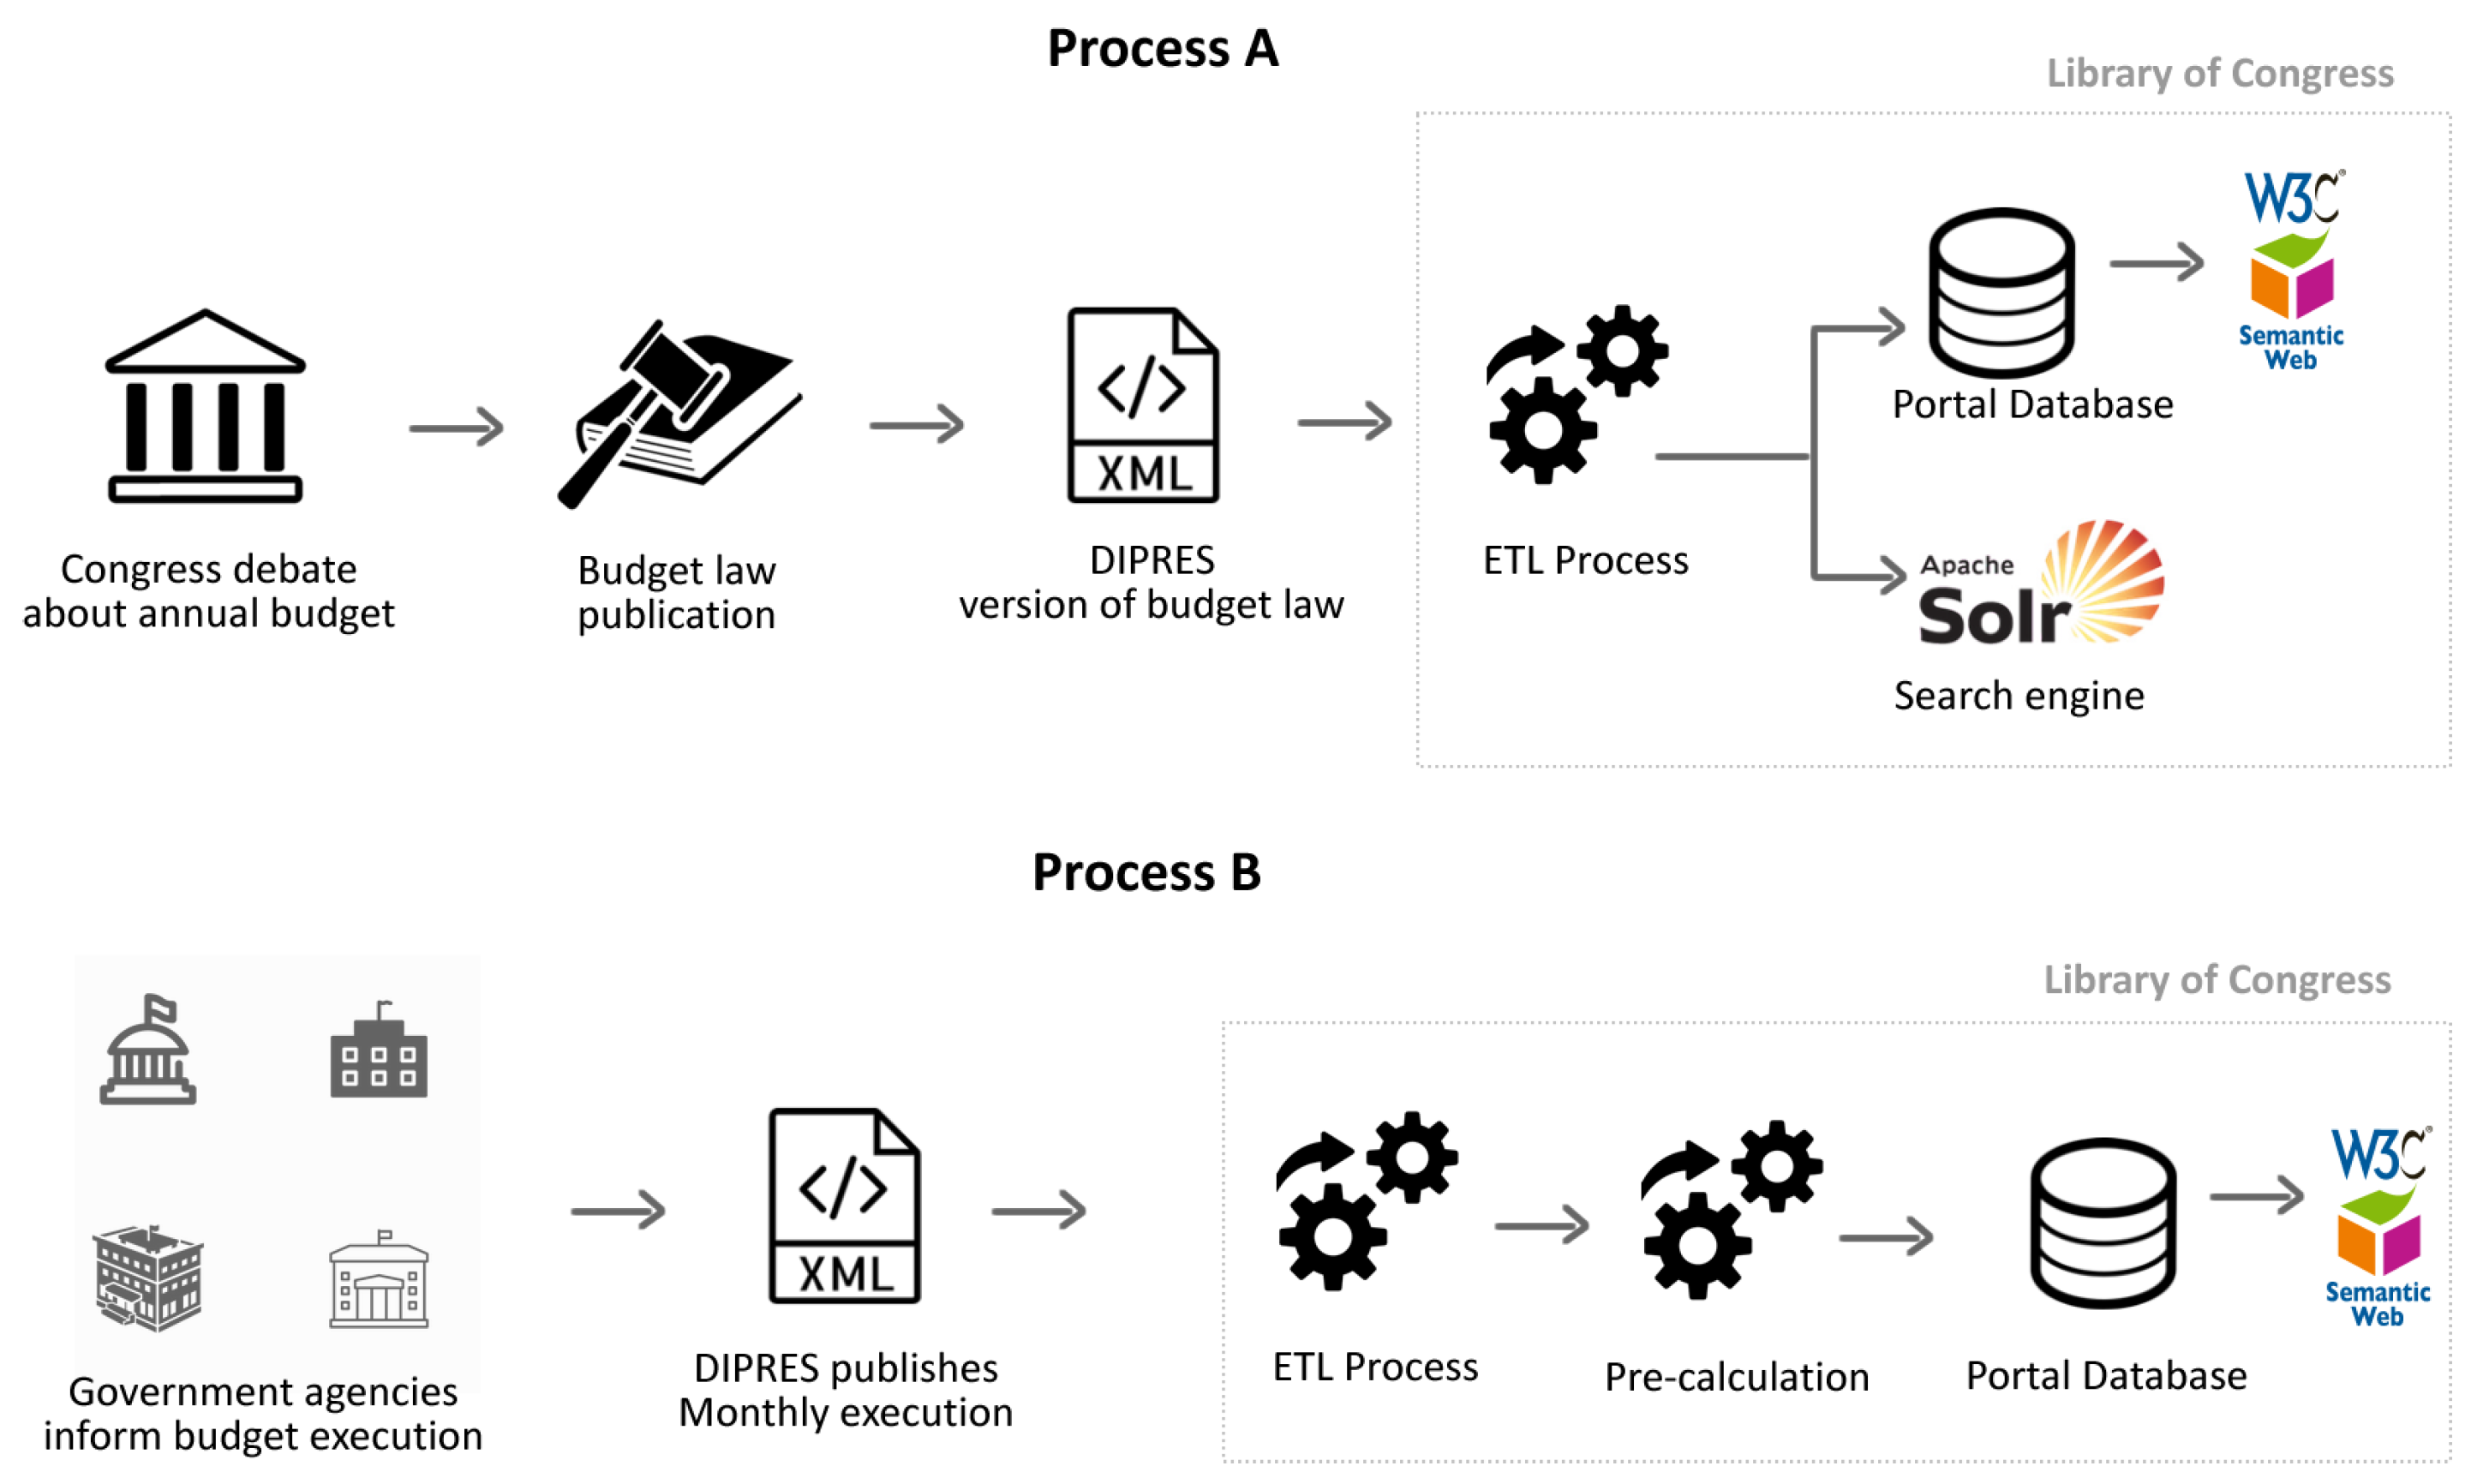
3.1.1. Annual Budget Data Load
This process works on-demand just once a year, when the bill of national budget is approved and published as a law. The DIPRES publishes an XML file with the amount allocated to each constituent element of the national budget (almost always equivalent to government agencies), which are loaded together with the instructional descriptions and metadata associated to each of them, both in a system database, as well as in a search engine for text searching (Apache Solr (
https://lucene.apache.org/solr)). The Process A in
Figure 1 is a representation of this workflow.
In the diagram, ETL includes among others, text string normalization from XML, a budget entity identification and the calculation process of deflation or inflation of amounts for each year and for each budget entity, allowing the comparison of values in real or nominal terms.
3.1.2. Monthly Execution Load
Process B in
Figure 1 shows the general idea behind an automated loading process that searches and collects new budget information from the DIPRES website. This process, implemented according to the current structure of the published XML files, loads this data into a relational database called the pre-calculation database, where parsed data is validated about their consistency. Subsequently, a new process verifies, validates and transforms the data from the pre-calculation database to a new database with a query-oriented model.
Both the annual budget data and the monthly execution data, are the main supplies for development of the visualization tool (which we will detail further), and the linked open data set that gives life to the RDF Budget Knowledge Graph (BKG).
3.2. Linked Open Data Publishing
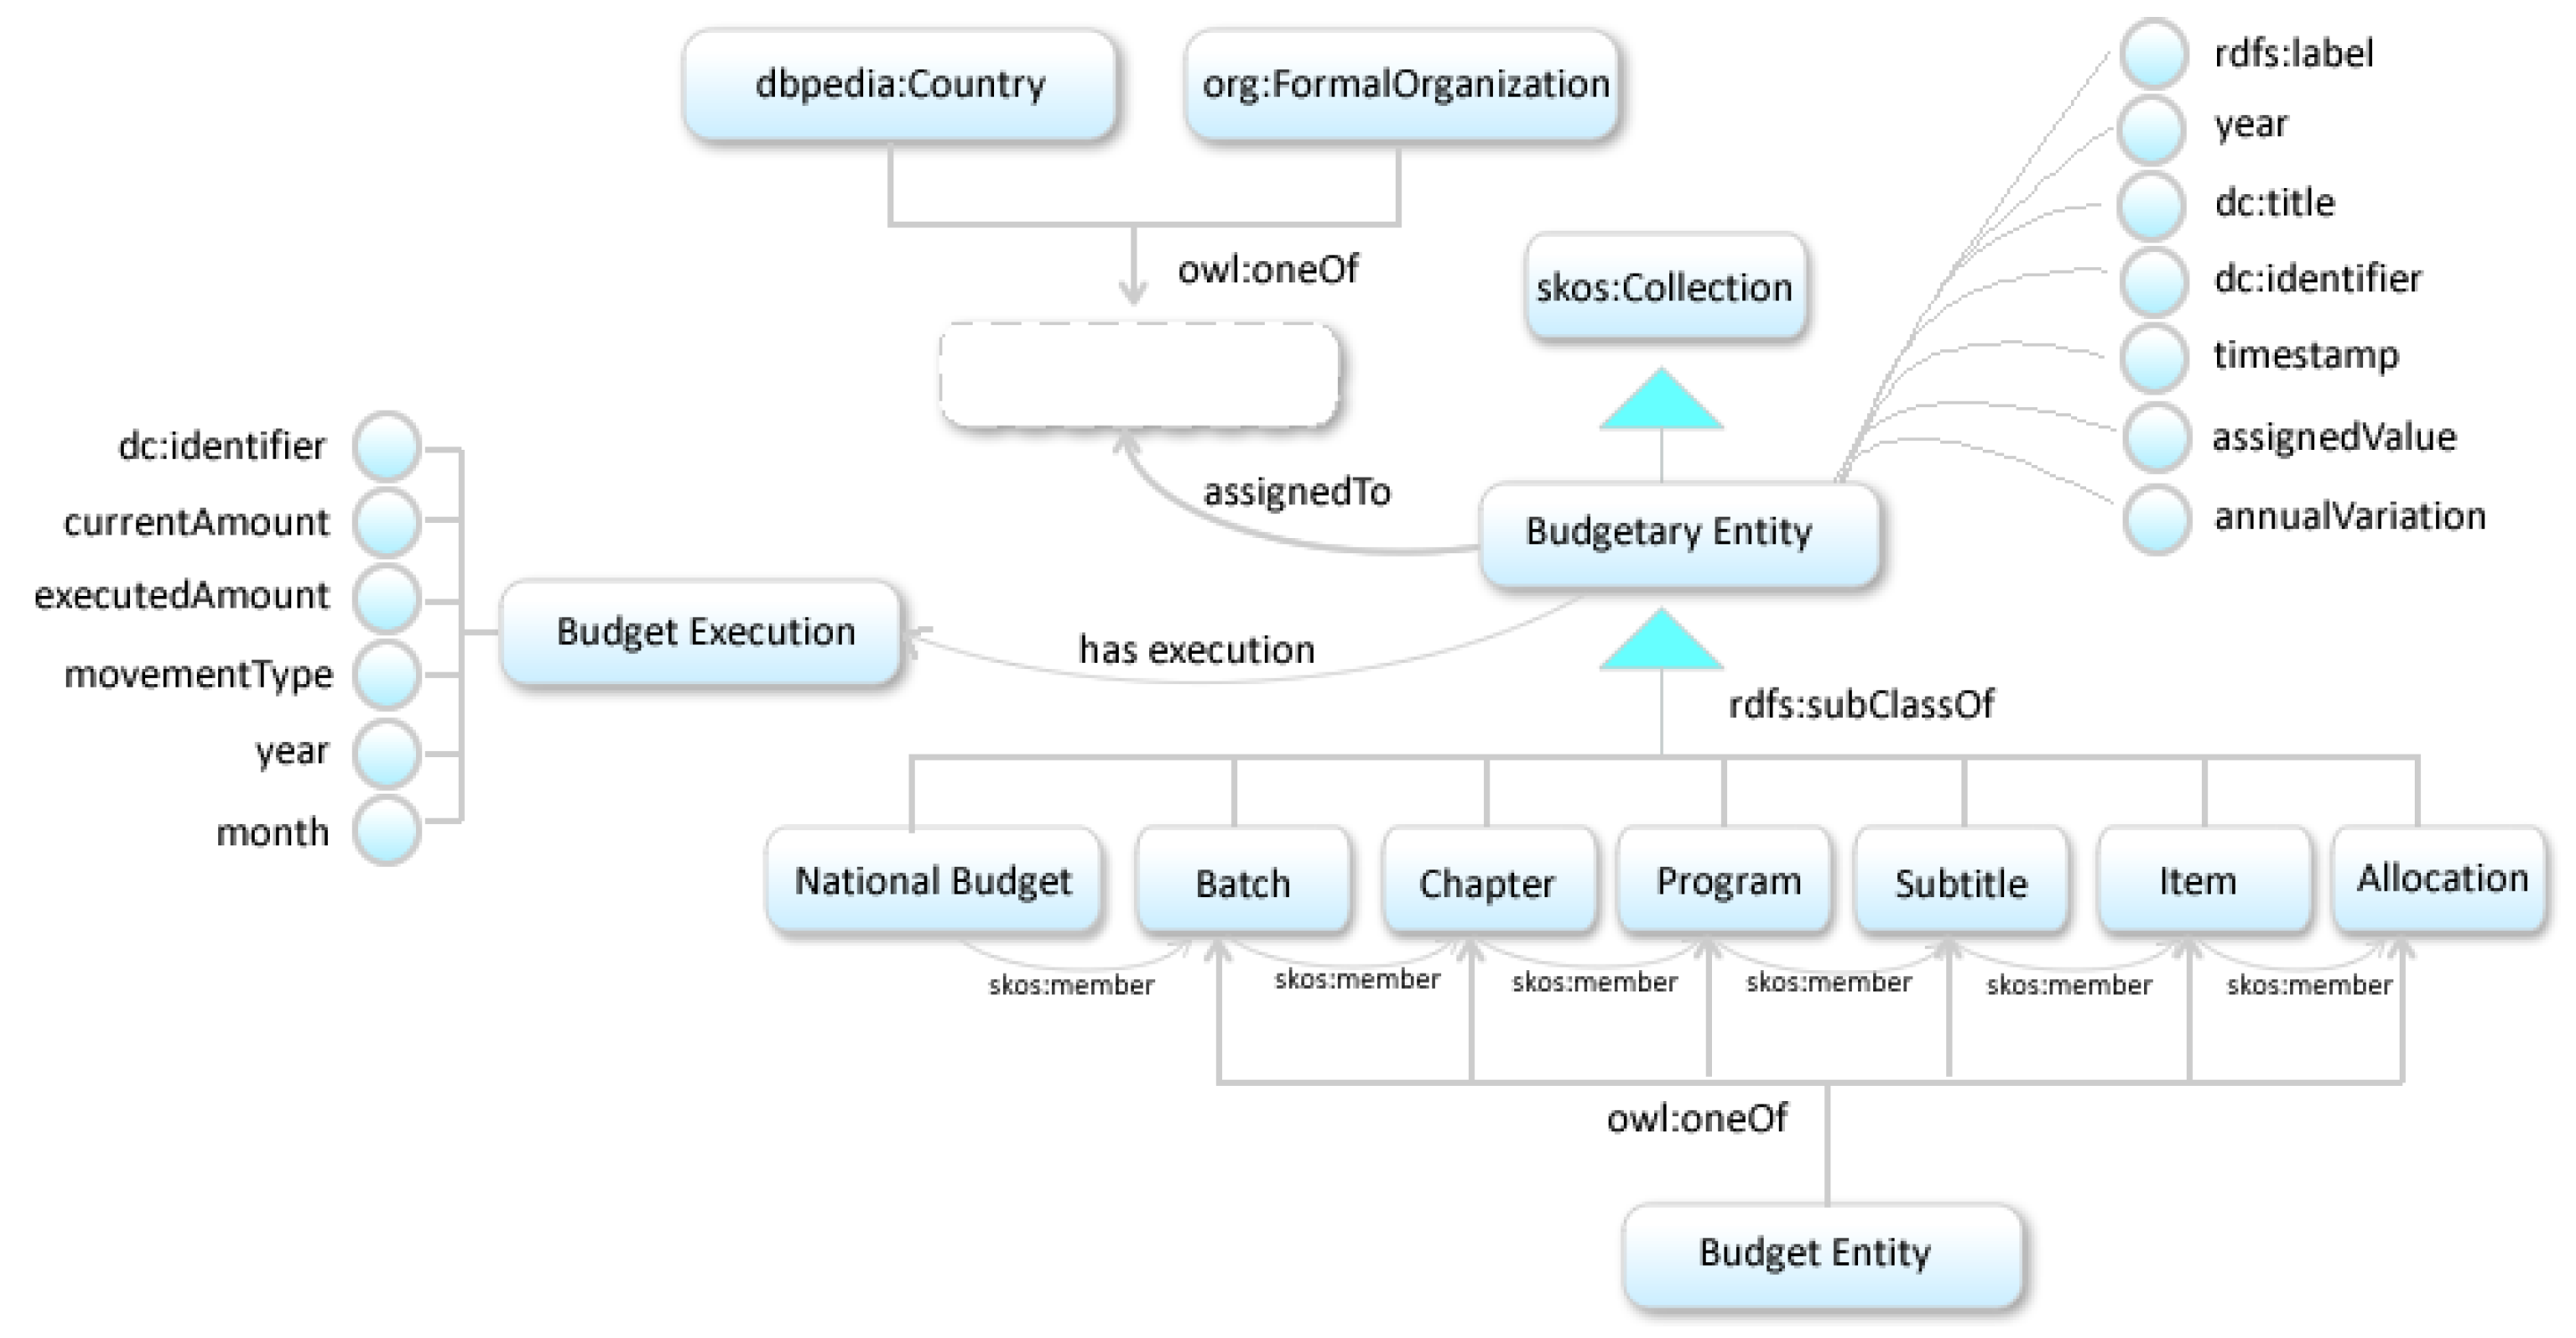
3.2.1. National Budget Ontology
In structural terms, the budget law has a hierarchical composition in seven main levels. The first level explain in an aggregated form the national budget, the next three coincide largely with state agencies that use public funds, and the next three describe the internal composition of budget within an organization. Each of the elements presented in each level has an associated number defined in the law, for instance Chapter 09 for the Education Ministry.
In this way, the data model is composed by two main types of RDF classes: metamodel classes, such as Budget Execution, Budgetary Entity and Budget Entity, which model common behavior for domain business classes and are useful for describing domains and ranges in RDF properties; and domain business classes such as National Budget, Batch, Chapter, Program, Subtitle, Item and Allocation, which can give meaning to data, and to establish constraints such as the usage of owl:oneOf declaration.
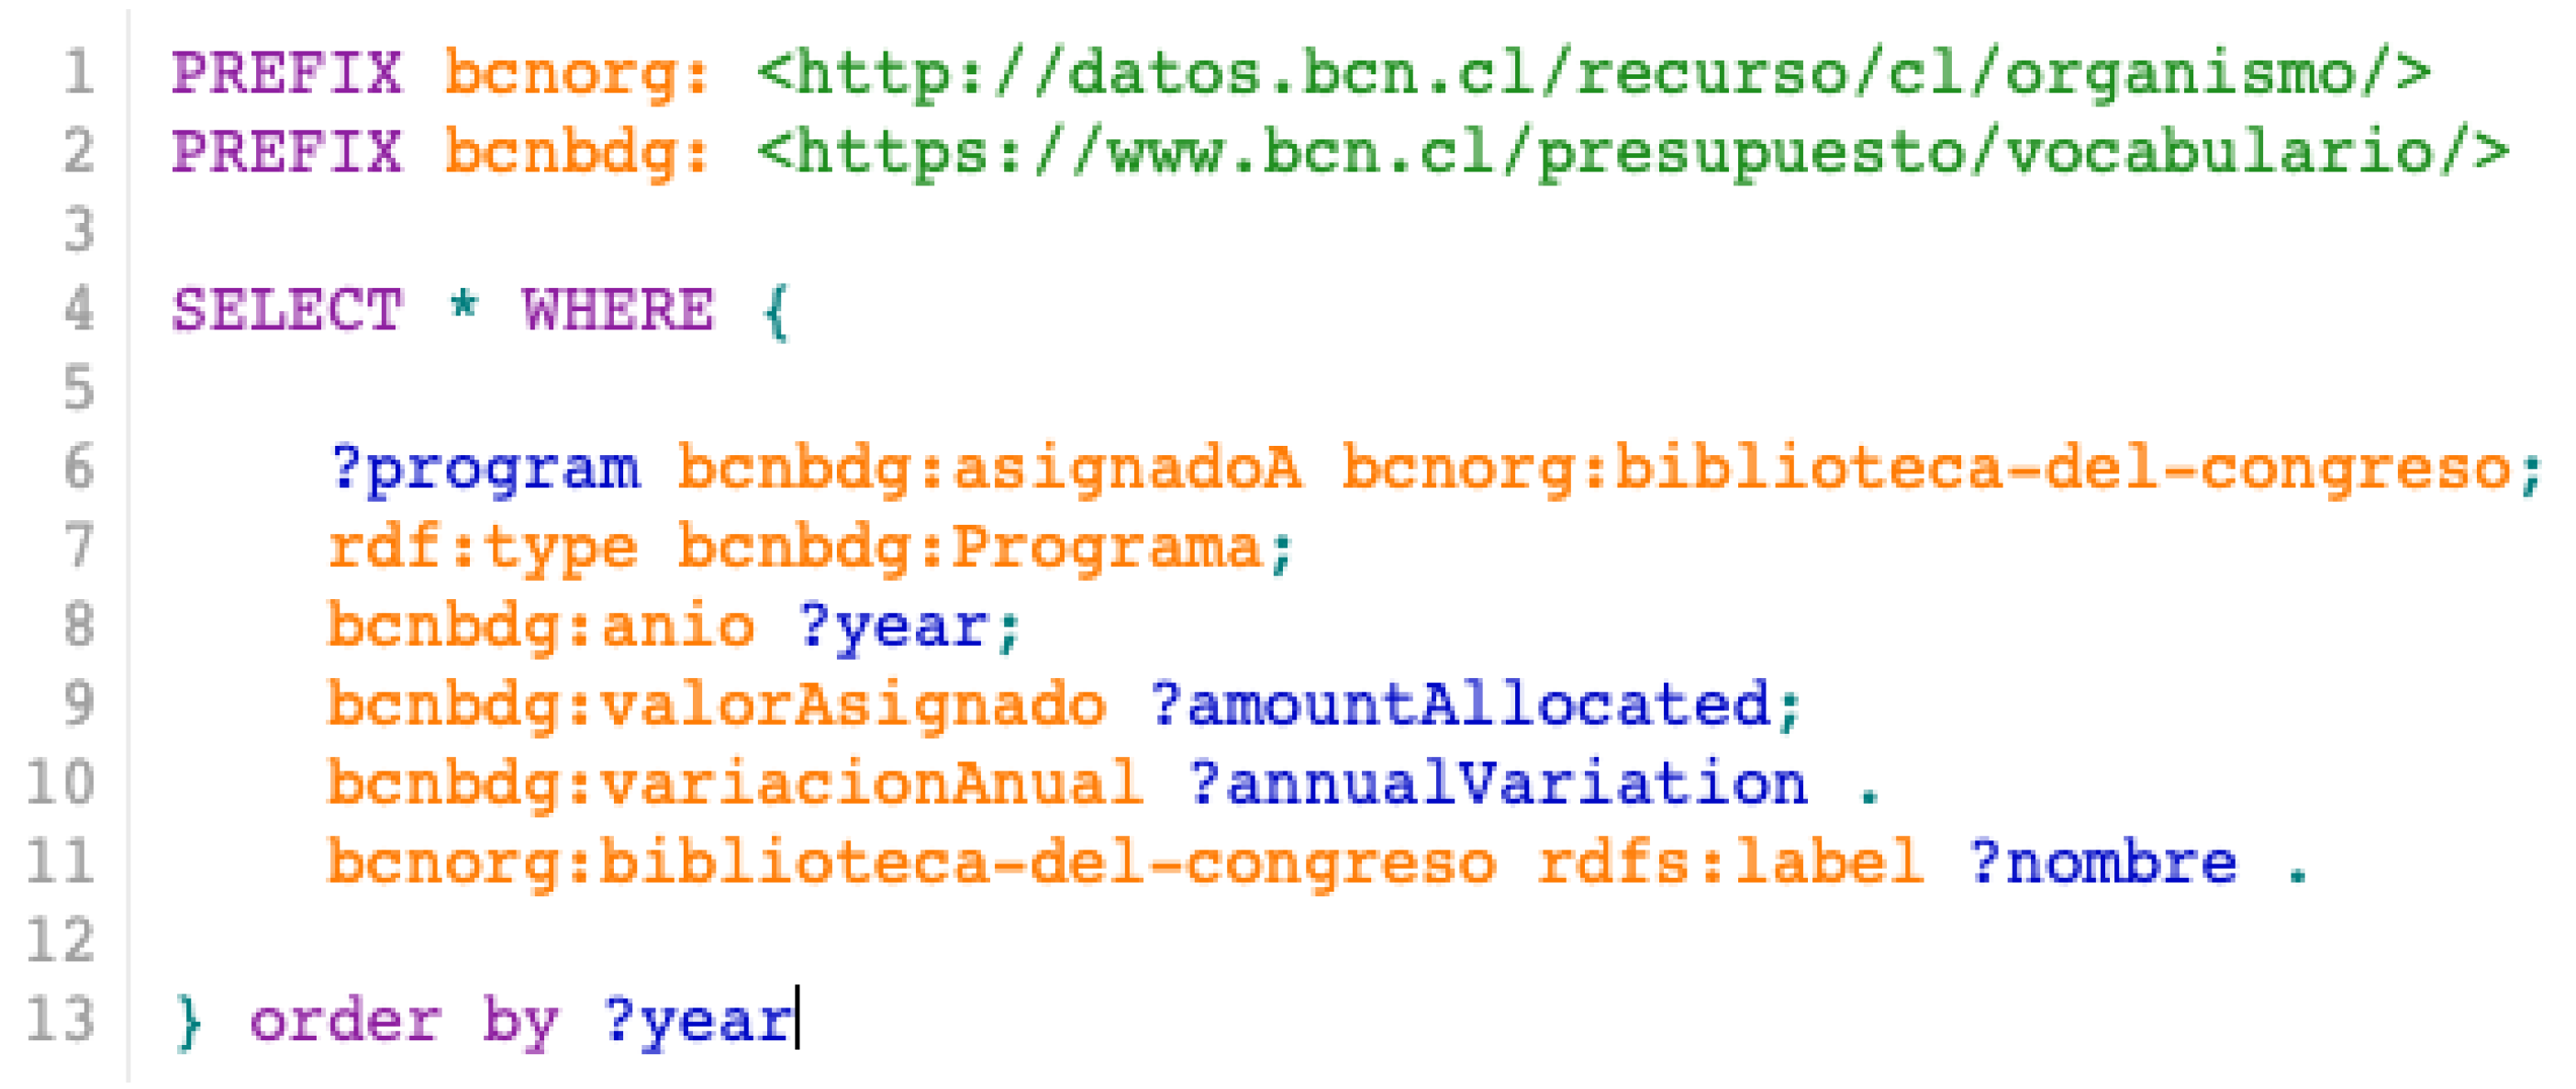
3.2.2. Linked Dataset Description
The content of the dataset is updated monthly according to budget execution, and can be consumed via the SPARQL (
http://datos.bcn.cl/sparql) endpoint, by content negotiation in other formats or through the monthly dumps available on the website (
https://www.bcn.cl/presupuesto/api). An example of SPARQL query is described in
Figure 3, which shows the historical budget of the Library of Congress of Chile published as RDF.
Analyzing the form of the BKG per year, we can verify that it is similar to a dependencies network. That is because the structure of the budget law is hierarchical, and the elements of higher levels contain elements of lower level. However, it is not a pure dependency network since the organisms that are referenced from the budget entities also belong to other graphs in the general BKG. At the same time, this network of dependencies can be divided into as many graphs as budget years exist in the BKG. According to the hierarchical nature of the budget entities, the URI scheme used is also hierarchical and based on the identifiers defined in the budget law for each of the parties.
3.2.3. RDF Shape Expressions
Another relevant component belonging to the Semantic Web stack was the implementation of RDF shape expressions (ShEx) for the dataset.
Shape expressions provide a set of conditions for validating RDF data, allowing the description of shape or topology of a group of nodes in the context of a specific knowledge graph, extending the expressivity of data specification and filling a validation space not covered by ontologies and vocabularies. ShEx [
26] and shapes constraint language (SHACL) [
27] are the most widely accepted proposals to define and validate knowledge graph’s topology, and although SHACL has become a W3C recommendation [
28], ShEx is being used in many different scenarios [
29,
30,
31]. Usually, when ShEx or SHACL are used, a domain expert defines the expected shapes a priori. However, for this purpose, we used a tool [
32] that extracts the latent shapes which are already existing in the graph, using the output of tool processing as validation mechanism during the development phase. The shapes are expressed using ShEx. The usage of this kind of tool over high quality knowledge graphs allows to obtain precise and accurate shapes, similar to the ones that a domain expert may have produced. At the same time, if the tool is used during the project, it enables a fast verification method of the RDF data generation, allowing an eventual early identification of noisy and low quality data.
In this study case, the total number of triples used for shape inference was 1,113,391, which represents a sample of around 17% of the total available data. With these data in RDF we have generated a shape for every RDF class of the data model with at least one instance in the knowledge graph, which currently is published in our linked open data portal (
https://datos.bcn.cl/downloads/national-budget-shapes.shex).
4. Visualizing the National Budget Law
4.1. Technical Description of the Tool
The system is built over a PostgreSQL database, which contains raw data published by DIPRES (XML files), data transformed into a relational model, the pre-calculation data and the normalized dataset for the visualization tool. Each entity that is a part of the budget law (jointly some other medatata) is indexed in an Apache Solr search engine to allow a fast response both in the live search menu as well as the facets query results. The responsive web application was built over Free/Libre and Open Source Software (FLOSS) technologies such as Apache Tomcat, Apache 2, Varnish and from the client side through JQuery, Bootstrap and charts library Highcharts (this last, the only exception under pay). Regarding the Semantic Web technologies, our implementation uses Openlink Virtuoso (
https://virtuoso.openlinksw.com/) as RDF Triplestore and an ad-hoc Linked Data Frontend called WESO-Desh (
https://code.google.com/archive/p/weso-desh/).
4.2. Data Visualization
Regarding the visualization, the content structure of each page follows the idea of developing a story explaining the used data [
33], allowing on one side to perform exploratory knowledge discovery using the follow your nose idea, but at the same time enabling the search tool, never losing focus in the Visual Information-Seeking Mantra [
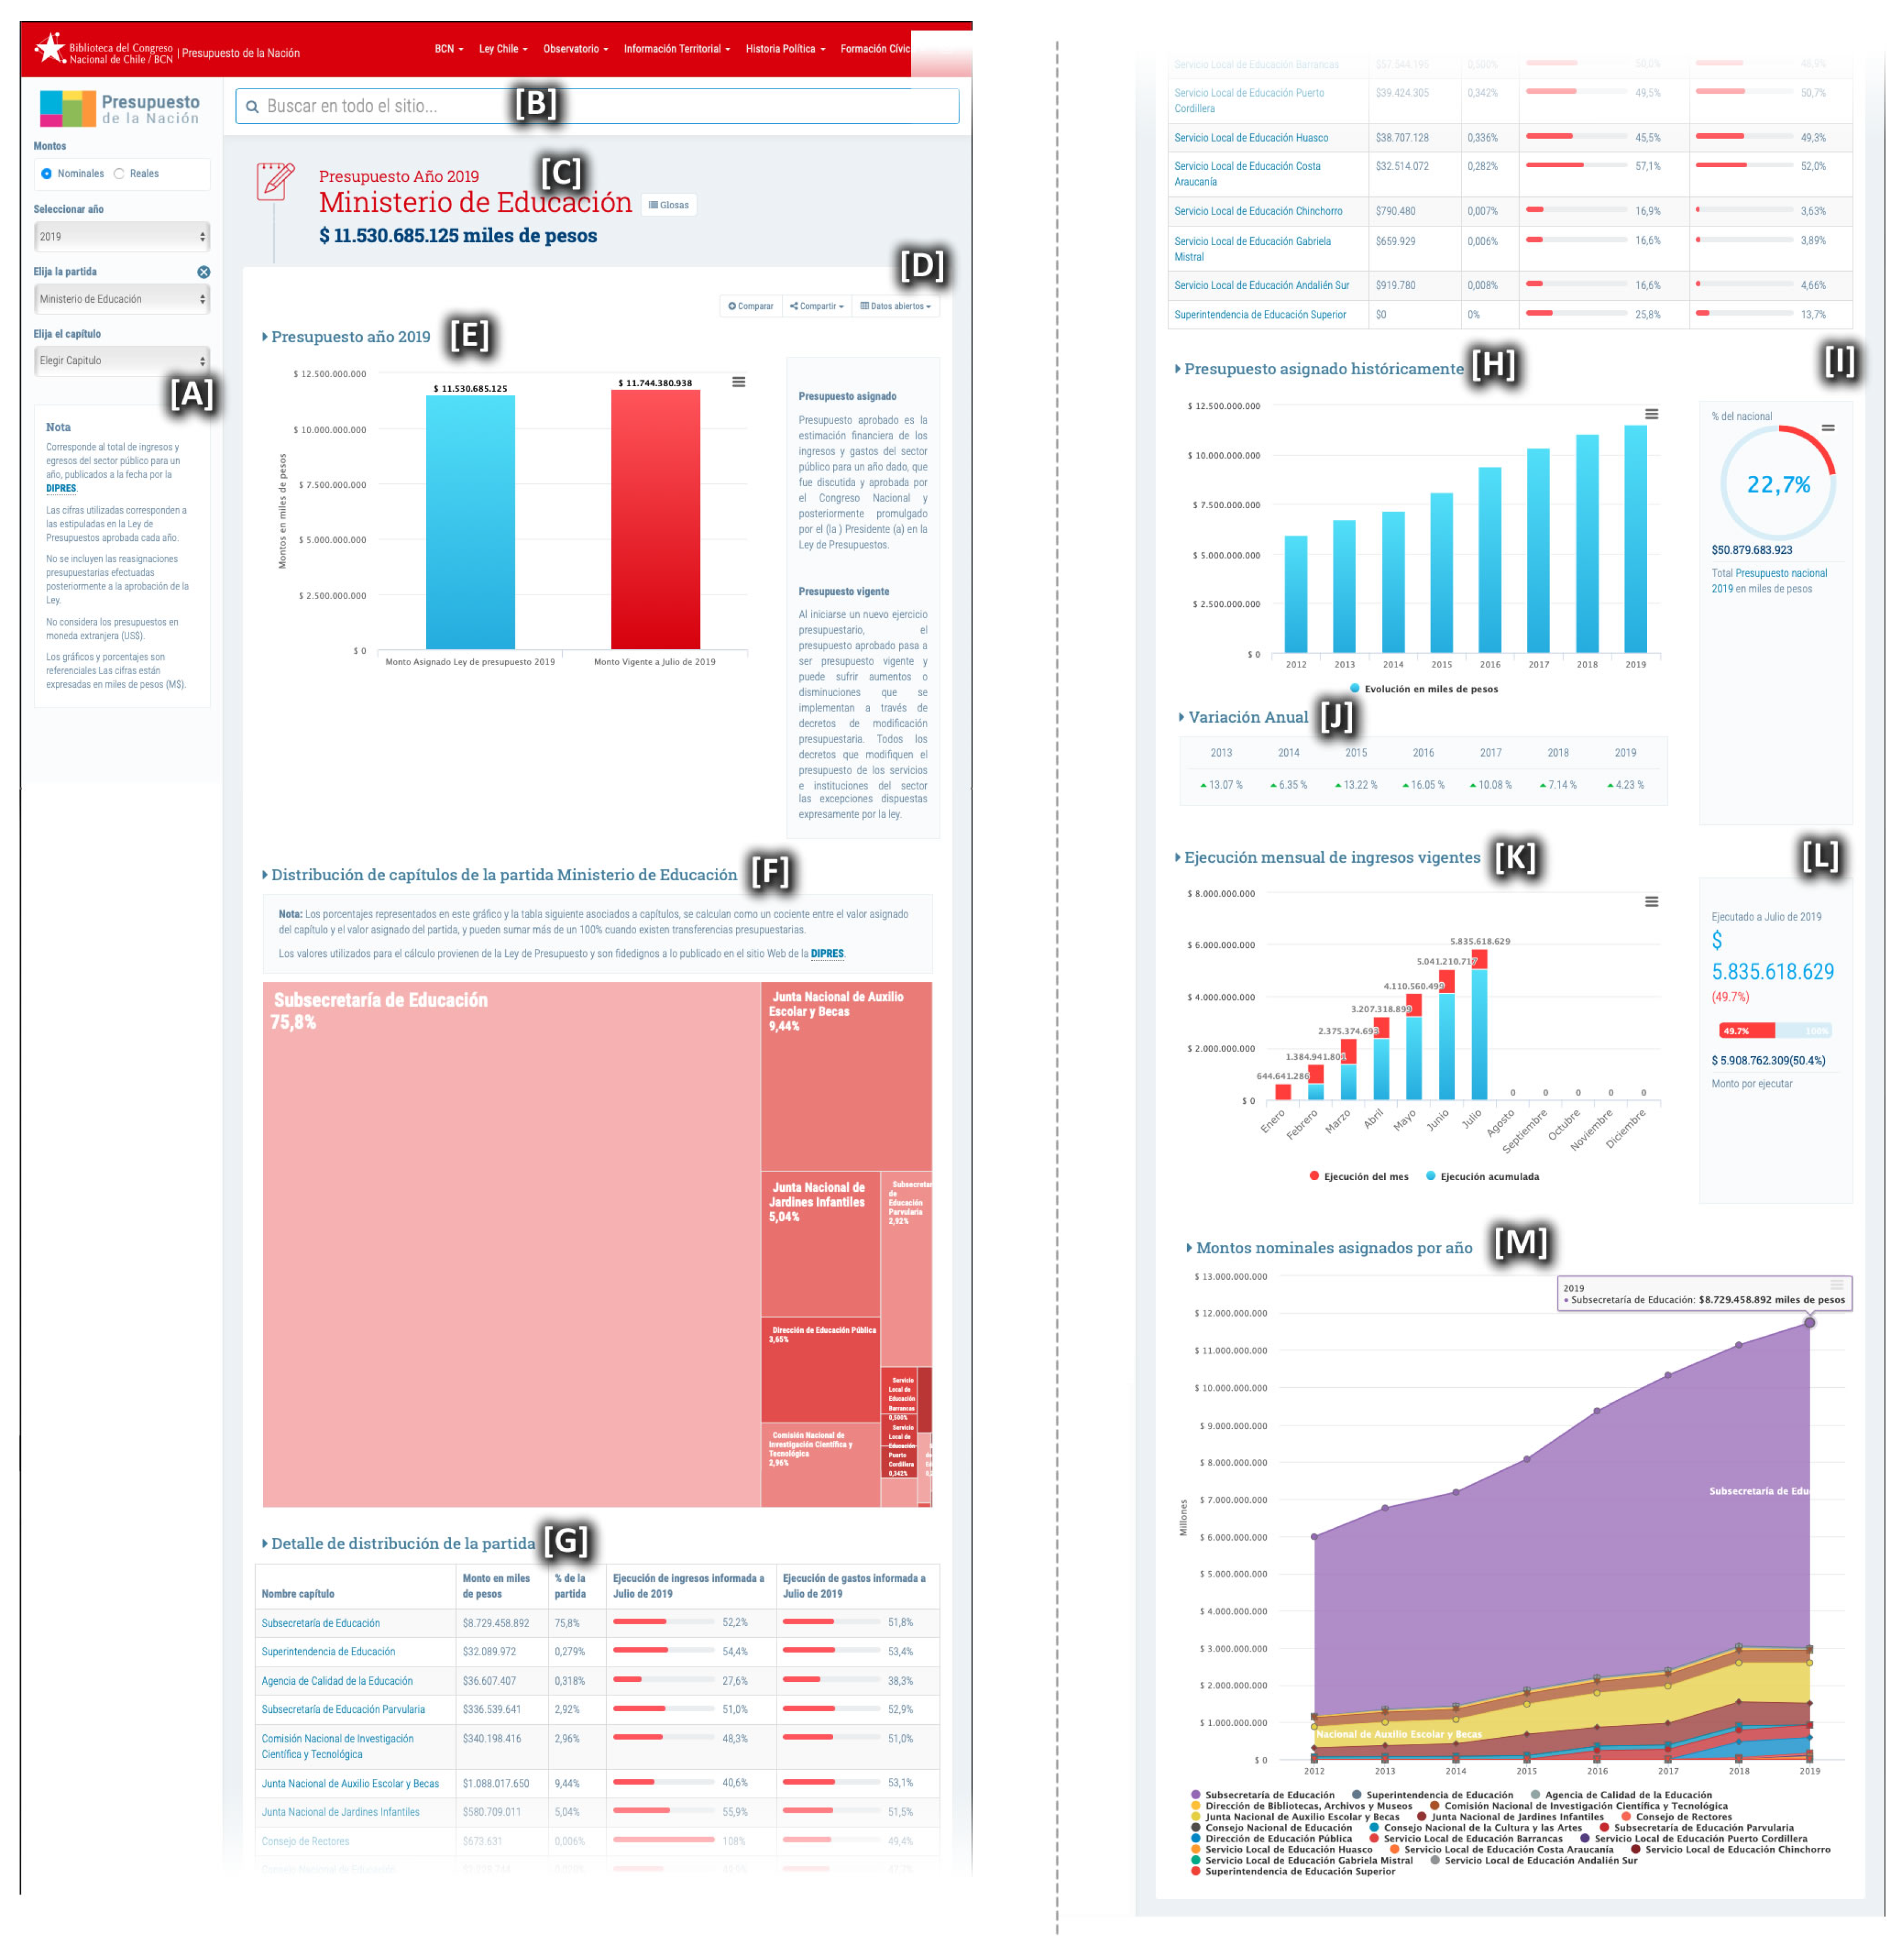
34] Overview first, zoom and filter, then details on demand. Taking into account that the graphic representation directly impacts the perception and understanding of the user, a composition of conventional and widely known graphics were used (such as bars, line, pie, etc.) to display the different dimensions of the budget that are being explored. Thus, the visualization currently consists of five main elements, which will be detailed using the batch
Education Ministry 2019 print in the
Figure 4 and is available online (
https://www.bcn.cl/presupuesto/periodo/2019/partida/09). Along the following subsections we will reference visual elements in
Figure 4 labeled with capital letters (example: menu [A], textbox [B]…).
4.2.1. Navigation
The navigation is present in almost the entire tool. Indeed, although [A] is the main menu for navigation, it is possible to access any budget part just searching in the livesearch textbox [B], by means of the hierarchical breadcrumb menu [C] (lamentably not easily recognizable in the figure) or by direct links to children elements in the treemap [F] or the table [G].
4.2.2. Current Status
Out of curiosity or need, the first thing that almost always we want to know is how much is the amount awarded to a determined agency. In consequence, this is the first answer that the visualization offers to the user by mean of column chart [E], that shows the amount assigned in law and the adjusted value of the budget entity (if are necessary modifications on the fly).
4.2.3. Distribution of Funds
The next aspect delivered is how the funds are divided, and what part of the higher level elements corresponds to the amount assigned in the law. For this purpose, a table [G] with details is provided, and a treemap type chart is used [F], which divides a rectangle into multiple sub-rectangular parts associated sub-elements, where each sub-element area will be equivalent to the percentage of total amount. Additionally, donut pie charts are included [I], which show in percentage, the funds under analysis regarding to the national budget, moreover the percent of its container elements.
4.2.4. Historical Evolution
For visualizing the historical evolution of assigned amounts, three types of elements are used. First, a graph of stacked budget components of the part under analysis [M], where the years are shown on the X axis, and the cumulative amount associated with each sub-section on Y axis. The second element corresponds to a bar chart [H] that shows the amount allocated annually, which allows to compare their historical budget. Finally, a table [J] indicates the percentual variation associated with the amount regarding to the previous year, showing upwards or downwards arrows with respect to budget increases or reductions. No arrows are shown if the budget does not have any variation. In this latter case, the usage of a line chart superimposed on the bar chart was tested, with the idea that the percentage variation and the amount would be reflected in the same element. However, after testing this configuration with users, it was modified to the current one because it generated confusion.
4.2.5. Budget Execution
The budgetary execution will allow to know the state of assigned funds in the budget at a certain moment. In this context, the tool provides a stacked bar chart [K], which shows the cumulative executed funds by month, highlighting the amount reported in the month. Subsequently, it shows a progress bar [L] that presents, in summary, the percentage executed to date regarding the allocated amount.
5. Results
Regarding statistics of use, 33,774 visits were made between 1 January 2019 and 31 December 2019 according to Google Analytics with an average session time of 04:33 min and an average of 399 pages per session. These statistics do not include the usage of an internal and parliamentary version of the tool, for visualizing the draft of law (bill) and the modifications during discussion in the National Congress.
To January of 2020, 9,587,732 RDF triples have been loaded in the RDF BKG, which is described by year in
Table 2. In addition, we include an extra category, Other Triples, that contains RDF triples like the basic description of the organization linked to the budget entity. In detail, the annual data shows a sustained growth in terms of total RDF triples by year, which is correlated to an increase in the amount of the national budget moreover a bigger number of budget’s entities.
Trying to improve and boost the usage of Semantic Web technologies, we expose the results of an RDF shape inference process over the BKG published as linked open data. This term, as well as providing automatic documentation about the data model, offers a mechanism for data quality verification. Indeed, during the project development have been identified and solved, using the mentioned shape inference method, some anomalous situations like the following:
Some instances involved in shapes interlinkage did not have any type (the amount of untyped instances for each case is always lower than 2%).
About 70% of the FormalOrganization’s instances had more than one label, and a minor percentage had even many labels (the most extreme and rare cases had 39 labels).
About 23% of the nodes used to build the shape Budget Execution had more than one identifier, year, value, etc.
6. Discussion
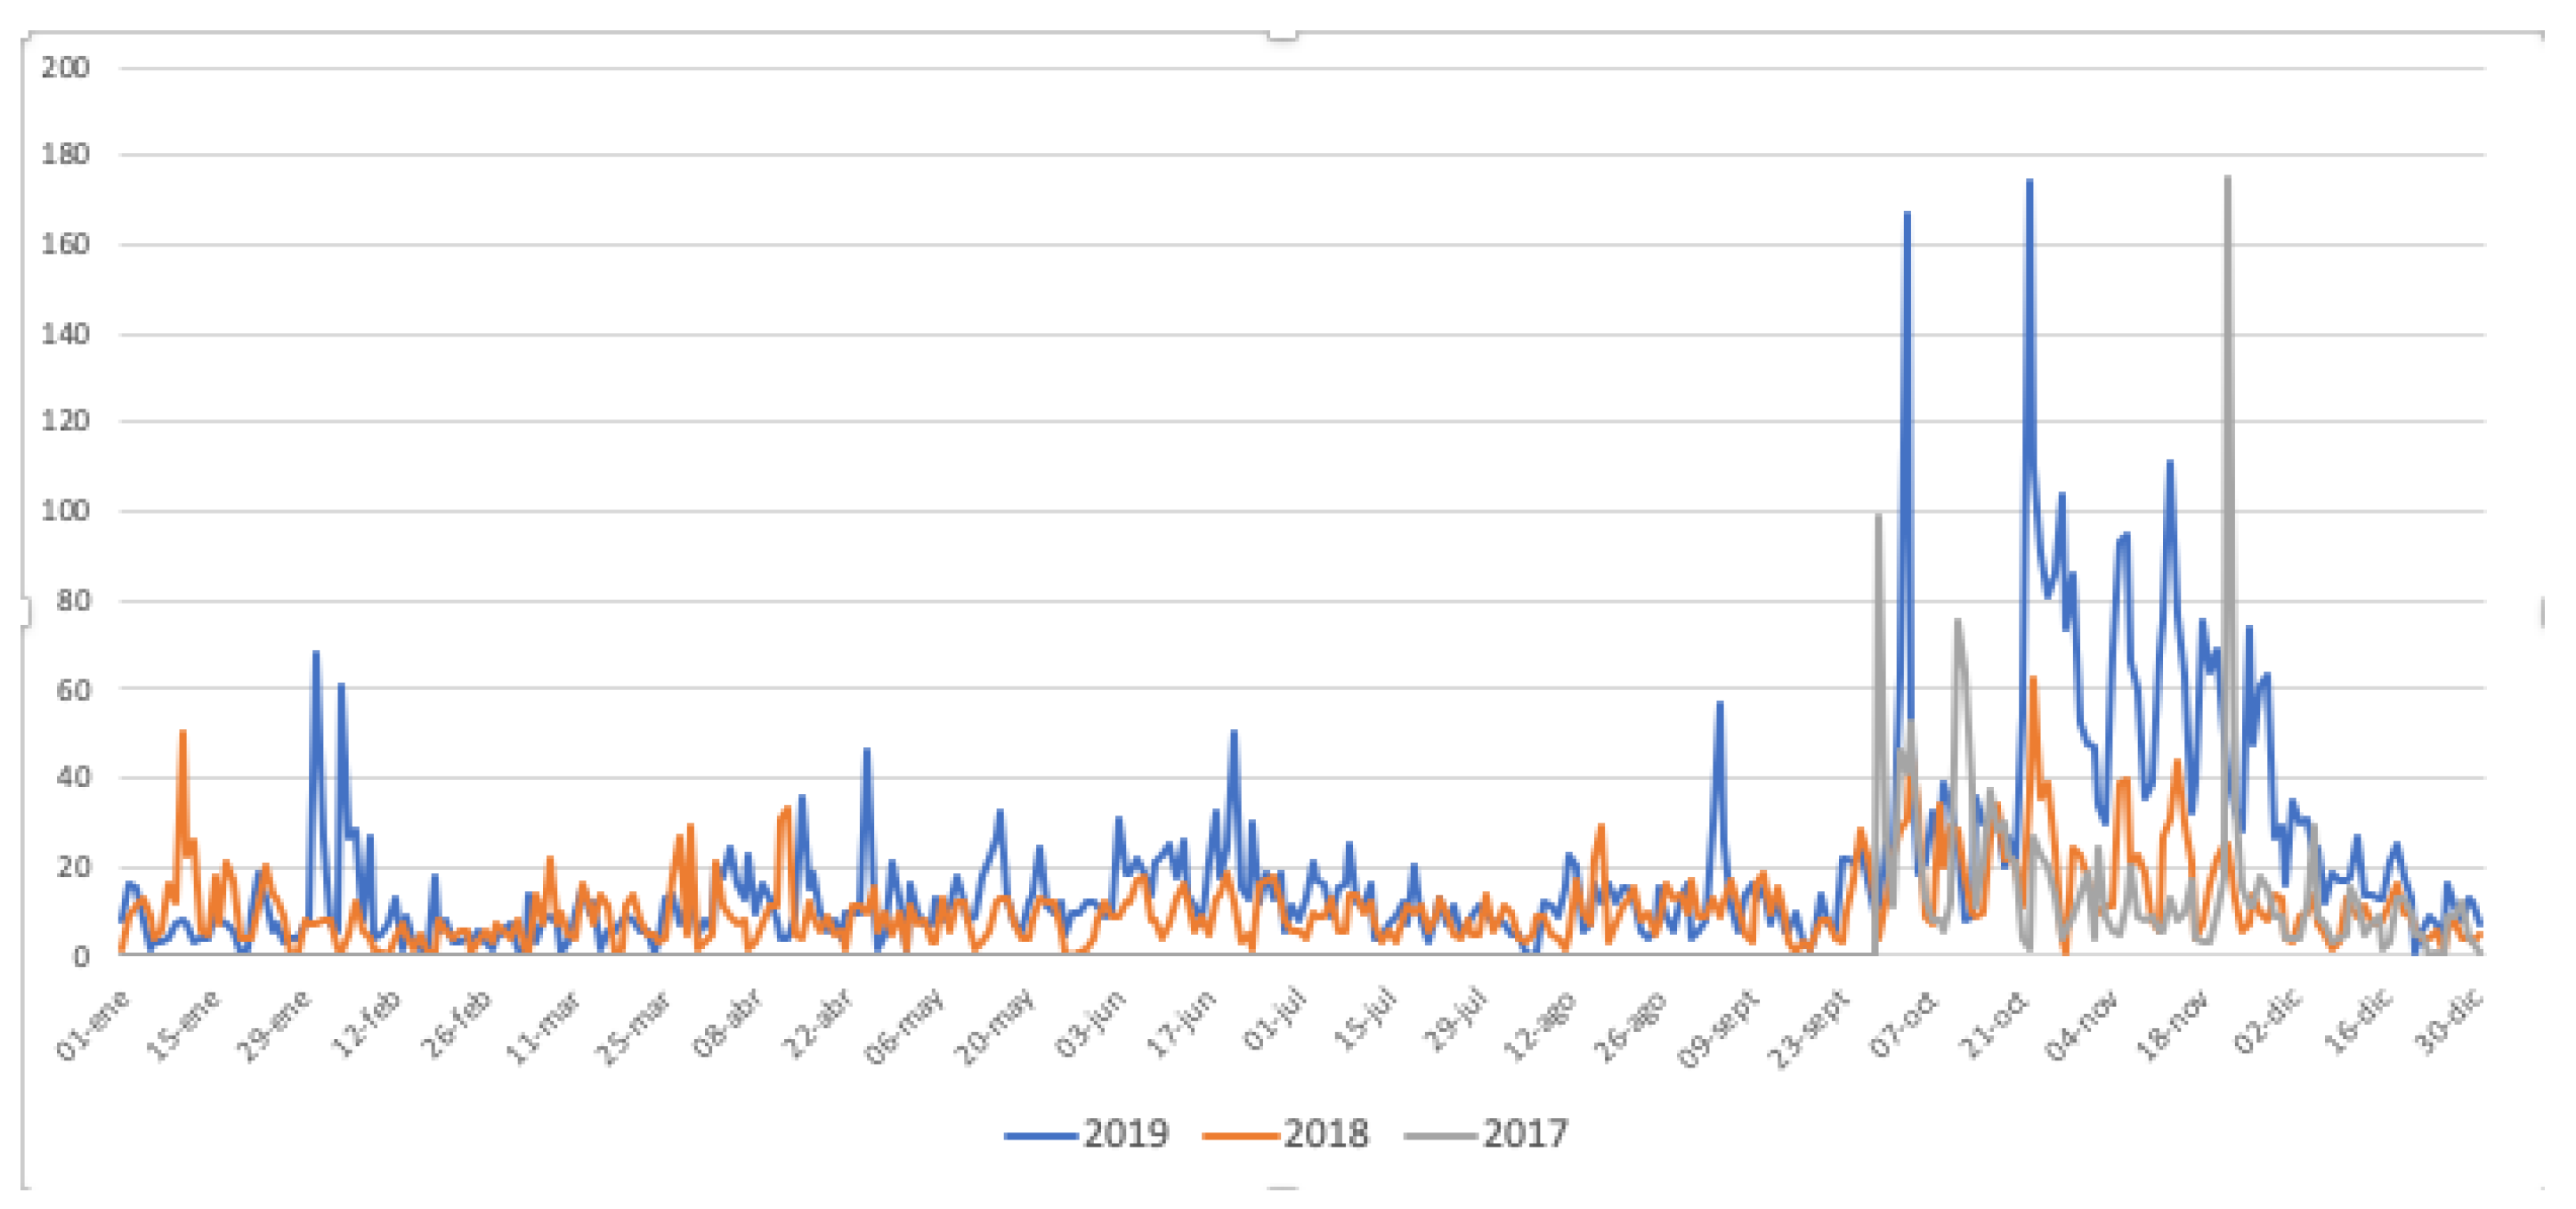
In October 2019, Chile experimented the beginning of a social outbreak (
https://en.wikipedia.org/wiki/2019-20_Chilean_protests), where a big number of people took the streets to protest given an increasing unrest, consequence of the prevalent economic model. This process, in conjunction with the riots and protests, made the Chilean society increase their awareness of issues related with political management, laws and State Administration, such as a social security reform, and improvements in health care, education and minimum wage, which supposed an agreement for the development of a new constitution between the executive power and the national congress. In agreement with this public interest, and according to the statistics gathered by Google Analytics, we can see the start of the public protests during the first two months of protests, the web portal of budget visualization presents and increase in the number of visits around 400% over the same period in the two years before, as can be seen in
Figure 5. In detail the first visits peak in early October corresponds with the start of processing for the Budget Law for 2020, which was initiated in 27 September 2019 according to the History of Law 21.192 (
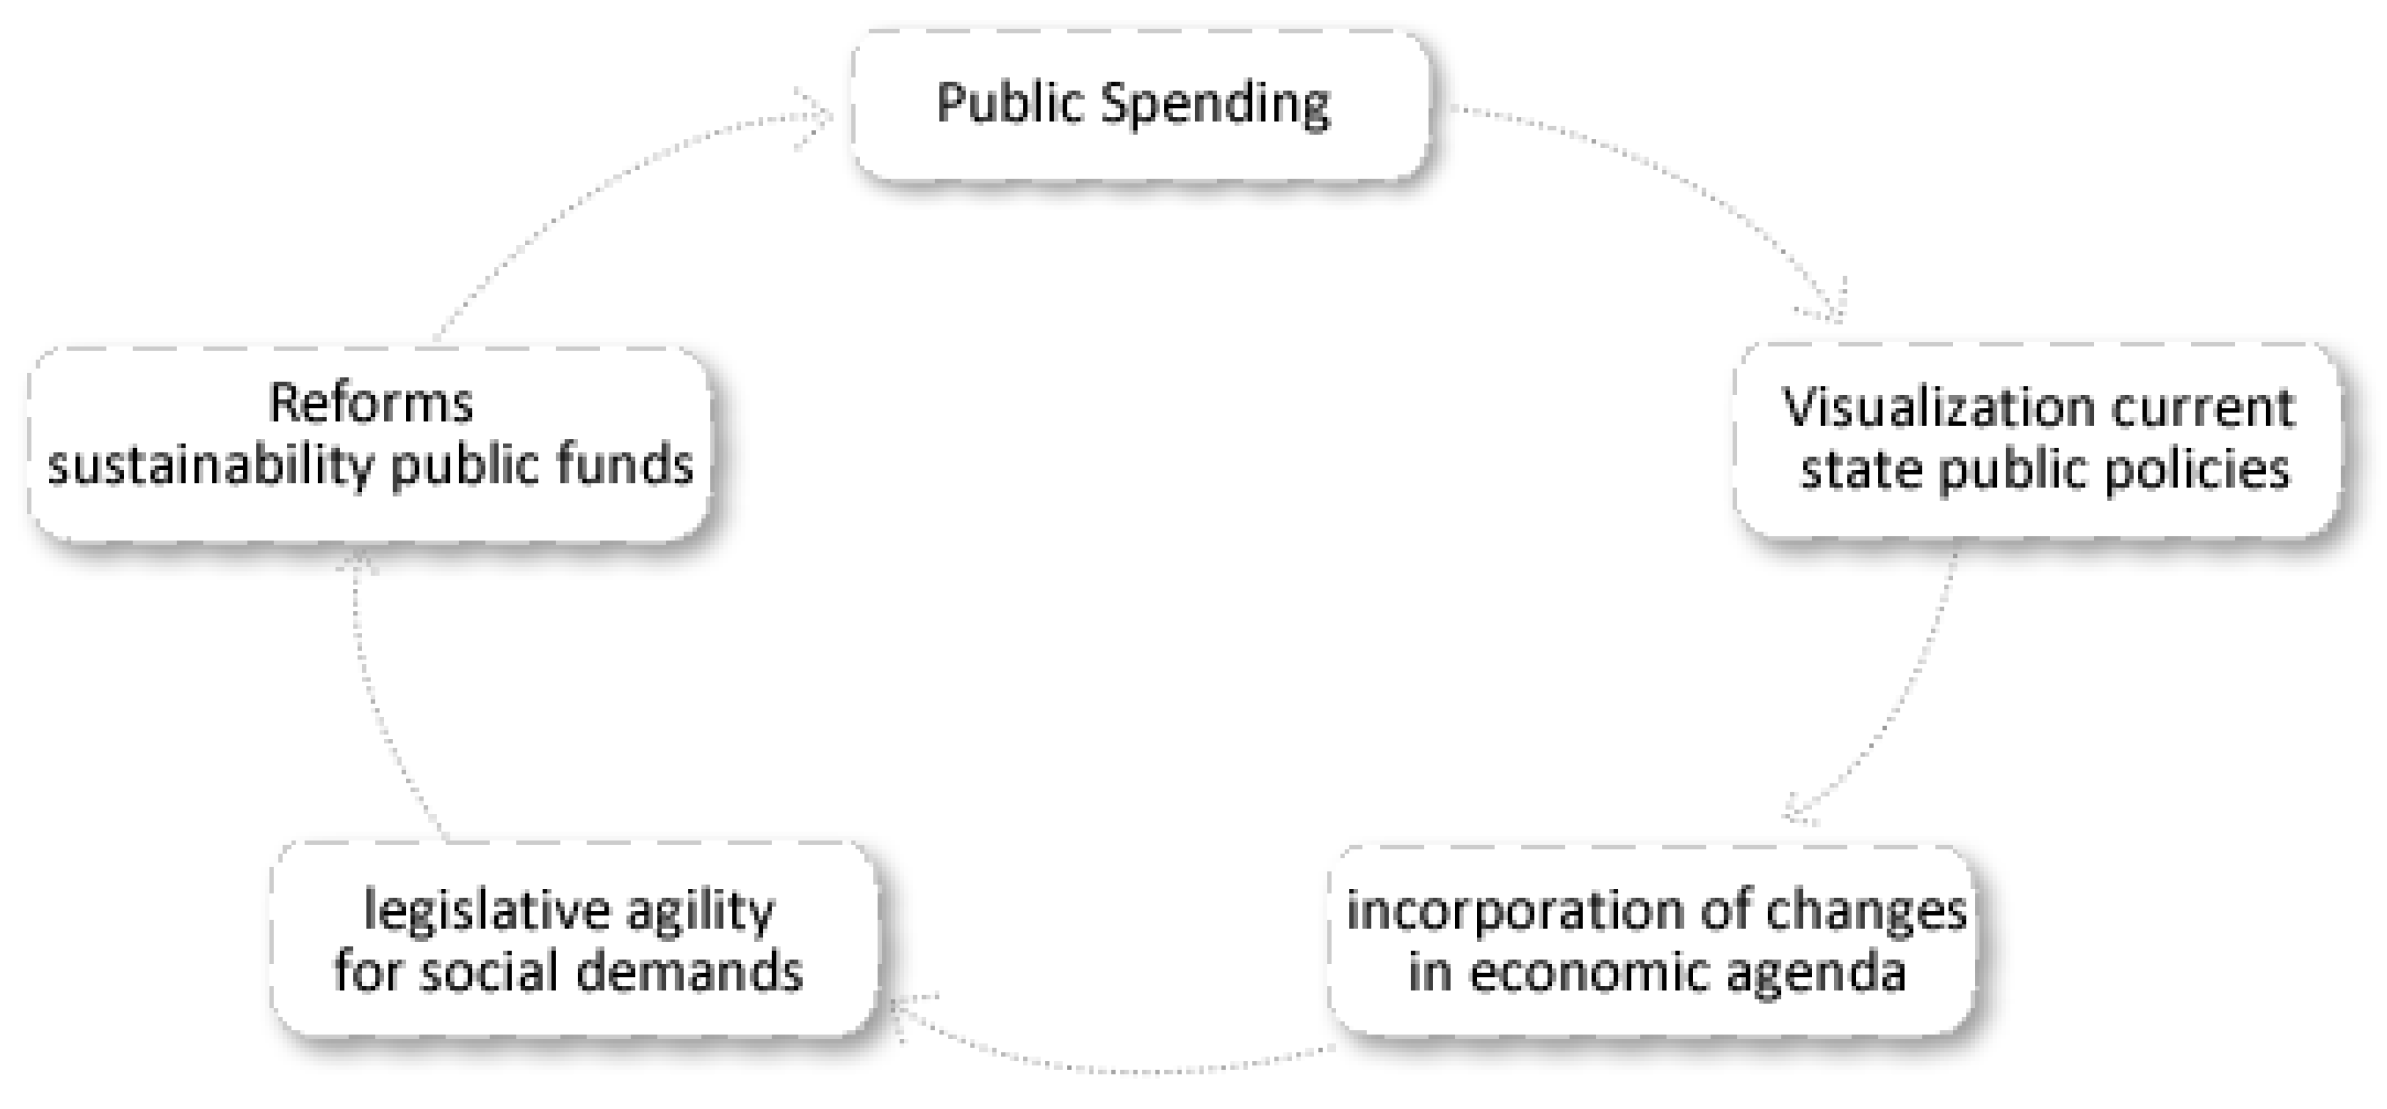
https://www.bcn.cl/historiadelaley/nc/historia-de-la-ley/7706/) and that declines once that discussion finishes at the end of November. Although it is not possible to completely establish a causal relationship between the great increase of visits to the portal with the civil protests movement and its legislative use to proceed with changes in the socio-political agenda, the numbers seem to support a thesis that enabling Budget control tools can increase the active participation by citizens in public finance. The diagram presented in
Figure 6 shows that using visualization tools, it is possible to react more quickly to support economic and political reforms, and expedite the legislative process.
7. Conclusions
This article shows a technical solution developed for presenting a budget law closer to the user, incorporating the publication of a RDF knowledge graph based on Semantic Web technologies as interoperability mechanism. In comparison with another similar projects, this approach uses a widest variety and combination of chat types, offering a most expressive data description.
Due the data harvesting process is exposed, and although it seems reasonable to consider that the automatic generation of RDF content using the original budget XML files is effective and homogeneous, it is visible that is not a guarantee of correctness in the data. Thus, the detection of mentioned anomalies and others, can be performed with the described method using ShEx inferences, proving a quality tool for similar purposes.
The transformation and availability of budget data on Semantic Web technologies within public administration, brings new possibilities for the usage of public data. For example, RDF provides support for multilingualism, which is one of its key advantages to other representation formats. Equally, the high granularity itself of the format, avoid task of transformation or extraction when it is used, or the existence of Semantic Web stack [
35], that provides a kit of solutions for software development on the Web. All these aspects are fundamental when a public body is managing the life cycle of an open dataset. Promoting sustainability open data, jointly, promotes the sustainability of science, preserving the main source for research.
In our case, consuming Open Government Data (OGD) and generating LOD let us reach some of the benefits related to publishing open data in the government, such as the creation of new governmental services for citizens, more transparency, creation of trust in government, creation of new data based on combining data or external quality checks of data (validation) [
5], and the significant impact in sciences and research that are integrative and collaborative across disciplines.
We hold that tools such as visualization and public data, published on high quality standards, are a contribution to sustainable public policies, and support to maintain the health of public finances. In this sense, according to our thesis, it is possible to respond in a faster way about economic reforms that improve the political-social scenario, and in consequence to expedite the legislative process.
Author Contributions
Conceptualization, F.C.-S.; Investigation, F.C.-S.; Project administration, F.C.-S.; Resources, D.F.-Á. and F.C.-S.; Supervision, J.E.L.-G.; Writing—original draft, F.C.-S.; Writing—review & editing, J.E.L.-G. and D.F.-Á. All authors have read and agreed to the published version of the manuscript.
Funding
We wish to thank to the Library of Congress of Chile who has funded this project. The described research activities were partially funded by the Spanish Ministry of Economy and Competitiveness (Society challenges:TIN2017-88877-R).
Acknowledgments
We wish to thank to the project’s team at the Library of Congress of Chile, in particular to Álvaro Sandoval, Fernanda Maldonado and David Manríquez.
Conflicts of Interest
The authors declare no conflict of interest.
Dataset License
License under which the data set is made available (Public Domain Mark).
References
- Bastida, F.; Benito, B. Central government budget practices and transparency: An international comparison. Public Adm. 2007, 85, 667–716. [Google Scholar] [CrossRef]
- Sedmihradská, L.; Haas, J. Budget Transparency and Fiscal Performance: Do Open Budgets Matter? Acta VŠFS 2013, 7, 109–122. [Google Scholar]
- Inkinen, T.; Helminen, R.; Saarikoski, J. Port Digitalization with Open Data: Challenges, Opportunities, and Integrations. J. Open Innov. Technol. Mark. Complex. 2019, 5, 30. [Google Scholar] [CrossRef]
- Ubaldi, B. Open Government Data. Towards Empirical Analysis of Open Government Data Initiatives. OECD 2013, 22. [Google Scholar] [CrossRef]
- Janssen, M.; Charalabidis, Y.; Zuiderwijk, A. Benefits, Adoption Barriers and Myths of Open Data and Open Government. Inf. Syst. Manag. 2012, 29, 258–268. [Google Scholar] [CrossRef]
- Fensel, A.; Akbar, Z.; Kärle, E.; Blank, C.; Pixner, P.; Gruber, A. Knowledge Graphs for Online Marketing and Sales of Touristic Services. Information 2020, 11, 253. [Google Scholar] [CrossRef]
- Escobar, P.; Roldán-García, M.d.M.; Peral, J.; Candela, G.; García-Nieto, J. An Ontology-Based Framework for Publishing and Exploiting Linked Open Data: A Use Case on Water Resources Management. Appl. Sci. 2020, 10, 779. [Google Scholar] [CrossRef]
- Di Iorio, A.; Schaerf, M. Expressing the Tacit Knowledge of a Digital Library System as Linked Data. Computers 2019, 8, 49. [Google Scholar] [CrossRef]
- Bulai, V.C.; Horobeț, A.; Belascu, L. Improving Local Governments’ Financial Sustainability by Using Open Government Data: An Application of High-Granularity Estimates of Personal Income Levels in Romania. Sustainability 2019, 11, 5632. [Google Scholar] [CrossRef]
- Attard, J.; Orlandi, F.; Scerri, S.; Auer, S. A Systematic Review of Open Government Data Initiatives. Gov. Inf. Q. 2015, 32. [Google Scholar] [CrossRef]
- Höffner, K.; Martin, M.; Lehmann, J. LinkedSpending: Openspending becomes linked open data. Semant. Web 2016, 7, 95–104. [Google Scholar] [CrossRef]
- República de Chile. Ley de Presupuestos del Sector Público para el año 2018. Leychile.cl-Biblioteca del Congreso Nacional. 2017. Available online: https://www.leychile.cl/navegar?idNorma=1112915 (accessed on 1 June 2020).
- Berners-Lee, T. Linked Data-Design Issues. Available online: http://www.w3.org/DesignIssues/LinkedData.html (accessed on 1 June 2020).
- World Wide Web Consortium. RDF 1.1 Concepts and Abstract Syntax; World Wide Web Consortium: Cambridge, MA, USA, 2014. [Google Scholar]
- OECD. Government at a Glance 2011; OECD: Paris, France, 2011; p. 268. [Google Scholar] [CrossRef]
- Vlasov, V.; Parkhimovich, O. Development of the open budget format. In Proceedings of the 16th Conference of Open Innovations Association FRUCT, Oulu, Finland, 27–31 October 2014; pp. 129–136. [Google Scholar] [CrossRef]
- Abdullah, N.A.S.; Ab Wahid, N.W.; Idrus, Z. Budget visual: Malaysia budget visualization. In Proceedings of the International Conference on Soft Computing in Data Science, Yogyakarta, Indonesia, 27–28 November 2017; pp. 209–218. [Google Scholar]
- Abdullah, N.A.S.; Zulkeply, N.; Idrus, Z. Malaysian Budget Visualization Using Circle Packing. In Soft Computing in Data Science; Berry, M.W., Yap, B.W., Mohamed, A., Köppen, M., Eds.; Springer: Singapore, 2019; pp. 81–90. [Google Scholar]
- Musyaffa, F.A.; Halilaj, L.; Li, Y.; Orlandi, F.; Jabeen, H.; Auer, S.; Vidal, M.E. Openbudgets. eu: A platform for semantically representing and analyzing open fiscal data. In Proceedings of the International Conference on Web Engineering, Cáceres, Spain, 5–8 June 2018; pp. 433–447. [Google Scholar]
- Cifuentes-Silva, F.; Labra Gayo, J.E. Legislative Document Content Extraction Based on Semantic Web Technologies. In The Semantic Web; Hitzler, P., Fernández, M., Janowicz, K., Zaveri, A., Gray, A.J., Lopez, V., Haller, A., Hammar, K., Eds.; Springer International Publishing: Cham, Switzerland, 2019; pp. 558–573. [Google Scholar]
- Dirección de Presupuestos. Instrucciones para la Ejecución de la Ley de Presupuestos del Sector Público año 2018. 2017. Available online: https://www.dipres.gob.cl/597/articles-172486_doc_pdf.pdf (accessed on 1 June 2020).
- Bechhofer, S.; Miles, A. SKOS Simple Knowledge Organization System Reference. W3C Recommendation, W3C. 2009. Available online: http://www.w3.org/TR/2009/REC-skos-reference-20090818/ (accessed on 1 June 2020).
- Guha, R.; Brickley, D. RDF Schema 1.1. W3C Recommendation, W3C. 2014. Available online: http://www.w3.org/TR/2014/REC-rdf-schema-20140225/ (accessed on 1 June 2020).
- Baker, T. A grammar of Dublin Core. D-Lib Mag. 2000, 6, 3. [Google Scholar] [CrossRef]
- OWL 2 Web Ontology Language Document Overview (Second Edition). W3C Recommendation, W3C. 2012. Available online: http://www.w3.org/TR/2012/REC-owl2-overview-20121211/ (accessed on 1 June 2020).
- Prud’hommeaux, E.; Labra Gayo, J.E.; Solbrig, H. Shape expressions: An RDF validation and transformation language. In Proceedings of the 10th International Conference on Semantic Systems, Leipzig, Germany, 4–5 September 2014; pp. 32–40. [Google Scholar]
- Knublauch, H.; TopQuadrant, Inc.; Kontokostas, D.; University of Leipzig. Shapes constraint language (SHACL). W3C Recomm. 2017, 11, 8. [Google Scholar]
- Knublauch, H.; Kontokostas, D. Shapes Constraint Language (SHACL). W3C Recommendation, W3C. 2017. Available online: https://www.w3.org/TR/2017/REC-shacl-20170720/ (accessed on 1 June 2020).
- Solbrig, H.R.; Prud’hommeaux, E.; Grieve, G.; McKenzie, L.; Mandel, J.C.; Sharma, D.K.; Jiang, G. Modeling and validating HL7 FHIR profiles using semantic web Shape Expressions (ShEx). J. Biomed. Inform. 2017, 67, 90–100. [Google Scholar] [CrossRef] [PubMed]
- Labra Gayo, J.E.; Prud’hommeaux, E.; Solbrig, H.R.; Rodríguez, J.M.Á. Validating and Describing Linked Data Portals using RDF Shape Expressions. 1st Workshop on Linked Data Quality, LDQ 2014. In Proceedings of the 10th International Conference on Semantic Systems, Leipzig, Germany, 2 September 2014. [Google Scholar]
- Thuluva, A.S.; Anicic, D.; Rudolph, S. Shaping Device Descriptions to Achieve IoT Semantic Interoperability. In Proceedings of the ESWC 2018, Crete, Greece, 3–7 June 2018. [Google Scholar]
- Fernández-Álvarez, D.; García-González, H.; Frey, J.; Hellmann, S.; Labra Gayo, J. Inference of latent shape expressions associated to dbpedia ontology. In Proceedings of the International Semantic Web Conference, Monterey, CA, USA, 8–12 October 2018. [Google Scholar]
- Segel, E.; Heer, J. Narrative Visualization: Telling Stories with Data. IEEE Trans. Vis. Comput. Graph. 2010, 16, 1139–1148. [Google Scholar] [CrossRef] [PubMed]
- Shneiderman, B. The eyes have it: A task by data type taxonomy for information visualizations. In Proceedings of the 1996 IEEE Symposium on Visual Languages, Boulder, CO, USA, 3–6 September 1996; pp. 336–343. [Google Scholar]
- Curé, O.; Blin, G. (Eds.) Chapter Three—RDF and the Semantic Web Stack. In RDF Database Systems; Morgan Kaufmann: Boston, MA, USA, 2015; pp. 41–80. [Google Scholar] [CrossRef]
© 2020 by the authors. Licensee MDPI, Basel, Switzerland. This article is an open access article distributed under the terms and conditions of the Creative Commons Attribution (CC BY) license (http://creativecommons.org/licenses/by/4.0/).


