Article

The Implementation of Climate Change Policy in Post-Soviet Countries Achieving Long-Term Targets

by
Yuliia Matiiuk
1,
Mykolas Simas Poškus
2 and
Genovaitė Liobikienė
1,*
1
Department of Environmental Sciences, Vytautas Magnus University, Vileikos st. 8, LT-44404 Kaunas, Lithuania
2
Department of Psychology, Mykolas Romeris University, Ateities st. 20, LT-08303 Vilnius, Lithuania
*
Author to whom correspondence should be addressed.
Sustainability 2020, 12(11), 4558; https://doi.org/10.3390/su12114558
Submission received: 18 May 2020 / Accepted: 25 May 2020 / Published: 3 June 2020

Abstract

:
Contribution to climate change mitigation is required for all world countries. Post-Soviet countries’ climate change policy strategies by 2030 (2035) were adopted relatively recently. Thus, the aim of this study is to analyze the achievements of climate change policy, encompassing carbon emissions, energy intensity, and renewable energy consumption, in separate Post-Soviet countries and to reveal the possibilities of reaching their long-term 2030–2035 targets. The results showed huge differences in carbon emissions, energy intensity, and the share of renewable energy consumption among Post-Soviet countries. Analyzing the trends of climate change policy implementation in almost all Post-Soviet countries (except Ukraine and Uzbekistan), carbon pollution increased during the analyzed period (2002–2014). The highest growth of emissions was observed in Georgia and Tajikistan. Furthermore, the economic development level was positively and significantly related to the level of carbon emissions. During the 2002–2014 period, energy intensity decreased in all Post-Soviet countries, particularly in those where the level was lower. The share of renewable energy consumption increased the most in countries that are members of the EU (Latvia, Lithuania, and Estonia) and Moldova, which declared its willingness to join the EU. However, the energy intensity and the share of renewable energy consumption were insignificantly related to the level of economic development. Analyzing the possibility of achieving the Post-Soviet countries’ climate change policy targets, the results showed that only some of them will succeed. Therefore, Post-Soviet countries should implement more efficient climate change policies and effective tools in order to achieve their targets.

1. Introduction

Climate change is one of the global challenges that need to be addressed immediately. All world countries must contribute to climate change mitigation to fulfill the ambitious plan of stopping the increase of carbon emissions and keeping the global average temperature growth “well below” 2 °C [1]. The largest share of countries ratified the Paris Agreement in 2015 to reduce or stop the growth of carbon emissions by 2030 [2]. All Post-Soviet countries set their climate change mitigation targets in their Intended Nationally Determined Contributions (INDC) and local energy strategies up to 2030 (2035). However, the possibility of achieving these targets is not well revealed. Researchers mainly focused on the achievements of the Paris Agreement and the 2030 goals in the European Union (EU) countries [3] and in China [4,5,6,7,8,9].
In this study we investigate the climate change policy implementation in Post-Soviet countries. In recent years, Brizga et al. [10], Schierhorn et al. [11], Bea et al. [12], and Jorgenson and Schor [13] analyzed the main determinants of carbon emissions in these countries. Other researchers explored the adoption of climate change [14,15]. According to Bruno [16], the Post-Soviet space bears great significance for global climate history, but climate change policy research only recently began to develop as a field of study in this region. Furthermore, the Post-Soviet region is very big and, considering the economic development, rather different. The regime system is different as well. Some of the countries (Lithuania, Latvia, and Estonia), after 15 years of independence, joined the EU. Other countries (Georgia, Ukraine, and Moldova) declared the willingness to follow the same development path as Western countries. The rest of the Post-Soviet countries, despite their independence, are still under the influence of the Russian Federation. Therefore, when analyzing the implementation of climate change policy, it is illogical to consider countries of the Post-Soviet space as a block, ignoring the persistent diversity of the legislative basis and economic development among all countries in this region [10]. Consequently, this study aims to analyze the achievements of climate change policy encompassing the carbon emissions, energy intensity, and renewable energy consumption of each Post-Soviet country and revealing the possibility of reaching the long-term 2030–2035 targets set by the countries of the Post-Soviet space in their energy strategies and climate change policies. To the best of our knowledge, this topic has not yet been analyzed by previous authors. In this article, we compared the achievements and ambitions to mitigate climate change in Post-Soviet countries, considering the differences in economic development.

2. Literature Review

2.1. Post-Soviet Countries

Post-Soviet countries are a very specific group. This group was for a long time a single-party state, composed of 15 national sub-regions, with a centralized government and a common economy and currency. After the collapse of the Soviet Union, in 1991, Post-Soviet countries chose different paths. Most of them shifted from a centrally planned structure to a market-based system. A small part of these countries turned sharply to the West. Therefore, during the recent decade, differences in terms of social, economic, and environmental aspects were observed [12]. Accordingly, it is reasonable to assume that there are differences between climate change policy implementation in Post-Soviet countries. In countries such as Azerbaijan, Kazakhstan, Turkmenistan, and the Russian Federation, where economies are dominated by the oil industry, the promotion of renewable energy could be rather difficult. Meanwhile, in the Baltic States, where policymakers make huge efforts to reach energy independence, the promotion of renewable energy could be one of the main ways to achieve goal. Furthermore, attention to climate change could shift due to military interventions. Ukraine, Georgia, and Moldova are countries where the threat of war is evident, and energy independence might strengthen their political position in the region, reducing their dependence on foreign energy supplies often used as a political bargaining tool. As a result, by achieving the targets set in their climate change policy strategies, Post-Soviet countries will not only prevent climate change but also have the possibility of achieving energy independence by promoting renewable energy and reducing their fossil fuel consumption [17,18].

2.2. Climate Change Policy and Main Aspects

Climate change policy mainly encompasses three aspects: (a) reduction (or slow growth) of carbon emissions, (b) energy efficiency growth (energy intensity reduction), and (c) promotion of renewable energy consumption. Carbon emissions reduction is the main target when seeking climate change mitigation. Meanwhile, energy efficiency and renewable energy consumption are the main sources of carbon emission reduction. Considering the search for ways to reduce carbon emissions and the fact that carbon emissions are directly related to energy consumption, in case of economic growth, energy efficiency should increase, which can contribute to a decrease in emissions. Many authors revealed that the increase in energy efficiency helps reduce carbon emissions [19,20,21,22,23,24,25,26,27,28]. This phenomenon was defined as technological progress [27]. Furthermore, avoiding drastic restrictions on economic growth, promotion of energy efficiency is the most acceptable [29] and cost-effective way [30] to seek a reduction of carbon emissions. However, other authors found that energy efficiency did not contribute to carbon emission reduction [31]. Fernández González et al. [32] stated that an increase in energy efficiency did not offset the impact of economic growth because, at the same time, energy consumption increased as well. Therefore, energy consumption reduction is a very important aspect when seeking climate change mitigation.
Renewable energy consumption is another aspect related to the energy sector, which contributes to the reduction of carbon emissions. Liobikiene and Butkus [27] defined the impact of renewable energy consumption on climate mitigation as a substitution effect. Böluk and Mert [33,34], Marrero [35], Dogan and Seker [36], Liobikiene and Butkus [27,31], Al-Mulali et al. [37], and Baležentis et al. [38] stated that the growth of the renewable energy field caused significant reductions of carbon emissions. However, other authors found an insignificant or negative impact of renewable energy consumption on carbon emissions [39,40,41]. Moreover, the impacts of separate renewable energy sources are different [38]. Nevertheless, achieving climate change mitigation is impossible without renewable energy consumption promotion.

2.3. Forecasts of Climate Change Policy Targets

Because climate change policy strategies by 2030 (or 2035) in almost all Post-Soviet countries were adopted relatively recently, studies analyzing the possibility of these countries fulfilling their objectives were not spotted. This leads us to assume that this research is the first to analyze these possibilities. Most of the scientific research analyzed the forecasts for climate change policy targets encompassed the Kyoto protocol, Europe 2020, and the Low-Carbon Development Strategy until 2050 [3,42,43,44,45].
Considering the Baltic States, which are part of the EU, Streimikiene and Roos [46] showed that these countries would be able to achieve their climate change and energy targets. Liobikienė and Butkus [3] also revealed that the targets of Europe 2020 (reduction of carbon emission, primary energy consumption, and the share of renewable energy) in the Baltic States would be successfully achieved. Smit et al. [47] showed that Latvia and Lithuania would exceed the targets of primary energy saving in 2020. Giacomarra and Bono [48] found that Lithuania is expected to surpass its targets of renewable energy consumption.
Considering other Post-Soviet countries, Wu et al. [49] found, by forecasting carbon emissions in the Russian Federation, that the growth rate of emissions was the lowest. Samoilov and Nakhutin performed a medium-term forecast of carbon emissions in Russia [50]. Pao et al. [51] predicted Russia’s renewable, nuclear, and total energy consumption. Kerimray et al. [52] forecasted the carbon emissions in Kazakhstan, and the results showed that if the transition to a market-based economy was completed by 2020, a reduction of carbon emissions by 2030 would occur. Xiong et al. [53] forecasted the targets of energy consumption and found out that Kazakhstan’s target could not be achieved by 2020. Karatayev and Clarke [54] analyzed the future potential of renewable energy, while Karatayev et al. [55] analyzed green energy in Kazakhstan. Hasanov et al. [56] forecasted electricity demand in Azerbaijan. Gomez et al. [57] analyzed future energy and Saidmamatov et al. [58] the potential of renewable energy in Uzbekistan. A number of studies, such as Dyachuk [59], Kurbatova and Khlyap [60], Rogelj et al. [61], and Höhne et al. [62], investigated the ability of Ukraine to fulfill its carbon emission obligations. Yung et al. (2019) [63] analyzed the energy consumption aims, and Chepeliev et al. [64] accessed the energy consumption from renewable energy obligations. Chernyak et al. [65] and Diachuk et al. [66] explored energy consumption possibilities for achieving the aims of The Energy Strategy until 2035, using the different forecasting methods. As will be seen below, our study enriches the research in this field in that have analyzed how separate Post-Soviet countries would achieve their carbon emission, energy intensity (energy consumption), and renewable energy consumption targets, referred to their different past experiences.

3. Methods and Data

In this study, we analyzed the climate change policy targets in all Post-Soviet countries: Armenia (ARM), Azerbaijan (AZE), Belarus (BLR), Estonia (EST), Georgia (GEO), Kazakhstan (KAZ), Kyrgyz Republic (KGZ), Lithuania (LTU), Latvia (LVA), Moldova (MDA), Russian Federation (RUS), Tajikistan (TJK), Turkmenistan (TKM), Ukraine (UKR), and Uzbekistan (UZB). We explored three aspects: tendencies of carbon emission (CO2 emissions (metric tons per capita)), energy intensity (energy consumption) (kg of oil equivalent per $1000 GDP (constant 2011 PPP), million tons of oil equivalent (for countries which are members of the EU)), and the share of renewable energy (% of total final energy consumption) in the period of 2002-2014. The data were obtained from the World Bank database [67] and Eurostat [68].
In order to reveal the carbon pollution problems in Post-Soviet countries, we conducted regression analyses predicting energy consumption and greenhouse gas emissions for all the countries through their percentage rates of renewable energy and global domestic product (expressed as purchasing power parity, constant 2011 international $), to determine whether economic growth or infrastructural changes can best predict the relevant outcomes for each case.
Furthermore, in this article, the possibilities of Post-Soviet countries fulfilling climate and energy commitments for the period up to 2030 (or 2035), which were based on the Paris Agreement, were analyzed. All targets of climate change policy are presented in Table 1. In this paper, we explored only the achievements of documented targets. For example, in Moldova, the Russian Federation, Armenia, Azerbaijan, Georgia, Kazakhstan, Kyrgyzstan, Tajikistan, Turkmenistan, and Uzbekistan, the targets of energy intensity and renewable energy consumption were not evaluated because these targets are only currently being developed.
To identify decreasing or increasing periods in trends that are not considered as a statistically random behaviour, variables (CO2 emissions, energy intensity, and the share of renewable energy consumption) were treated as time series. This method allows us to assume and justify changes in trends, since measurements are linked to the moments of their occurrence. To build forecasts, we allowed the software (SPSS v.21) to choose the best model type for each individual time series model, resulting in predictions that can be qualitatively judged beyond their linear trend, based on their confidence intervals and how robust the trend appears to be.
The period from 2002 until 2014 was used to forecast carbon emissions, primary energy consumption, and the share of renewable energy. All three variables were forecasted until 2035. The time period, starting from 2002, is characterized by the recovery of industrial sectors, economic growth, and stable political situation in Post-Soviet countries after the Russian economic crisis. The obtained forecasts made it possible to compare the results with target values and find out whether the goals of climate change policy for the period until 2030 (or 2035) could be fulfilled.
The forecasted results for carbon dioxide emissions, the share of energy intensity, and the share of renewable energy up to 2035 are presented in graphic form for an easy qualitative investigation. All countries of the Post-Soviet space were divided into regions: countries that are members of the EU, Eastern Europe, Transcaucasia, and Eurasia and Central Asia.

4. Results and Discussion

4.1. Energy Consumption and Greenhouse Gas Emissions in Post-Soviet Countries

Each country experiences the transition toward more sustainable practices, such as lowering the energy consumption of the household or reducing greenhouse gas emissions individually. A country’s overall impact is a result not only of the available infrastructure, but also of the legislation and its effectiveness, as well as the dominant values, beliefs, and aspirations of the citizens of that country. To capture the diversity of each individual case, we conducted regression analyses predicting energy consumption and greenhouse gasses for each Post-Soviet country.
Results of models predicting energy consumption are presented in Table 2. To ease interpretation, countries are presented in groups based on their regions.
Based on the models in Table 2, it seems that the Baltics (current members of the EU) are not homogenous in what drives their energy consumption. Both the share of renewable energy (REC), indicating the available green infrastructure for energy production, and GDP (an indicator of economic growth) are significant predictors of energy consumption for Estonia and Latvia, but as REC increases in Estonia, so does its energy consumption. The inverse is true of Latvia and Lithuania, where REC relates negatively with energy consumption, indicating that having green energy infrastructure might lead both to increased and to decreased overall energy consumption. Additionally, while GDP is positively related to energy consumption in Estonia and Latvia, it is an insignificant predictor for Lithuania, meaning that economic growth does not necessarily lead to increased energy use. This suggests that there are factors beyond infrastructure and GDP that affect energy use and that individual countries need to be investigated separately if we are to understand how to help them transition toward more sustainable practices.
For Eastern-European countries, REC is only a significant predictor of energy consumption for Ukraine, where the share of REC is inversely related to energy consumption, while GDP is a significant predictor for all countries in this region, meaning that economic growth generally leads to reduced energy consumption in the region.
For the region of Transcaucasia, increases in both GDP and REC mean reduced energy consumption, yet the prediction is quite uncertain for Georgia, where no single predictor is statistically significant, meaning that there might be other factors affecting the country’s energy consumption patterns.
The region of Eurasia and Central Asia is the least homogenous, with overall predictive models being insignificant for Kazakhstan and Kyrgyzstan, meaning that their energy consumption trends cannot be predicted by their GDP nor by their share of renewable energy usage. For the rest of the countries in the region, both GDP and REC are negatively related to energy consumption, meaning that both the increasing availability of green energy infrastructure and economic growth tend to reduce their energy consumption, perhaps indicating a shift toward more energy-efficient and modern practices when they become available and practically accessible. It must be noted that for Uzbekistan, only GDP is a significant predictor of energy consumption, likely due to it having little to no infrastructure for producing renewable energy during the investigated period.
Further, we constructed models to predict each individual country’s greenhouse gas emissions, as represented by CO2 emissions (metric tons per capita). The models investigate whether the availability of renewable energy infrastructure and economic growth are related to overall per capita emissions (see Table 3).
For the Baltics, REC does not seem to contribute significantly when explaining greenhouse gas (GHG) emissions, while economic growth seems to have a positive relationship with it, meaning that in this region, economic growth leads to increased CO2 emissions per capita. It is possible that despite the increasing availability of green energy, the demands for energy increase with increased purchasing power and the changes in infrastructure are unable to sufficiently compensate for this increase in demand.
A similar trend can be observed for Eastern Europe, yet in the case of Ukraine, REC is a significant predictor of GHG, meaning that developing more infrastructure for renewable energy production might effectively lead to reduced CO2 emissions per capita in this country.
For the region of Transcaucasia, we see a lot of heterogeneity among the countries. For example, the GHG emissions of Azerbaijan cannot be predicted by their REC or GDP at all, meaning that there might be factors other than these that affect the country’s energy consumption habits, yet it can also indicate a lack of development and growth. As a matter of fact, Azerbaijan had a negligible percentage of its energy produced from renewable sources, which undoubtedly affects the previously mentioned outcome. For Armenia and Georgia, where renewable energy production has a larger share of the total energy production infrastructure, economic growth seems to be associated with higher CO2 emissions, while REC predicts a decrease in CO2 emissions only for Armenia, and the effect size is quite small.
The region of Eurasia and Central Asia shows quite diverse results for what affects their GHG emissions. Increases in GDP seem to lead to increased per capita CO2 emissions in Kazakhstan, Kyrgyzstan, and the Russian federation, while economic growth seems to decrease CO2 emissions in Uzbekistan, even though the country had little available infrastructure for green energy during the investigated period (from 2002 to 2014). These trends are likely associated with factors like industries entering or exiting the market and with individual behavior. The share of renewable energy consumed by the country predicted lower GHG emissions only for Tajikistan, meaning that the situation in the region is more complicated than just developing the necessary infrastructure. It is likely that renewable energy infrastructure does not lead to the adoption of more modern and energy-efficient practices in industries that are possibly the biggest polluters in the region.

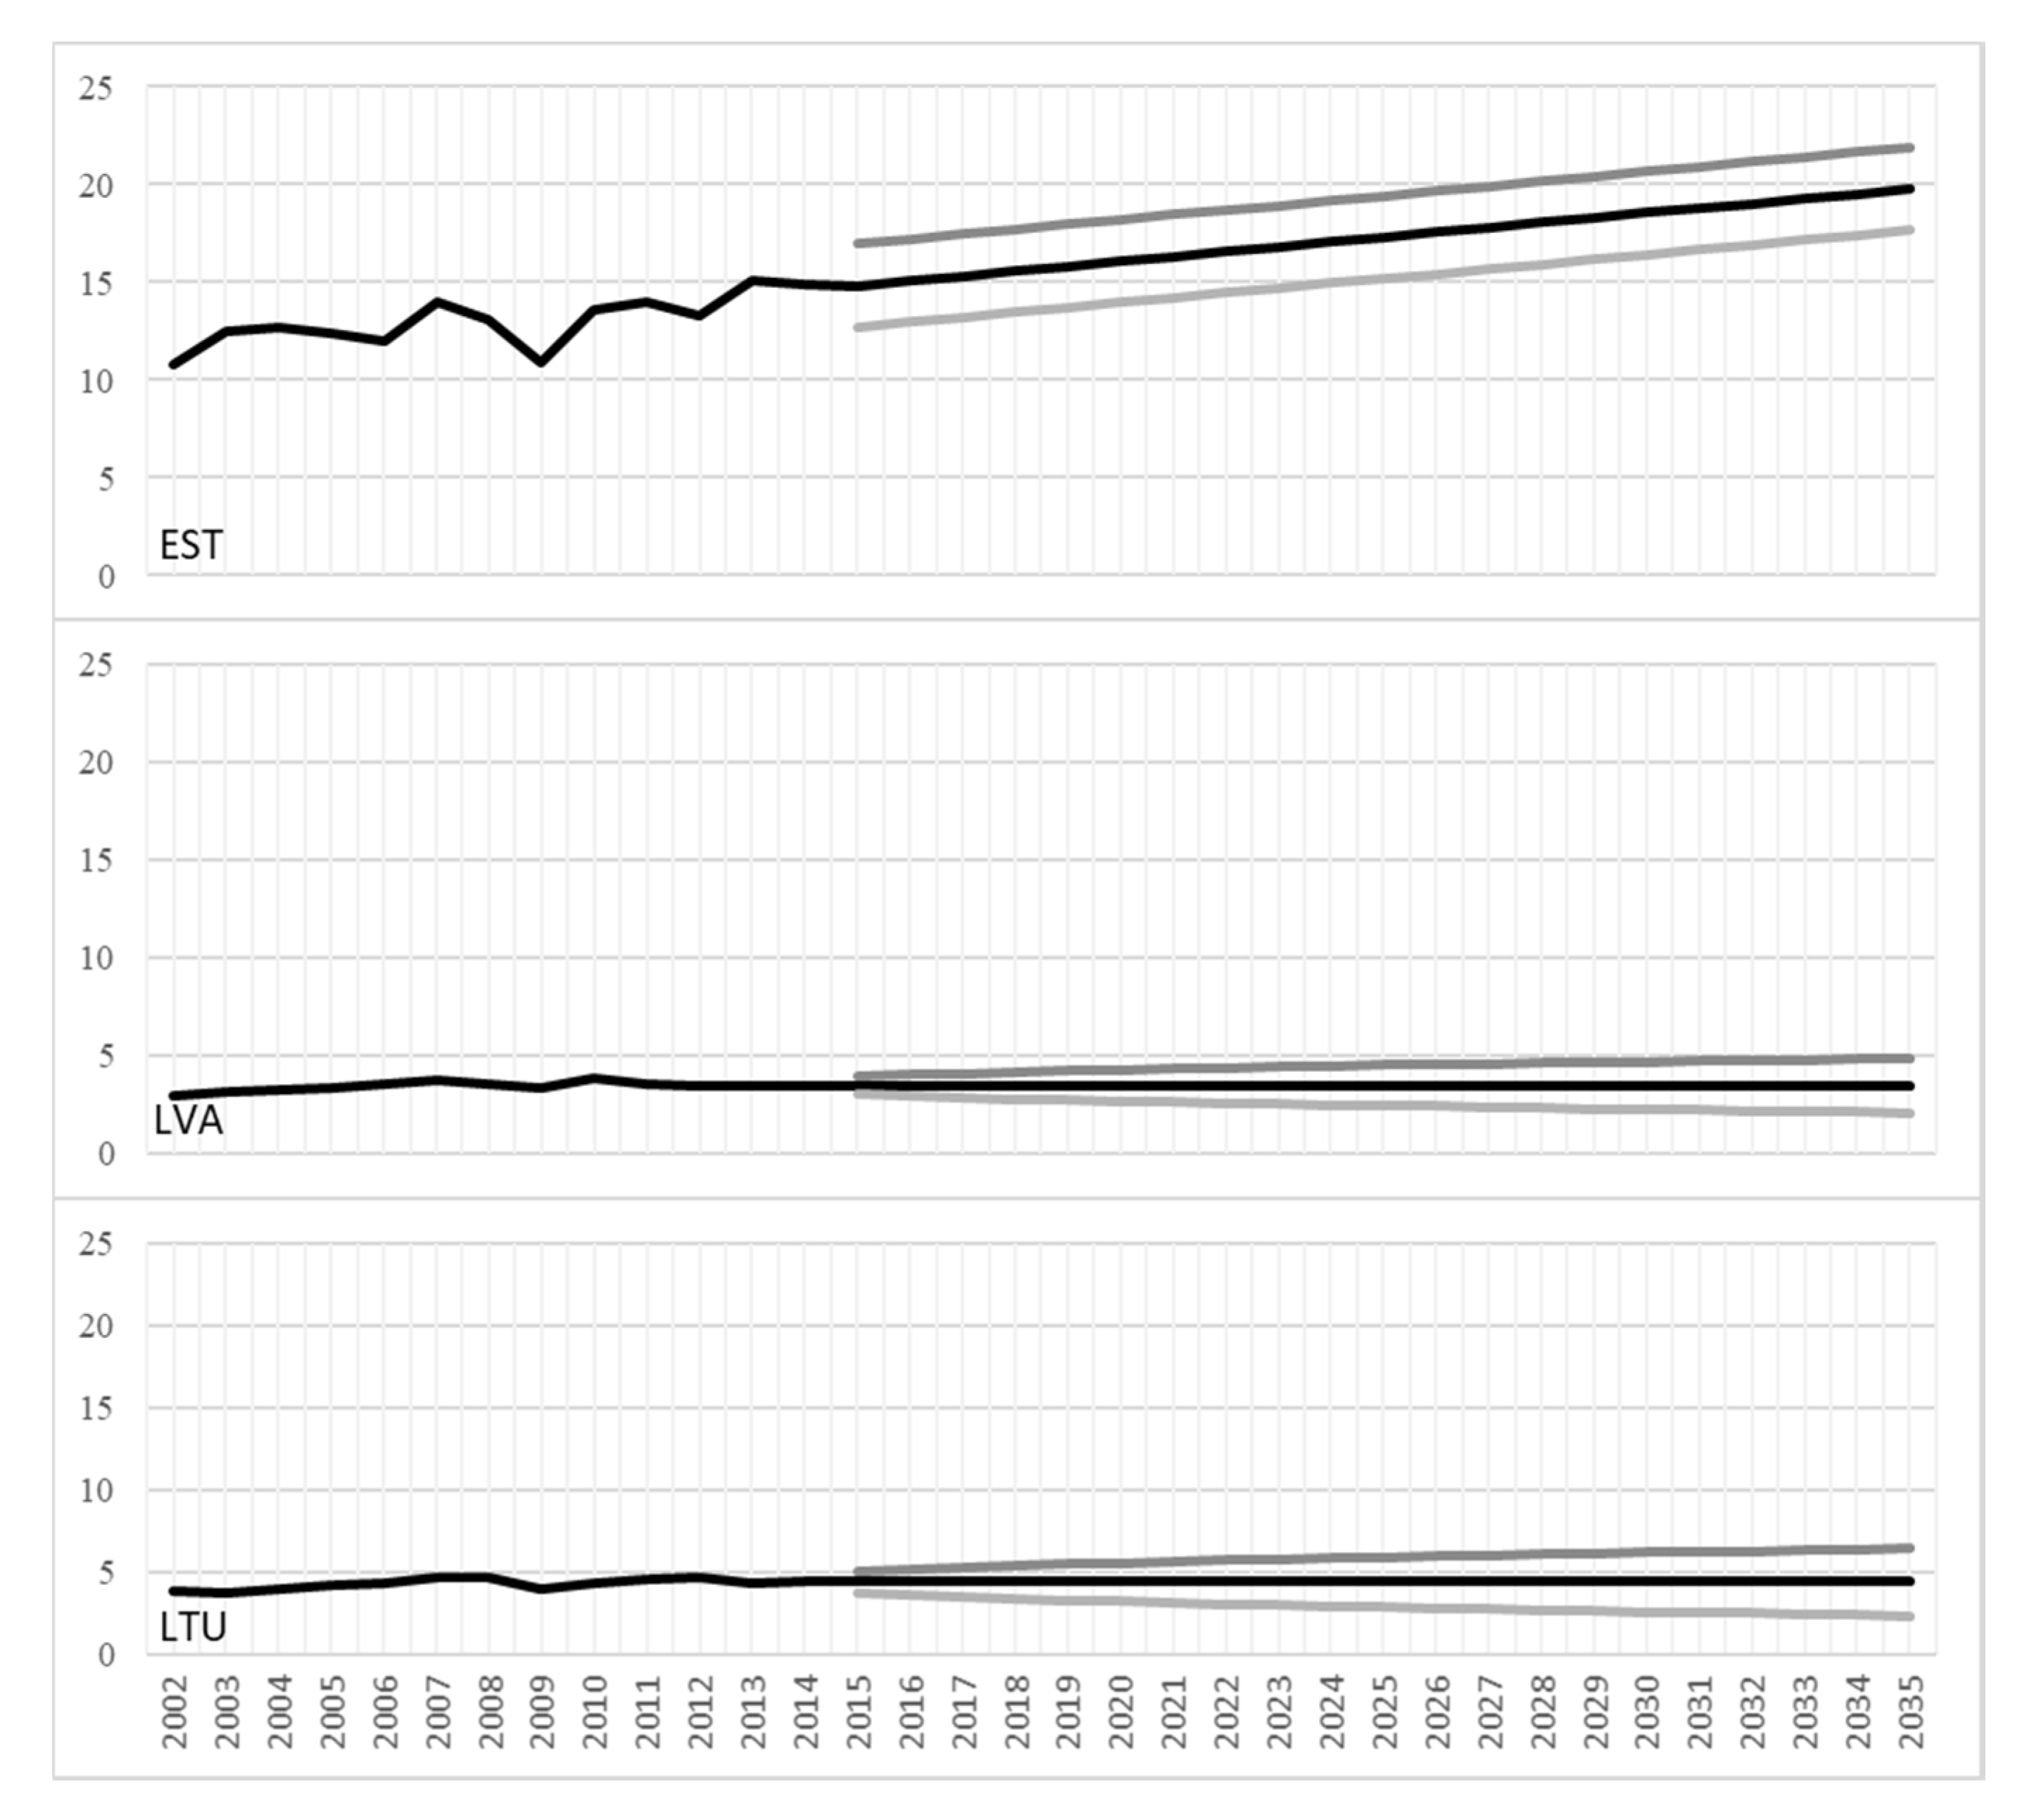
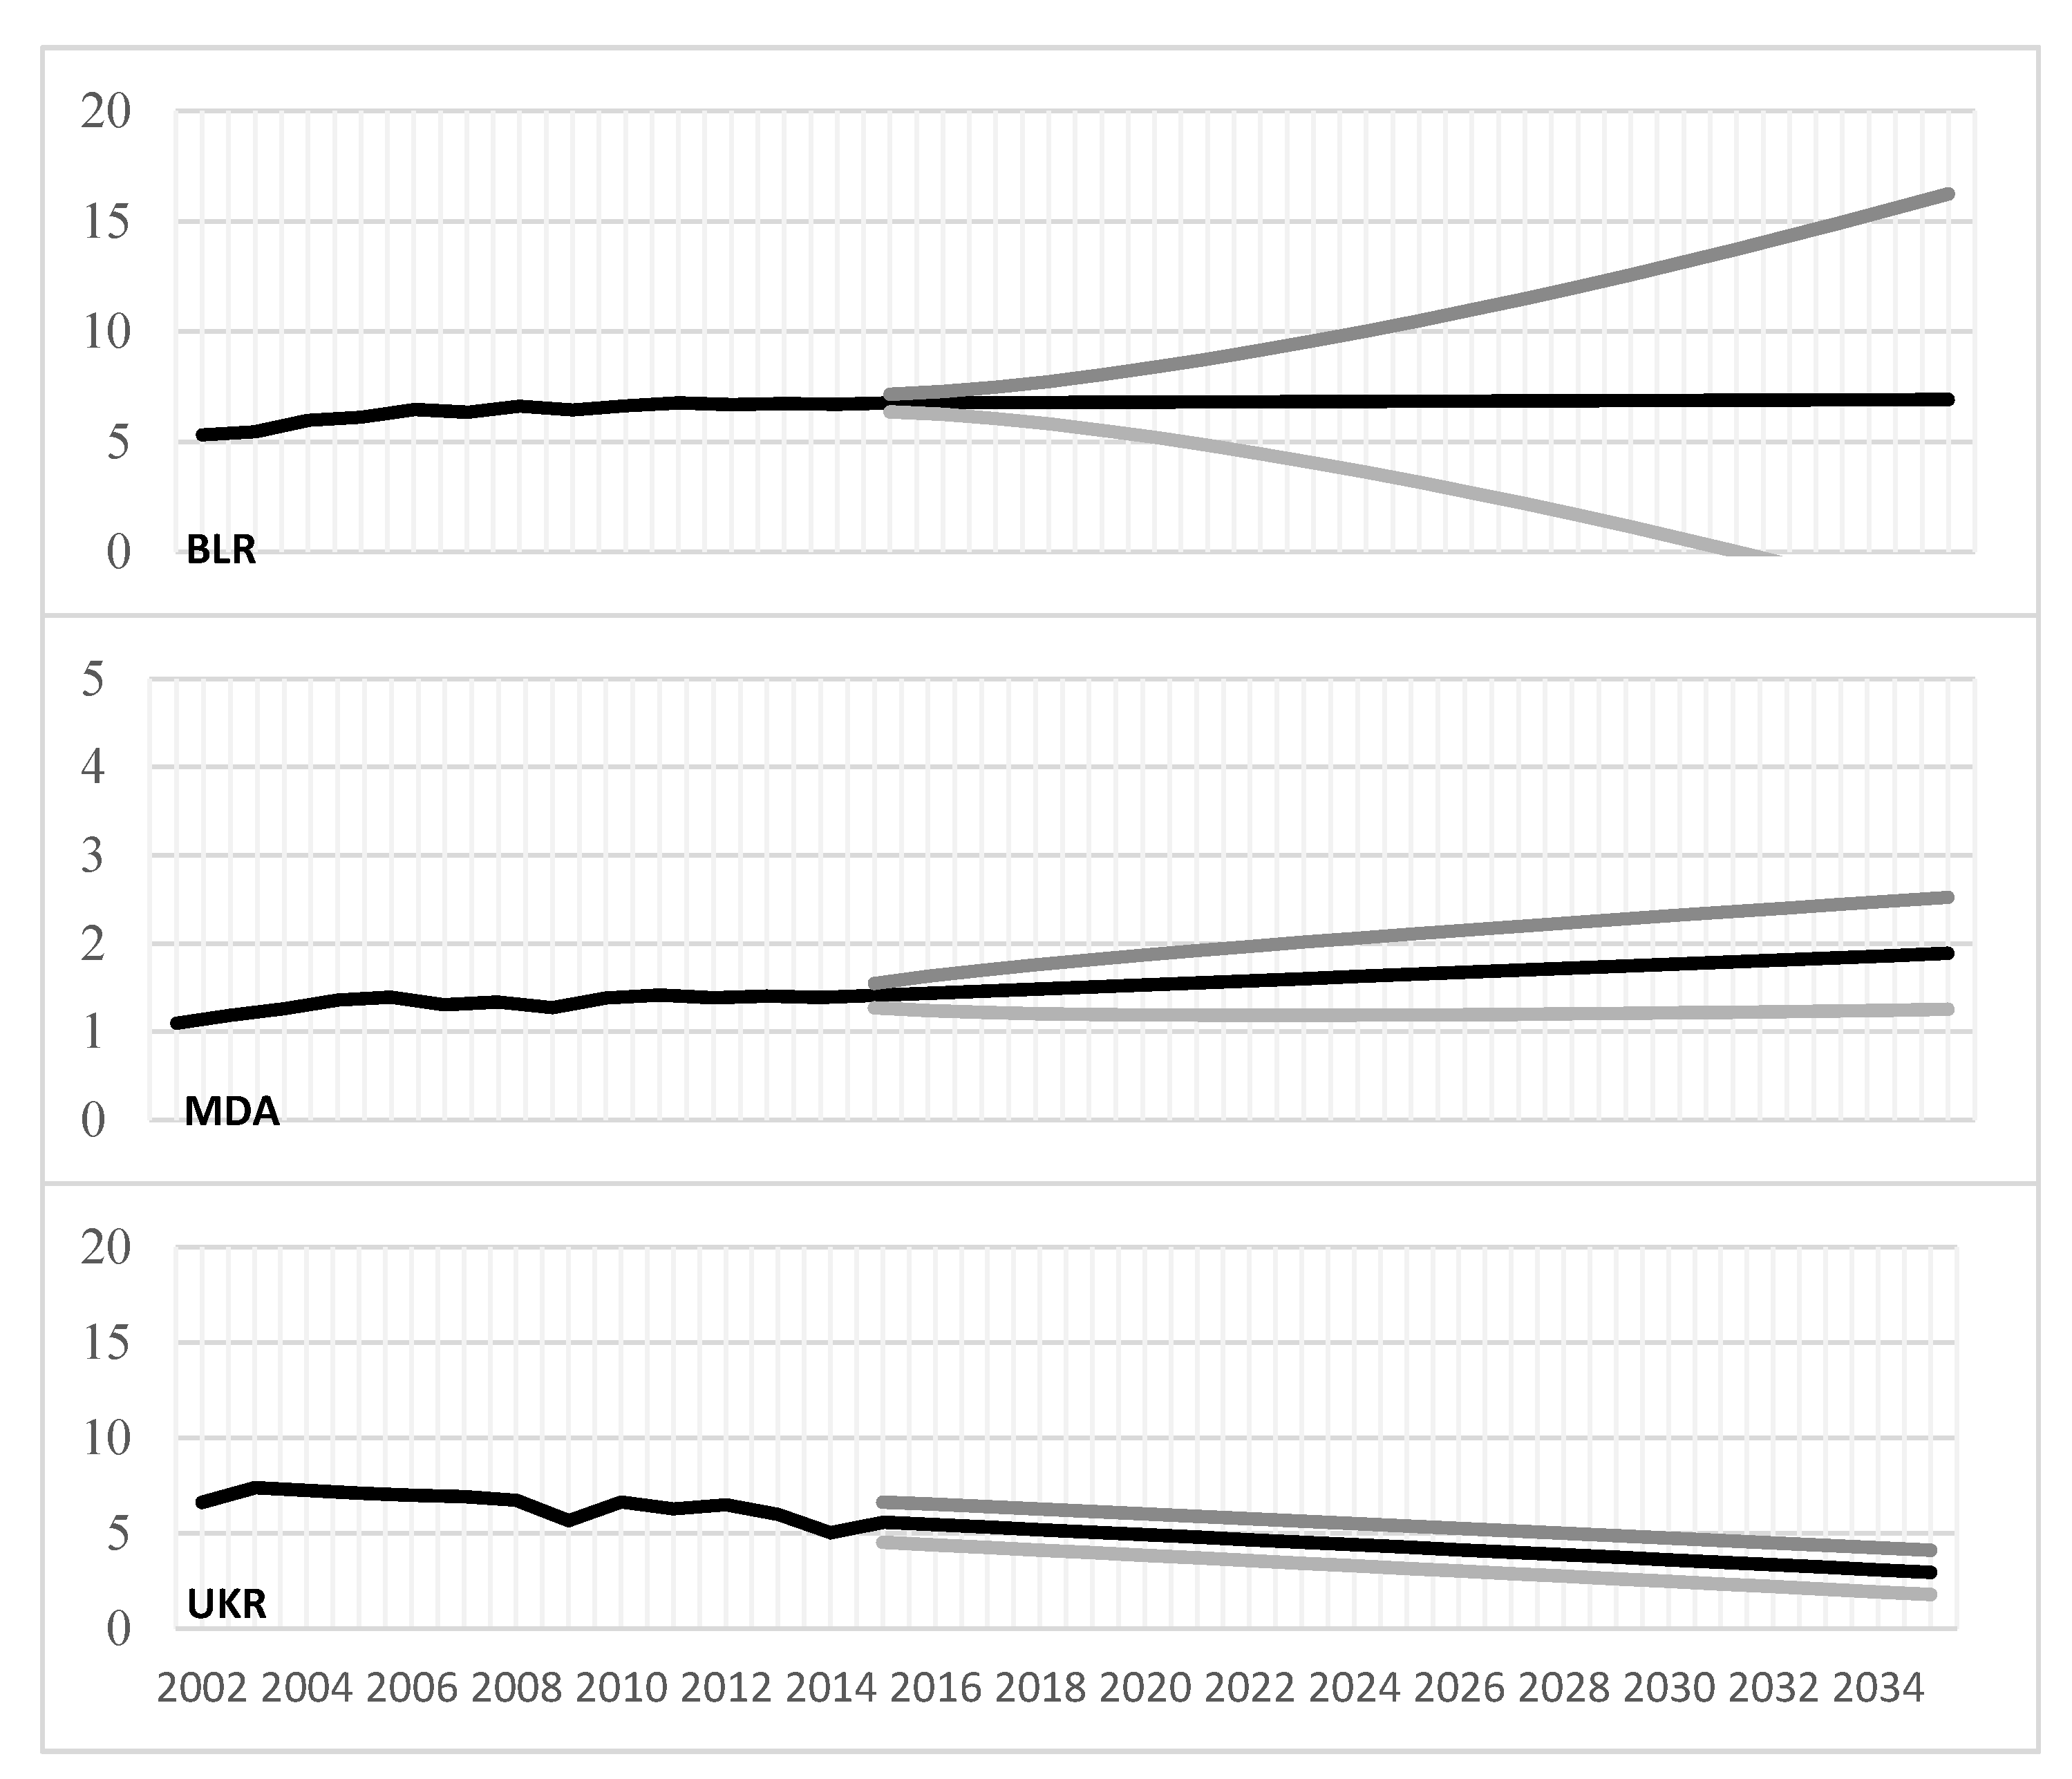
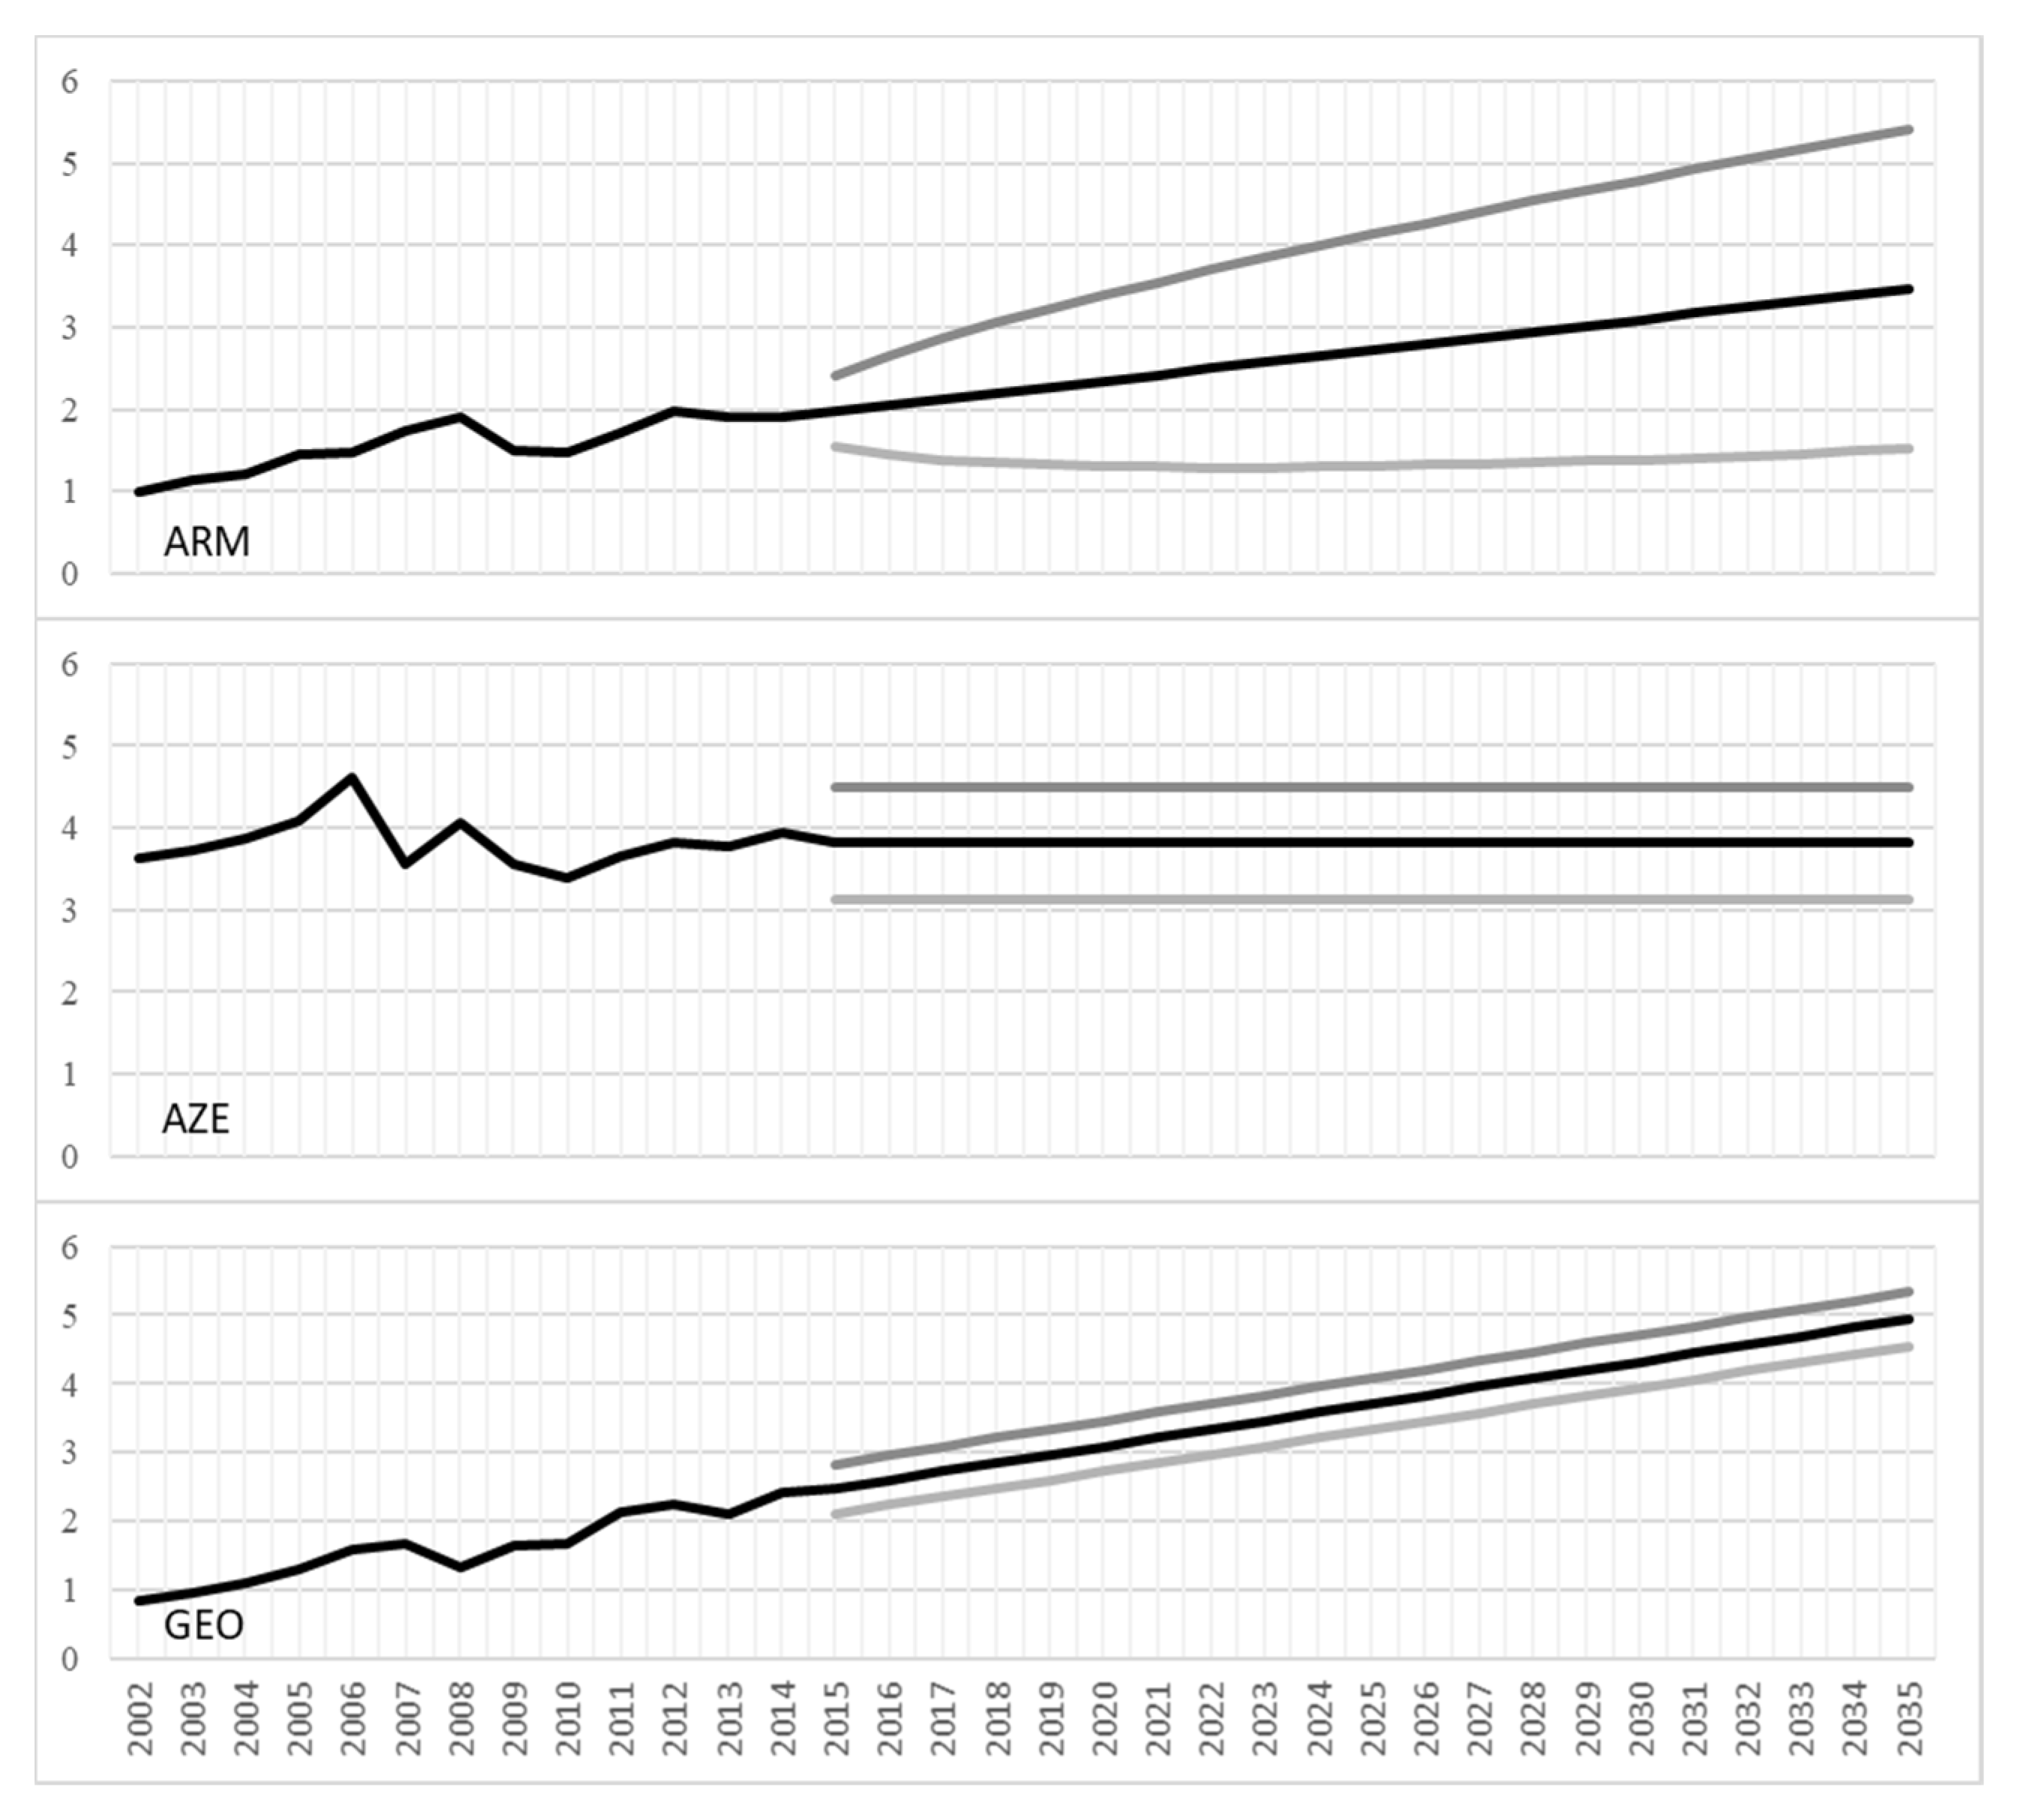
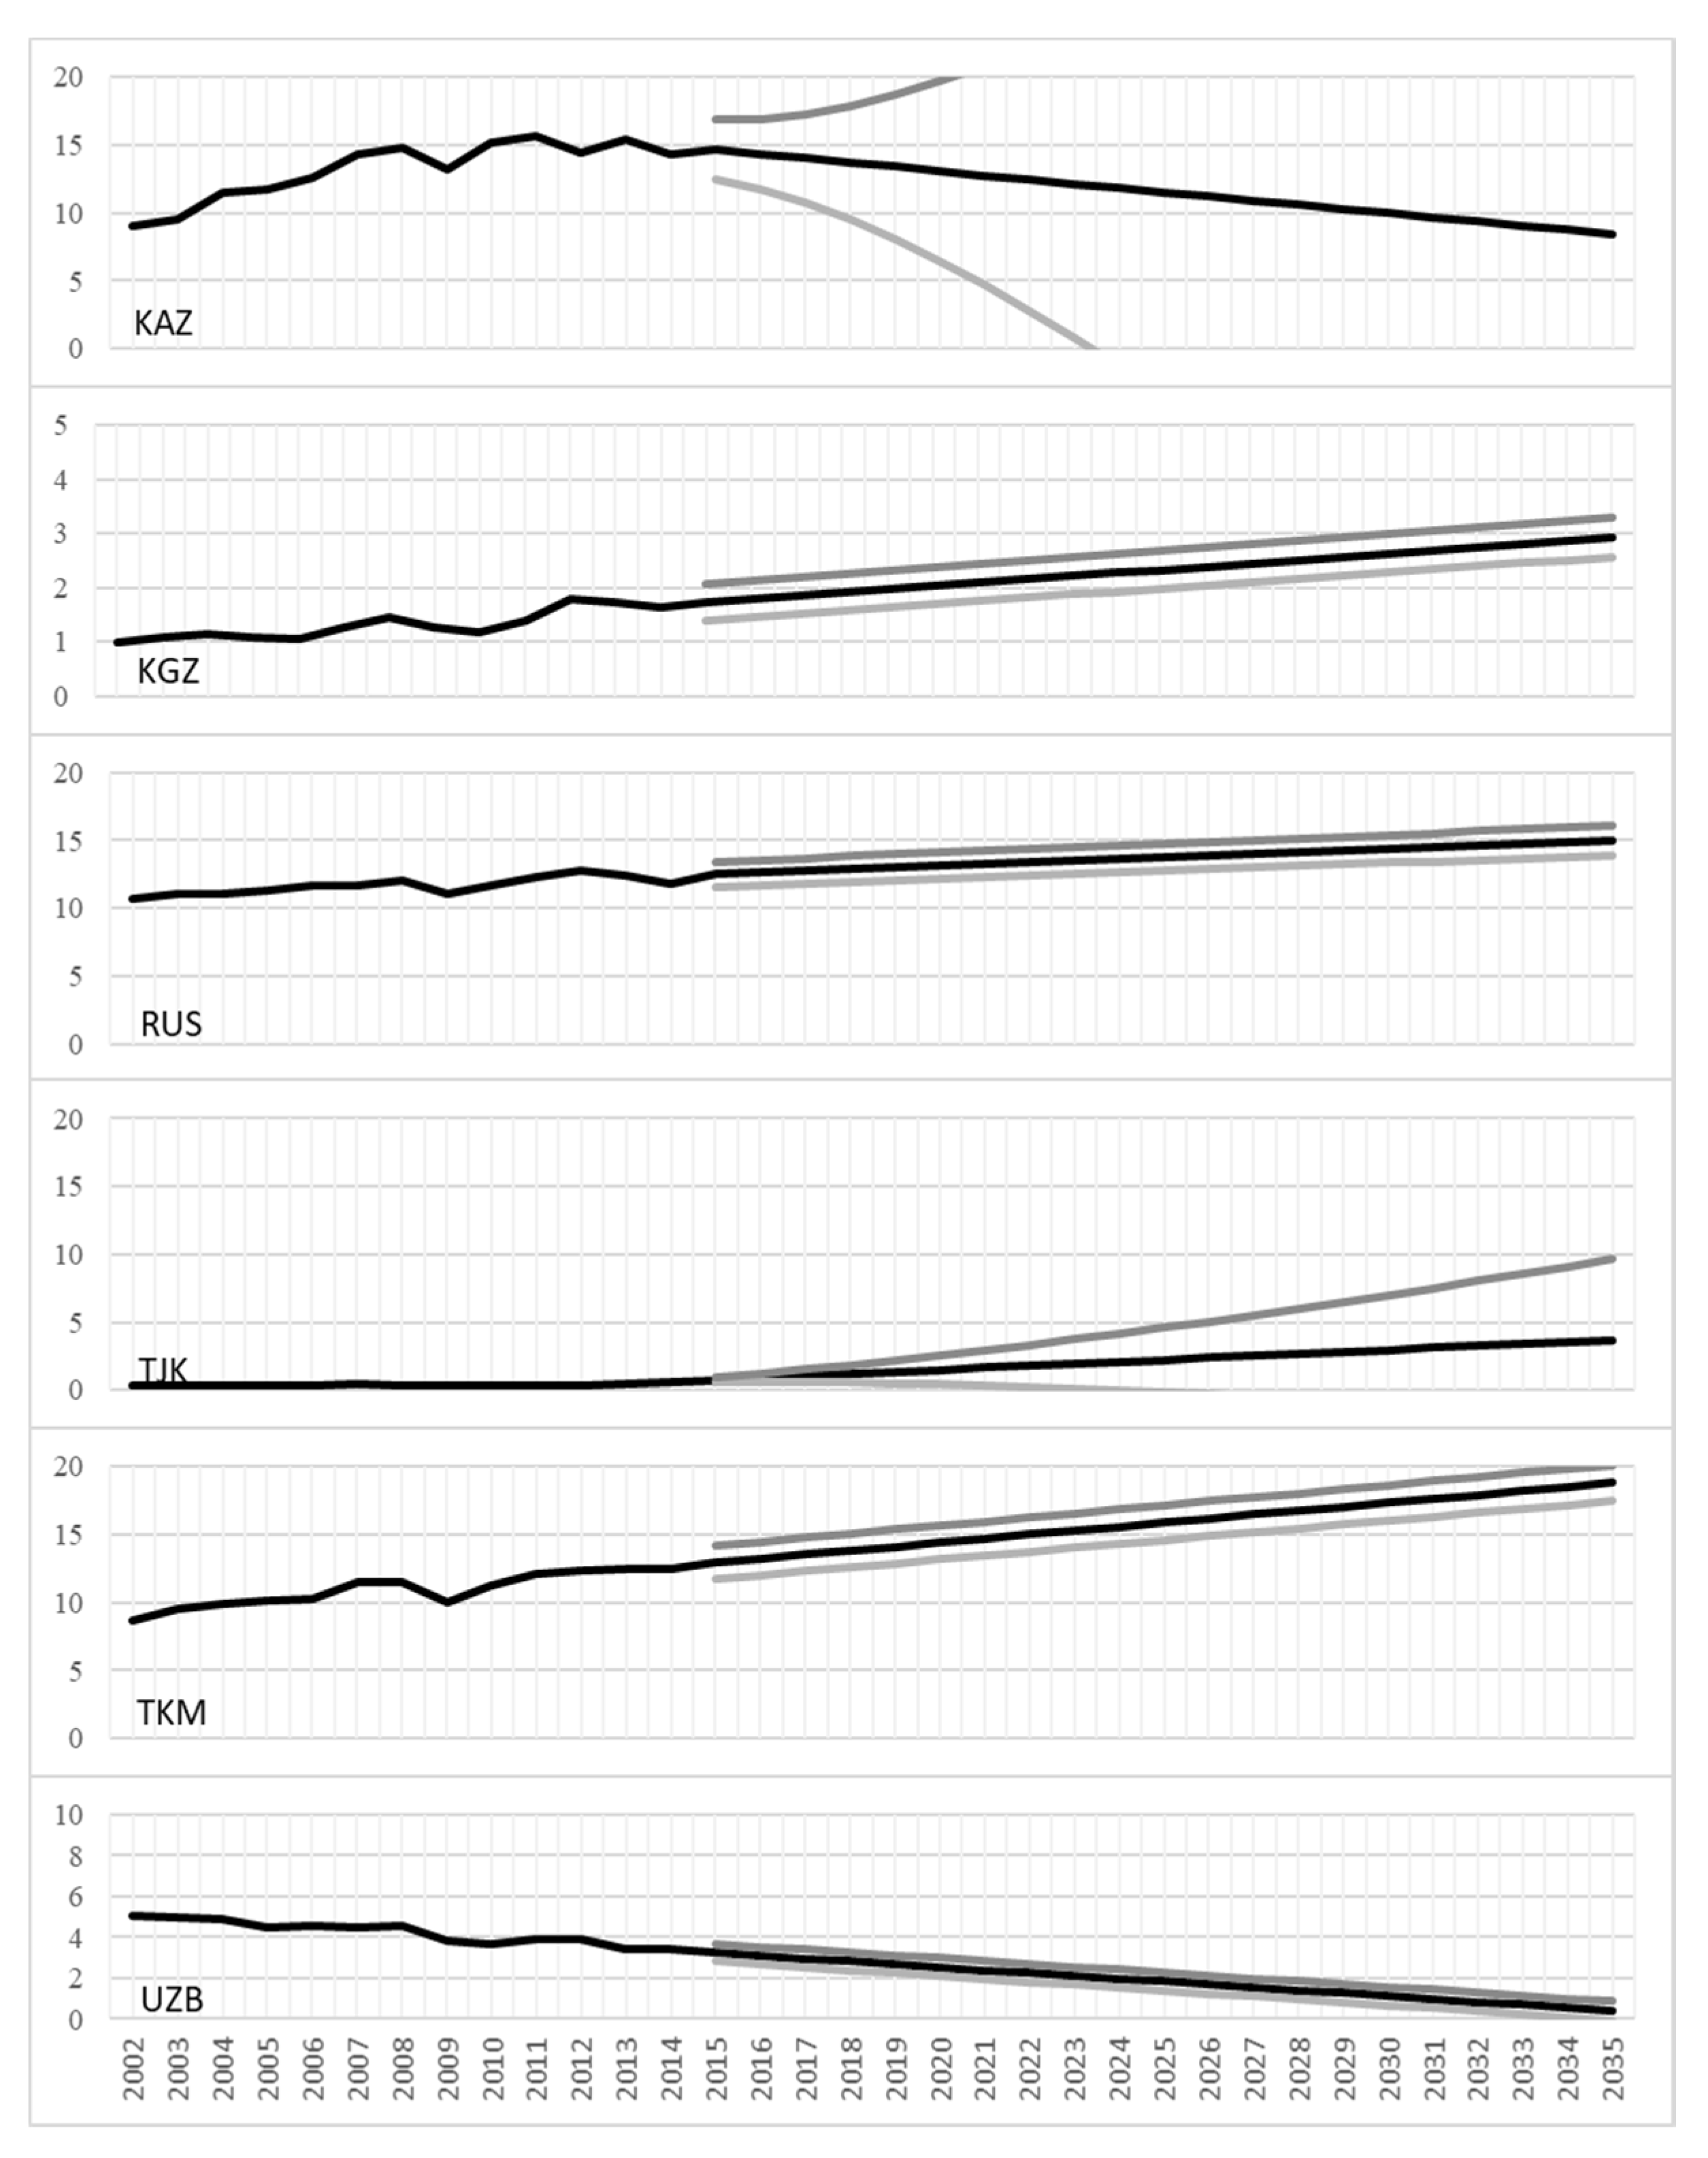
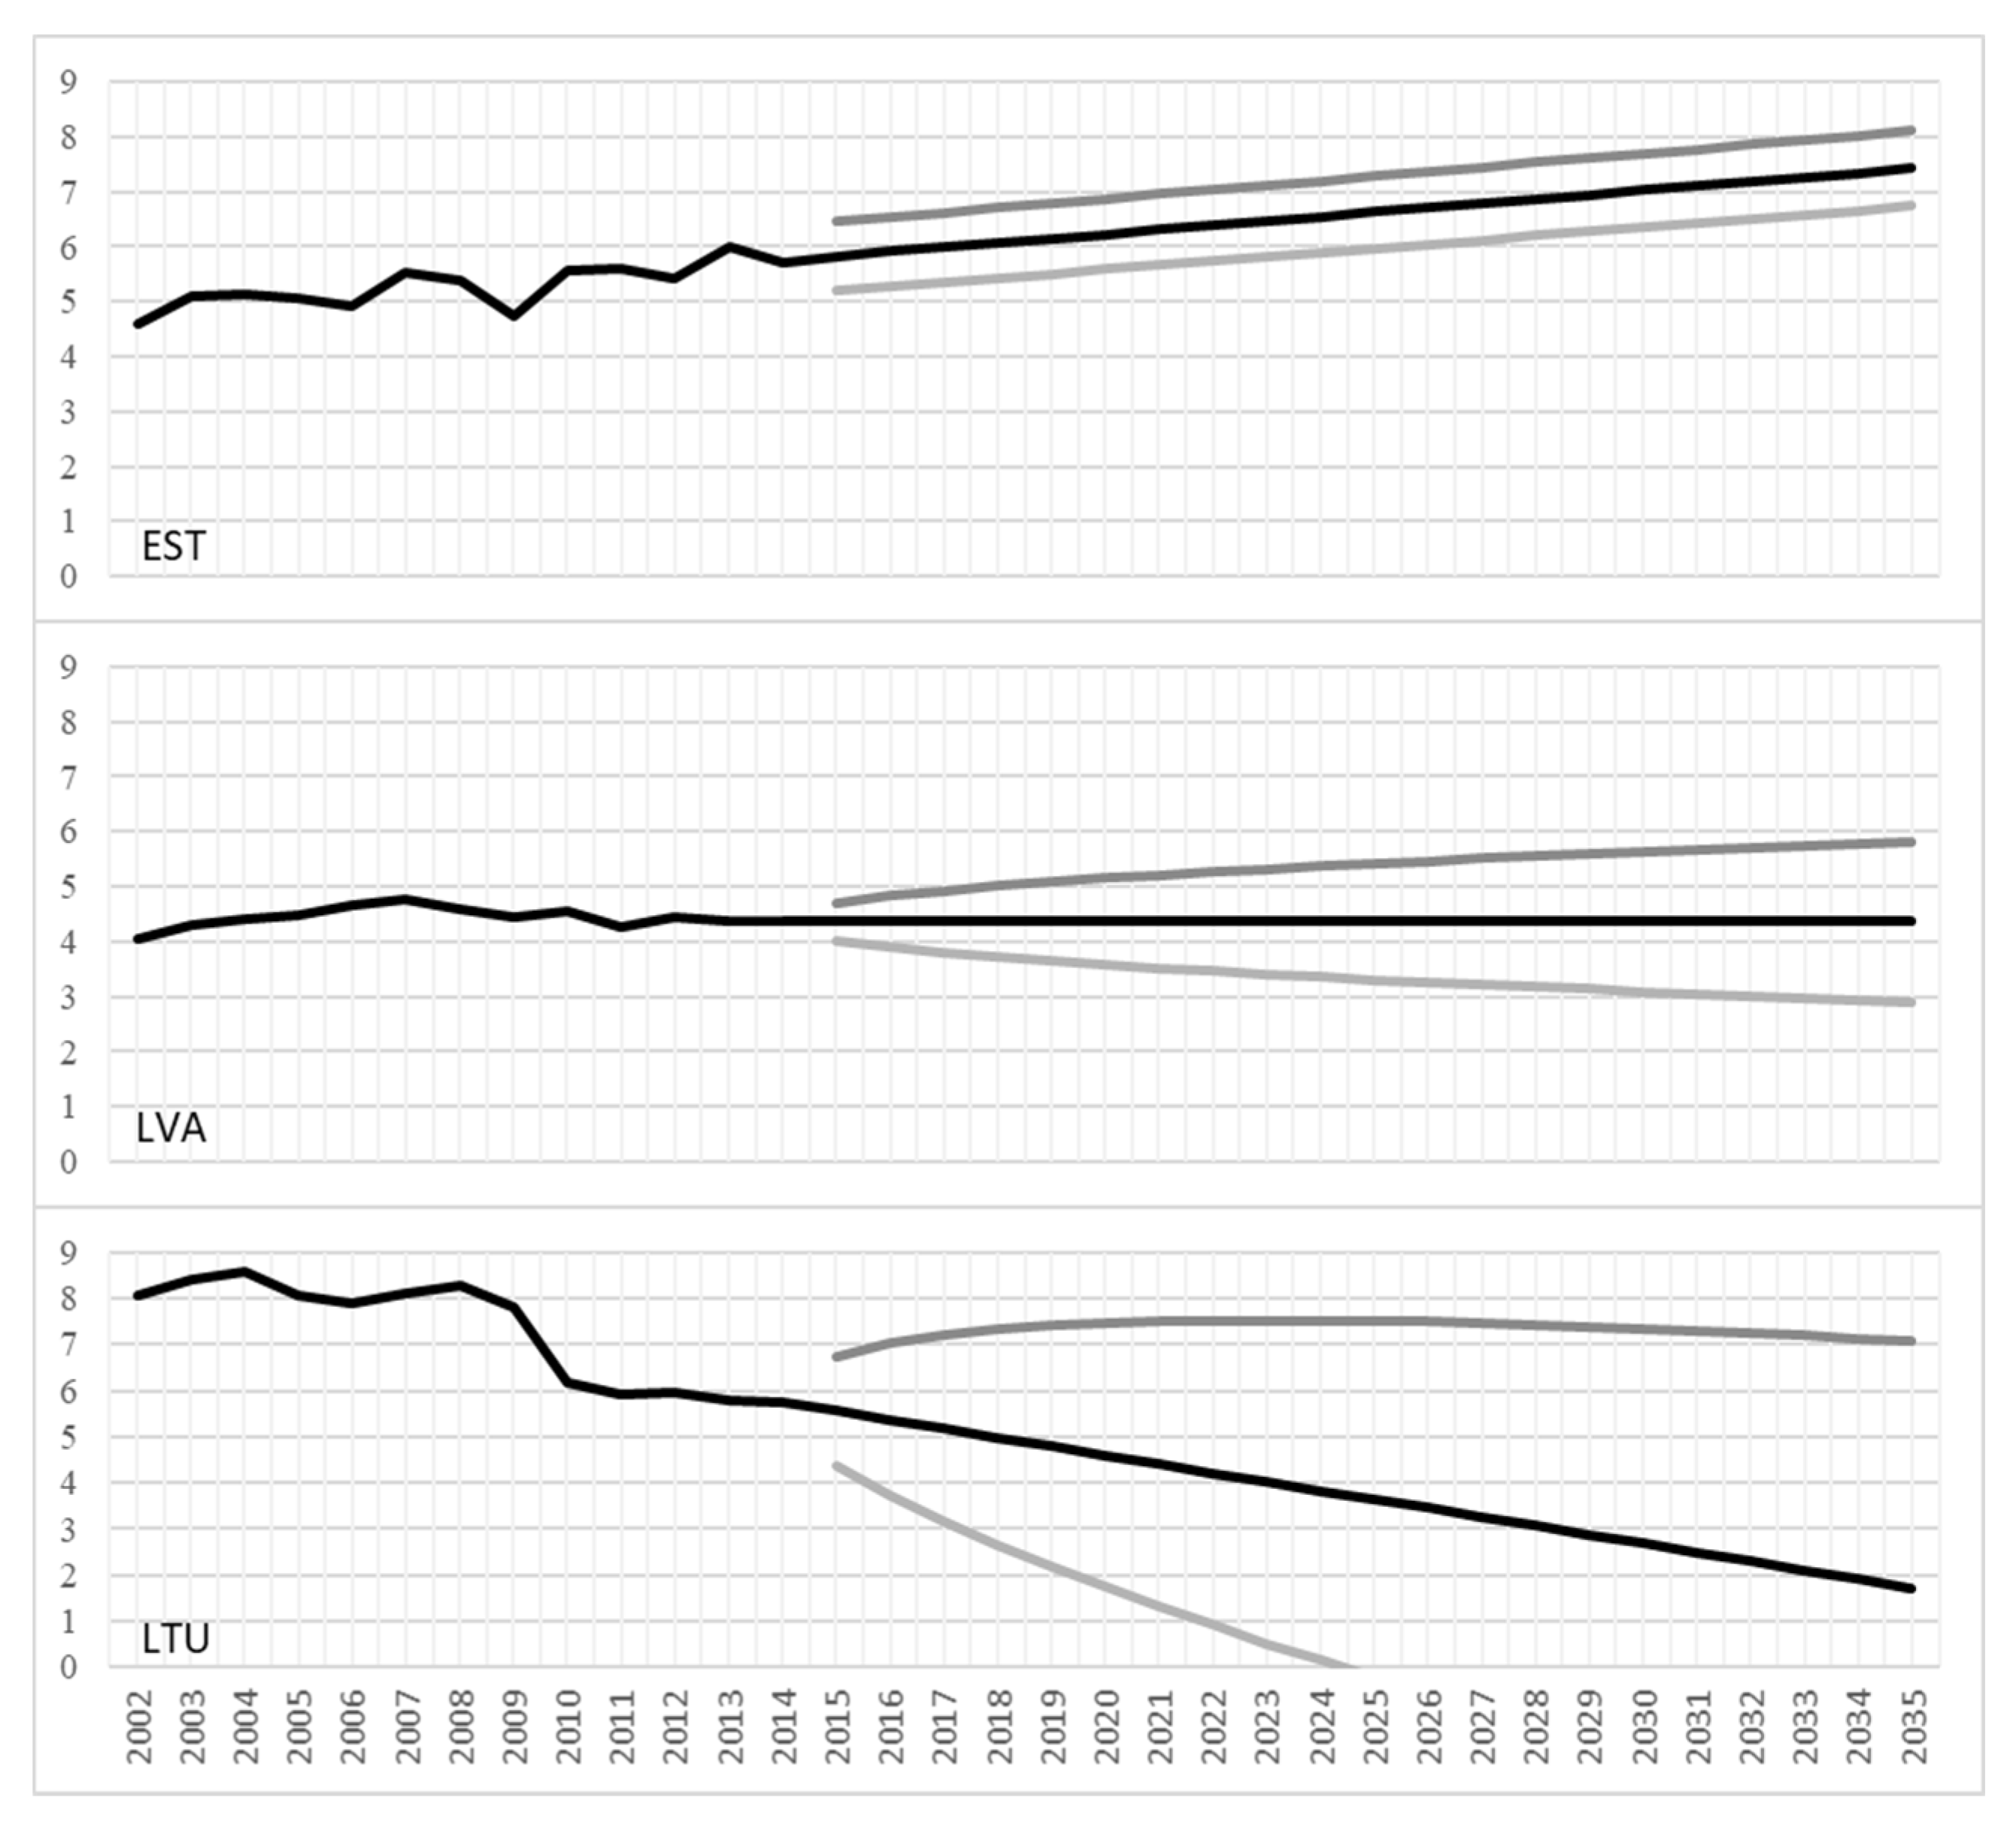
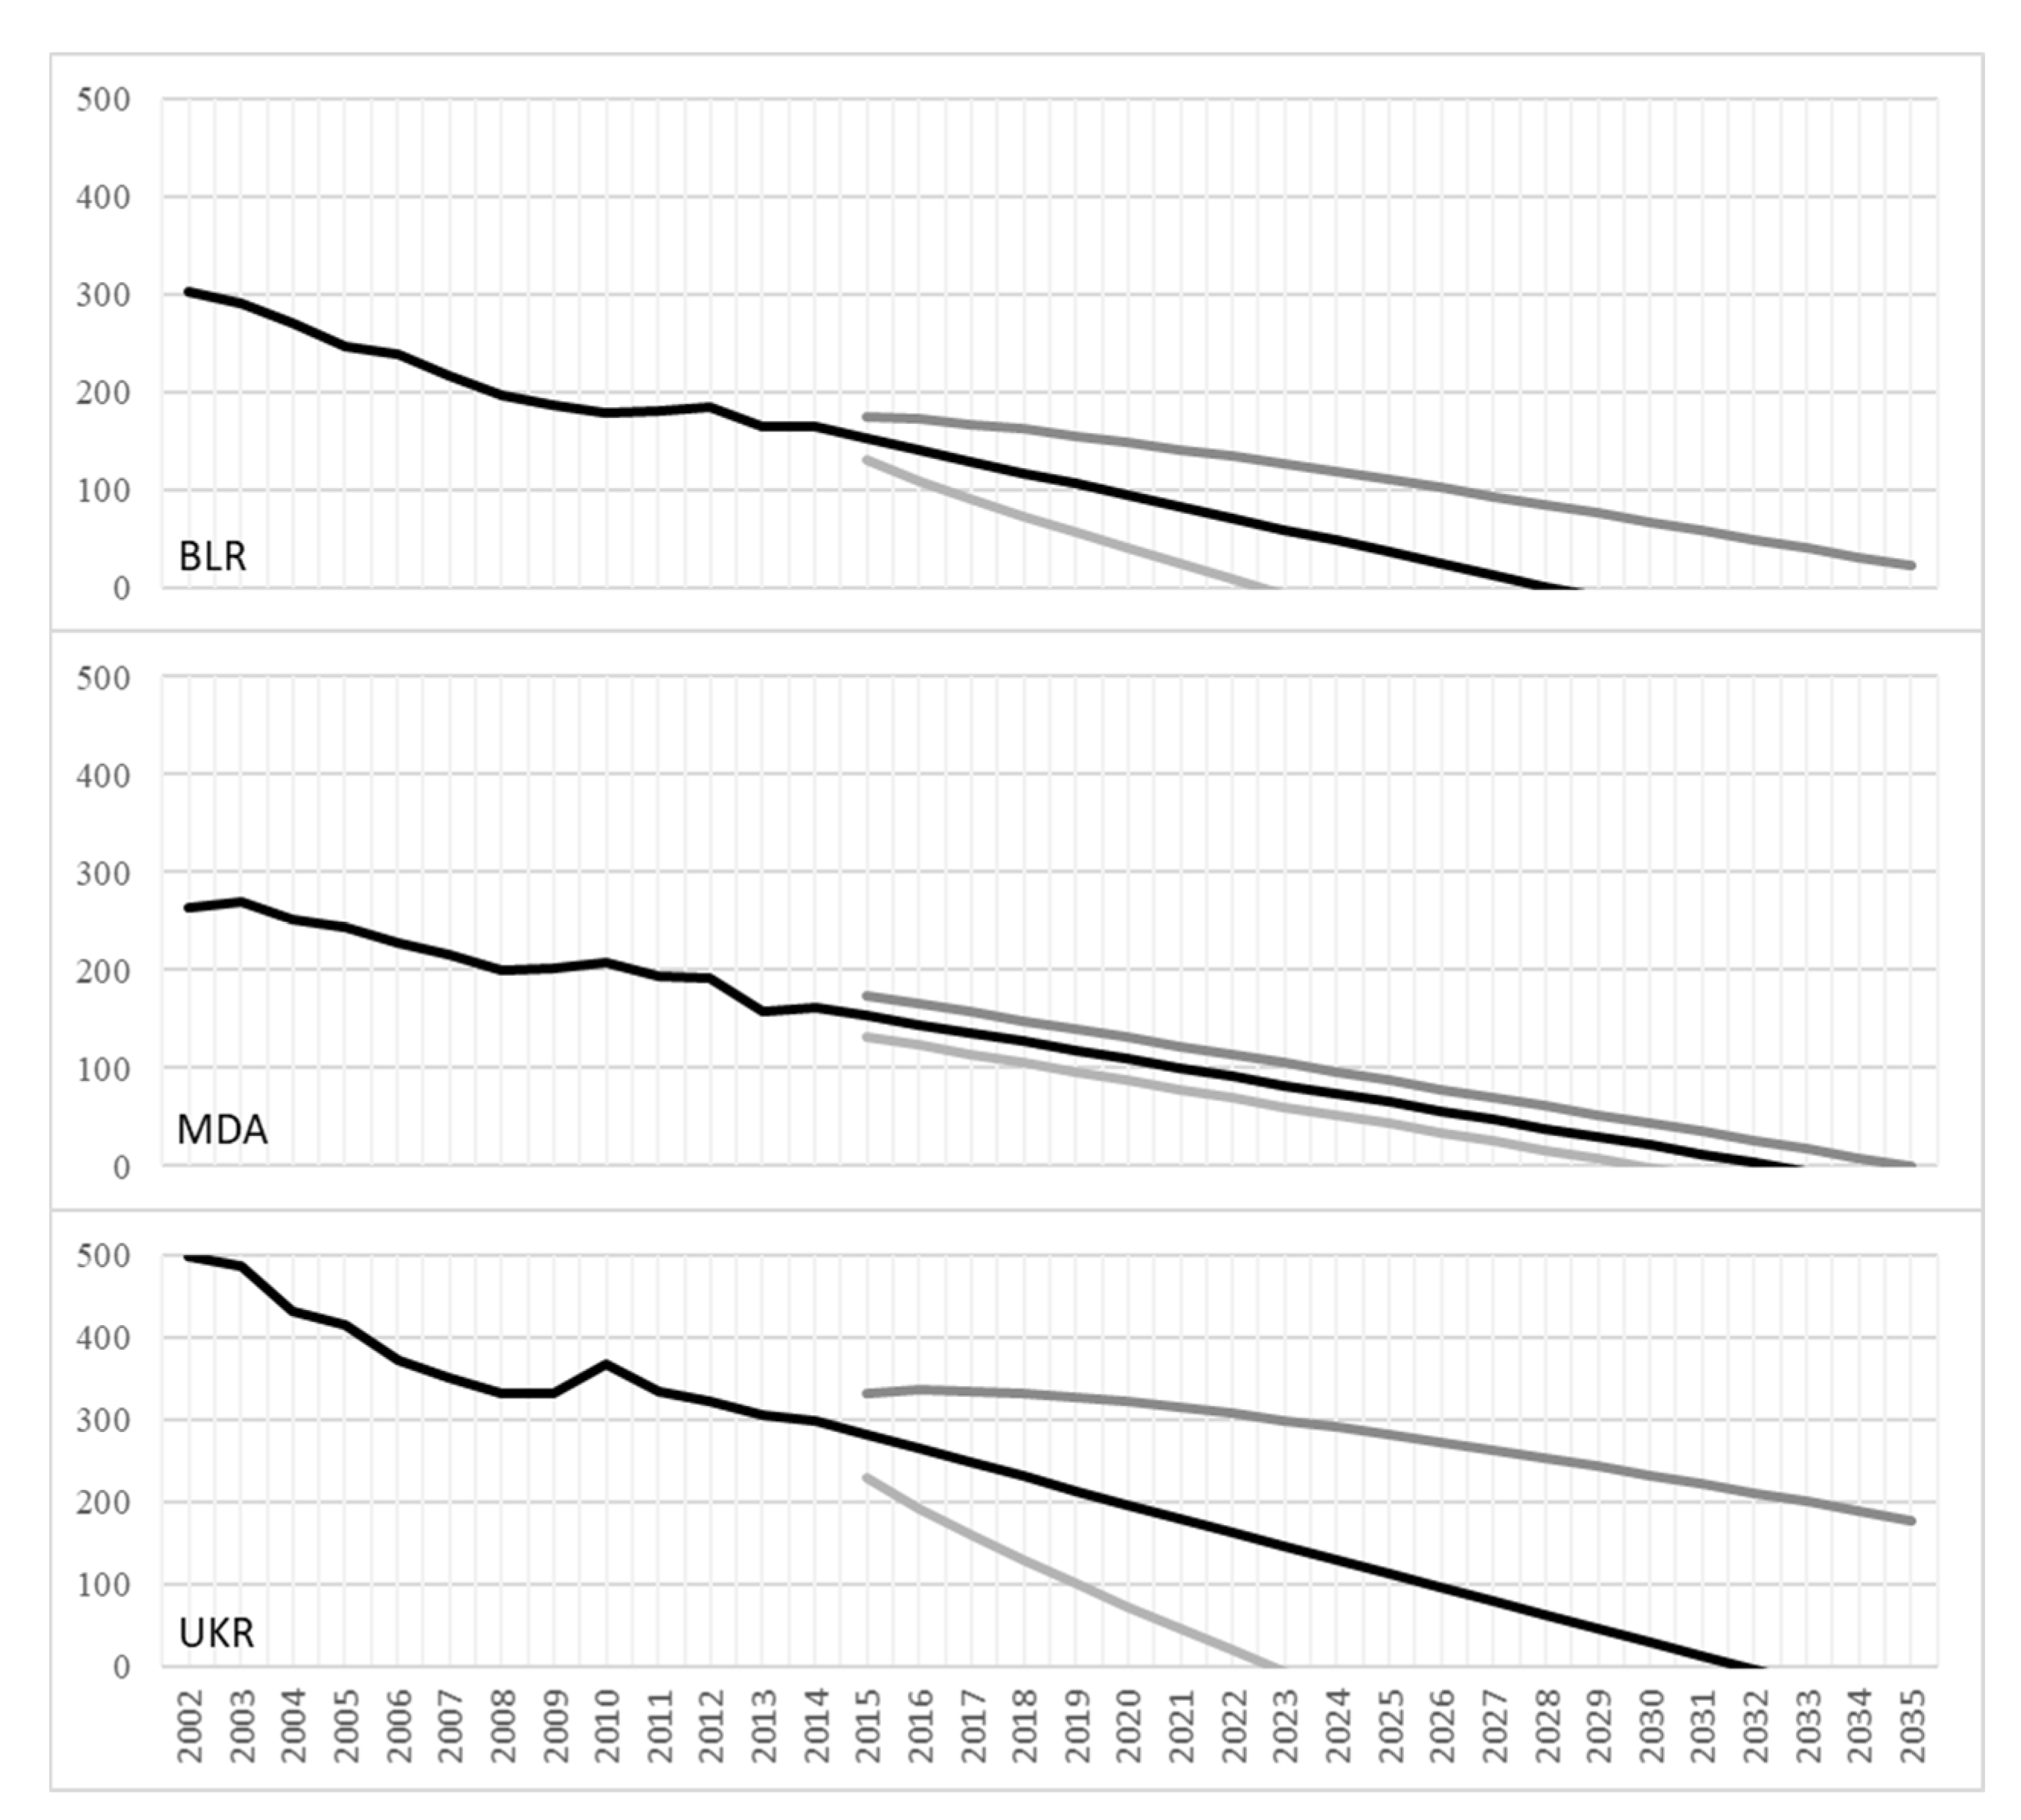
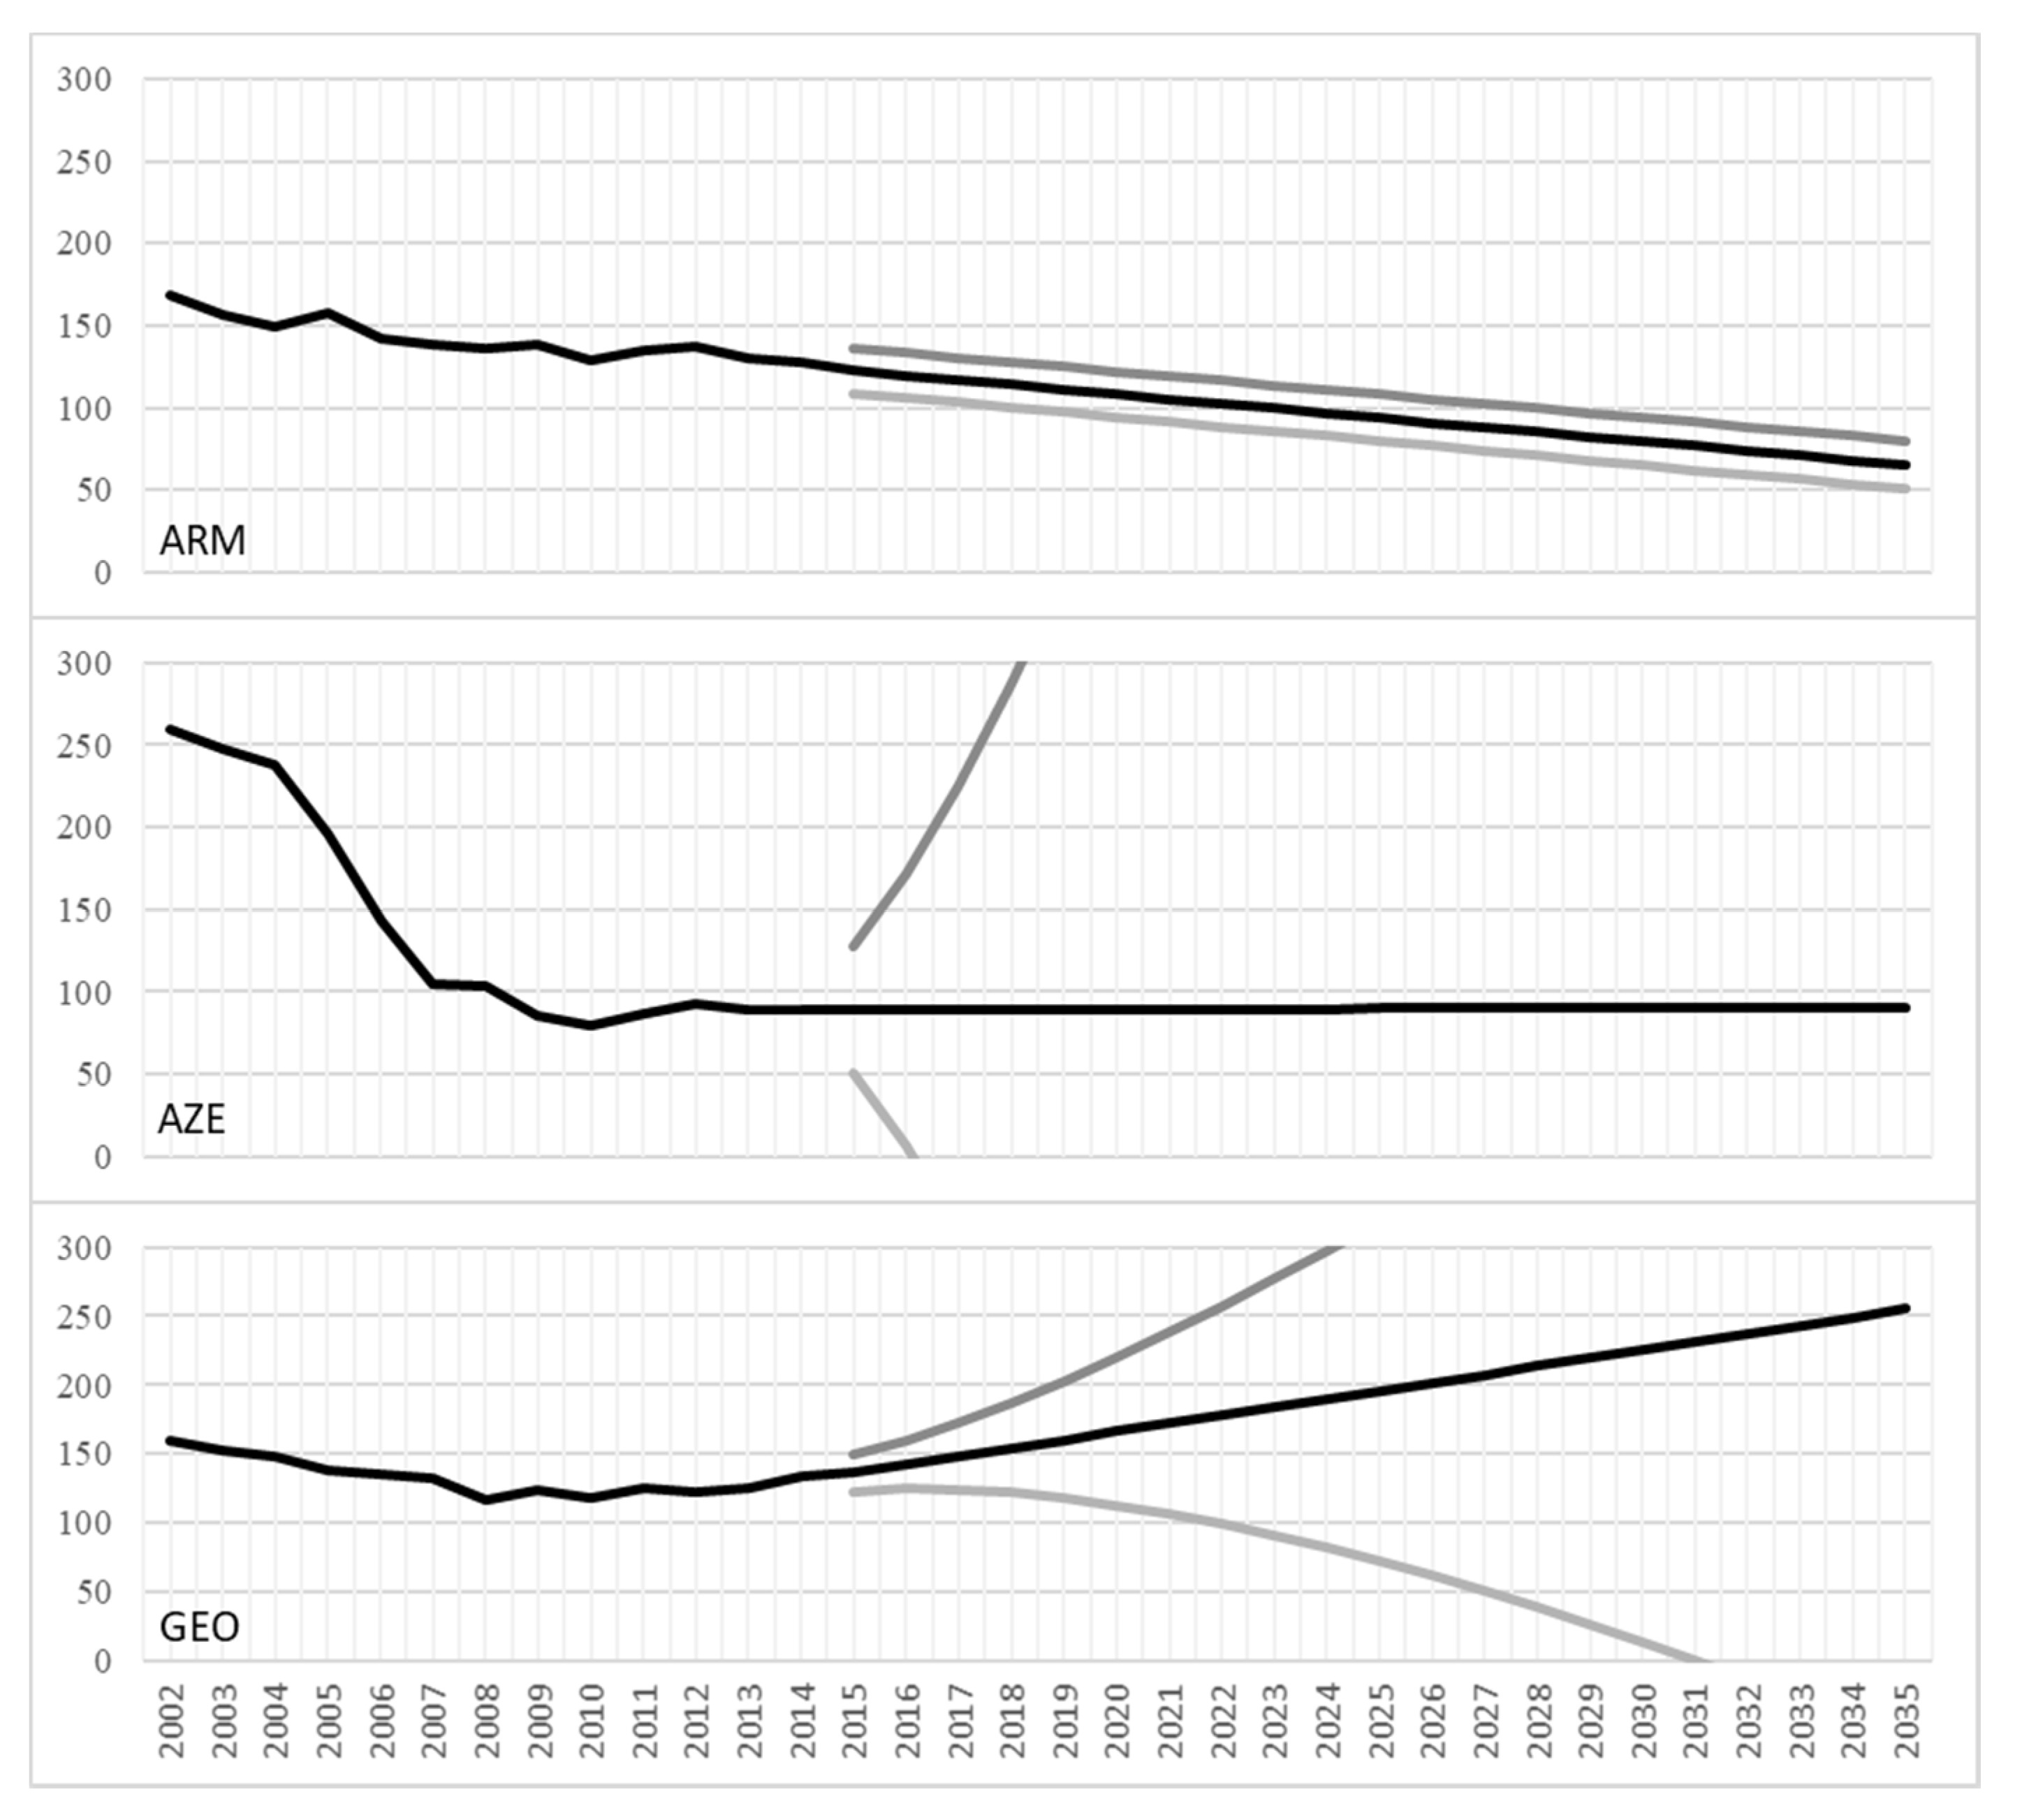
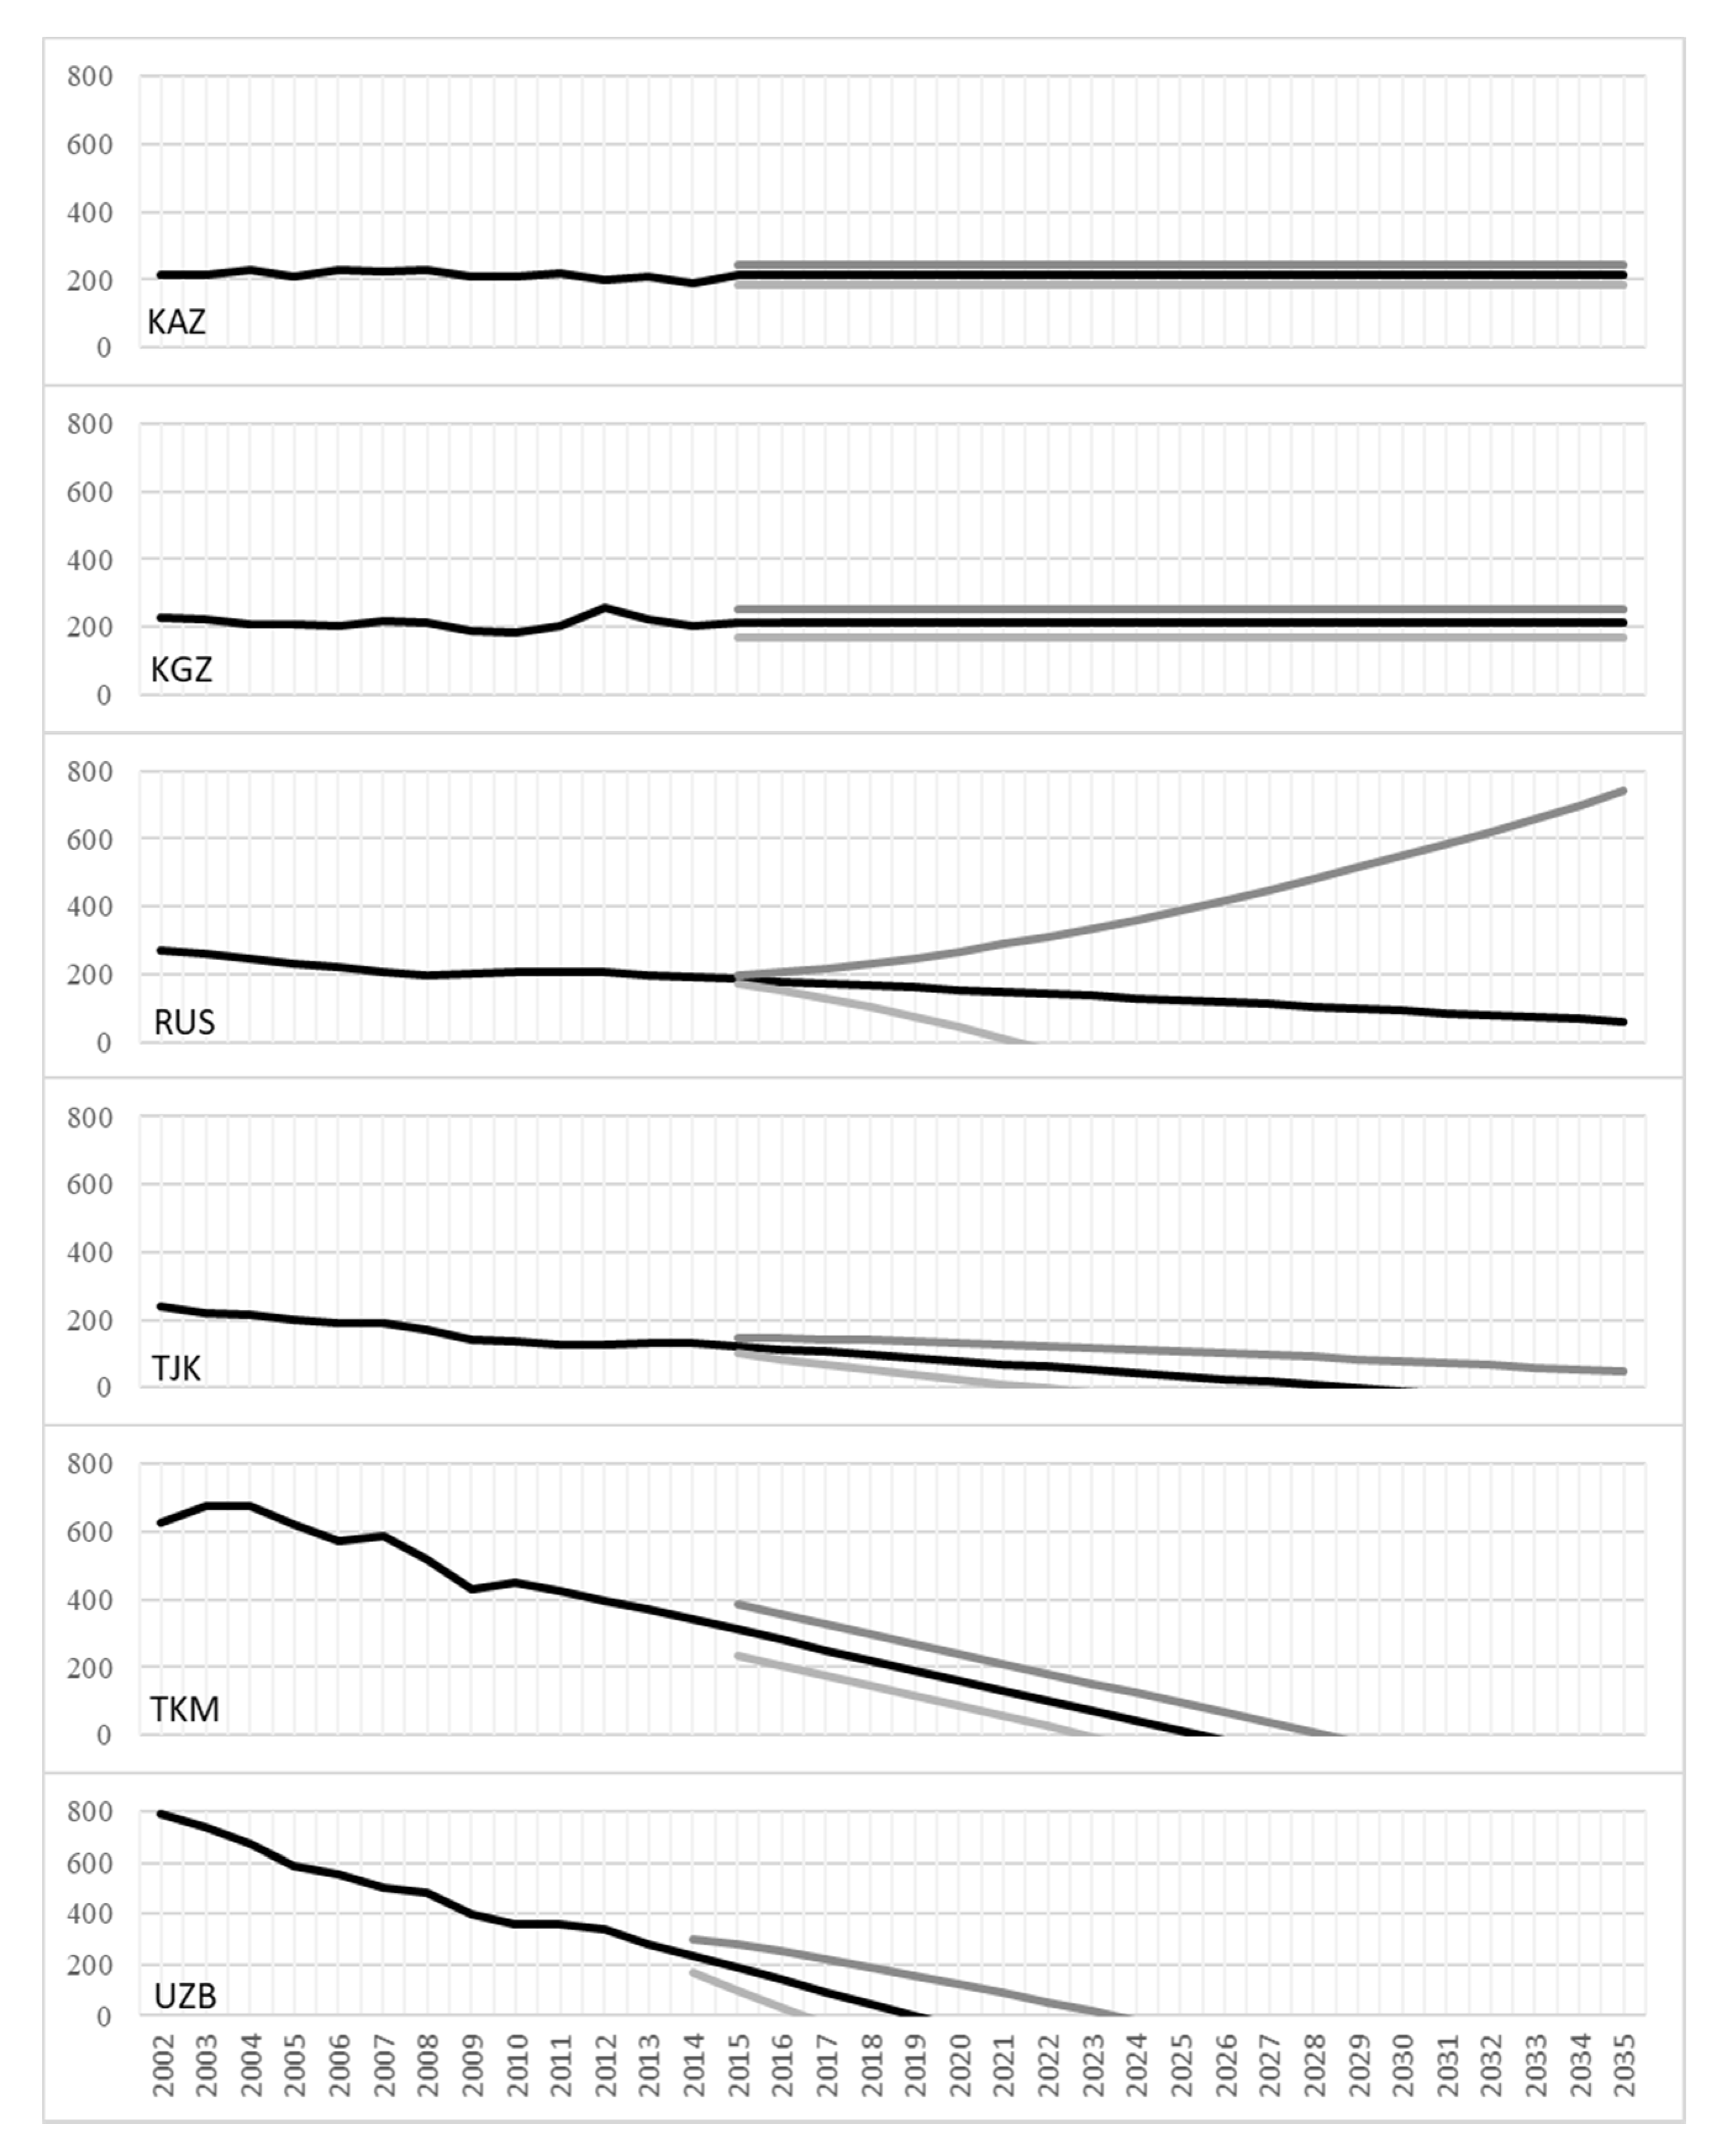
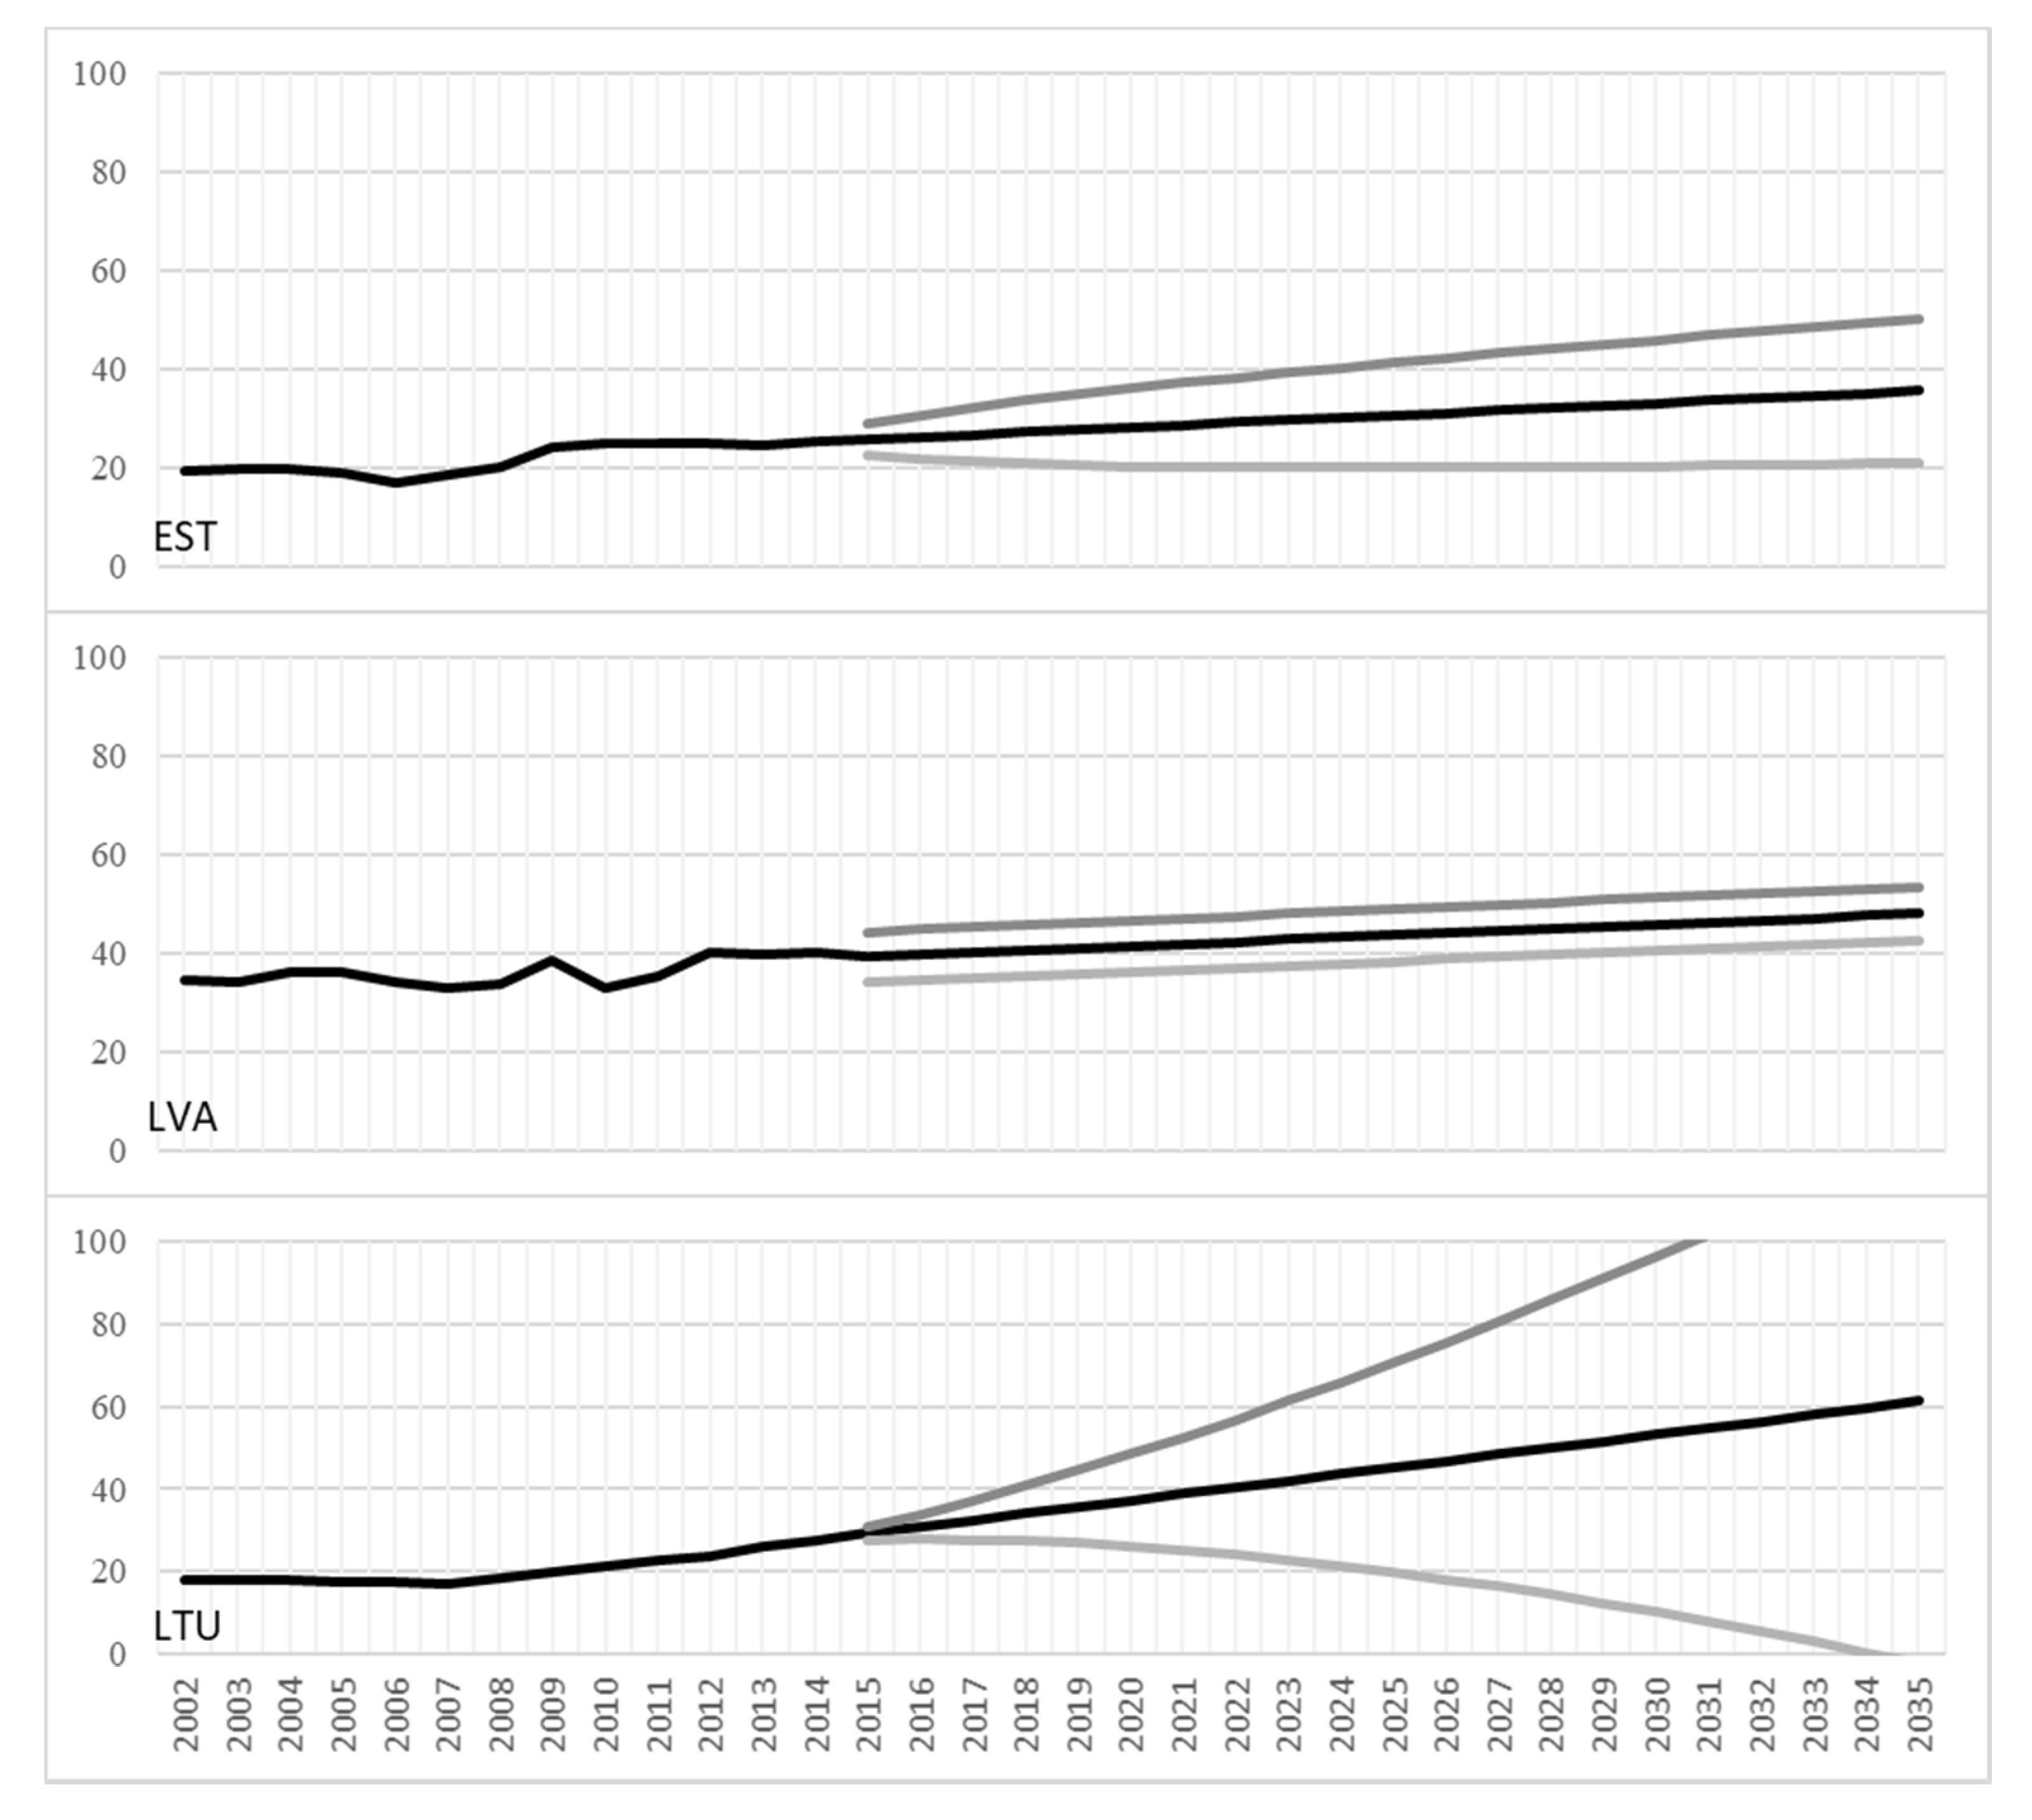
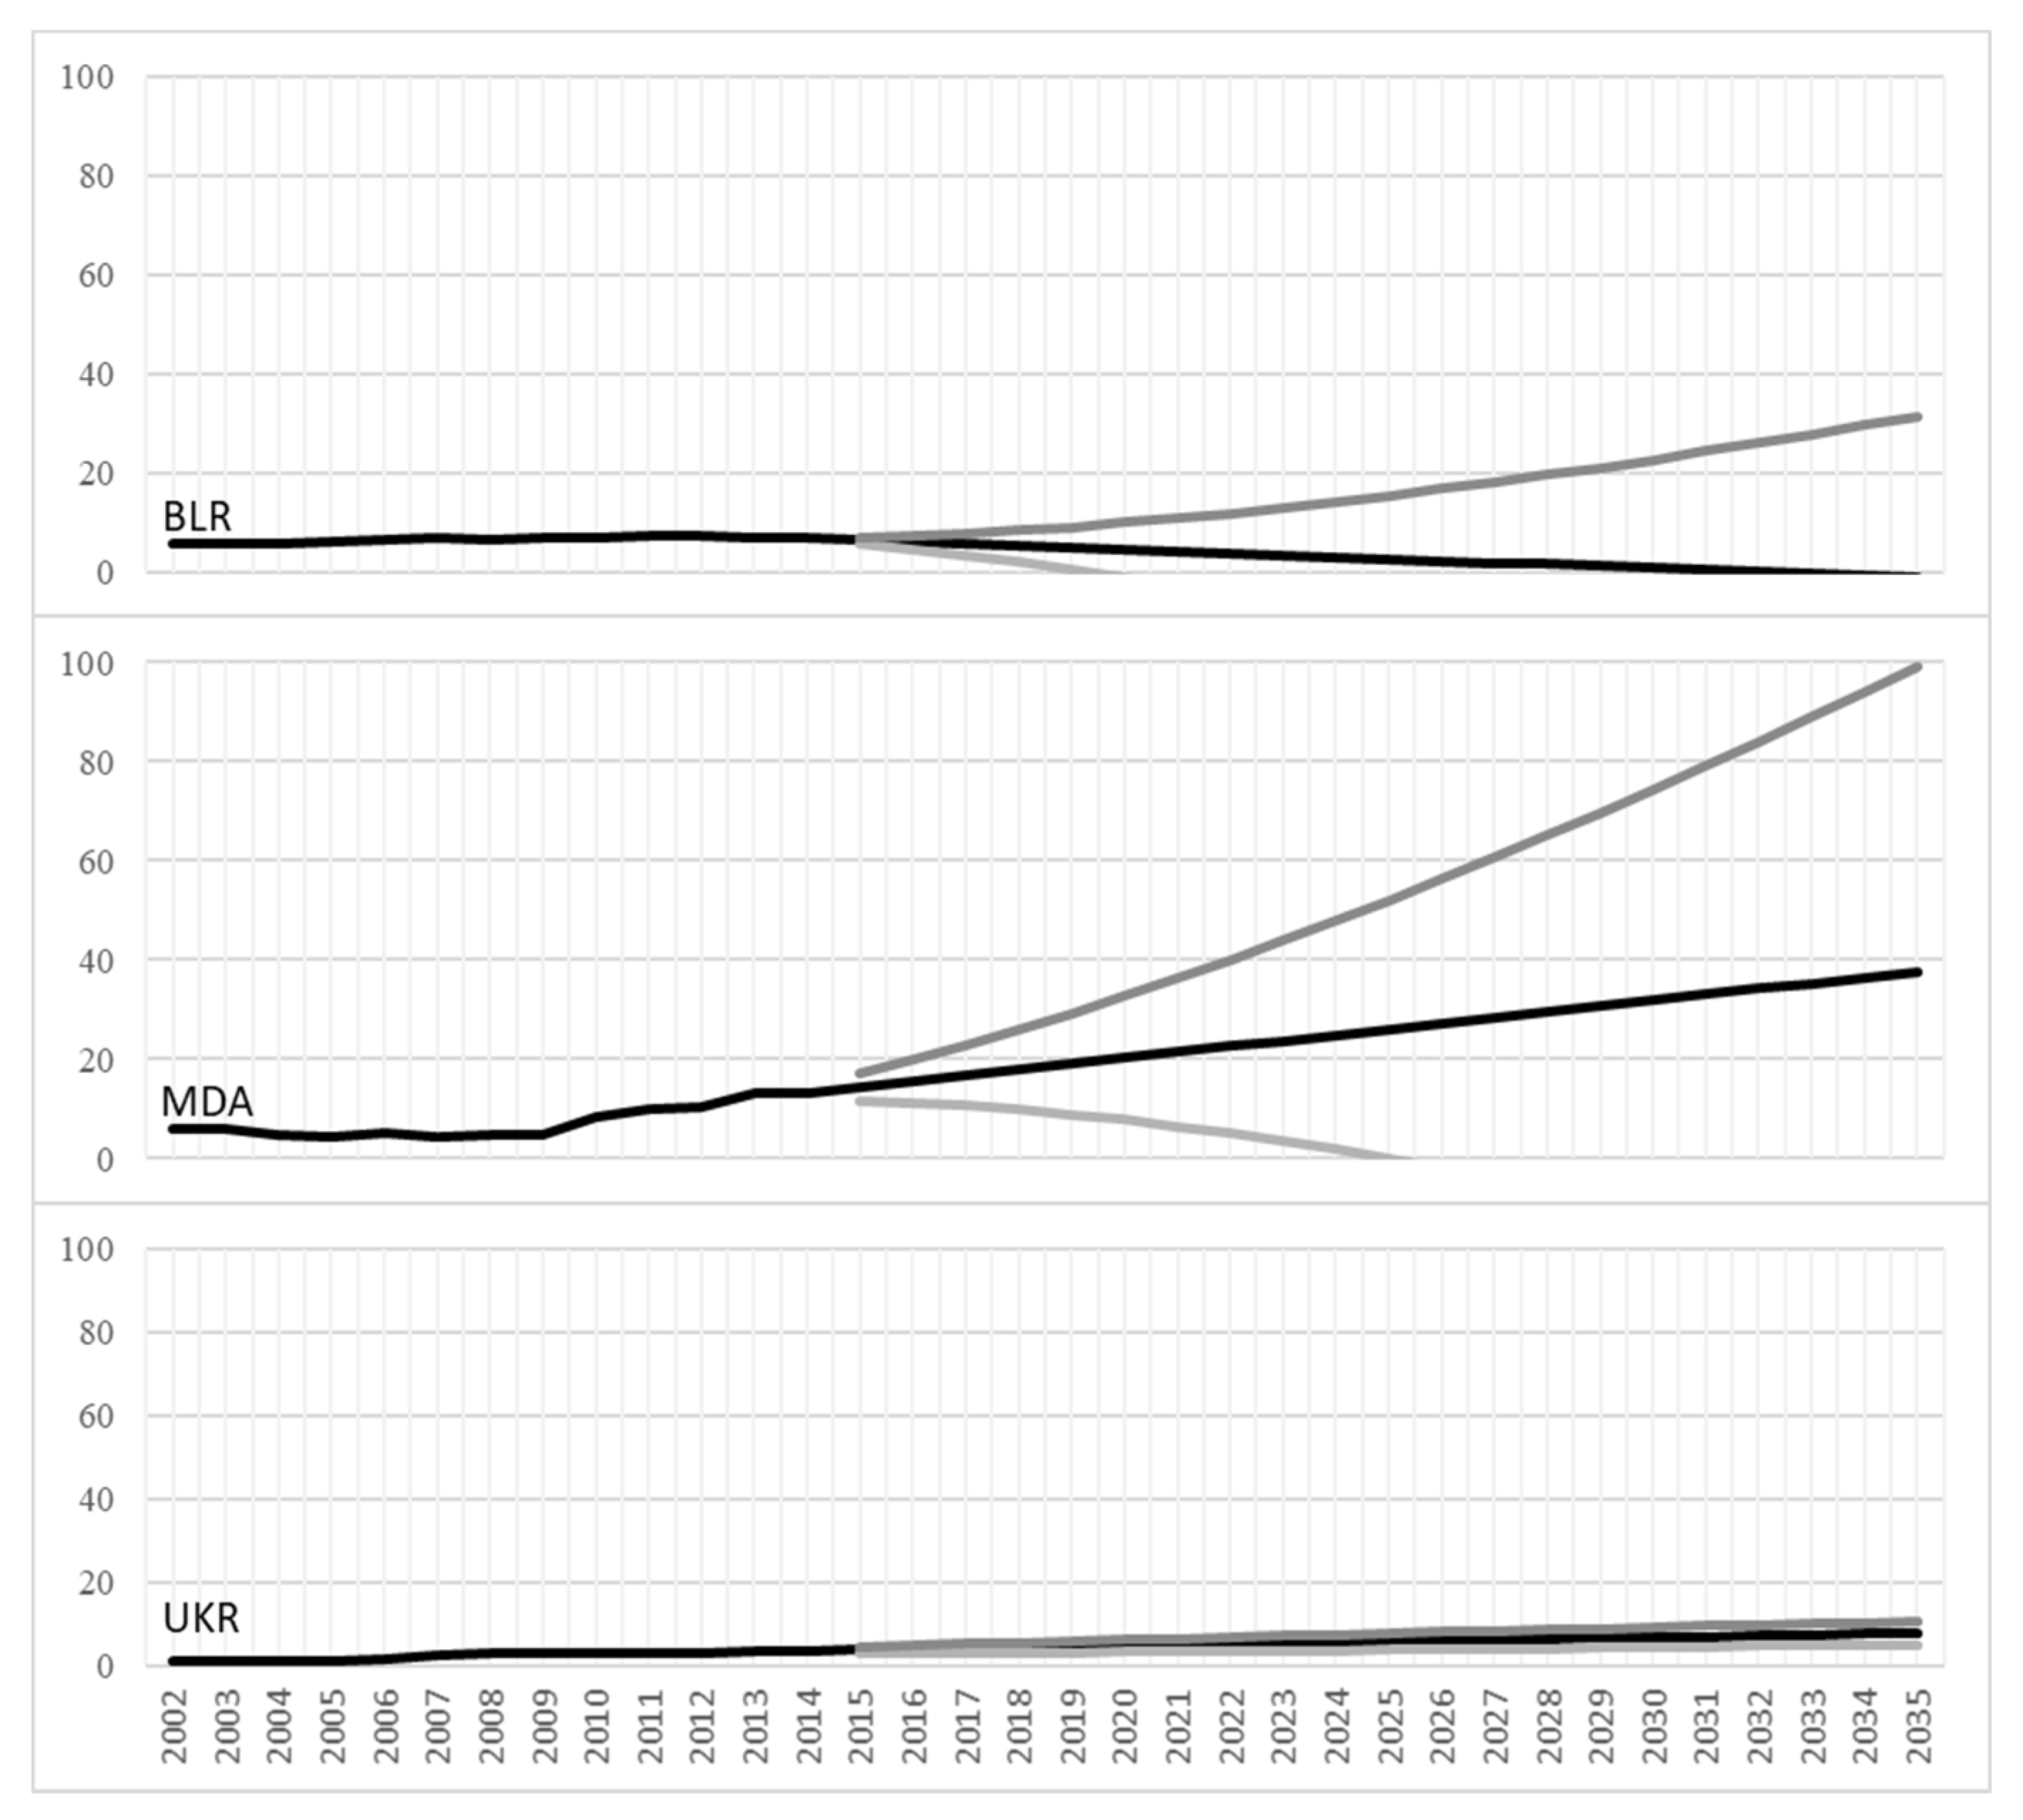
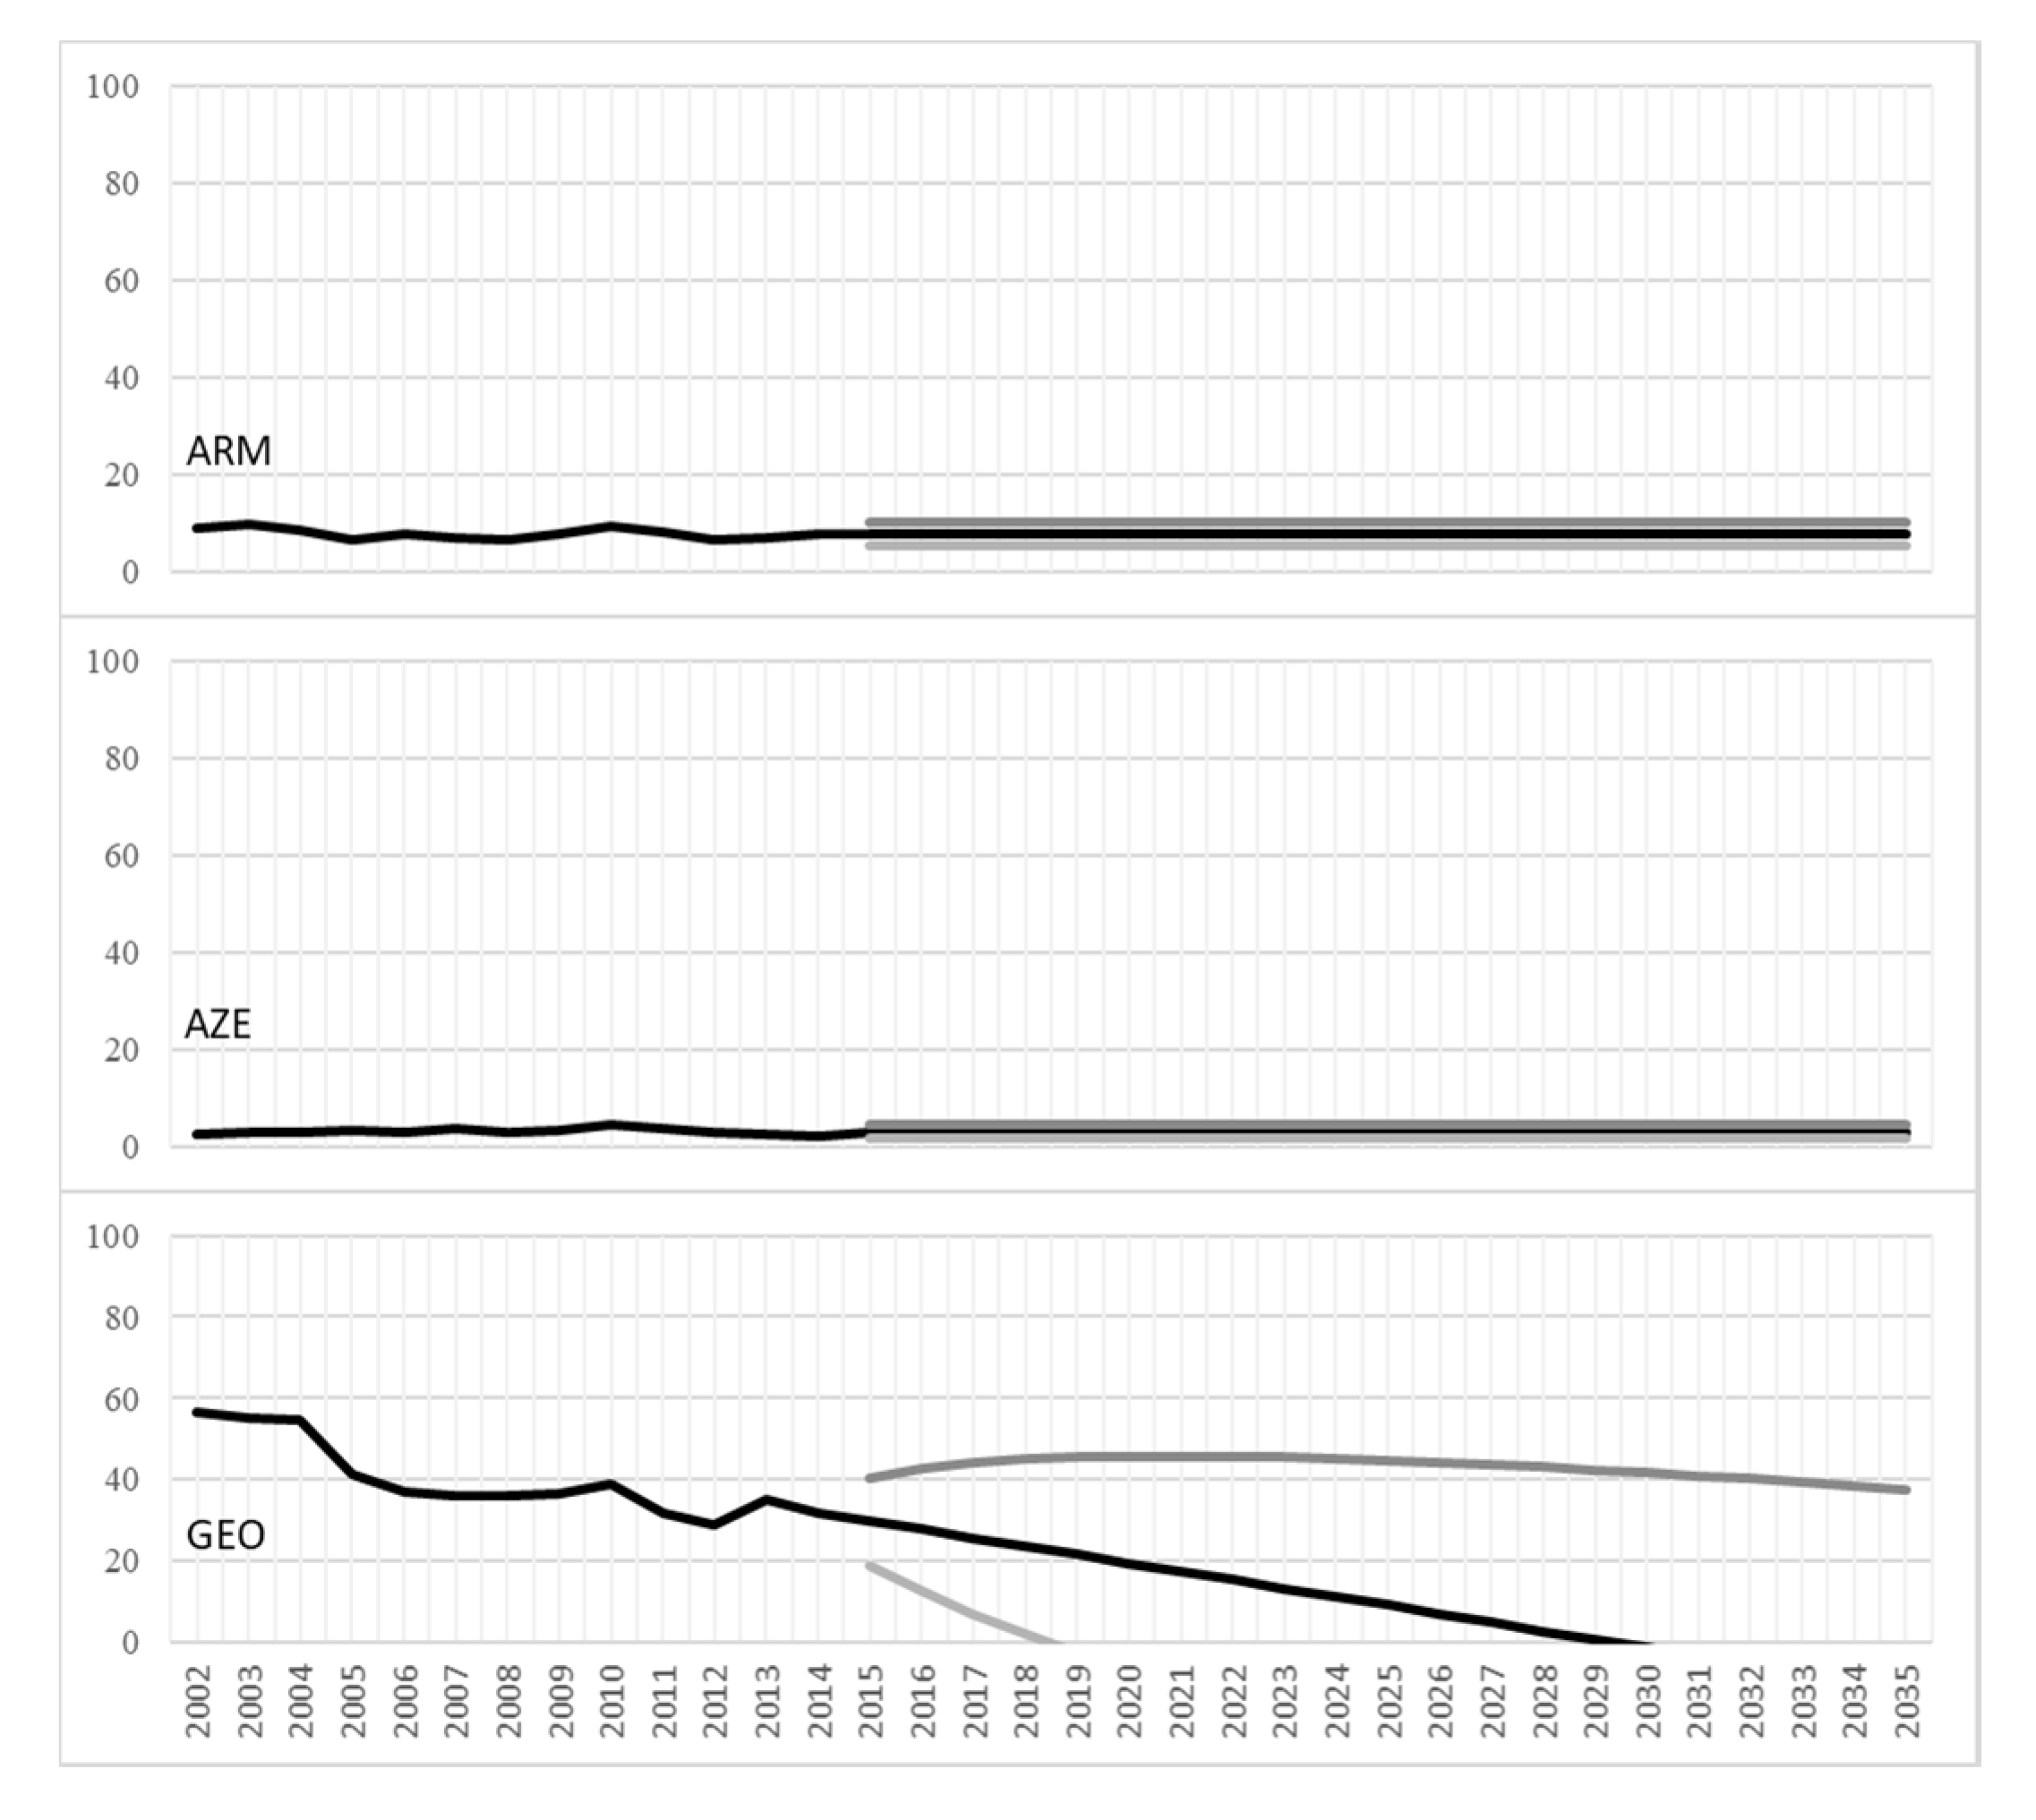
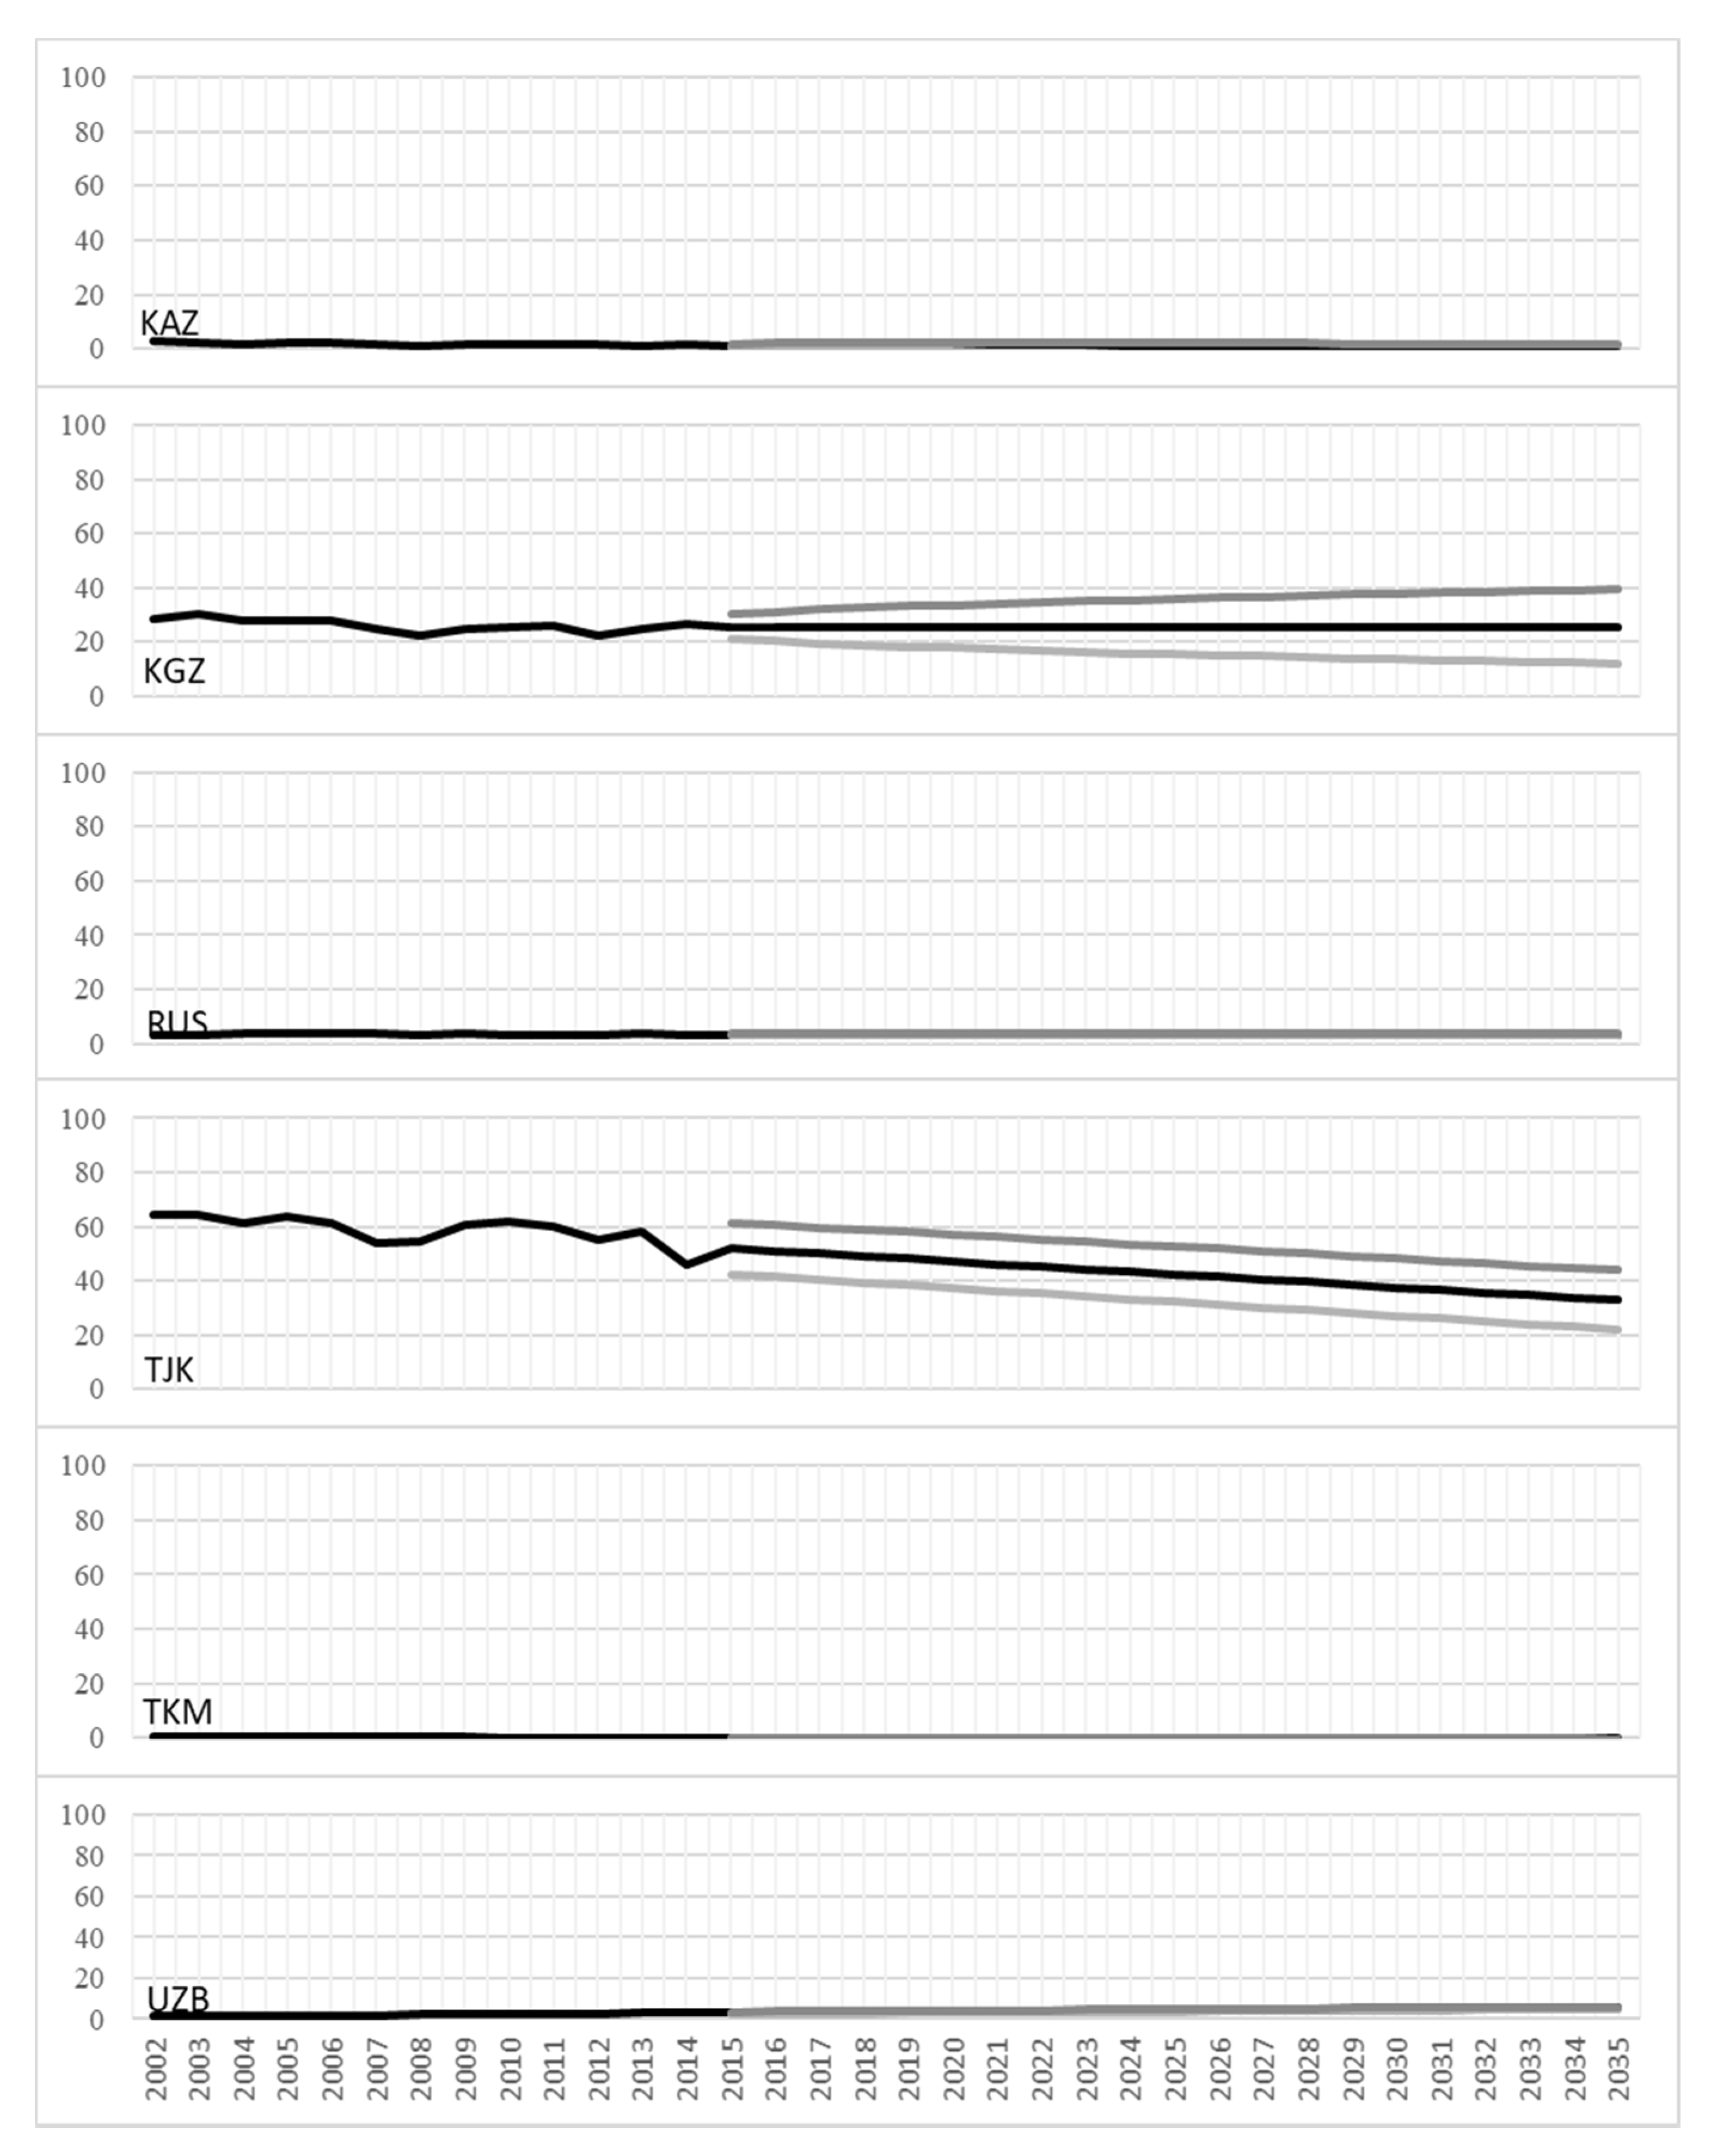
4.2. Forecasts of Carbon Dioxide Emissions by 2035

All Post-Soviet countries are parties of the Paris Agreement and have presented their proposed contributions to prevent climate change, defined at the national level (INDC), shown in Table 1. The targets of carbon emissions are rather different among Post-Soviet countries. One part of them, namely Moldova, Tajikistan, and Armenia, committed to reducing carbon emissions to 1.5–2 metric tons per capita. Meanwhile, the commitments of Estonia, Kazakhstan, and the Russian Federation by 2030 are the highest—over 10 metric tons per capita. It must be noted that commitments of individual countries need to be taken into their respective contexts, as some countries can reduce their emissions more effectively than others, and transitioning to green energy might be difficult for some and easier for others. We ran time series predictions, allowing the software to choose the most appropriate algorithm for computing confidence intervals, thus allowing for a clearer evaluation of the forecasts. For the sake of simplicity, we present our data visually and sorted by regions.
Figure 1 shows CO2 emissions roughly staying the same for Latvia and Lithuania, yet the confidence intervals suggest that bot Latvia and Lithuania may be able to reach their goals by 2030, while Estonia shows a steady increase in CO2 emissions if the current trend continues. Therefore, if the Baltic States do not implement tools to stop the growth of carbon emissions and take action to reduce them, their targets will not be achieved. Liobikienė and Butkus [3] also stated that for all EU countries to achieve the 2030 targets more efforts to implement the Paris agreement targets are required. Consequently, these countries should implement a more restrictive climate change policy to reduce carbon emissions, and one way of achieving this is to introduce new incentives for green energy production and to make it more competitive when compared to fossil fuels. Tax increases for polluters with a clear association between the act of pollution and its price, as well as tax reductions for sustainable industries, may help to promote green innovations and technologies, and even contribute to the reduction of the negative environmental impact.
Forecasts of the carbon dioxide emissions by 2030 (Figure 2) of the Post-Soviet countries of Eastern Europe (Belarus, Moldova, and Ukraine) showed that Moldova and Ukraine will be able to fulfill their climate obligations because of their already low emissions. Moldova shows a slight growth of emissions if the trend continues, yet the confidence intervals allow for both positive and negative change well within their commitments. In Ukraine we observe a decline in emissions during the analyzed period, which is likely due to the Financial Crisis of 2007–2008 as well as the military intervention in the Eastern part of Ukraine and the annexation of the Crimean peninsula by the Russian Federation in 2014. It is believed that the rapid decline of carbon dioxide emissions is connected to the collapse of the main Ukrainian industrial sector, which is temporarily not controlled by Ukraine. Therefore, if this trend continues, Ukraine will have successfully added to climate change mitigation, even if this is a consequence of its geopolitical struggles. The prediction trend for Belarus is quite uncertain, and it is possible that Belarus will not be able to accomplish its goal for CO2 emission reduction. If Belarus continues to rely on fossil fuels and does not take action to incentivize sustainable industry, its emissions will likely only increase due to normal economic growth.
Forecasts of carbon dioxide emissions up to 2035 for the Post-Soviet countries of Transcaucasia (Armenia, Azerbaijan, Georgia) suggest that only Azerbaijan will be able to meet the CO2 emission goals, while a steady increase in emissions is predicted for Armenia and Georgia (Figure 3). It is only natural that economic growth in the region and increased industrial activity, coupled with fossil fuels being the cheapest energy option, lead to these trends. However, economic and industrial development might also help mitigate their emissions if relevant actions are taken by these countries to incentivize sustainable growth and green energy. While relying on fossil fuels might be cheaper in the short-term, incentivizing green energy and innovative industry that takes sustainability into account would likely benefit these countries in the long run, making them more competitive in international markets when consumers start to choose goods and services that are produced in a sustainable way. This period of potential growth is in itself a challenge, and the infrastructural solutions chosen by these countries will have a lasting impact. Thus, it would be reasonable to apply solutions that work in the future, taking into account worldwide trends of sustainable development and the increasing importance of sustainable energy and industry.
In the regions of Eurasia and Central Asia, only two countries show promising forecasts, namely Uzbekistan and Kazakhstan (Figure 4). However, we must note that the prediction for Kazakhstan is quite uncertain, and the trend is not very reliable. Ultimately, the outcomes for these countries will depend on whether they successfully transition from fossil fuels to green alternatives for energy production. Other countries, such as the Russian Federation, Turkmenistan, and Kyrgyzstan show quite reliable trends of emission growth, which are possibly due both to their economic and industrial development and to a lack of policy regulating emissions or incentivizing green energy options. It is likely that the aforementioned countries will not be able to achieve their emission goals by the agreed time.
One possible way of tackling the issue of increasing emissions while maintaining economic growth is to allow better conditions for foreign investment, focusing on companies that aim to develop sustainable industries in Eurasian and Central Asian countries. This would introduce a layer of economic competition with which local companies would be forced to deal with. They would be incentivized to shift their practices to more sustainable ones, thus resulting in both increased growth and sustainable development.
In summary, the forecasts of carbon dioxide emissions by 2035 (based on the 2002–2014 period) in Post-Soviet countries suggest that it will be difficult to achieve the planned emission targets in most of the countries. Only four investigated countries are likely to fulfill their climate change obligations (Table 1): Azerbaijan, Moldova, Tajikistan, and Ukraine. The growth of CO2 emissions is observed in almost all of the investigated countries, meaning that stronger action to mitigate this should be taken. While taxation should not be a go-to solution for any complex problem, rationally relating costs to actual pollution in order to make clear the link between emissions and lost capital would incentivize industries to pursue alternative solutions that are more sustainable. This could be coupled with incentives for businesses that operate in a sustainable manner and are participating in circular economies. Ultimately, positive change would require both a tax reform and the introduction of various safeguards and incentives, as well as widespread information and education on sustainability.

4.3. Forecasts of Energy Intensity by 2035

Strategic goals for reducing energy intensity by 2030 have been set only by the Post-Soviet countries members of the EU (Estonia, Latvia, Lithuania), Ukraine and Kazakhstan. Belarus and Russia have set their targets up to 2035 (Table 1). Analyzing energy intensity (energy consumption) targets in the Baltic States, we can see that only Lithuania will be able to fulfill its target of reducing energy intensity (Figure 5). In Lithuania, the highest reduction of energy intensity was observed during the analyzed period. It depends on a successful building renovation, which will minimize the loss of energy production and promote the modernization of the energy sector. Thus, Lithuania will be able to achieve its goal in 2025, and is expected to surpass it by 24.4% in 2030, if the current trend continues. However, we must note the wide confidence intervals of the forecast, indicating that the trend is not very robust and the outcome can be varied. Considering the remaining Baltic States, by 2030, Estonia is expected to exceed the planned level of energy intensity 1.2 times, and Latvia 1.1, which indicates that the targets of these countries will not be achieved. Therefore, in these countries, policymakers should promote energy efficiency and decouple energy consumption from economic development. Additionally, introducing effective incentives for sustainable development would likely aid in reducing energy consumption.
Forecasts indicate a predicted decline in energy intensity for the investigated Eastern European countries of Belarus, Moldova, and Ukraine (Figure 6). The trend for Ukraine is not as certain as other trends for the region, yet all trends point downward and suggest that these countries will be successful in reducing their energy consumption. Thus, Ukraine and Belarus, both of which are committed to the Paris agreement, will reach their planned targets. In the latter country, due to the successful energy policy implementation, energy intensity decreased sharply. According to these forecasts, Ukraine will be able to overachieve its target by about 76% by 2030. Achieving the planned target for Belarus is possible by 2025, and in 2035 it is expected to surpass it by about 44%. These forecasts, however, are only valid if everything else remains constant and the developmental trajectory continues. It would be unwise to interpret these predictions outside the geopolitical context and the global economy. Thus, a continued effort and relevant policy needs to be put in place to make sure these countries continue on the path to energy intensity reduction.
The forecasts of energy intensity for the region of Transcaucasia are mostly uncertain for Azerbaijan and Georgia, preventing any firm predictions of their energy intensity in the upcoming years, while the forecast for Armenia points toward a robust trend of declining energy intensity (Figure 7). At this stage, strong and future-oriented policy decisions might help in stabilizing the course Azerbaijan and Georgia are heading toward, but this should not be done at the expense of economic and industrial growth. Many innovations that reduce energy intensity lead to reduced costs for businesses, which might be an incentive for adopting green practices in the region. However, environmental education and a general societal interest in the issue would be needed to direct businesses toward sustainable practices and citizens toward lifestyles with lower energy intensity (e.g., using effective heating and conditioning solutions for their homes).
For the regions of Eurasia and Central Asia, most countries show a decline in their energy intensity, except Kazakhstan and Kyrgyzstan, where the trends show continued stability in their energy intensity (Figure 8). However, the trend for the Russian Federation does not seem to be very robust, making it hard to predict its energy intensity in the coming years. Nonetheless, even if the linear trends do continue in this direction, in Kazakhstan the energy intensity by 2030 will exceed its maximum planned level 1.1 times, which means that the target will not be achieved. The results of the energy intensity forecast up to 2035 for the Russian Federation show that by 2035 the allowable energy intensity level will likely be exceeded 1.7 times, which indicates the impossibility of the country fulfilling its target as well. Overall, while energy intensity is mostly decreasing in the region, the decrease needs to be even sharper for the countries to reach the sustainable energy intensity levels. One of the ways the countries of these regions could reduce their energy intensity is by preventing energy loss (e.g., renovating apartment buildings to make them more energy-efficient and improving their energy and heat transfer infrastructure).

4.4. Forecasts of the Share of Renewable Energy by 2035

Figure 9 indicates that, out of the three Baltic states, only Latvia will be able to reach 45% by 2030, and will reach its goal if the trend continues as forecasted. Considering that the share of renewable energy in Latvia in 2014 was one of the highest (40%), enhancing renewable energy by 5% during the coming decade does not look like an ambitious plan. However, in Latvia, where the bioeconomy strategy was approved in 2018, a further increase in the share of renewable energy is expected. In Estonia and Lithuania the trends indicate a growth of the share of renewable energy, yet this will be not be sufficient for them to reach their target goals by 2030. Based on our estimation, the level of renewable energy consumption in Estonia by 2030 will be equal to 37%, which is 5% less than its set target, and Lithuania will be able to increase its renewable energy consumption by 40%, which is 5% less than its target. The growth of the share of renewable energy consumption in these countries during the analyzed period was rather slow. Thus, these countries should consider economic incentives and decreasing “red tape” for green energy producers to make the business of renewable energy production more competitive and more attractive to entrepreneurs.
For the region of Eastern Europe, the predictions of the share of renewable energy are not optimistic (Figure 10). Belarus and Moldova show quite unreliable trends, while Ukraine shows a stable trend of very slow increase which is insufficient for the country to achieve its goals of increasing the share of renewable energy by 2030. This region has quite low initial infrastructure for renewable energy and is highly reliant on fossil fuels, making it hard to transition to renewable energy production, as it would require a massive investment by both the governments and private businesses. Allowing for healthy competition in the market of energy production and incentivizing businesses that produce energy from renewable sources would aid in the growth of this energy production sector, but it would require substantial changes in policy and taxes to attract investors to engage in renewable energy production.
As with Eastern Europe, Armenia and Azerbaijan show low initial percentages of renewable energy production, and the forecast indicates no change for these countries, while Georgia, having a larger initial share of renewable energy production, shows a declining trend (Figure 11). Generally, we see similar opportunities for these countries to increase their share of renewable energy by making renewable energy production more profitable through policy and economic incentives.
Forecasts for the regions of Eurasia and Central Asia show either no change or a decrease in the share of renewable energy production (Figure 12). Many countries in the region have low initial shares of renewable energy production and are reliant on the old infrastructure of fossil fuel energy to continue their economic growth and to stay competitive in the international market. This suggests that the transition toward renewable energy in this region would be extremely costly and would require massive changes in infrastructure. While transitioning toward renewable energy does seem like a difficult task, a lot of it can be addressed in a timely manner and with adequate planning. Rather than maintaining the old infrastructure and suffering its maintenance costs, long-term investments should be made to create new infrastructure that would allow for the replacement, over time, of the old one and would ultimately be more cost-effective. Additionally, many small transitions toward renewable energy can be made on a more local scale, but that would require both the policy basis for incentivizing green energy production and the willingness of society to exchange higher initial energy costs for environmental protection.
For now, only Post-Soviet countries that are members of the EU, Kazakhstan, and Ukraine have presented targets that are directed at increasing the share of renewable energy consumption by 2030. Belarus set its target up to 2035 (Table 1). The target of Moldova is still valid until 2020, and the development of the next strategy will begin in 2021. However, the Russian Federation does not plan to increase the share of renewable energy consumption, since no specific goal was presented in its updated Energy Strategy until 2035. Strategies to increase the share of renewable energy consumption in residual Post-Soviet countries are still under development. Considering the countries which have made the commitments, the targets of the share of renewable energy consumption are rather different. The members of the EU seek to achieve half of the renewable energy in final energy consumption by 2030. In Kazakhstan the target is to achieve one-third of the renewable energy consumption. Meanwhile, in Ukraine and Belarus, the renewable energy consumption targets are the least ambitious—only 17% and 8%, respectively. The increase of renewable energy consumption is a very important component of sustainable development, which can reduce the dependence on fossil fuels, thus allowing for more independence and stronger international bargaining and political positions because of their increased energy independence.
Based on the forecasts for the share of renewable energy use for Ukraine and Kazakhstan (Figure 10 and Figure 12), it can be noted that the goals of these two countries are too “optimistic” (Table 1). By 2030, Ukraine will be able to increase the share of energy obtained from renewable sources only up to about 7%, which is 9% less than the target set by the country. Overall, our results indicate the ineffective energy policies of many Post-Soviet countries.

5. Conclusions

Post-Soviet countries are a very specific country group, which for a long time was a single-party state. After the collapse of Soviet Union, countries chose different paths. Analyzing the tendencies of climate change policy, the results showed the huge differences in carbon emissions, energy intensity, and the share of renewable energy consumption among these countries. Considering carbon emissions, in almost all Post-Soviet countries (except Ukraine and Uzbekistan) a growth of emissions was observed during the analyzed period (2002–2014), particularly in Georgia and Tajikistan. The reduction of energy intensity in all Post-Soviet countries was observed as well, particularly in those where the level of energy intensity was lower. The share of renewable energy increased mostly in the countries of the EU and those that declared the willingness to join the EU. In residual Post-Soviet countries, the growth in the share of renewable energy was negligible or even negative.
The predictions on carbon emissions and energy consumption intensity through the level of economic development and the available green energy infrastructure were statistically significant for most countries, yet the predictors do not function universally well, and the direction of the effect changes in individual cases, suggesting that each country should be addressed individually and that governments should investigate how to best promote renewable energy and reduce carbon emissions on the local level, avoiding oversimplifications and broad generalizations. Changes in infrastructure and everyday life depend on a multitude of factors, many of which go beyond economic growth or infrastructure. Thus, it seems that societal change also needs to happen in order to make climate goals an achievable reality in Post-Soviet countries.
Post-Soviet countries adopted climate change policy strategies until 2030 (2035) relatively recently. The analysis of the possibility of achieving these policy targets showed that, in light of the past tendencies of the investigated countries, only a few would be able to fulfill their carbon emissions obligations by 2030 (2035) if the trends remain stable. Energy intensity targets will likely be achieved by Lithuania, Ukraine, and Belarus, but not by Latvia, Estonia, Kazakhstan, and the Russian Federation. The targets of the share of renewable energy will likely be achieved only in Latvia, where the target level is not very ambitious, but not in Estonia, Lithuania, Kazakhstan, Ukraine, or Belarus. Therefore, all Post-Soviet countries should increase their efforts to stop the growth of carbon emissions through restrictive climate change policy, tax reforms, incentivizing renewable energy production, reducing “red tape” for green businesses, and promoting energy efficiency and renewable energy consumption.

Author Contributions

All authors contributed equally in preparing this paper. All authors have read and agreed to the published version of the manuscript.

Funding

This research received no external funding.

Acknowledgments

We thank the anonymous reviewers for their constructive comments.

Conflicts of Interest

The authors declare no conflict of interest.

References

  1. Vaughan, A. Climate protest goes global. New Sci. 2019, 241, 7. [Google Scholar] [CrossRef]
  2. UNFCC. The Paris Agreement. Available online: https://unfccc.int/process-and-meetings/the-paris-agreement/the-paris-agreement (accessed on 13 February 2020).
  3. Liobikienė, G.; Butkus, M. The European Union possibilities to achieve targets of Europe 2020 and Paris agreement climate policy. Renew. Energy 2017, 106, 298–309. [Google Scholar] [CrossRef]
  4. Yuan, X.-C.; Sun, X.; Zhao, W.; Mi, Z.; Wang, B.; Wei, Y.-M. Forecasting China’s regional energy demand by 2030: A Bayesian approach. Resour. Conserv. Recycl. 2017, 127, 85–95. [Google Scholar] [CrossRef]
  5. Xu, L.; Chen, N.; Chen, Z. Will China make a difference in its carbon intensity reduction targets by 2020 and 2030? Appl. Energy 2017, 203, 874–882. [Google Scholar] [CrossRef]
  6. Li, F.; Xu, Z.; Ma, H. Can China achieve its CO2 emissions peak by 2030? Ecol. Indic. 2018, 84, 337–344. [Google Scholar] [CrossRef]
  7. Tan, X.; Dong, L.; Chen, D.; Gu, B.; Zeng, Y. China’s regional CO2 emissions reduction potential: A study of Chongqing city. Appl. Energy 2016, 162, 1345–1354. [Google Scholar] [CrossRef]
  8. Niu, D.; Wang, K.; Wu, J.; Sun, L.; Liang, Y.; Xu, X.; Yang, X. Can China achieve its 2030 carbon emissions commitment? Scenario analysis based on an improved general regression neural network. J. Clean. Prod. 2020, 243, 118558. [Google Scholar] [CrossRef]
  9. Zeng, S.; Chen, J. Forecasting the Allocation Ratio of Carbon Emission Allowance Currency for 2020 and 2030 in China. Sustainability 2016, 8, 650. [Google Scholar] [CrossRef] [Green Version]
  10. Brizga, J.; Feng, K.; Hubacek, K. Drivers of CO2 emissions in the former Soviet Union: A country level IPAT analysis from 1990 to 2010. Energy 2013, 59, 743–753. [Google Scholar] [CrossRef]
  11. Schierhorn, F.; Kastner, T.; Kuemmerle, T.; Meyfroidt, P.; Kurganova, I.; Prishchepov, A.V.; Erb, K.-H.; Houghton, R.A.; Müller, D. Large greenhouse gas savings due to changes in the post-Soviet food systems. Environ. Res. Lett. 2019, 14, 065009. [Google Scholar] [CrossRef]
  12. Bae, J.H.; Li, D.D.; Rishi, M. Determinants of CO2 emission for post-Soviet Union independent countries. Clim. Policy 2016, 17, 591–615. [Google Scholar] [CrossRef]
  13. Jorgenson, A.; Schor, J. Income Inequality and Carbon Emissions in Post-Soviet Nations, 1992–2009. Ekonom 2017, 96, 33–43. [Google Scholar] [CrossRef]
  14. Barrett, T.; Feola, G.; Khusnitdinova, M.; Krylova, V. Adapting Agricultural Water Use to Climate Change in a Post-Soviet Context: Challenges and Opportunities in Southeast Kazakhstan. Hum. Ecol. 2017, 45, 747–762. [Google Scholar] [CrossRef] [Green Version]
  15. Ashley, L.; Zhumanova, M.; Isaeva, A.; Dear, C. Examining changes in local adaptive capacity resulting from climate change adaptation programming in rural Kyrgyzstan. Clim. Dev. 2015, 8, 281–287. [Google Scholar] [CrossRef]
  16. Bruno, A. Climate history of Russia and the Soviet Union. Wiley Interdiscipl. Rev. Clim. Chang. 2018, 9, 534. [Google Scholar] [CrossRef]
  17. IEA. Energy Policies Beyond IEA Countries: Ukraine 2012. Available online: https://www.iea.org/reports/energy-policies-beyond-iea-countries-ukraine-2012 (accessed on 13 February 2020).
  18. Child, M.; Breyer, C.; Bogdanov, D.; Fell, H.-J. The role of storage technologies for the transition to a 100% renewable energy system in Ukraine. Energy Procedia 2017, 135, 410–423. [Google Scholar] [CrossRef]
  19. Moya, J.A.; Pardo, N. The potential for improvements in energy efficiency and CO2 emissions in the EU27 iron and steel industry under different payback periods. J. Clean. Prod. 2013, 52, 71–83. [Google Scholar] [CrossRef]
  20. Pardo, N.; Moya, J.A. Prospective scenarios on energy efficiency and CO2 emissions in the European Iron & Steel industry. Energy 2013, 54, 113–128. [Google Scholar]
  21. Streimekiene, D. The impact of international GHG trading regimes on penetration of new energy technologies and feasibility to implement EU Energy and Climate Package targets. Renew. Sustain. Energy Rev. 2012, 16, 2172–2177. [Google Scholar] [CrossRef]
  22. Holt, L.; Galligan, M. Energy efficiency policies as part of carbon reduction efforts: Lessons from the EU for the U.S. Electr. J. 2013, 26, 33–42. [Google Scholar] [CrossRef]
  23. Blesl, M.; Kobert, T.; Bruchof, D.; Kuder, R. Effects of climate and energy policy related measure and targets on the future structure of the European energy system in 2020 and beyond. Energy Policy 2010, 38, 6278–6292. [Google Scholar] [CrossRef]
  24. Siitonen, S.; Tuomaala, M.; Suominen, M.; Ahtila, P. Implications of process energy efficiency improvements for primary energy consumption and CO2 emissions at the national level. Appl. Energy 2010, 87, 2928–2937. [Google Scholar] [CrossRef]
  25. Özbuğday, F.C.; Erbas, B.C. How effective are energy efficiency and renewable energy in curbing CO2 emissions in the long run? A heterogeneous panel data analysis. Energy 2015, 82, 734–745. [Google Scholar] [CrossRef]
  26. Wang, Q.; Chiu, Y.H.; Chiu, C.R. Driving factors behind carbon dioxide emissions in China: A modified production theoretical decomposition analysis. Energy Econ. 2015, 51, 252–260. [Google Scholar] [CrossRef]
  27. Liobikienė, G.; Butkus, M. Environmental Kuznets Curve of greenhouse gas emissions including technological progress and substitution effects. Energy 2017, 135, 237–248. [Google Scholar] [CrossRef]
  28. Liobikienė, G.; Butkus, M. Scale, composition, and technique effects through which the economic growth, foreign direct investment, urbanization, and trade affect greenhouse gas emissions. Renew. Energy 2019, 132, 1310–1322. [Google Scholar] [CrossRef]
  29. Picazo-Tadeo, A.J.; Castillo-Gimenez, J.; Beltr an-Esteve, M. An intertemporal approach to measuring environmental performance with directional distance functions: Greenhouse gas emissions in the European Union. Ecol. Econ. 2014, 100, 173–182. [Google Scholar] [CrossRef]
  30. Streimikiene, D.; Balezentis, T.; Krisciukaitienė, I. Promoting interactions between local climate change mitigation, sustainable energy development, and rural development policies in Lithuania. Energy Policy 2012, 50, 699–710. [Google Scholar] [CrossRef]
  31. Liobikienė, G.; Butkus, M.; Bernatonienė, J. Drivers of greenhouse gas emissions in the Baltic states: Decomposition analysis related to the implementation of Europe 2020 strategy. Renew. Sustain. Energy Rev. 2016, 54, 309–317. [Google Scholar] [CrossRef]
  32. Fernández González, P.; Landajo, M.; Presno, M.J. The driving forces behind changes in GHG emission levels in EU-27. Differences between member states. Environ. Sci. Policy 2014, 38, 11–16. [Google Scholar] [CrossRef]
  33. Bӧlük, G.; Mert, M. Fossil & renewable energy consumption, GHGs (greenhouse gases) and economic growth: Evidence from a panel of EU (European Union) countries. Energy 2014, 74, 439–446. [Google Scholar]
  34. Bӧlük, G.; Mert, M. The renewable energy, growth and environmental Kuznets curve in Turkey: An ARDL approach. Renew. Sustain. Energy Rev. 2015, 52, 587–595. [Google Scholar] [CrossRef]
  35. Marrero, G.A. Greenhouse gases emissions, growth and the energy mix in Europe. Energy Econ. 2010, 32, 1356–1363. [Google Scholar] [CrossRef]
  36. Dogan, E.; Seker, F. Determinants of CO2 emissions in the European Union: The role of renewable and non-renewable energy. Renew. Energy 2016, 94, 429–439. [Google Scholar] [CrossRef]
  37. Al-Mulali, U.; Ozturk, I.; Solarin, S.A. Investing the environmental Kuznets curve hypothesis in seven regions: The role of renewable energy. Ecol. Indic. 2016, 67, 267–282. [Google Scholar] [CrossRef]
  38. Baležentis, T.; Štreimikienė, D.; Melnikienė, R.; Zeng, S. Prospects of green growth in the electricity sector in Baltic States: Pinch analysis based on ecological footprint. Resources. Conserv. Recycl. 2019, 142, 37–48. [Google Scholar] [CrossRef]
  39. Bilgili, F.; Kocak, E.; Bulut, U. The dynamic impact of renewable energy consumption on CO2 emissions: A revised Environmental Kuznets Curve approach. Renew. Sustain. Energy Rev. 2016, 54, 838–845. [Google Scholar] [CrossRef]
  40. Menyah, K.; Wolde-Rufael, Y. CO2 emissions, nuclear energy, renewable energy and economic growth in the US. Energy Policy 2010, 38, 2911–2915. [Google Scholar] [CrossRef]
  41. Jaforullah, M.; King, A. Does the use of renewable energy sources mitigate CO2 emissions? A reassessment of the US evidence. Energy Econ. 2015, 49, 711–717. [Google Scholar] [CrossRef]
  42. EEA (European Environment Agency). Available online: https://www.eea.europa.eu/publications/ghg-trends-and-projections-2012 (accessed on 13 February 2020).
  43. Capros, P.; Tasios, N.; De Vita, A.; Mantzos, L.; Paroussos, L. Model-based analysis of decarbonising the EU economy in the time horizon to 2050. Energy Strategy Rev. 2012, 1, 76–84. [Google Scholar] [CrossRef]
  44. Höglund-Isaksson, L.; Winiwarter, W.; Purohit, P.; Rafaj, P.; Schöpp, W.; Klimont, Z. EU low carbon roadmap 2050: Potentials and costs for mitigation of non-CO2 greenhouse gas emissions. Energy Strategy Rev. 2012, 1, 97–108. [Google Scholar] [CrossRef]
  45. Höbler, N.; Löschel, A. The EU Decarbonisation Roadmap 2050 What way to walk? Energy Policy 2013, 55, 190–207. [Google Scholar] [CrossRef] [Green Version]
  46. Streimikiene, D.; Roos, I. GHG emission trading implications on energy sector in Baltic States. Renew. Sustain. Energy Rev. 2009, 13, 854–862. [Google Scholar] [CrossRef]
  47. Smit, A.B.; Hu, J.; Harmsen, R. Unravelling projected energy savings in 2020 of the EU Members States using decomposition analyzes. Energy Policy 2014, 74, 271–285. [Google Scholar] [CrossRef]
  48. Giacomarra, M.; Bono, F. European Union commitment towards RES market penetration: From the first legislative acts to the publication of the recent guidelines on State aid 2014/2020. Renew. Sustain. Energy Rev. 2015, 47, 218–232. [Google Scholar] [CrossRef] [Green Version]
  49. Wu, L.; Liu, S.; Liu, D.; Fang, Z.; Xu, H. Modelling and forecasting CO2 emissions in the BRICS (Brazil, Russia, India, China, and South Africa) countries using a novel multi-variable grey model. Energy 2015, 79, 489–495. [Google Scholar] [CrossRef]
  50. Samoilov, I.A.; Nakhutin, A.I. Estimation and medium-term forecasting of anthropogenic carbon dioxide and methane emission in Russia with statistical methods. Rus. Meteorol. Hydrol. 2009, 34, 348–353. [Google Scholar] [CrossRef]
  51. Pao, H.-T.; Fu, H.-C.; Yu, H.-C. Forecasting Russian renewable, nuclear, and total energy consumption using improved nonlinear grey Bernoulli model. Intern. J. Comput. Sci. Issues 2013, 10, 689–694. [Google Scholar]
  52. Kerimray, A.; Baigarin, K.; De Miglio, R.; Tosato, G. Climate change mitigation scenarios and policies and measures: The case of Kazakhstan. Clim. Policy 2015, 16, 332–352. [Google Scholar] [CrossRef]
  53. Xiong, C.; Yang, D.; Huo, J.; Zhao, Y. The relationship between energy consumption and economic growth and the development strategy of a low-carbon economy in Kazakhstan. J. Arid Land 2015, 7, 706–715. [Google Scholar] [CrossRef]
  54. Karatayev, M.; Clarke, M.L. Current energy resources in Kazakhstan and the future potential of renewables: A review. Energy Procedia 2014, 59, 97–104. [Google Scholar] [CrossRef]
  55. Karatayev, M.; Clarke, M.L. A review of current energy systems and green energy potential in Kazakhstan. Renew. Sustain. Energy Rev. 2016, 55, 491–504. [Google Scholar] [CrossRef]
  56. Hasanov, F.; Hunt, L.; Mikayilov, C. Modeling and Forecasting Electricity Demand in Azerbaijan Using Cointegration Techniques. Energy 2016, 9, 1045. [Google Scholar] [CrossRef] [Green Version]
  57. Gómez, A.; Dopazo, C.; Fueyo, N. The future of energy in Uzbekistan. Energy 2015, 85, 329–338. [Google Scholar] [CrossRef]
  58. Saidmamatov, O.; Salaev, S. Renewable energy potential of developing countries: The drivers towards a green economy (a case study from Uzbekistan). Int. J. Green Econ. 2014, 8, 134–143. [Google Scholar] [CrossRef]
  59. Diachuk, O. Forecasting and evaluation of direct GHG emissions with the use of “TIMES-UKRAINE” model. Mark. Forecast Mark. 2013, 4, 116–127. [Google Scholar]
  60. Kurbatova, T.; Khlyap, H. GHG emissions and economic measures for low carbon growth in Ukraine. Carbon Manag. 2015, 6, 7–17. [Google Scholar] [CrossRef]
  61. Rogelj, J.; den Elzen, M.; Höhne, N.; Fransen, T.; Fekete, H.; Winkler, H.; Meinshausen, M. Paris Agreement climate proposals need a boost to keep warming well below 2 °C. Nature 2016, 534, 631–639. [Google Scholar] [CrossRef] [PubMed] [Green Version]
  62. Höhne, N.; Kuramochi, T.; Warnecke, C.; Röser, F.; Fekete, H.; Hagemann, M.; Gonzales, S. The Paris Agreement: Resolving the inconsistency between global goals and national contributions. Clim. Policy 2016, 17, 16–32. [Google Scholar] [CrossRef]
  63. Yang, M.; Cela, B.; Yang, F. Innovative energy policy to transform energy systems in Ukraine. Mitig. Adapt. Strateg. Glob. Chang. 2019, 24, 907–939. [Google Scholar] [CrossRef]
  64. Chepeliev, M.; Diachuk, O.; Podolets, R. Economic Assessment of Low-Emission Development Scenarios for Ukraine. Limiting Global Warming to Well Below 2 °C. Energy 2018, 64, 277–295. [Google Scholar]
  65. Chernyak, O.; Kharlamova, G.; Stavytskyy, A. Energy Perspective 2030 for Ukraine in the Context of the EU Integration. Springer Proc. Bus. Econ. 2018, 64, 113–129. [Google Scholar]
  66. Diachuk, O.; Podolets, R.; Yukhymets, R.; Pekkoiev, V.; Balyk, O.; Simonsen, M. Long-Term Energy Modelling and Forecasting in Ukraine: Scenarios for the Action Plan of Energy Strategy of Ukraine until 2035; Final Report; Technical University of Denmark: Kyiv, Ukraine; Copenhagen, Denmark, 2019; pp. 2–52. [Google Scholar]
  67. The World Bank Data. Available online: https://data.worldbank.org/ (accessed on 16 February 2020).
  68. Eurostat. Available online: https://ec.europa.eu/eurostat/tgm/table.do?tab=table&init=1&language=en&pcode=sdg_07_10&plugin=1 (accessed on 16 February 2020).
  69. Intended Nationally Determined Contribution of the Republic of Belarus. Available online: http://minpriroda.gov.by/uploads/files/Belarus-INDC-Eng.pdf (accessed on 15 February 2020).
  70. The Concept of Energy Security by 2035 of the Republic of Belarus. Available online: http://www.government.by/ru/solutions/2337 (accessed on 15 February 2020).
  71. Intended Nationally Determined Contribution of the Republic of Moldova. Available online: https://www4.unfccc.int/sites/ndcstaging/PublishedDocuments/Republic%20of%20Moldova%20First/INDC_Republic_of_Moldova_25.09.2015.pdf (accessed on 15 February 2020).
  72. Intended Nationally Determined Contribution of the Republic of Ukraine. Available online: https://www4.unfccc.int/sites/ndcstaging/PublishedDocuments/Ukraine%20First/Ukraine%20First%20NDC.pdf (accessed on 15 February 2020).
  73. The Strategy of the State Environmental policy of Ukraine for the Period by 2030. Available online: https://zakon.rada.gov.ua/laws/show/2697-19#n14 (accessed on 15 February 2020).
  74. Intended Nationally Determined Contribution of the Russian Federation. Available online: https://www4.unfccc.int/sites/submissions/indc/Submission%20Pages/submissions.aspx (accessed on 15 February 2020).
  75. Russian Energy Strategy for the Period by 2035. Available online: https://ac.gov.ru/files/content/1578/11-02-14-energostrategy-2035-pdf.pdf (accessed on 15 February 2020).
  76. Intended Nationally Determined Contribution of the Republic of Armenia. Available online: https://www4.unfccc.int/sites/ndcstaging/PublishedDocuments/Armenia%20First/INDC-Armenia.pdf (accessed on 15 February 2020).
  77. Intended Nationally Determined Contribution of the Republic of Azerbaijan. Available online: https://www4.unfccc.int/sites/ndcstaging/PublishedDocuments/Azerbaijan%20First/INDC%20Azerbaijan.pdf (accessed on 15 February 2020).
  78. The CAREC Energy Strategy 2030. Available online: https://www.adb.org/sites/default/files/institutional-document/536941/carec-energy-strategy-2030.pdf (accessed on 15 February 2020).
  79. Intended Nationally Determined Contribution of the Republic of Georgia. Available online: https://www4.unfccc.int/sites/ndcstaging/PublishedDocuments/Georgia%20First/INDC_of_Georgia.pdf (accessed on 15 February 2020).
  80. Intended Nationally Determined Contributions of the Republic of Kazakhstan. Available online: https://www4.unfccc.int/sites/ndcstaging/PublishedDocuments/Kazakhstan%20First/INDC%20Kz_eng.pdf (accessed on 15 February 2020).
  81. Kazakhstan Transition to “Green Economy” Plan. Available online: https://policy.asiapacificenergy.org/sites/default/files/Concept%20on%20Transition%20towards%20Green%20Economy%20until%202050%20%28EN%29.pdf (accessed on 15 February 2020).
  82. Intended Nationally Determined Contributions of the Kyrgyz Republic. Available online: https://www4.unfccc.int/sites/submissions/INDC/Published%20Documents/Kyrgyzstan/1/Kyrgyzstan%20INDC%20_ENG_%20final.pdf (accessed on 15 February 2020).
  83. Intended Nationally Determined Contributions of the Republic of Tajikistan. Available online: https://www4.unfccc.int/sites/ndcstaging/PublishedDocuments/Tajikistan%20First/INDC-TJK%20final%20ENG.pdf (accessed on 15 February 2020).
  84. Intended Nationally Determined Contributions of the Republic of Turkmenistan. Available online: https://www4.unfccc.int/sites/ndcstaging/PublishedDocuments/Turkmenistan%20First/INDC_Turkmenistan.pdf (accessed on 15 February 2020).
  85. Intended Nationally Determined Contributions of the Republic of Uzbekistan. Available online: https://www4.unfccc.int/sites/ndcstaging/PublishedDocuments/Uzbekistan%20First/INDC%20Uzbekistan%2018-04-2017_Eng.pdf (accessed on 15 February 2020).
  86. Summary of the Commission Assessment of the Draft National Energy and Climate Plan 2021–2030 (Estonia). Available online: https://ec.europa.eu/energy/sites/ener/files/documents/necp_factsheet_ee_final.pdf (accessed on 15 February 2020).
  87. Summary of the Commission assessment of the draft National Energy and Climate Plan 2021–2030 (Latvia). Available online: https://ec.europa.eu/energy/sites/ener/files/documents/necp_factsheet_lv_final.pdf (accessed on 15 February 2020).
  88. Summary of the Commission Assessment of the Draft National Energy and Climate Plan 2021–2030 (Lithuania). Available online: https://ec.europa.eu/energy/sites/ener/files/documents/necp_factsheet_lt_final.pdf (accessed on 15 February 2020).
Figure 1. Forecasts of CO2 emissions in the Baltics (EU member states). Holt model was used in the case of Estonia; simple models were used for Latvia and Lithuania. Grey lines indicate 95% confidence intervals.
Sustainability 12 04558 g001
Figure 2. Forecasts of CO2 emissions in Eastern Europe. Holt model was used in the case of Belarus and Ukraine; an autoregressive integrated moving average (ARIMA) model was used for Moldova. Grey lines indicate 95% confidence intervals.
Sustainability 12 04558 g002
Figure 3. Forecasts of CO2 emissions in Transcaucasia. ARIMA model was used in the case of Armenia and Azerbaijan; Holt model was used for Georgia. Grey lines indicate 95% confidence intervals.
Sustainability 12 04558 g003
Figure 4. Forecasts of CO2 emissions in Eurasia and Central Asia. Brown model was used in the case of Tajikistan; Holt model was used for all other countries. Grey lines indicate 95% confidence intervals.
Sustainability 12 04558 g004
Figure 5. Forecasts of energy intensity (MTOE) in the Baltics. Holt model was used in the case of Estonia, a simple model was used for Latvia, and ARIMA model was used for Lithuania. Grey lines indicate 95% confidence intervals.
Sustainability 12 04558 g005
Figure 6. Forecasts of energy intensity (KOE) in Eastern Europe. ARIMA model was used in the case of Belarus and Ukraine, Holt model was used for Moldova. Grey lines indicate 95% confidence intervals.
Sustainability 12 04558 g006
Figure 7. Forecasts of energy intensity (KOE) in Transcaucasia. Holt model was used in the case of Armenia and Georgia, Brown model was used for Azerbaijan. Grey lines indicate 95% confidence intervals.
Sustainability 12 04558 g007
Figure 8. Forecasts of energy intensity (KOE) in Eurasia and Central Asia. Holt model was used in the case of Turkmenistan, Brown model was used for the Russian Federation, and all other models are ARIMA. Grey lines indicate 95% confidence intervals.
Sustainability 12 04558 g008
Figure 9. Forecast of the percentage share of renewable energy in total energy consumption in the Baltics (EU members). Holt model was used in the case of Latvia, Brown model was used for Lithuania, and ARIMA was used for Estonia. Grey lines indicate 95% confidence intervals.
Sustainability 12 04558 g009
Figure 10. Forecast of the percentage share of renewable energy in total energy consumption in Eastern Europe. Brown model was used in the cases of Belarus and Moldova; ARIMA model was used for Ukraine. Grey lines indicate 95% confidence intervals.
Sustainability 12 04558 g010
Figure 11. Forecast of the percentage share of renewable energy in total energy consumption in Transcaucasia. All models are ARIMA. Grey lines indicate 95% confidence intervals.
Sustainability 12 04558 g011
Figure 12. Forecast of the percentage share of renewable energy in total energy consumption in Eurasia and Central Asia. Holt model was used in the cases of Tajikistan and Uzbekistan, ARIMA model was used for Kazakhstan, the Russian federation, and Turkmenistan, and a simple model was used for Kyrgyzstan. Grey lines indicate 95% confidence intervals.
Sustainability 12 04558 g012
Table 1. The targets of climate change policies in Post-Soviet countries.
CountryCarbon Emissions TargetsEnergy Intensity (EI)/Energy Consumption TargetsRenewable Energy (RE) Targets
Eastern Europe
BelarusReduce CO2 emissions by 28%, compared to the 1990 level until 2030 [69].Reduce GDP EI to 37% until 2035, compared to the 2010 level [70].Reaching 9% RE of final energy consumption by 2035 [70].
MoldovaReduce CO2 emissions by 64–67% until 2030, compared to 1990 [71].No long-term targets.No long-term targets.
UkraineReduce CO2 emissions by 40%, compared to the 1990 level until 2030 [72,73].Reduce energy consumption by 28% by 2030 [73].Reaching 17% RE of final energy consumption by 2030 [73].
Eurasia
RussiaReduce CO2 emissions for 30–35%, compared to the 1990 level by 2030 [74].Reduce EI to 50% compared to 2010 level by 2035 [75].Not presented in Russia’s Energy Strategy in the Period until 2035 [75].
Transcaucasia
ArmeniaCO2 emissions 2.07 tons/per capita annually, by 2030 [76].No target.No target.
AzerbaijanReduce CO2 emissions by 35% compared to the 1990 level by 2030 [77].Strategy in development [78].Strategy in development [78].
GeorgiaReduce CO2 emissions by 15% below BAU by 2030 [79].Strategy in development [78].Strategy in development [78].
Central Asia
KazakhstanReduce CO2 emissions by 15–25% compared to the 1990 level by 2030 [80].Reduce GDP EI by 30% until 2030, compared to the 2008 level [81].Reaching 30% RE of final energy consumption by 2030 [81].
KyrgyzstanReduce CO2 emissions by 11.39–13.75% below BAU by 2030 [82].Strategy in development [78].Strategy in development [78].
TajikistanReduce CO2 emissions by 10–20% compared to the 1990 level by 2030 [83].Strategy in development [78].Strategy in development [78].
TurkmenistanStabilization of emissions on the 2010 level by 2030 [84].Strategy in development [78].Strategy in development [78].
UzbekistanReduce CO2 emissions per unit of GDP by 10% by 2030, compared to level of 2010 [85].Strategy in development [78].Strategy in development [78].
European Union
EstoniaReduce greenhouse gas (GHG) emissions by 13% of the 2005 level by 2030 [86].Overall target of energy efficiency: primary energy consumption in 2030 <5.49 Mtoe [86].Share of energy produced from RES in gross final energy consumption: 42% [86].
LatviaReduce GHG emissions by 6% of the 2005 level by 2030 [87].Optional target—primal energy consumption <4.3 Mtoe by 2030 [87].Share of energy produced from RES in gross final energy consumption: 45% [87].
LithuaniaReduce COemissions by 9% of the 2005 level by 2030 [88].Reducing energy intensity 1.5 times by 2030, compared to 2018 [88].Increasing the share of renewable energy to at least 45% [88].
Table 2. Models predicting energy consumption (MTOE and KOE) through GDP and REC in the period from 2002 to 2014.
PredictorEstimateSEtpStand. Estimate
Baltics (members of the EU)
EstoniaAdjusted R2 = 0.583, F(2,10) = 9.40, p = 0.005, dependent—MTOE
Intercept1.89380.78562.410.037
Estonia REC0.05850.02512.330.0420.442
Estonia GDP6.66 × 10−112.11 × 10−113.160.010.599
LatviaAdjusted R2 = 0.648, F(2,10) = 12.00, p = 0.002, dependent—MTOE
Intercept4.30920.46389.29<0.001
Latvia REC−0.02770.0119−2.330.042−0.404
Latvia GDP2.8 × 10−116.1 × 10−124.6<0.0010.796
LithuaniaAdjusted R2 = 0.805, F(2,10) = 25.80, p < 0.001, dependent—MTOE
Intercept13.4761.127411.953<0.001
Lithuania REC−0.2790.049−5.703<0.001−0.8835
Lithuania GDP−6.98 × 10−122 × 10−11−0.3470.736−0.0538
Eastern Europe
BelarusAdjusted R2 = 0.959, F(2,10) = 143.00, p < 0.001, dependent—KOE
Intercept409.7451.18.018<0.001
Belarus REC2.8511.80.2410.8140.0346
Belarus GDP−1.59 × 10−92.2 × 10−10−7.075<0.001−1.0145
MoldovaAdjusted R2 = 0.949, F(2,10) = 113.00, p < 0.001, dependent—KOE
Intercept436.55317.8524.453<0.001
Moldova REC0.6951.170.5950.5650.064
Moldova GDP−1.42 × 10−81.5 × 10−9−9.565<0.001−1.0286
UkraineAdjusted R2 = 0.942, F(2,10) = 99.2, p < 0.001, dependent—KOE
Intercept723.849.2414.7<0.001
Ukraine REC−47.66.7−7.1<0.001−0.668
Ukraine GDP−6.81 × 10−101.6 × 10⁻¹⁰−4.160.002−0.391
Transcaucasia
ArmeniaAdjusted R2 = 0.946, F(2,10) = 105.00, p < 0.001, dependent—KOE
Intercept251.9511.44722.01<0.001
Armenia REC−5.020.955−5.26<0.001−0.458
Armenia GDP−3.84 × 10−92.8 × 10−10−13.79<0.001−1.202
AzerbaijanAdjusted R2 = 0.959, F(2,10) = 141.00, p < 0.001, dependent—KOE
Intercept361.622.1816.31<0.001
Azerbaijan REC−17.56.64−2.630.025−0.156
Azerbaijan GDP−1.51 × 10−99.4 × 10−11−16.08<0.001−0.951
GeorgiaAdjusted R2 = 0.663, F(2,10) = 12.80, p = 0.002, dependent—KOE
Intercept92.0544.7972.0550.067
Georgia REC1.140.552.0710.0650.7875
Georgia GDP−1.63 × 10−109.3 × 10⁻¹⁰−0.1760.864−0.0668
Eurasia and Central Asia
KazakhstanAdjusted R2 = 0.291, F(2,10) = 3.46, p = 0.072, dependent—KOE
Intercept304.6446.92<0.001
Kazakhstan REC−17.811.9−1.490.168−0.719
Kazakhstan GDP−2.02 × 10−108.5 × 10⁻¹¹−2.380.039−1.149
KyrgyzstanAdjusted R2 = −0.121, F(2,10) = 3.46, p = 0.712, dependent—KOE
Intercept304.32110.132.7630.02
Kyrgyzstan REC−2.433.01−0.8080.438−0.313
Kyrgyzstan GDP−2.01 × 10−93 × 10−9−0.6740.515−0.261
Russian FederationAdjusted R2 = 0.923, F(2,10) = 72.70, p < 0.001, dependent—KOE
Intercept445.847.29.45<0.001
Russian Federation REC−16.912.9−1.310.22−0.105
Russian Federation GDP−5.33 × 10−114.4 × 10⁻¹²−12<0.001−0.963
TajikistanAdjusted R2 = 0.918, F(2,10) = 55.80, p < 0.001, dependent—KOE
Intercept488.7974.4516.57<0.001
Tajikistan REC−2.390.995−2.410.037−0.316
Tajikistan GDP−1.21 × 10−81.4 × 10−9−8.85<0.001−1.161
TurkmenistanAdjusted R2 = 0.959, F(2,10) = 142.00, p < 0.001, dependent—KOE
Intercept116496.412.07<0.001
Turkmenistan REC−3312878.1−3.770.004−0.475
Turkmenistan GDP−9.23 × 10−98.4 × 10−10−10.95<0.001−1.379
UzbekistanAdjusted R2 = 0.907, F(2,9) = 54.90, p < 0.001, dependent—KOE
Intercept1115.763.217.647<0.001
Uzbekistan REC−51.856.4−0.9180.383−0.159
Uzbekistan GDP−3.96 × 10−98.3 × 10−10−4.760.001−0.823
Note. MTOE—Million tons of oil equivalent; KOE—Energy use (kg of oil equivalent) per $1000 GDP (constant 2011 PPP); REC—Renewable energy consumption (% of total final energy consumption); GDP—PPP (constant 2011 international $).
Table 3. Models predicting greenhouse gas (GHG) emissions through GDP and REC through GDP and REC in the period from 2002 to 2014.
PredictorEstimateSEtpStand. Estimate
Baltics (members of the EU)
EstoniaAdjusted R2 = 0.523, F(2,10) = 7.57, p = 0.010, dependent—GHG
Intercept2.3392.76410.8460.417
Estonia REC0.1610.08841.8270.0980.371
Estonia GDP2.25 × 10−107.43 × 10−113.0320.0130.616
LatviaAdjusted R2 = 0.630, F(2,10) = 11.20, p = 0.003, dependent—GHG
Intercept2.99420.59425.04<0.001
Latvia REC−0.02690.0152−1.770.108−0.313
Latvia GDP3.6 × 10−117.8 × 10−124.6<0.0010.816
LithuaniaAdjusted R2 = 0.751, F(2,10) = 19.10, p < 0.001, dependent—GHG
Intercept2.33420.36416.41<0.001
Lithuania REC−0.02850.0158−1.80.102−0.315
Lithuania GDP3.8 × 10−116.5 × 10−125.89<0.0011.031
Eastern Europe
BelarusAdjusted R2 = 0.849, F(2,10) = 34.70, p < 0.001, dependent—GHG
Intercept3.820.9813.8950.003
Belarus REC0.1350.2260.5980.5630.165
Belarus GDP1.2 × 10−114.3 × 10−122.8260.0180.781
MoldovaAdjusted R2 = 0.674, F(2,10) = 13.40, p = 0.001, dependent—GHG
Intercept0.73830.120126.15<0.001
Moldova REC−0.0120.00785−1.520.158−0.414
Moldova GDP4.2 × 10−111 × 10−114.210.0021.145
UkraineAdjusted R2 = 0.803, F(2,10) = 25.40, p < 0.001, dependent—GHG
Intercept4.6010.925<0.001
Ukraine REC−0.8730.125−6.97<0.001−1.214
Ukraine GDP1.1 × 10−113.1 × 10−123.620.0050.631
Transcaucasia
ArmeniaAdjusted R2 = 0.961, F(2,10) = 149.00, p < 0.001, dependent—GHG
Intercept0.84290.24723.410.007
Armenia REC−0.06540.0206−3.170.01−0.234
Armenia GDP6.7 × 10−116 × 10−1211.11<0.0010.819
AzerbaijanAdjusted R2 = 0.018, F(2,10) = 1.11, p = 0.366, dependent—GHG
Intercept4.5350.4879.311<0.001
Azerbaijan REC−0.1950.146−1.3340.212−0.385
Azerbaijan GDP−1.01 × 10−122.1 × 10⁻¹²−0.490.635−0.141
GeorgiaAdjusted R2 = 0.905, F(2,10) = 58.00, p < 0.001, dependent—GHG
Intercept0.103520.87790.1180.908
Georgia REC−0.00890.0108−0.8260.428−0.167
Georgia GDP7.3 × 10−111.8 × 10−113.9920.0030.807
Eurasia and Central Asia
KazakhstanAdjusted R2 = 0.821, F(2,10) = 28.50, p < 0.001, dependent—GHG
Intercept13.243.883.410.007
Kazakhstan REC−2.31.05−2.180.054−0.531
Kazakhstan GDP1.3 × 10−117.5 × 10−121.740.1120.424
KyrgyzstanAdjusted R2 = 0.752, F(2,10) = 19.20, p < 0.001, dependent—GHG
Intercept0.930.74061.260.238
Kyrgyzstan REC−0.02860.0202−1.410.188−0.257
Kyrgyzstan GDP7.8 × 10−112 × 10−113.90.0030.71
Russian FederationAdjusted R2 = 0.708, F(2,10) = 15.60, p < 0.001, dependent—GHG
Intercept10.62.1564.92<0.001
Russian Federation REC−0.6960.591−1.180.267−0.183
Russian Federation GDP1.1 × 10−122E−135.44<0.0010.848
TajikistanAdjusted R2 = 0.742, F(2,10) = 18.20, p < 0.001, dependent—GHG
Intercept1.36810.261065.241<0.001
Tajikistan REC−0.0160.00349−4.5830.001−0.973
Tajikistan GDP−2.87 × 10−124.8 × 10⁻¹²−0.5970.563−0.127
TurkmenistanAdjusted R2 = 0.774, F(2,10) = 21.50, p < 0.001, dependent—GHG
Intercept10.52.374.430.001
Turkmenistan REC−22.421.61−1.040.324−0.308
Turkmenistan GDP4.3 × 10−112.1 × 10−112.080.0640.617
UzbekistanAdjusted R2 = 0.890, F(2,10) = 49.40, p < 0.001, dependent—GHG
Intercept6.2420.22128.2<0.001
Uzbekistan REC−0.2640.214−1.230.246−0.248
Uzbekistan GDP−1.09 × 10−113 × 10−12−3.620.005−0.728
Note. GHG—CO2 emissions (metric tons per capita); REC—Renewable energy consumption (% of total final energy consumption); GDP—PPP (constant 2011 international $).

