Analysis of Land Cover Change Detection in Gozamin District, Ethiopia: From Remote Sensing and DPSIR Perspectives

 ,
,  , ,
, ,
Abstract
:1. Introduction
2. Materials and Methods
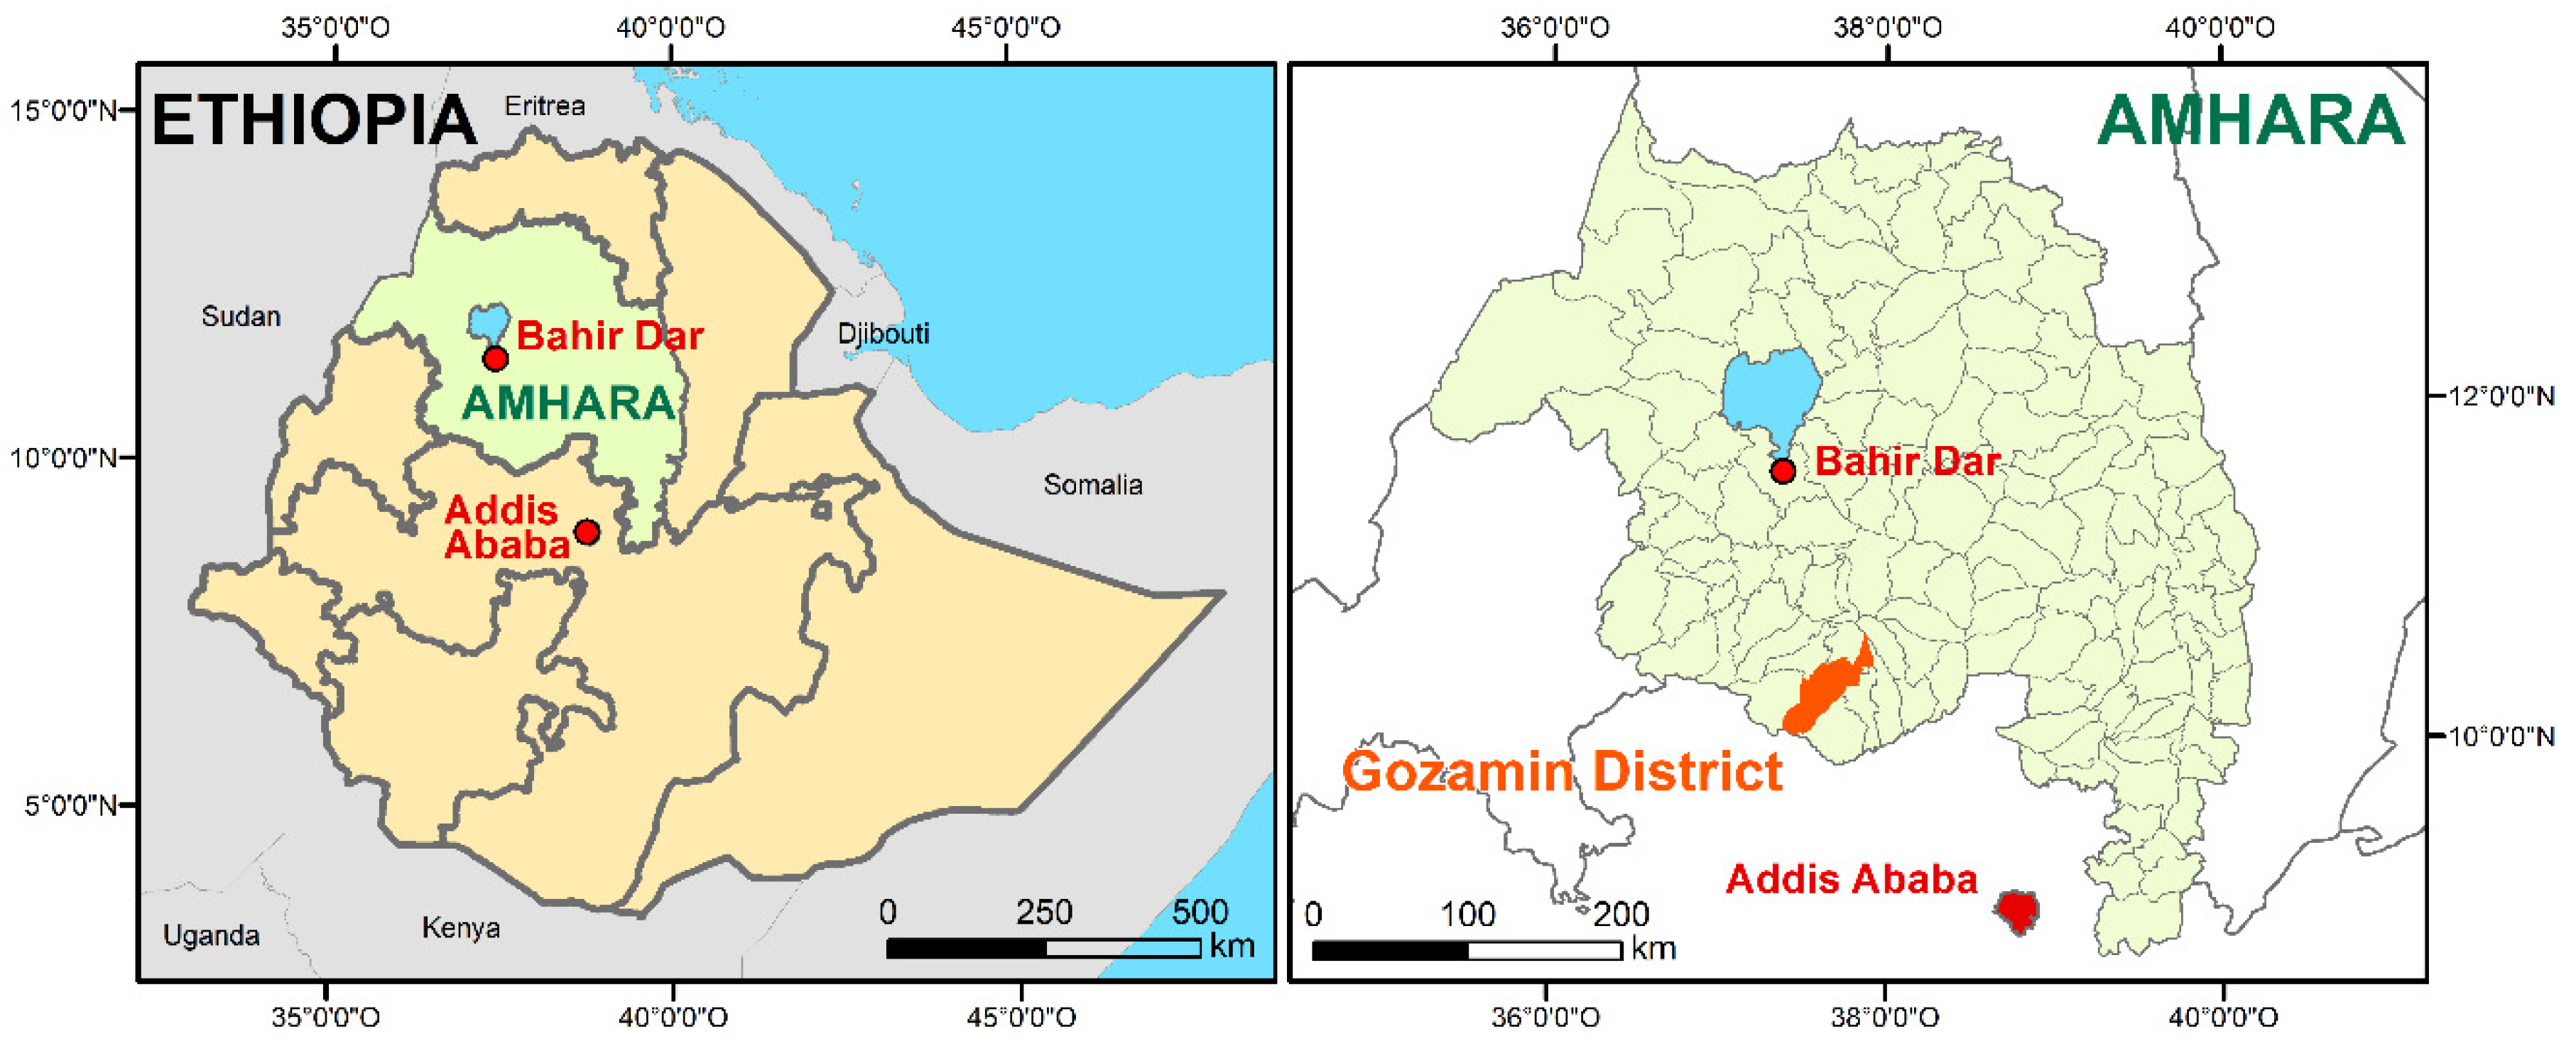
2.1. Study Area
2.2. Methods
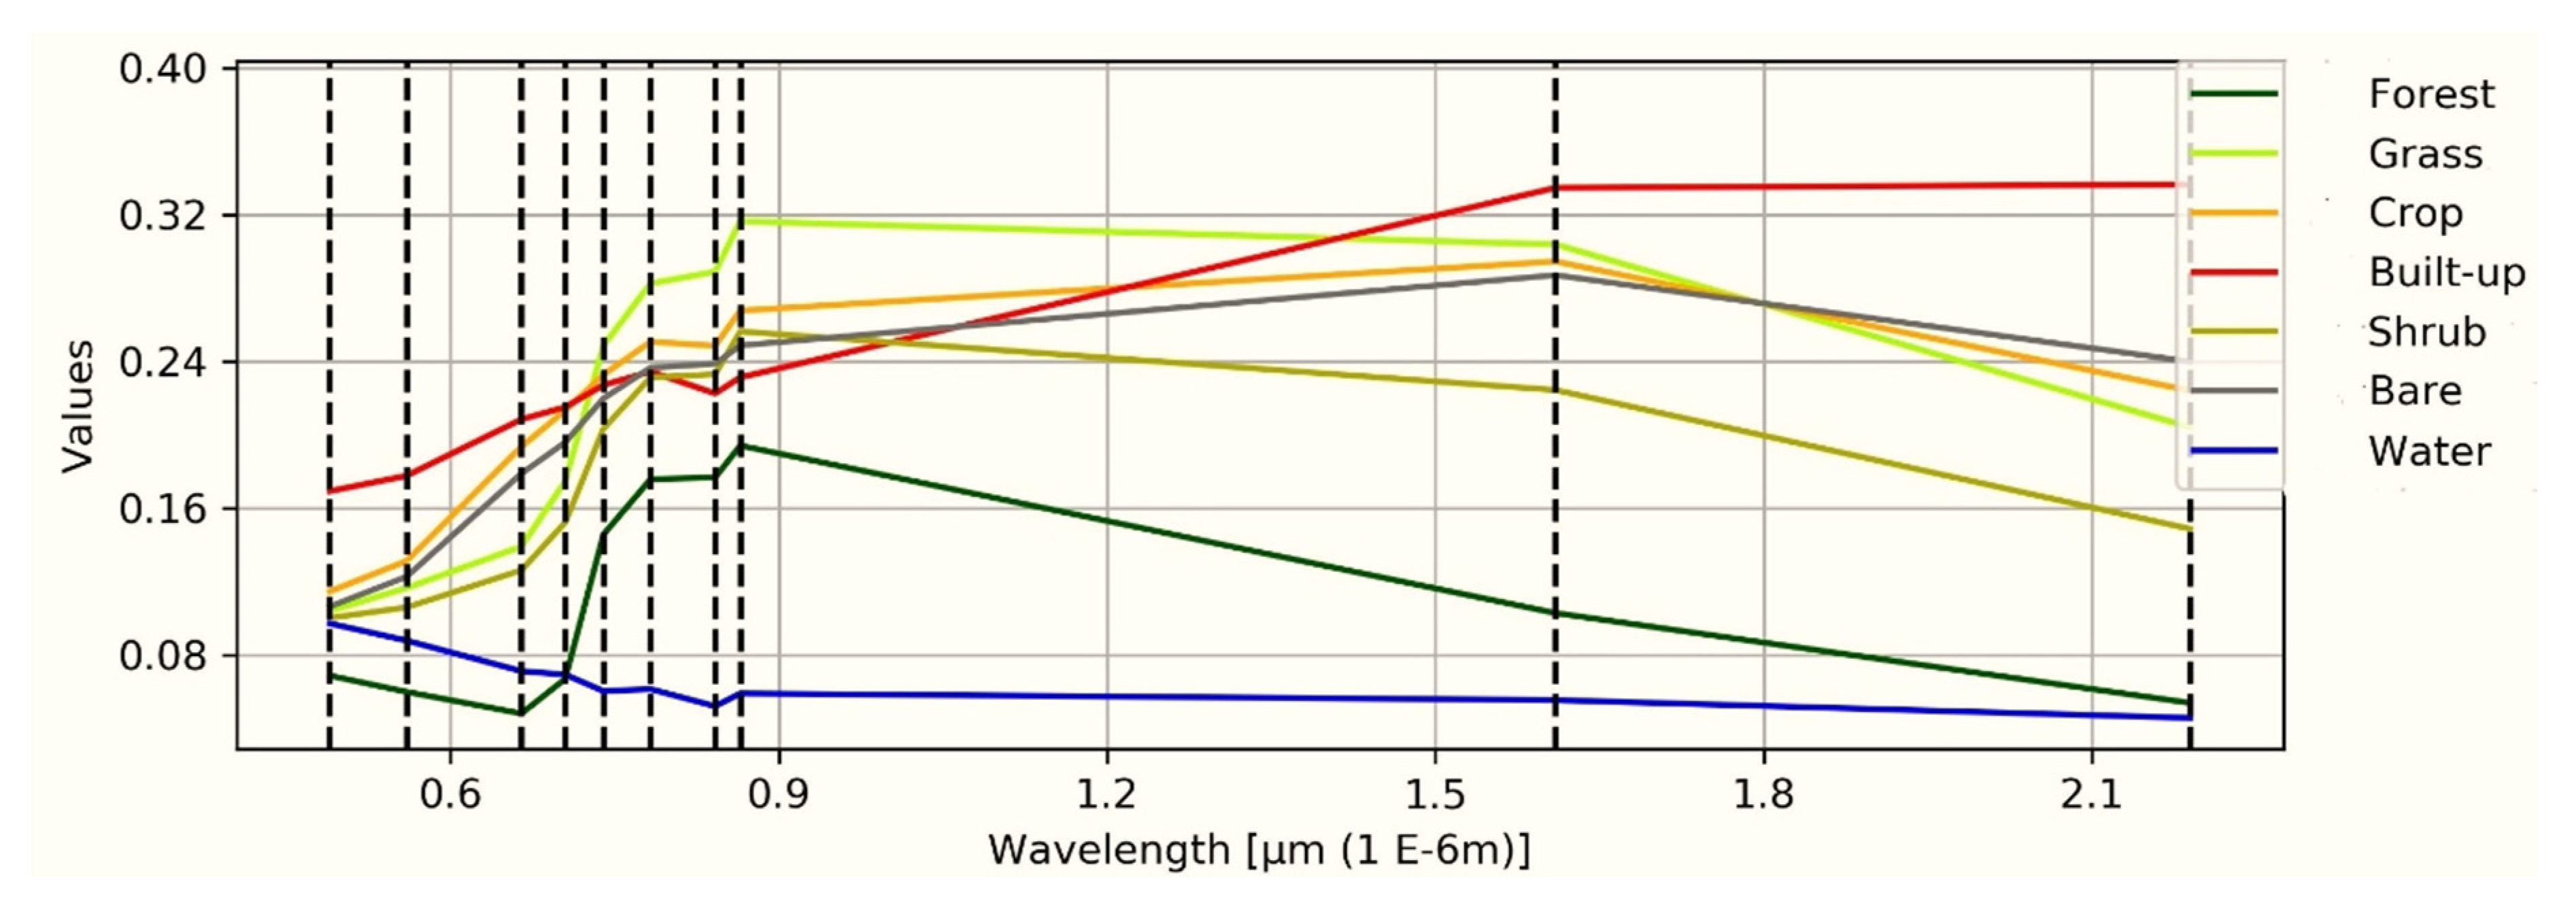
2.2.1. Remote Sensing Data and Preprocessing
2.2.2. Field Data Collection
2.3. Land Cover Classification and Post Classification
2.4. Accuracy Assessment
2.5. Land Cover Change Analysis
2.6. Household Survey and Data Analysis of DPSIR Framework of Land Cover Change
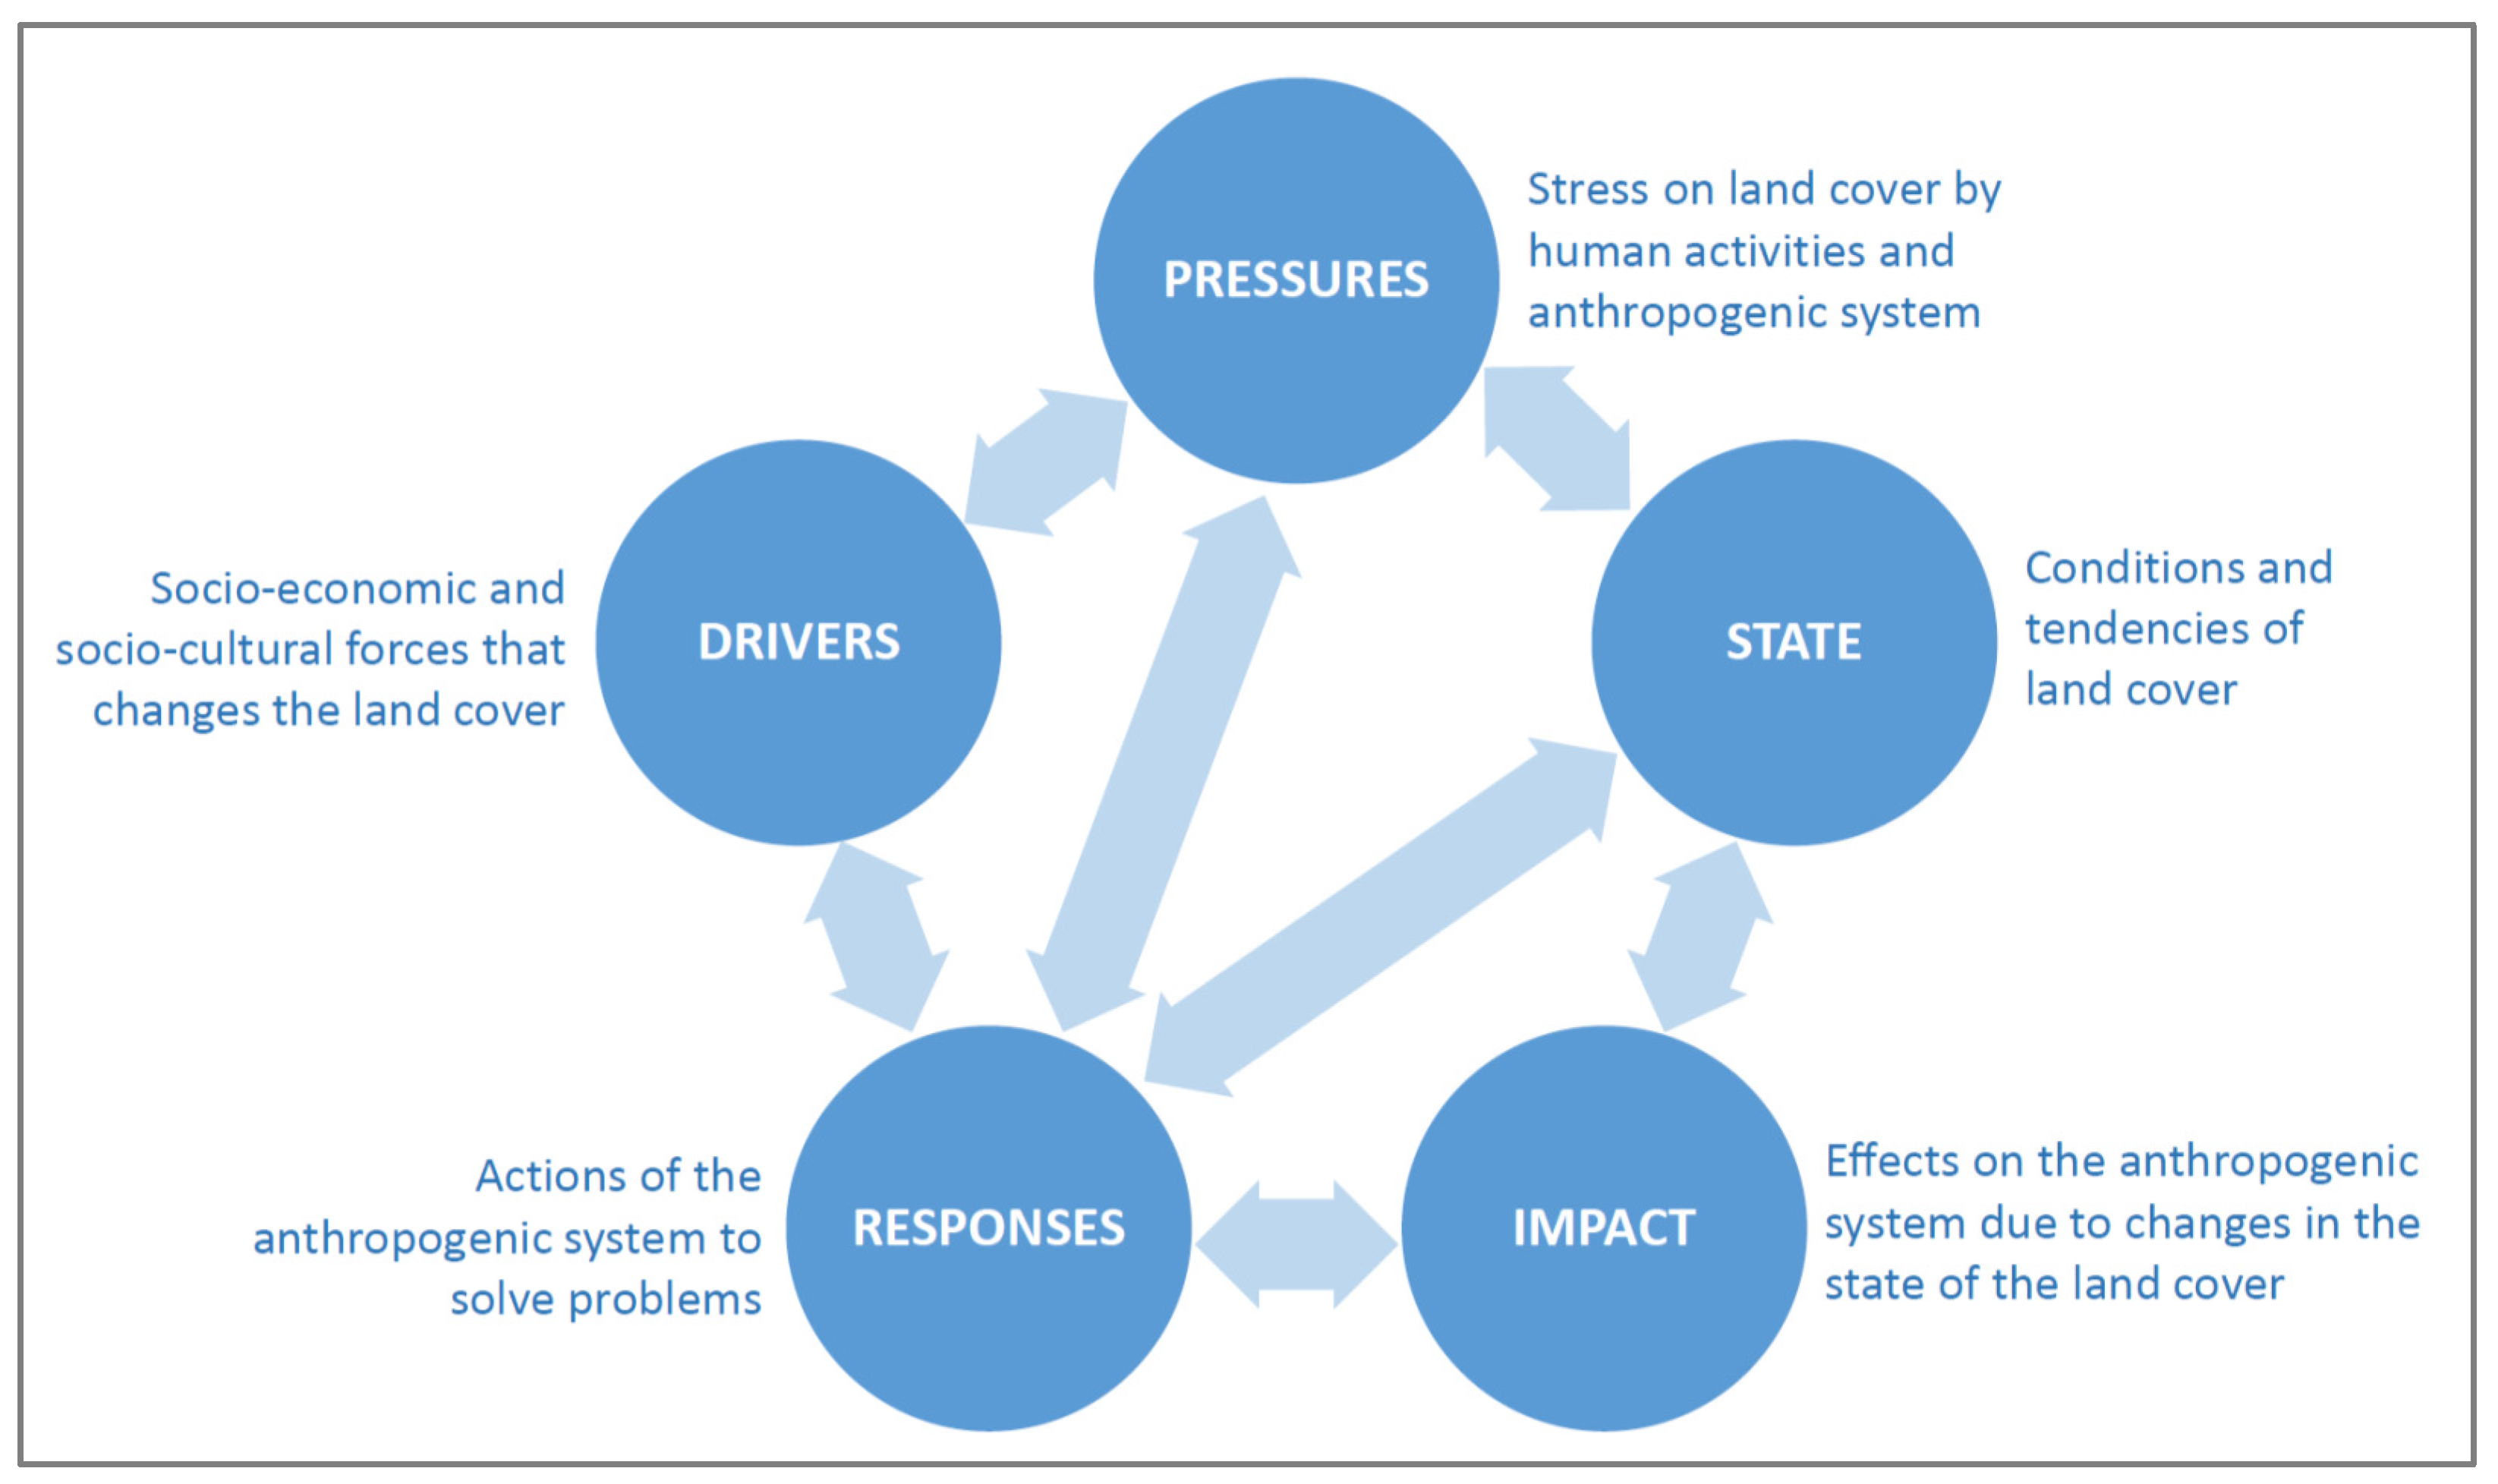
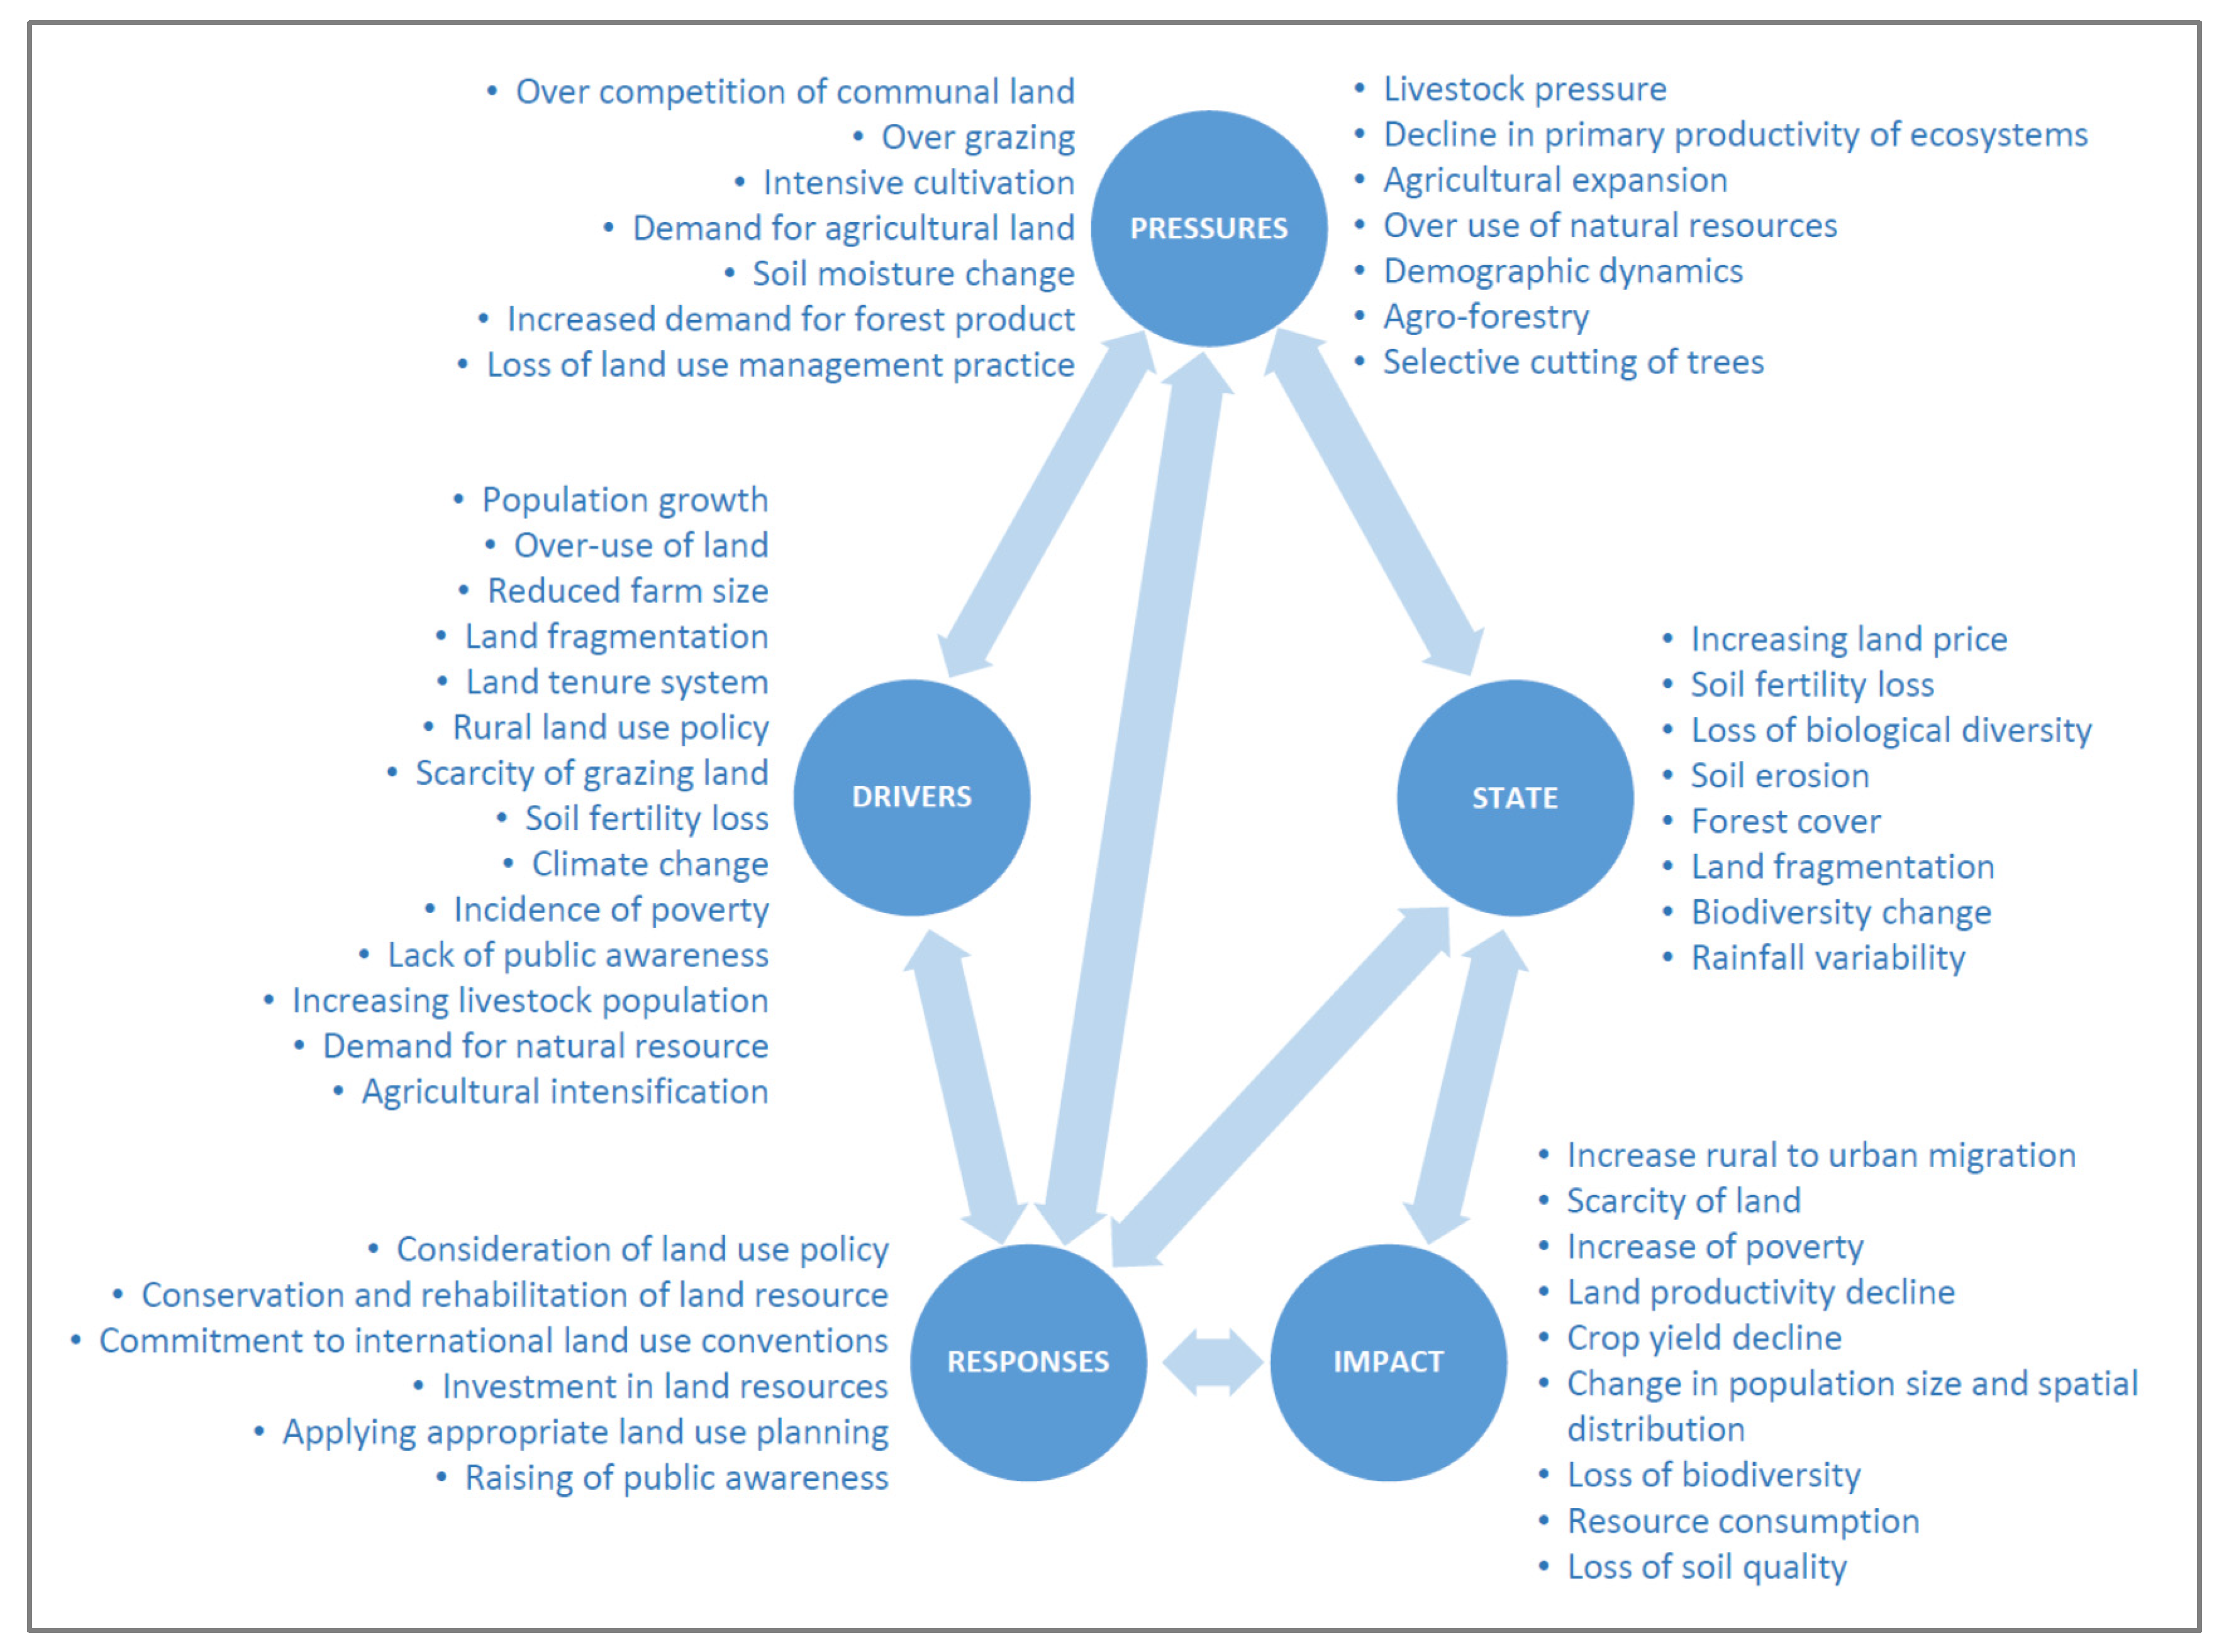
2.7. DPSIR Model for Identification of Factors of Land Cover Changes
- Drivers of land cover change;
- Pressures on the land cover;
- State or condition of land due to the changing situations;
- Impacts on population, economy, ecosystems, and/or environment to the land cover change; and
- Response of the society to the land cover change.
3. Results
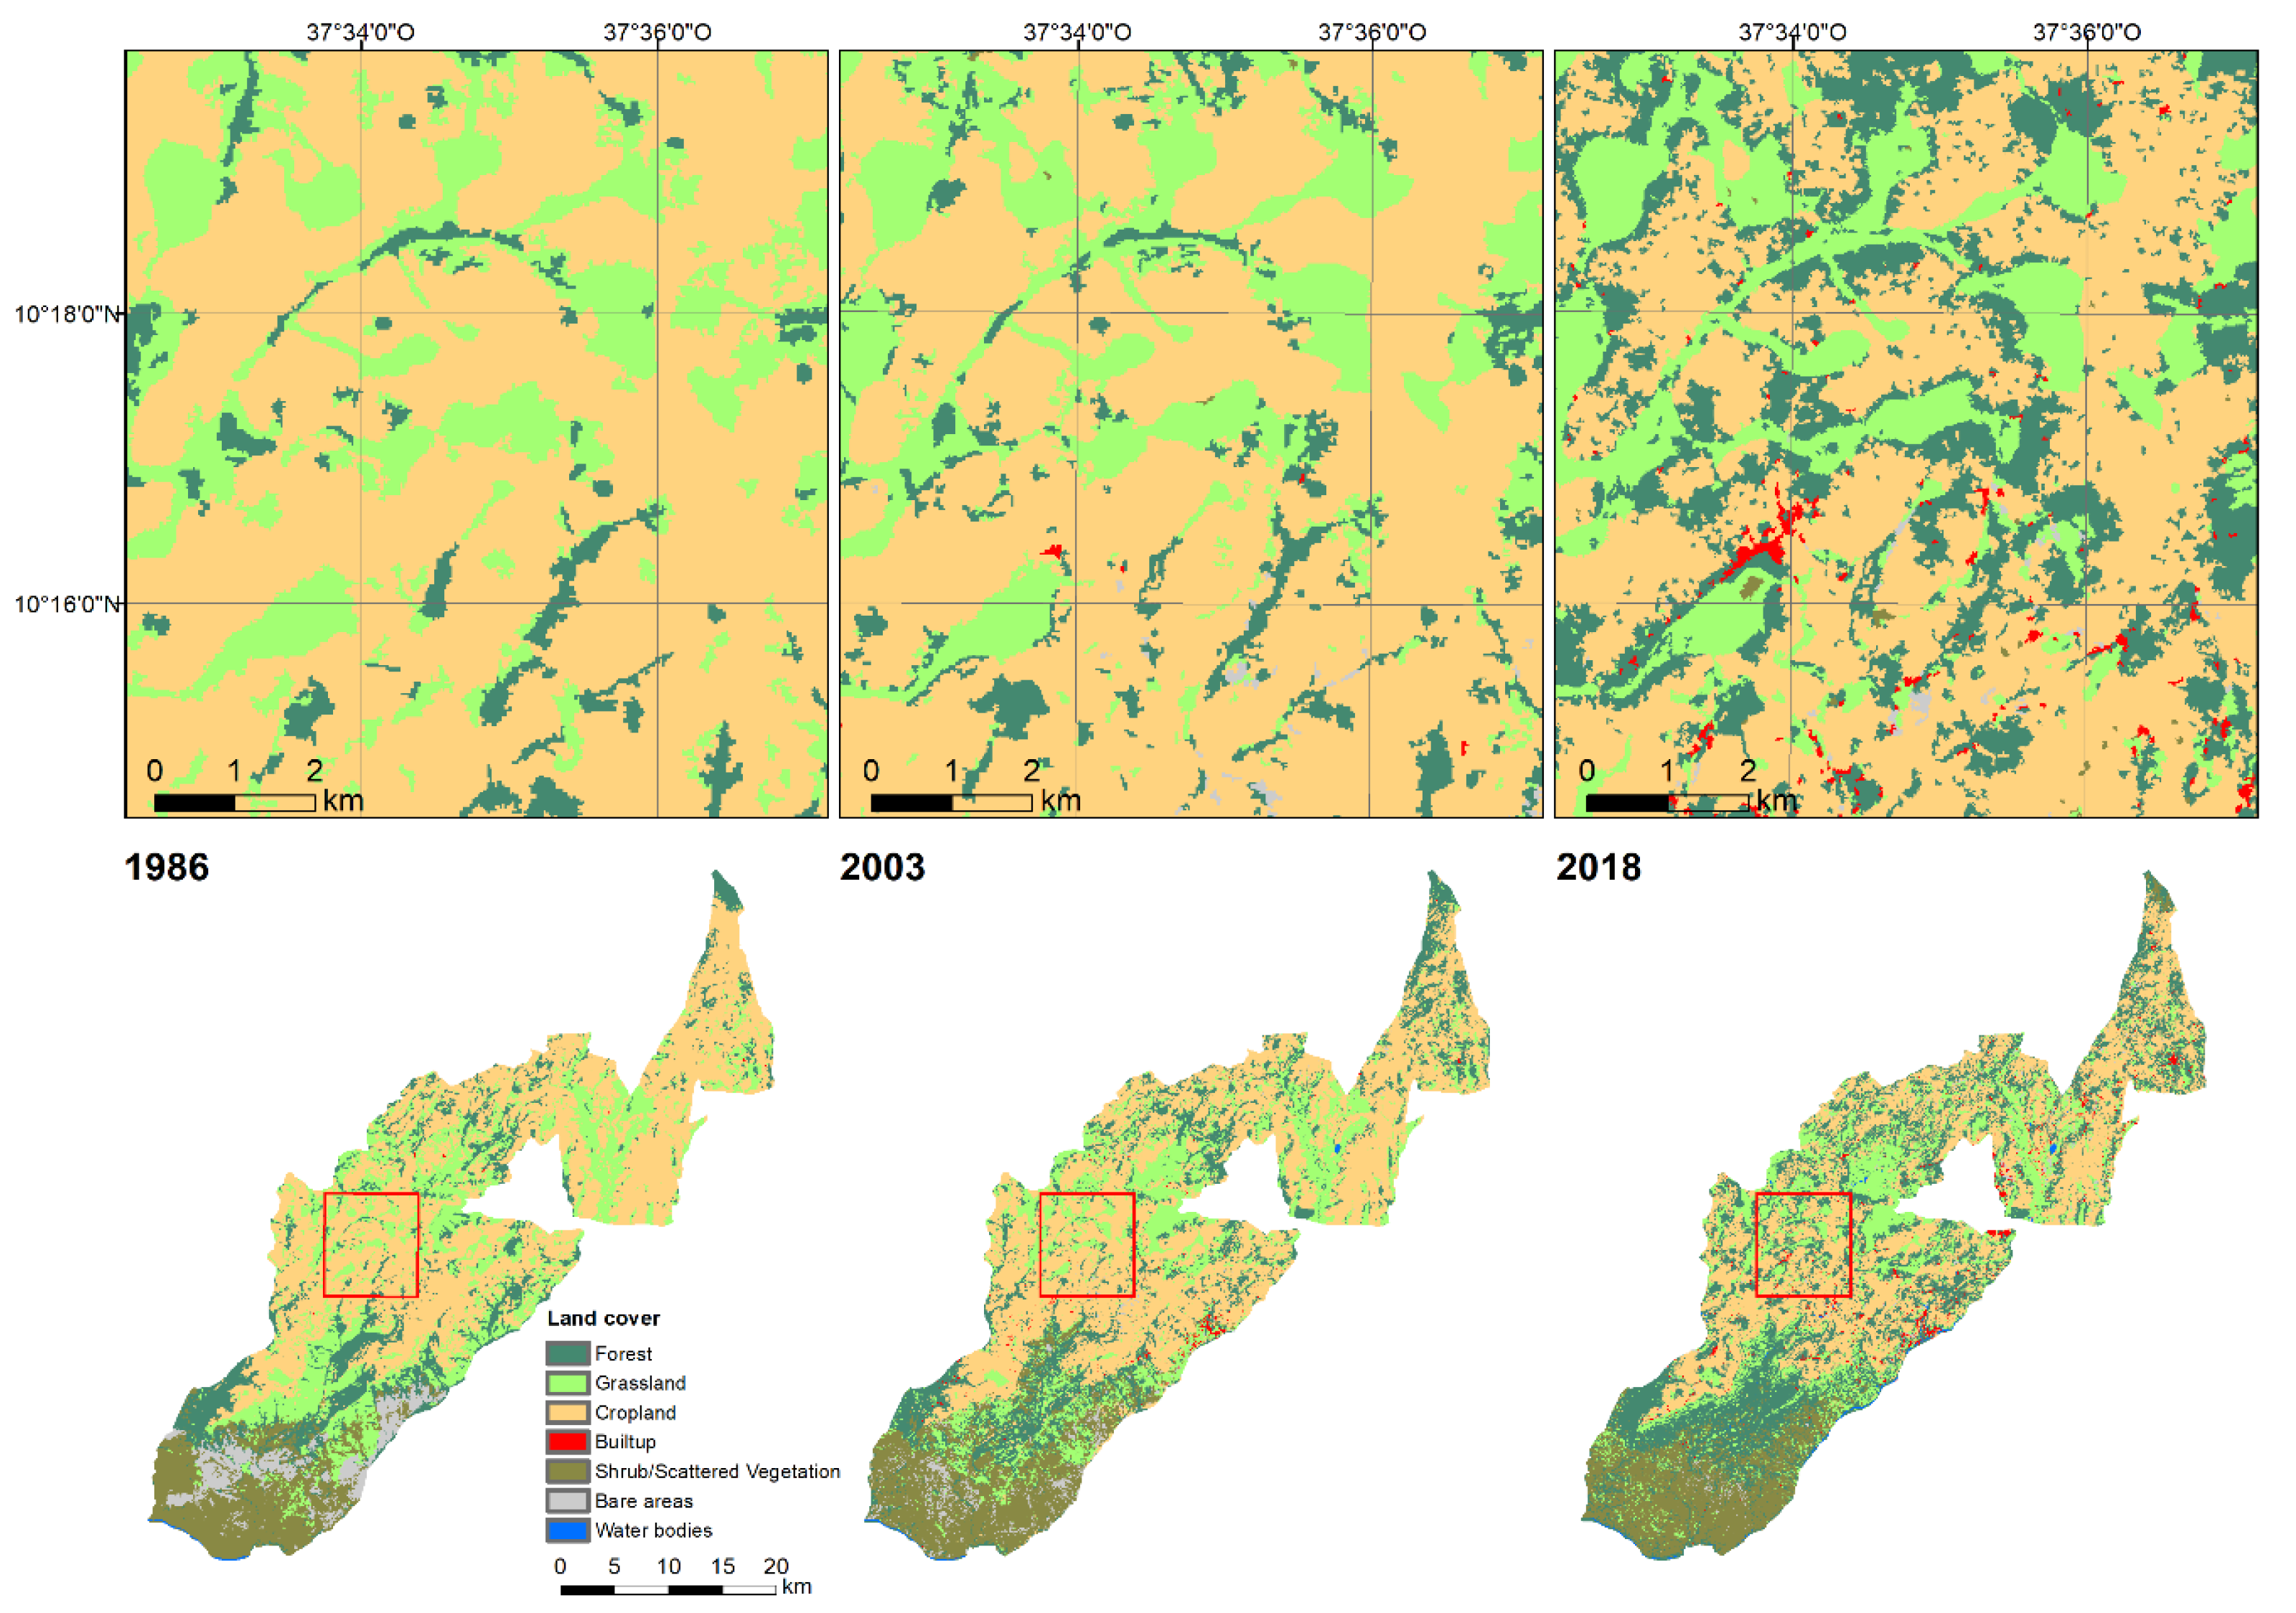
3.1. Land Cover
3.2. Accuracy of Land Cover Maps
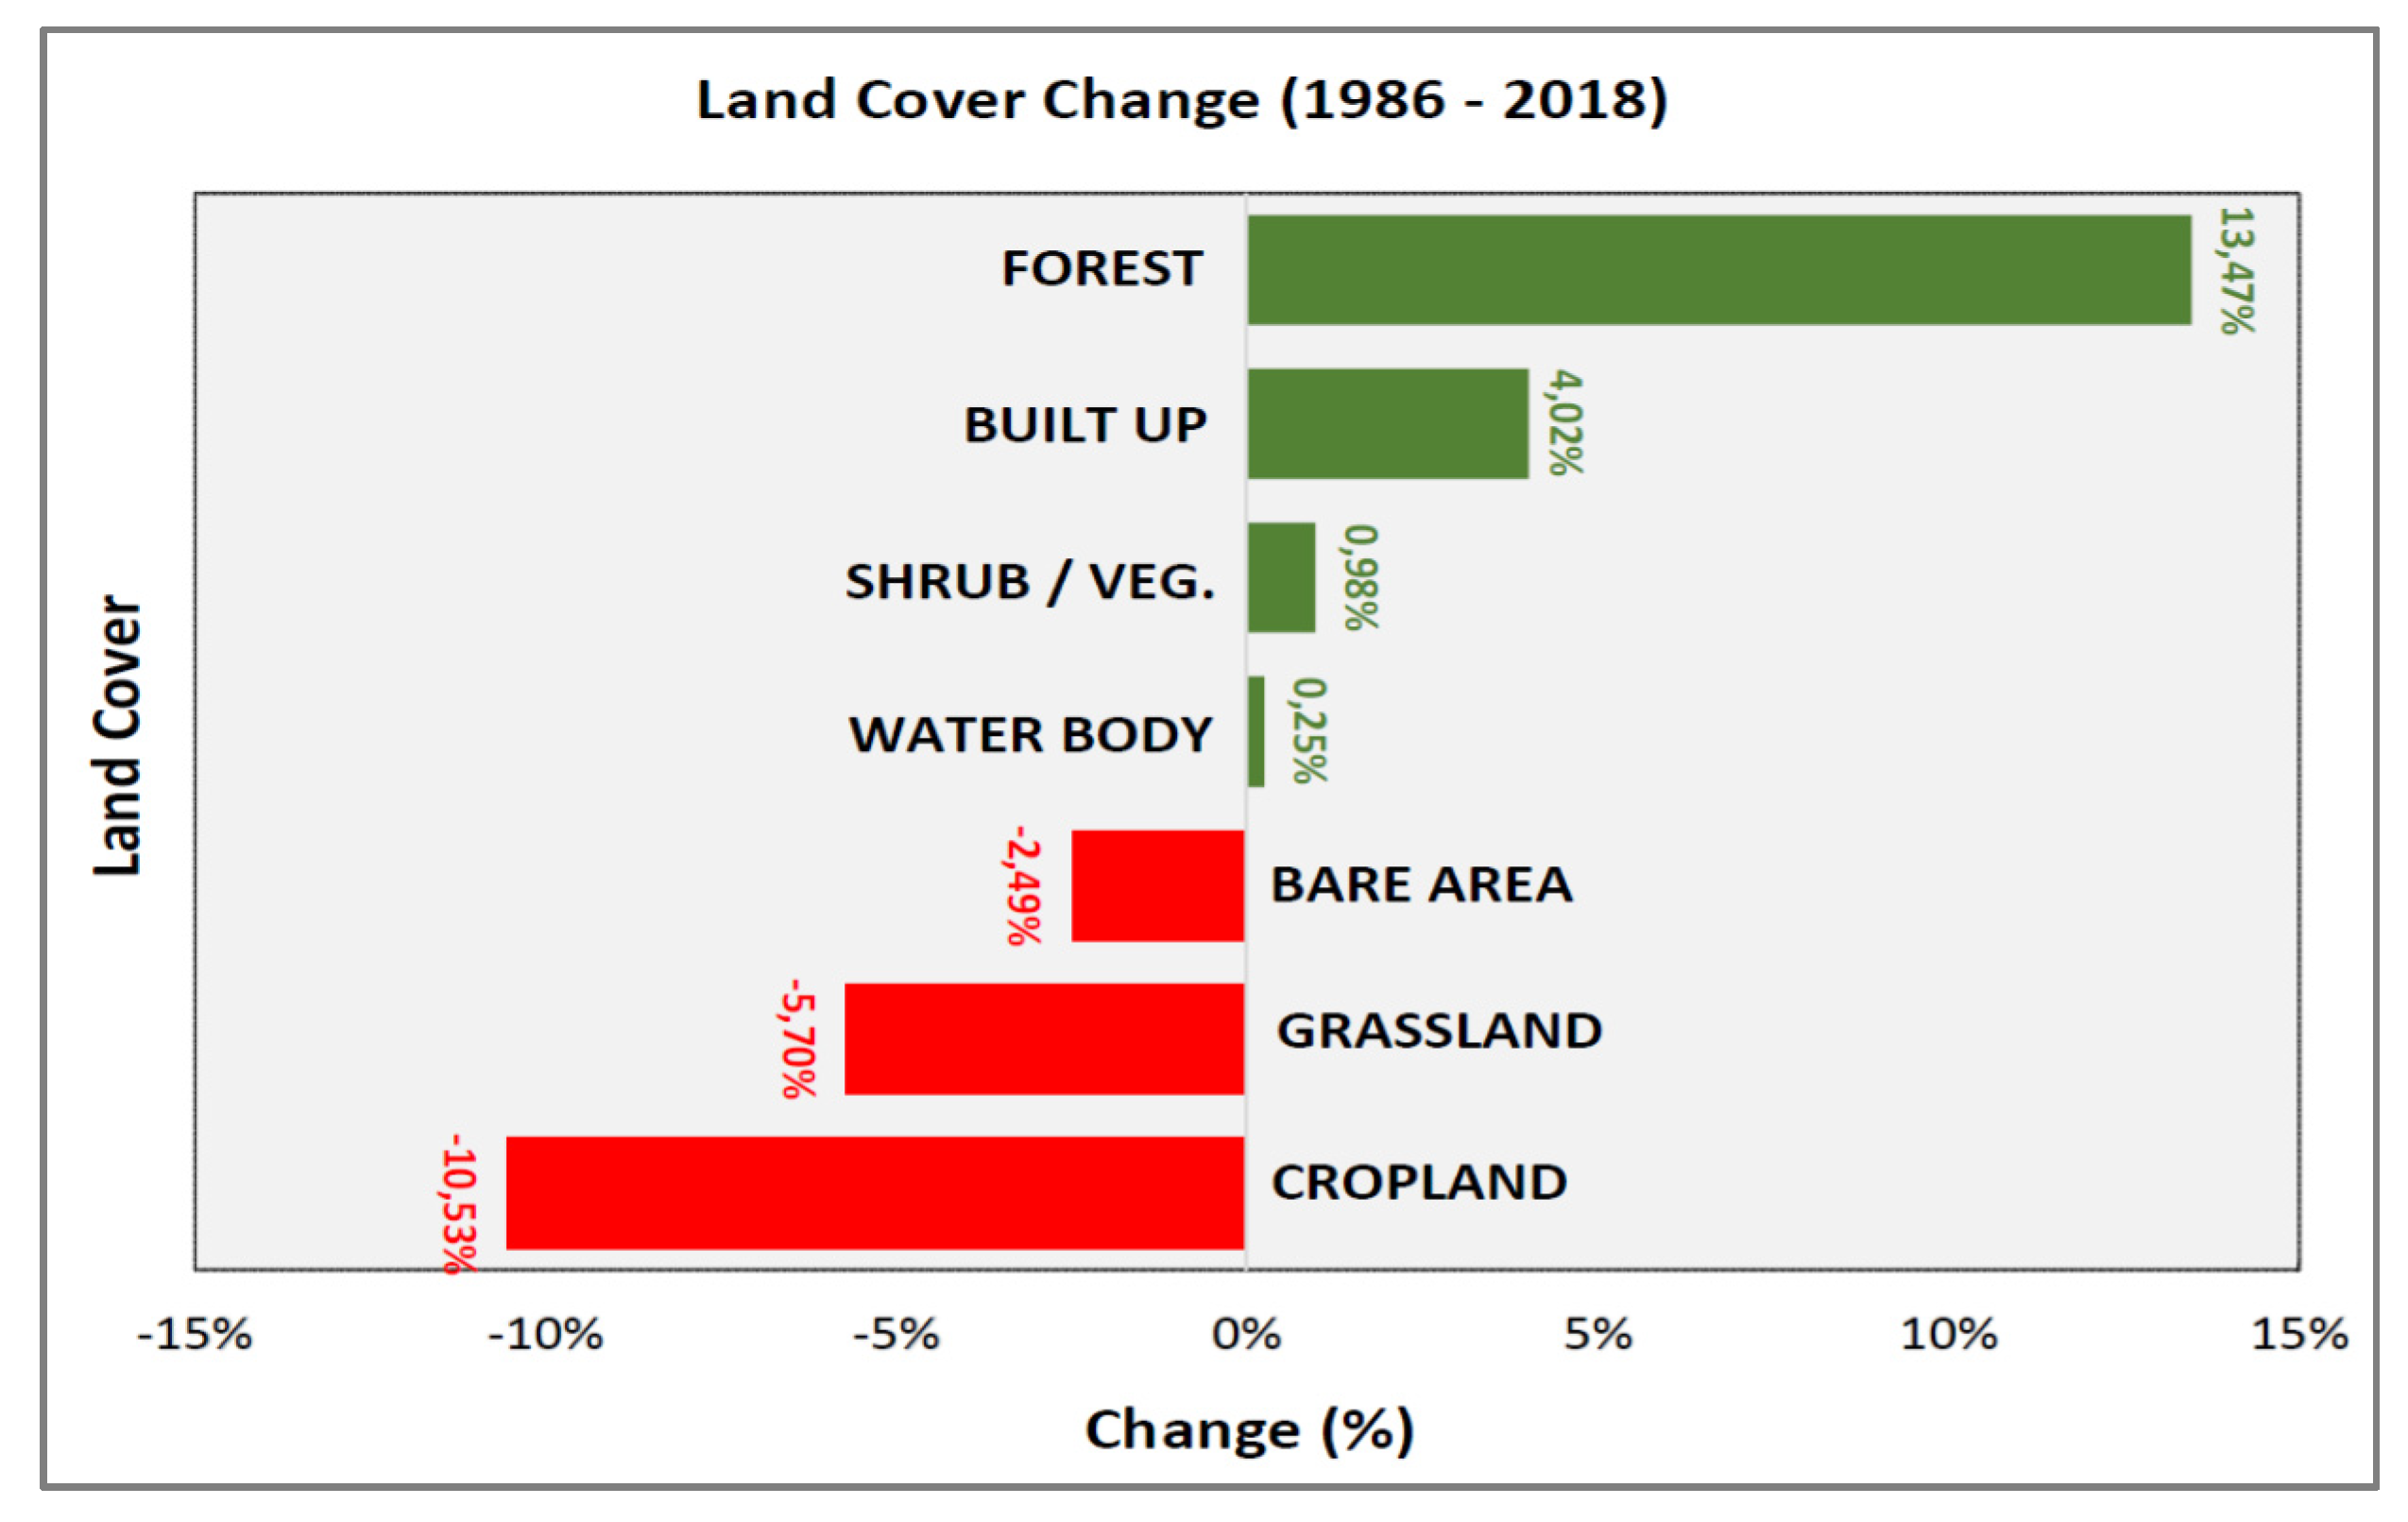
3.3. Land Cover Changes
3.4. Results of Analysis of DPSIR Indicators in Relation to Land Cover Change
3.4.1. Drivers of Land Cover Change
3.4.2. Pressures Exerted Due to Land Cover Change
3.4.3. States of the Land due to the Land Cover Change
3.4.4. Impacts of Land Cover Change
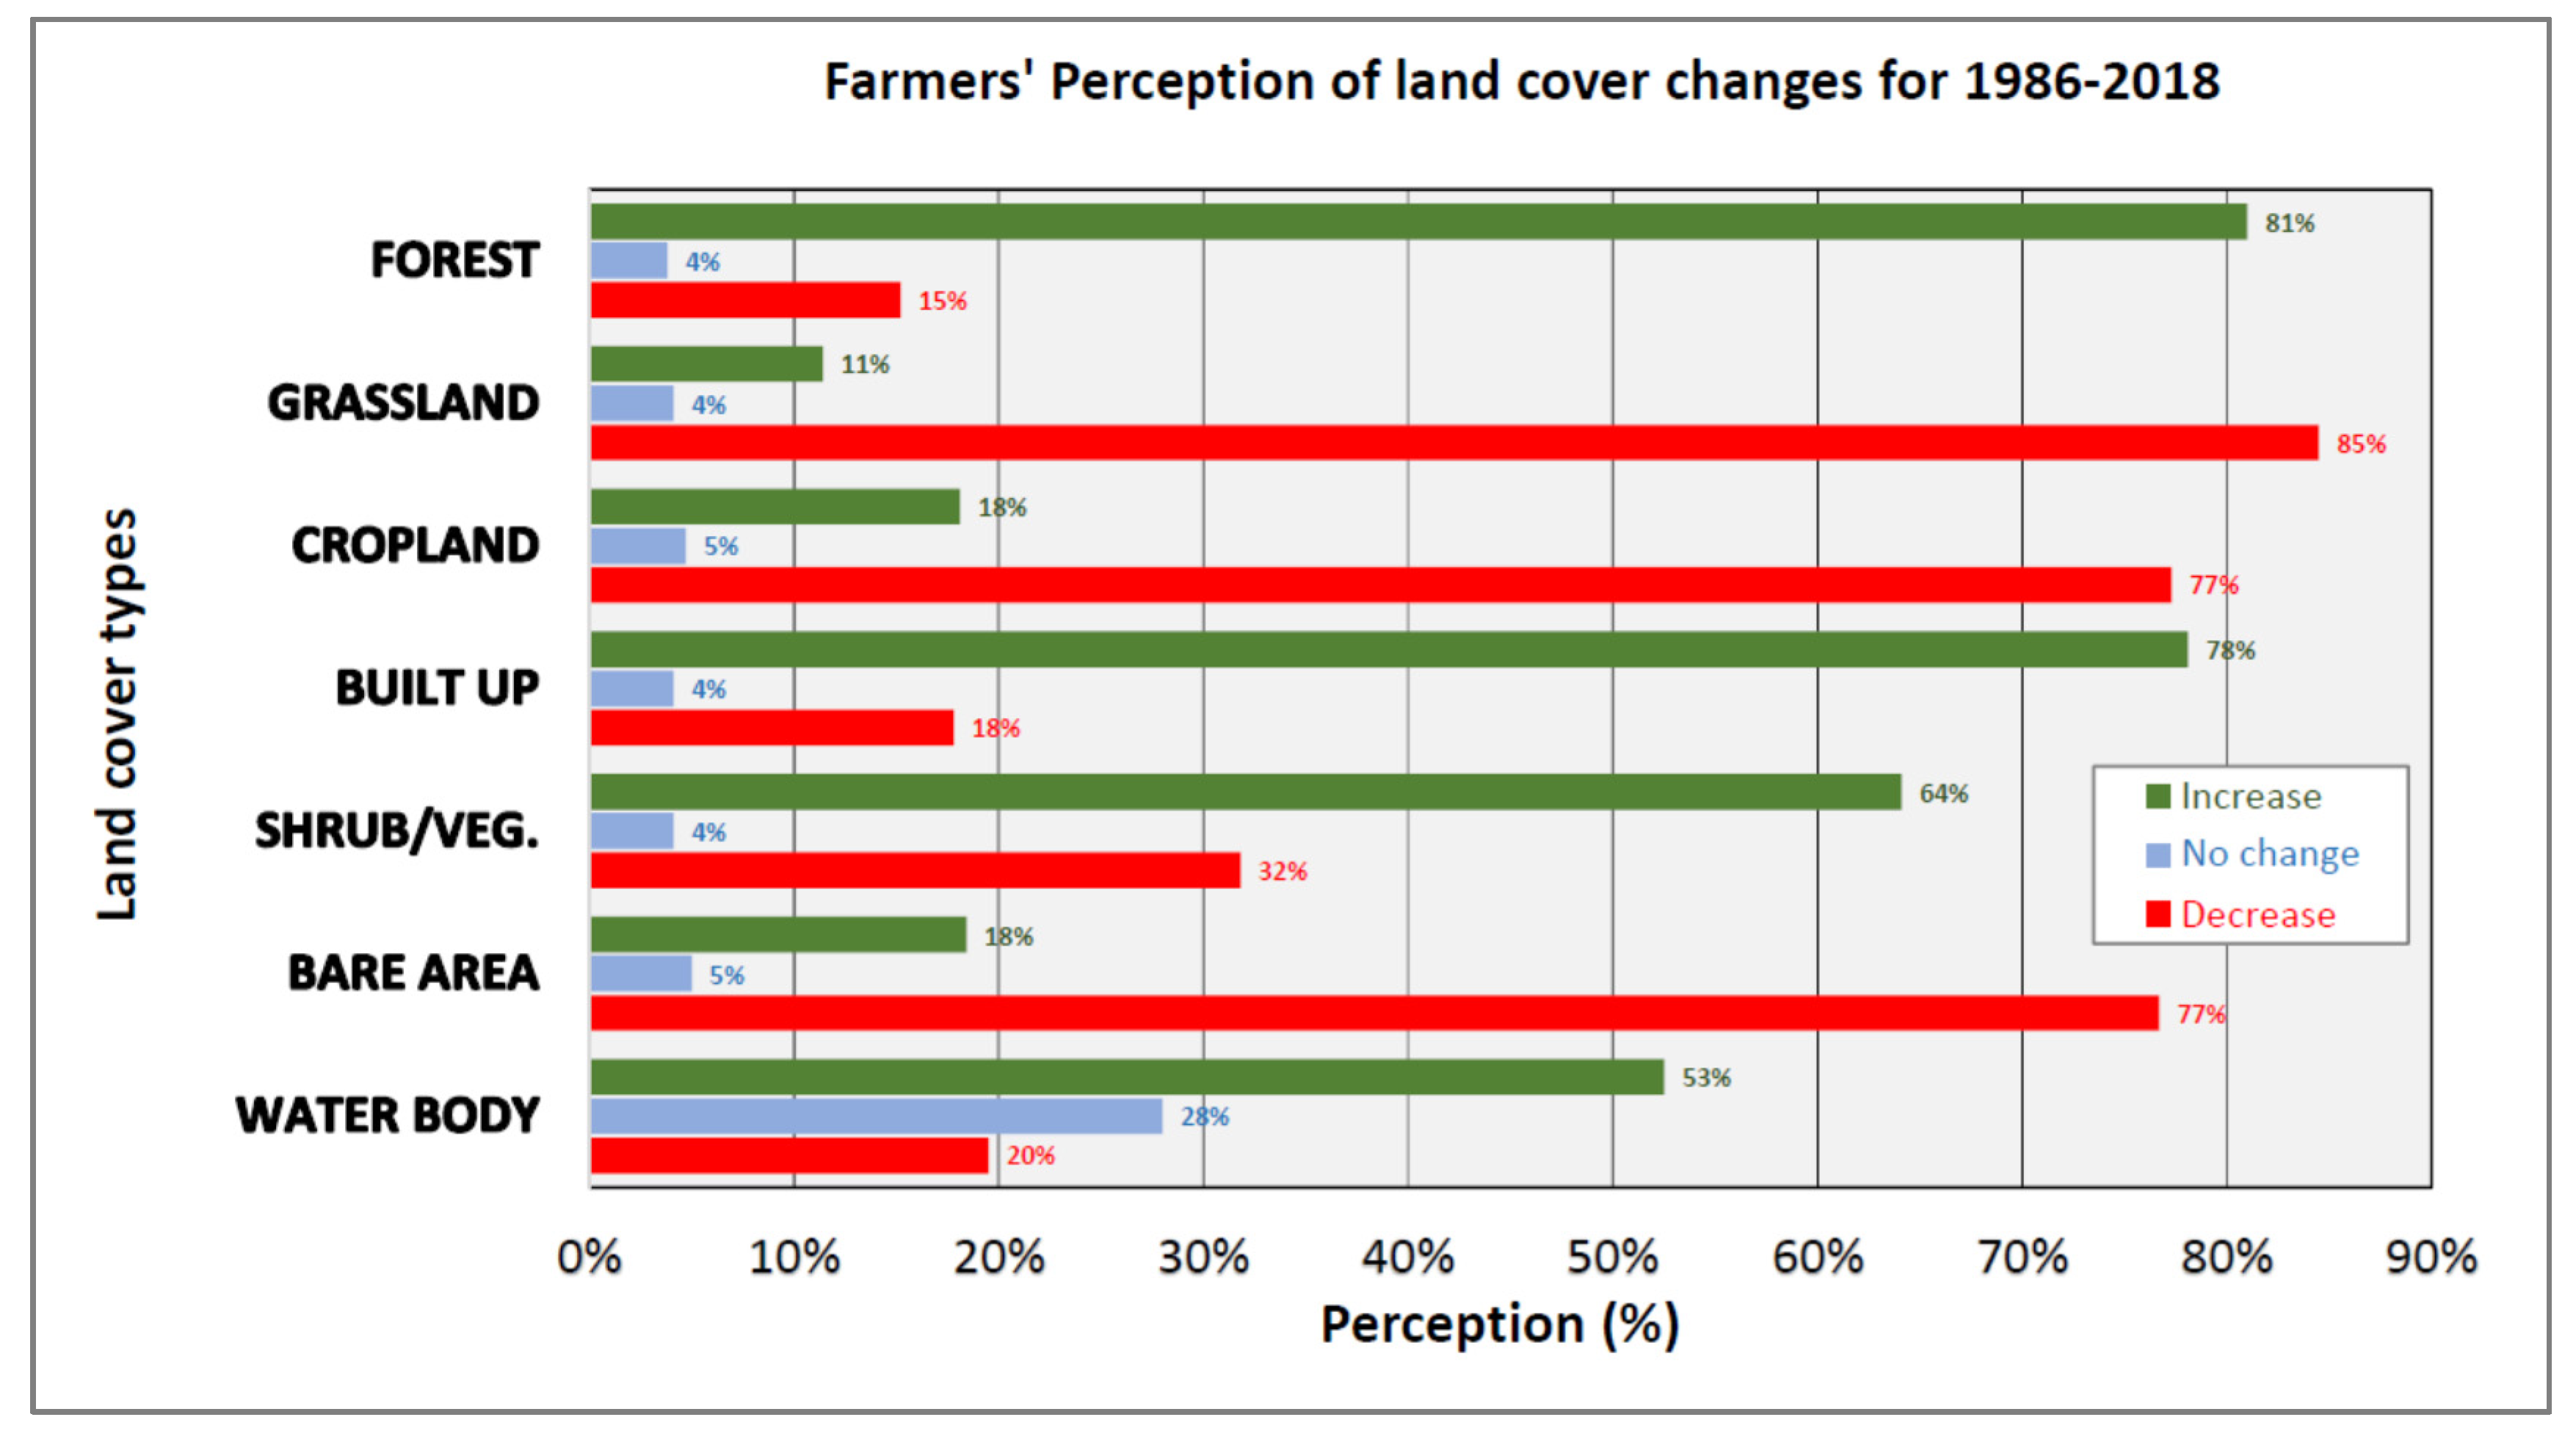
3.4.5. Responses of Farmers on the Effect of Land Cover Change
3.4.6. DSPIR Model
4. Discussion
4.1. Land Cover Change
4.2. DPSIR Indicators in Relation to Land Cover Change
4.2.1. Drivers of Land Cover Change
4.2.2. Pressures in Land Cover Change
4.2.3. State in Land Cover Change
4.2.4. Impacts of Land Cover Change
4.2.5. Response in Land Cover Change
5. Summary, Conclusions, and Recommendations
- The concerned government authorities should promote yearly tree planting in collaboration with non-governmental organizations;
- Public authorities should provide incentives to the local people for protecting and restoring the native forest, as well as for guarding new plantations;
- The concerned government authorities should take appropriate steps to avoid further degradation of land and to restore the degraded lands;
- Proper land use planning should be carried out for the area prior to any developmental project being conducted in the area;
- The concerned government authorities should give attention to family planning methods to reduce the alarming population growth.
Author Contributions
Funding
Acknowledgments
Conflicts of Interest
Appendix A


References
- Verburg, P.H.; De Koning, G.H.J.; Kok, K.; Veldkamp, A.; Bouma, J. A spatial explicit allocation procedure for modelling the pattern of land use change based upon actual land use. Ecol. Model. 1999, 116, 45–61. [Google Scholar] [CrossRef]
- Lambin, E.F.; Rounsevell, M.D.A.; Geist, H.J. Are agricultural land-use models able to predict changes in land-use intensity? Agric. Ecosyst. Environ. 2000, 82, 321–331. [Google Scholar] [CrossRef]
- Petit, C.; Scudder, T.; Lambin, E. Quantifying processes of land-cover change by remote sensing: Resettlement and rapid land-cover changes in south-eastern Zambia. Int. J. Remote Sens. 2001, 22, 3435–3456. [Google Scholar] [CrossRef]
- Read, J.M.; Lam, N.S.N. Spatial methods for characterising land cover and detecting land-cover changes for the tropics. Int. J. Remote Sens. 2002, 23, 2457–2474. [Google Scholar] [CrossRef]
- Reid, R.S.; Kruska, R.L.; Muthui, N.; Taye, A.; Wotton, S.; Wilson, C.J.; Mulatu, W. Land-use and land-cover dynamics in response to changes in climatic, biological and socio-political forces: The case of southwestern Ethiopia. Landsc. Ecol. 2000, 15, 339–355. [Google Scholar] [CrossRef]
- Liang, S.; Fang, H.; Morisette, J.T.; Chen, M.; Shuey, C.J.; Walthall, C.L.; Daughtry, C.S.T. Atmospheric correction of landsat ETM+ land surface imagery—Part II: Validation and applications. IEEE Trans. Geosci. Remote Sens. 2002, 40, 2736–2746. [Google Scholar] [CrossRef] [Green Version]
- Ayele, G.T.; Demessie, S.S.; Mengistu, K.T.; Tilahun, S.A.; Melesse, A.M. Multitemporal Land Use/Land cover Change Detection for the Batena Watershed, Rift Valley Lakes Basin, Ethiopia. In Landscape Dynamics, Soils and Hydrological Processes in Varied Climates; Melesse, A.M., Abtew, W., Eds.; Springer International Publishing AG: Cham, Switzerland, 2016; pp. 51–72. [Google Scholar]
- Lambin, E.F. Modelling and monitoring land-cover change processes in tropical regions. Prog. Phys. Geogr. 1997, 21, 375–393. [Google Scholar] [CrossRef]
- Lupo, F.; Reginster, I.; Lambin, E.F. Monitoring land-cover changes in West Africa with spot vegetation: Impact of natural disasters in 1998–1999. Int. J. Remote Sens. 2001, 22, 2633–2639. [Google Scholar] [CrossRef]
- Hathout, S. The use of GIS for monitoring and predicting urban growth in East and West St Paul, Winnipeg, Manitoba, Canada. J. Environ. Manag. 2002, 66, 229–238. [Google Scholar] [CrossRef]
- Herold, M.; Gardner, M.E.; Roberts, D.A. Spectral resolution Requirements for Mapping urban Areas. IEEE Trans. Geosci. Remote Sens. 2003, 41, 1907–1919. [Google Scholar] [CrossRef] [Green Version]
- Lambin, E.F.; Geist, H.J.; Lepers, E. Dynamics of Land-Use and Land-Cover Change in Tropical Regions. Annu. Rev. Environ. Resour. 2003, 28, 205–241. [Google Scholar] [CrossRef] [Green Version]
- Yuan, F.; Sawaya, K.E.; Loeffelholz, B.C.; Bauer, M.E. Land cover classification and change analysis of the Twin Cities (Minnesota) metropolitan area by multitemporal Landsat remote sensing. Remote Sens. Environ. 2005, 98, 317–328. [Google Scholar] [CrossRef]
- Saadat, H.; Adamowski, J.; Bonnell, R.; Sharifi, F.; Namdar, M.; Ale-Ebrahim, S. Land use and land cover classification over a large area in Iran based on single date analysis of satellite imagery. ISPRS J. Photogramm. Remote Sens. 2011, 66, 608–619. [Google Scholar] [CrossRef]
- Selcuk, R.; Nisnci, R.; Uzun, B.; Yalçin, A.; Inan, H.; Yomralioglu, T. Monitoring Land–Use Changes by GIS and Remote Sensing Techniques: Case Study of Trabzon. In Proceedings of the 2nd FIG Regional Conference, Marrakech, Morocco, 2–5 December 2003; pp. 1–11. Available online: http://w.fig.net/resources/proceedings/fig_proceedings/morocco/proceedings/TS18/TS18_6_reis_el_al.pdf (accessed on 25 May 2020).
- Zhang, X.X.; Wu, P.F.; Chen, B. Relationship between vegetation greenness and urban heat island effect in Beijing City of China. Procedia Environ. Sci. 2010, 2, 1438–1450. [Google Scholar] [CrossRef] [Green Version]
- Batool, S.; Khan, K.; Ghaffar, A.; Hussain, S.Z. Forest Cover Change Detection and Its Impact on Rainfall Patternin Thak Valley (Pakistan). Pak. J. Sci. 2015, 67, 1–9. [Google Scholar]
- Jin, S.; Yang, L.; Danielson, P.; Homer, C.; Fry, J.; Xian, G. A comprehensive change detection method for updating the National Land Cover Database to circa 2011. Remote Sens. Environ. 2013, 132, 159–175. [Google Scholar] [CrossRef] [Green Version]
- Jia, K.; Wei, X.; Gu, X.; Yao, Y.; Xie, X.; Li, B. Land cover classification using Landsat 8 Operational Land Imager data in Beijing, China. Geocarto Int. 2014, 29, 941–951. [Google Scholar] [CrossRef]
- Zhu, Z.; Woodcock, C.E. Continuous change detection and classification of land cover using all available Landsat data. Remote Sens. Environ. 2014, 144, 152–171. [Google Scholar] [CrossRef] [Green Version]
- Zhang, P.; Lv, Z.; Shi, W. Local spectrum-trend similarity approach for detecting land-cover change by using SPOT-5 satellite images. IEEE Geosci. Remote Sens. Lett. 2014, 11, 738–742. [Google Scholar] [CrossRef]
- Phiri, D.; Morgenroth, J. Developments in Landsat land cover classification methods: A review. Remote Sens. 2017, 9, 967. [Google Scholar] [CrossRef] [Green Version]
- Jin, S.; Yang, L.; Zhu, Z.; Homer, C. A land cover change detection and classification protocol for updating Alaska NLCD 2001 to 2011. Remote Sens. Environ. 2017, 195, 44–55. [Google Scholar] [CrossRef]
- Sekertekin, A.; Marangoz, A.M.; Akcin, H. Pixel-based classification analysis of land use land cover using Sentinel-2 and Landsat-8 data. Int. Arch. Photogramm. Remote Sens. Spat. Inf. Sci. ISPRS Arch. 2017, 42, 91–93. [Google Scholar] [CrossRef] [Green Version]
- Lv, Z.; Liu, T.; Wan, Y.; Benediktsson, J.A.; Zhang, X. Post-processing approach for refining raw land cover change detection of very high-resolution remote sensing images. Remote Sens. 2018, 10, 472. [Google Scholar] [CrossRef] [Green Version]
- Wu, T.; Luo, J.; Fang, J.; Ma, J.; Song, X. Unsupervised object-based change detection via a weibull mixture model-based binarization for high-resolution remote sensing images. IEEE Geosci. Remote Sens. Lett. 2018, 15, 63–67. [Google Scholar] [CrossRef]
- Geist, H.J.; Lambin, E.F. What Drives Tropical Deforestation? In A Meta-Analysis of Proximate and Underlying Causes of Deforestation Based on Subnational Case Study Evidence; LUCC Report Series No. 4; LUCC International Project Office; University of Louvain: Louvain, Belgium, 2001; pp. 1–116. Available online: http://www.pik-potsdam.de/~luedeke/lucc4.pdf (accessed on 25 October 2019).
- Rawat, J.S.; Kumar, M. Monitoring land use/cover change using remote sensing and GIS techniques: A case study of Hawalbagh block, district Almora, Uttarakhand, India. Egypt. J. Remote Sens. Space Sci. 2015, 18, 77–84. [Google Scholar] [CrossRef] [Green Version]
- Voogt, J.A.; Oke, T.R. Thermal remote sensing of urban climates. Remote Sens. Environ. 2003, 86, 370–384. [Google Scholar] [CrossRef]
- Dinka, M.O. Analysing decadal land use/cover dynamics of the Lake Basaka catchment (Main Ethiopian Rift) using LANDSAT imagery and GIS. Lakes Reserv. Res. Manag. 2012, 17, 11–24. [Google Scholar] [CrossRef]
- Barlow, J.; Lennox, G.D.; Ferreira, J.; Berenguer, E.; Lees, A.C.; Mac Nally, R.; Thomson, J.R.; Ferraz, S.F.D.B.; Louzada, J.; Oliveira, V.H.F.; et al. Anthropogenic disturbance in tropical forests can double biodiversity loss from deforestation. Nature 2016, 535, 144–147. [Google Scholar] [CrossRef] [Green Version]
- Bruijnzeel, L.A. Hydrological functions of tropical forests: Not seeing the soil for the trees. Agric. Ecosyst. Environ. 2004, 104, 185–228. [Google Scholar] [CrossRef]
- Islam, K.; Jashimuddin, M.; Nath, B.; Nath, T.K. Land use classification and change detection by using multi-temporal remotely sensed imagery: The case of Chunati wildlife sanctuary, Bangladesh. Egypt. J. Remote Sens. Space Sci. 2018, 21, 37–47. [Google Scholar] [CrossRef]
- Tsegaye, D.; Moe, S.R.; Vedeld, P.; Aynekulu, E. Land-use/cover dynamics in Northern Afar rangelands, Ethiopia. Agric. Ecosyst. Environ. 2010, 139, 174–180. [Google Scholar] [CrossRef]
- Berhane, A.; Totland, Ø.; Moe, S.R. Woody plant assemblages in isolated forest patches in a semiarid agricultural matrix. Biodivers. Conserv. 2013, 22, 2519–2535. [Google Scholar] [CrossRef]
- Cuke, M.; Srivastava, D.S. Divergent effects of tropical forest fragmentation and conversion on leaf litter decomposition. Landsc. Ecol. 2016, 31, 1037–1050. [Google Scholar] [CrossRef]
- Fetene, A.; Hilker, T.; Yeshitela, K.; Prasse, R.; Cohen, W.; Yang, Z. Detecting Trends in Landuse and Landcover Change of Nech Sar National Park, Ethiopia. Environ. Manag. 2016, 57, 137–147. [Google Scholar] [CrossRef]
- Laurance, W.F. Theory meets reality: How habitat fragmentation research has transcended island biogeographic theory. Biol. Conserv. 2008, 141, 1731–1744. [Google Scholar] [CrossRef]
- Midha, N.; Mathur, P.K. Assessment of forest fragmentation in the conservation priority Dudhwa landscape, India using FRAGSTATS computed class level metrics. J. Indian Soc. Remote Sens. 2010, 38, 487–500. [Google Scholar] [CrossRef]
- Pinto-Ledezma, J.N.; Rivero Mamani, M.L. Temporal patterns of deforestation and fragmentation in lowland Bolivia: Implications for climate change. Clim. Chang. 2014, 127, 43–54. [Google Scholar] [CrossRef]
- Wang, J.; Yang, X. A hierarchical approach to forest landscape pattern characterization. Environ. Manag. 2012, 49, 64–81. [Google Scholar] [CrossRef]
- Zipperer, W.C.; Foresman, T.W.; Walker, S.P.; Daniel, C.T. Ecological consequences of fragmentation and deforestation in an urban landscape: A case study. Urban Ecosyst. 2012, 15, 533–544. [Google Scholar] [CrossRef]
- Mikias, B.M. Land Use/Land Cover Dynamics in the Central Rift Valley Region of Ethiopia: Case of Arsi Negele District. Afr. J. Agric. Res. 2015, 10, 434–449. [Google Scholar] [CrossRef]
- Mather, A.S.; Needle, C.L. The relationships of population and forest trends. Geogr. J. 2000, 166, 2–13. [Google Scholar] [CrossRef]
- Wang, X.; Zheng, D.; Shen, Y. Land use change and its driving forces on the Tibetan Plateau during 1990–2000. Catena 2008, 72, 56–66. [Google Scholar] [CrossRef]
- Geist, H.J.; Lambin, E.F. Proximate Causes and Underlying Driving Forces of Tropical Deforestation. Bioscience 2002, 52, 143–150. [Google Scholar] [CrossRef]
- Tole, L. A quantitative investigation of the population-land inequality-land clearance nexus. Popul. Environ. 2004, 26, 75–106. [Google Scholar] [CrossRef]
- Sands, R. Forestry in a Global Context. For. Policy Econ. 2008, 10, 428–429. [Google Scholar]
- Garedew, E.; Sandewall, M.; Söderberg, U.; Campbell, B.M. Land-use and land-cover dynamics in the central rift valley of Ethiopia. Environ. Manag. 2009, 44, 683–694. [Google Scholar] [CrossRef] [PubMed]
- Vilà, M.; Espinar, J.L.; Hejda, M.; Hulme, P.E.; Jarošík, V.; Maron, J.L.; Pergl, J.; Schaffner, U.; Sun, Y.; Pyšek, P. Ecological impacts of invasive alien plants: A meta-analysis of their effects on species, communities and ecosystems. Ecol. Lett. 2011, 14, 702–708. [Google Scholar] [CrossRef]
- Vilà, M.; Hulme, P.E. Non-native Species, Ecosystem Services, and Human Well-Being. In Impact of Biological Invasions on Ecosystem Services; Vilà, M., Hulme, P.E., Eds.; Springer International Publishing AG: Cham, Switzerland, 2017; Volume 12, pp. 1–14. [Google Scholar]
- Meshesha, D.T.; Tsunekawa, A.; Tsubo, M. Continuing land degradation: Cause-Effect in Ethiopia’s Central Rift Valley. Land Degrad. Dev. 2012, 23, 130–143. [Google Scholar] [CrossRef]
- United Nations: Department of Economic and Social Affairs. World Population Prospects 2019. Available online: https://population.un.org/wpp/ (accessed on 15 March 2020).
- Kebede, T.; Haile, A.; Dadi, H. Smallholder goat breeding and flock management practices in the central rift valley of Ethiopia. Trop. Anim. Health Prod. 2012, 44, 999–1006. [Google Scholar] [CrossRef]
- Bishaw, B. Deforestation and Land Degredation in the Ethiopian Highlands: A Strategy for Physical Recovery. Northeast Afr. Stud. 2001, 8, 7–25. [Google Scholar] [CrossRef]
- Awulachew, S.B.; McCartney, M.; Steenhuis, T.S.; Ahmed, A.A. A Review of Hydrology, Sediment and Water Resource Use in the Blue Nile Basin; International Water Management Institute: Colombo, Sri Lanka, 2008; Volume 131, p. 87. [Google Scholar]
- Gedefaw, A.A.; Atzberger, C.; Seher, W.; Mansberger, R. Farmers willingness to participate in voluntary land consolidation in Gozamin District, Ethiopia. Land 2019, 8, 148. [Google Scholar] [CrossRef] [Green Version]
- Central Statistical Agency of Ethiopia (CSA). Summary and Statistical Report of the 2007 Population and Housing Census; CSA: Addis Ababa, Ethiopia, 2008; Available online: http://www.ethiopianreview.com/pdf/001/Cen2007.pdf (accessed on 19 November 2019).
- Vuolo, F.; Zóltak, M.; Pipitone, C.; Zappa, L.; Wenng, H.; Immitzer, M.; Weiss, M.; Baret, F.; Atzberger, C. Data service platform for Sentinel-2 surface reflectance and value-added products: System use and examples. Remote Sens. 2016, 8, 938. [Google Scholar] [CrossRef] [Green Version]
- Chanda, B.; Majumder, D.D. Digital Image Processing and Analysis, 2nd ed.; Prentice-Hall of India Pvt. Ltd.: New Delhi, India, 2011; pp. 1–488. [Google Scholar]
- Lillesand, T.M.; Kiefer, R.R.W.; Chipman, J.W. Remote Sensing and Image Interpretation, 7th ed.; John Wiley & Sons: New York, NY, USA, 2008; pp. 1–736. [Google Scholar]
- Di Gregorio, A.; Jansen, L.J.M. Land Cover Classification System: Classification Concepts and User Manual; Food and Agriculture Organization of the United Nations: Rome, Italy, 2005. [Google Scholar]
- Gupta, R.P. Remote Sensing Geology, 2nd ed.; Springer: GmbH, Germany, 2003; pp. 1–592. [Google Scholar]
- Harris, P.M.; Ventura, S.J. The Integration of Geographic Data with Remotely sensed Imagery to Improve Classification in an Urban Area. Amer. Soc. Photo. Rem. Sens. 1995, 61, 993–998. [Google Scholar]
- Cheruto, M.C.; Kauti, M.K.; Kisangau, P.D.; Kariuki, P. Assessment of Land Use and Land Cover Change Using GIS and Remote Sensing. J. Remote Sens. GIS 2016, 5, 1–6. [Google Scholar] [CrossRef]
- Barson, M.; Lesslie, R.; Smith, J.; Stewart, J. Developing land Cover and Land Use Data Sets for the Australian Continent—A Collaborative Approach; Bureau of Rural Sciences: Canberra, Australia, 2020; Available online: www.aag.org/galleries/nalcs/CH5.pdf (accessed on 12 January 2020).
- Congalton, R.G. A review of assessing the accuracy of classifications of remotely sensed data. Remote Sens. Environ. 1991, 37, 35–46. [Google Scholar] [CrossRef]
- Eckert, S.; Kiteme, B.; Njuguna, E.; Zaehringer, J.G. Agricultural expansion and intensification in the foothills of Mount Kenya: A landscape perspective. Remote Sens. 2017, 9, 784. [Google Scholar] [CrossRef] [Green Version]
- Kindu, M.; Schneider, T.; Teketay, D.; Knoke, T. Changes of ecosystem service values in response to land use/land cover dynamics in Munessa-Shashemene landscape of the Ethiopian highlands. Sci. Total Environ. 2016, 547, 137–147. [Google Scholar] [CrossRef]
- Zewdie, W.; Csaplovics, E. Remote sensing based multi-temporal land cover classification and change detection in northwestern Ethiopia. Eur. J. Remote Sens. 2015, 48, 121–139. [Google Scholar] [CrossRef] [Green Version]
- Gashaw, T.; Tulu, T.; Argaw, M.; Worqlul, A.W.; Tolessa, T.; Kindu, M. Estimating the impacts of land use/land cover changes on Ecosystem Service Values: The case of the Andassa watershed in the Upper Blue Nile basin of Ethiopia. Ecosyst. Serv. 2018, 31, 219–228. [Google Scholar] [CrossRef]
- Temesgen, H.; Wu, W.; Shi, X.; Yirsaw, E.; Bekele, B.; Kindu, M. Variation in ecosystem service values in an agroforestry dominated landscape in Ethiopia: Implications for land use and conservation policy. Sustainability 2018, 10, 1126. [Google Scholar] [CrossRef] [Green Version]
- Alo, C.A.; Pontius, R.G. Identifying systematic land-cover transitions using remote sensing and GIS: The fate of forests inside and outside protected areas of Southwestern Ghana. Environ. Plan. B Plan. Des. 2008, 35, 280–295. [Google Scholar] [CrossRef]
- Puyravaud, J.P. Standardizing the calculation of the annual rate of deforestation. For. Ecol. Manag. 2003, 177, 593–596. [Google Scholar] [CrossRef]
- Tilahun, M.; Birner, R.; Ilukor, J. Household-level preferences for mitigation of Prosopis juliflora invasion in the Afar region of Ethiopia: A contingent valuation. J. Environ. Plan. Manag. 2017, 60, 282–308. [Google Scholar] [CrossRef]
- Cochran, W.G. Sampling Techniques, 3rd ed.; John Wiley & Sons: New York, NY, USA, 1977; pp. 89–97. [Google Scholar]
- UN Environment Programme. Global Environment Outlook. GEO 4 Environment for Development; United Nations Environment Programme: Valletta, Malta, 2007; Available online: https://www.unenvironment.org/resources/global-environment-outlook-4 (accessed on 12 October 2019).
- Peirce, M. Computer–Based Models in Integrated Environmental Assessment; EEA Tech. Rep. No. 14/1998; European Environment Agency: Copenhagen, Denmark, 1998; Available online: https://www.eea.europa.eu/publications/TEC14 (accessed on 26 February 2020).
- Edith, S.; Weterings, R. Environmental Indicators: Typology and Overview; EEA Tech. Rep. No. 25/1999; European Environment Agency: Copenhagen, Denmark, 1999; Available online: https://www.eea.europa.eu/publications/TEC25 (accessed on 24 November 2019).
- Gabrielsen, P.; Bosch, P. Environmental indicators: Typology and use in reporting. In Internal Working Paper; European Environmental Agency: Copenhagen, Denmark, 2003; pp. 1–20. Available online: https://www.researchgate.net/publication/237573469 (accessed on 15 September 2019).
- Geist, H.; McConnell, W.; Lambin, E.F.; Moran, E.; Alves, D.; Rudel, T. Causes and Trajectories of Land-Use/Cover Change. In Land-Use and Land-Cover Change: Local Processes and Global Impacts; Lambin, E.F., Geist, H., Eds.; Springer International Publishing: Cham, Switzerland, 2006; pp. 41–70. [Google Scholar]
- Miheretu, B.A.; Yimer, A.A. Determinants of farmers’ adoption of land management practices in Gelana sub-watershed of Northern highlands of Ethiopia. Ecol. Process. 2017, 6, 191. [Google Scholar] [CrossRef] [Green Version]
- Wubie, M.A.; Assen, M.; Nicolau, M.D. Patterns, causes and consequences of land use/cover dynamics in the Gumara watershed of lake Tana basin, Northwestern Ethiopia. Environ. Syst. Res. 2016, 5, 155. [Google Scholar] [CrossRef] [Green Version]
- Gashaw, T.; Tulu, T.; Argaw, M.; Worqlul, A.W. Evaluation and prediction of land use/land cover changes in the Andassa watershed, Blue Nile Basin, Ethiopia. Environ. Syst. Res. 2017, 6, 1–15. [Google Scholar] [CrossRef]
- Food and Agricultural Organization. Methodological Framework for Land Degradation Assessment in Drylands (LADA). Development 2006, 7, 10. [Google Scholar]
- Erickson, D.L. Rural land use and land cover change. Implications for local planning in the River Raisin watershed. Land Use Policy 1995, 12, 223–236. [Google Scholar] [CrossRef]
- Bewket, W. Land Cover Dynamics since the 1950s in Chemoga Watershed, Blue Nile Basin, Ethiopia. Mt. Res. Dev. 2002, 22, 263–269. [Google Scholar] [CrossRef] [Green Version]
- Gebrehiwot, S.G.; Bewket, W.; Gärdenäs, A.I.; Bishop, K. Forest cover change over four decades in the Blue Nile Basin, Ethiopia: Comparison of three watersheds. Reg. Environ. Chang. 2014, 14, 253–266. [Google Scholar] [CrossRef]
- Nyssen, J.; Simegn, G.; Taha, N. An upland farming system under transformation: Proximate causes of land use change in Bela-Welleh catchment (Wag, Northern Ethiopian Highlands). Soil Tillage Res. 2009, 103, 231–238. [Google Scholar] [CrossRef]
- Sewnet, A. Land use/cover change at Infraz watershed by using GIS and remote sensing techniques, northwestern Ethiopia. Int. J. River Basin Manag. 2016, 14, 133–142. [Google Scholar] [CrossRef]
- FAO. The Global Forest Resources Assessment 2010 Summary Report; FAO: Rome, Italy, 2010. [Google Scholar]
- Mekonnen, Z.; Kassa, H.; Lemenh, M.; Campbell, B. The role and management of eucalyptus in lode hetosa district, central Ethiopia. For. Trees Livelihoods 2007, 17, 309–323. [Google Scholar] [CrossRef]
- Minale, A.S.; Kameswara Rao, K. Impacts of land cover/use dynamics of Gilgel Abbay catchment of Lake Tana on climate variability, Northwestern Ethiopia. Appl. Geomatics 2012, 4, 155–162. [Google Scholar] [CrossRef]
- Garede, N.M.; Sewnet, A.; Ph, M. Land Use/Cover Dynamics in Ribb Watershed, North Western. J. Nat. Sci. Res. 2014, 4, 9–17. [Google Scholar]
- Melesse, A.M.; Abtew, W. Analyses of land use/land cover change Dynamics in the upland watersheds of upper Blue nile Basin. In Landscape Dynamics, Soils and Hydrological Processes in Varied Climates; Springer: Cham, Switzerland, 2015; pp. 73–91. [Google Scholar]
- Serra, P.; Pons, X.; Saurí, D. Land-cover and land-use change in a Mediterranean landscape: A spatial analysis of driving forces integrating biophysical and human factors. Appl. Geogr. 2008, 28, 189–209. [Google Scholar] [CrossRef]
- İlay, R.; Kavdir, Y. Impact of land cover types on soil aggregate stability and erodibility. Environ. Monit. Assess. 2018, 190, 525. [Google Scholar] [CrossRef]
- Getachew, H.E.; Melesse, A.M. The Impact of Land Use Change on the Hydrology of the Angereb Watershed, Ethiopia. Int. J. Water Sci. 2012, 1, 1–7. [Google Scholar]
- Haregeweyn, N.; Fikadu, G.; Tsunekawa, A.; Tsubo, M.; Meshesha, D.T. The dynamics of urban expansion and its impacts on land use/land cover change and small-scale farmers living near the urban fringe: A case study of Bahir Dar, Ethiopia. Landsc. Urban Plan. 2012, 106, 149–157. [Google Scholar] [CrossRef]
- Hassen, E.E.; Assen, M. Land use/cover dynamics and its drivers in Gelda catchment, Lake Tana watershed, Ethiopia. Environ. Syst. Res. 2017, 6, 1–13. [Google Scholar] [CrossRef] [Green Version]
- Tekle, K.; Hedlund, L. Land Cover Changes between 1958 and 1986 in Kalu District, Southern Wello, Ethiopia. Mt. Res. Dev. 2000, 20, 42–51. [Google Scholar] [CrossRef]
- Alemayehu, F.; Taha, N.; Nyssen, J.; Girma, A.; Zenebe, A.; Behailu, M.; Deckers, S.; Poesen, J. The impacts of watershed management on land use and land cover dynamics in Eastern Tigray (Ethiopia). Resour. Conserv. Recycl. 2009, 53, 192–198. [Google Scholar] [CrossRef]
- Yeshaneh, E.; Wagner, W.; Exner-Kittridge, M.; Legesse, D.; Blöschl, G. Identifying land use/cover dynamics in the koga catchment, Ethiopia, from multi-scale data, and implications for environmental change. ISPRS Int. J. Geo-Inf. 2013, 2, 302–323. [Google Scholar] [CrossRef] [Green Version]
- Garedew, E.; Sandewall, M.; Soderberg, U. A dynamic simulation model of land-use, population, and rural livelihoods in the central rift valley of Ethiopia. Environ. Manag. 2012, 49, 151–162. [Google Scholar] [CrossRef] [PubMed] [Green Version]
- Teka, K.; Van Rompaey, A.; Poesen, J. Assessing the role of policies on land use change and agricultural development since 1960s in northern Ethiopia. Land Use Policy 2013, 30, 944–951. [Google Scholar] [CrossRef]
- Descheemaeker, K.; Nyssen, J.; Poesen, J.; Raes, D.; Haile, M.; Muys, B.; Deckers, S. Runoff on slopes with restoring vegetation: A case study from the Tigray highlands, Ethiopia. J. Hydrol. 2006, 331, 219–241. [Google Scholar] [CrossRef]
- Turner, A. Population priorities: The challenge of continued rapid population growth. Philos. Trans. R. Soc. B Biol. Sci. 2009, 364, 2977–2984. [Google Scholar] [CrossRef]
- Central Statistical Agency of Ethiopia (CSA). Ethiopia Demographic and Health Survey 2016; CSA: Addis Ababa, Ethiopia; ICF: Rockville, MD, USA, 2016; Available online: https://dhsprogram.com/pubs/pdf/FR328/FR328.pdf (accessed on 15 December 2019).
- Tsegaye, A.; Adgo, E.G.; Selassie, Y. Impact of Land Certification on Sustainable Land Resource Management in Dryland Areas of Eastern Amhara Region, Ethiopia. J. Agric. Sci. 2012, 4, 261–268. [Google Scholar] [CrossRef]
- Meshesha, D.T.; Tsunekawa, A.; Tsubo, M.; Ali, S.A.; Haregeweyn, N. Land-use change and its socio-environmental impact in Eastern Ethiopia’s highland. Reg. Environ. Chang. 2014, 14, 757–768. [Google Scholar] [CrossRef]
- Mantyka-Pringle, C.S.; Visconti, P.; Di Marco, M.; Martin, T.G.; Rondinini, C.; Rhodes, J.R. Climate change modifies risk of global biodiversity loss due to land-cover change. Biol. Conserv. 2015, 187, 103–111. [Google Scholar] [CrossRef] [Green Version]
- Schulp, C.J.E.; Van Teeffelen, A.J.A.; Tucker, G.; Verburg, P.H. A quantitative assessment of policy options for no net loss of biodiversity and ecosystem services in the European Union. Land Use Policy 2016, 57, 151–163. [Google Scholar] [CrossRef]
- Eitelberg, D.A.; van Vliet, J.; Doelman, J.C.; Stehfest, E.; Verburg, P.H. Demand for biodiversity protection and carbon storage as drivers of global land change scenarios. Glob. Environ. Chang. 2016, 40, 101–111. [Google Scholar] [CrossRef]
- Masum, K.M.; Mansor, A.; Sah, S.A.M.; Lim, H.S. Effect of differential forest management on land-use change (LUC) in a tropical hill forest of Malaysia. J. Environ. Manag. 2017, 200, 468–474. [Google Scholar] [CrossRef] [PubMed]
- Liu, Y.; Zhang, L.; Wei, X.; Xie, P. Integrating the spatial proximity effect into the assessment of changes in ecosystem services for biodiversity conservation. Ecol. Indic. 2016, 70, 382–392. [Google Scholar] [CrossRef]
- Chaudhary, A.; Kastner, T. Land use biodiversity impacts embodied in international food trade. Glob. Environ. Chang. 2016, 38, 195–204. [Google Scholar] [CrossRef]
- Cervelli, E.; Pindozzi, S.; Sacchi, M.; Capolupo, A.; Cialdea, D.; Rigillo, M.; Boccia, L. Supporting land use change assessment through Ecosystem Services and Wildlife Indexes. Land Use Policy 2017, 65, 249–265. [Google Scholar] [CrossRef]

| Satellite | Sensor | Acquisition Date | Bands Used | Spatial Resolution |
|---|---|---|---|---|
| Sentinel-2 | Multispectral Imager (MSI) | 2018/2/6 | Visible (B2, B3, B4) | 10 m |
| NIR (B8, B8A) | 10 and 20 m | |||
| Red Edge (B5, B6, B7) | 20 m | |||
| SWIR (B11, B12) | 20 m | |||
| Landsat 7 | Enhanced Thematic Mapper (ETM+) | 2003/2/4 | Visible (B1, B2, B3) | 30 m |
| NIR (B4) | 30 m | |||
| SWIR (B5, B7) | 30 m | |||
| Landsat 5 | Thematic Mapper (TM) | 1986/1/12 | Visible (B1, B2, B3) | 30 m |
| NIR (B4) | 30 m | |||
| SWIR (B5, B7) | 30 m |
| Land Cover Type | Description of Each Land Cover Type |
|---|---|
| Forest | Natural forest and plantation area with mainly planted eucalyptus trees. Areas covered by trees (eucalyptus) forming closed or nearly closed canopies; forest; plantation forest; dense (50%-80% crown cover) predominant species like Juniperus procera. |
| Grassland | Land covered with natural grass, or dominated by grass, it includes areas used for communal grazing as well as a bare land that is seasonally grass-covered. |
| Cropland | Rain-fed agricultural land, both small- and large-scale, cropped at least once per year. Areas of land prepared for crop production. This category includes areas currently covered by crops, areas prepared for cultivation, and fallow plots. |
| Built-up areas | Areas are mainly scattered rural settlement and rural institutions such as schools and clinics. |
| Shrubs and scattered vegetation | Land covered by small trees, thorny bushes, and short shrubs, in some cases mixed with grasses, less dense than forests. |
| Bare land | Areas of land which are not covered by any type of vegetation due to erosion, over grazing and cultivation. Areas without any vegetation due to either erosion or mismanagement (especially over grazing); also covered by bare soil and exposed rocks. |
| Water bodies | Permanent rivers and fresh water (rivers, streams, intermittent ponds and canals). It also includes wetlands, which dry up during the dry season. |
| Land Cover Type | Area | |||||
|---|---|---|---|---|---|---|
| 1986 | 2003 | 2018 | ||||
| (ha) | (%) | (ha) | (%) | (ha) | (%) | |
| Forest | 18,630.4 | 15.30 | 22,880.2 | 18.79 | 34,959.2 | 28.77 |
| Grassland | 31,336.7 | 25.72 | 25,301.6 | 20.77 | 24,392.2 | 20.02 |
| Cropland | 52,640.4 | 43.21 | 52,360.1 | 42.98 | 39,813.8 | 32.68 |
| Built-up | 548.8 | 0.45 | 1961.1 | 1.61 | 5451.3 | 4.47 |
| Shrub/Veg | 13,070.3 | 10.73 | 15,536.0 | 12.75 | 14,259.7 | 11.71 |
| Bare areas | 5479.1 | 4.50 | 3630.2 | 2.98 | 2526.6 | 2.01 |
| Water body | 115.1 | 0.09 | 151.6 | 0.12 | 418 | 0.34 |
| Land Cover Type | 1986 | 2003 | 2018 | |||
|---|---|---|---|---|---|---|
| User’s Accuracy | Producer’s Accuracy | User’s Accuracy | Producer’s Accuracy | User’s Accuracy | Producer’s Accuracy | |
| Forest | 96.5 | 93.9 | 94.9 | 98.9 | 96.5 | 98.8 |
| Grassland | 94.7 | 96.4 | 96.1 | 93.7 | 97.5 | 96.3 |
| Cropland | 79.8 | 98.4 | 80.4 | 97.5 | 96.4 | 91.9 |
| Built-up | 87 | 50 | 96 | 55 | 85.7 | 98.3 |
| Shrub/Sc. Vegetation | 87.5 | 89.7 | 100 | 90.9 | 94.1 | 80 |
| Bare areas | 85 | 63 | 98 | 78 | 95.1 | 75.7 |
| Water bodies | 100 | 75 | 100 | 96.3 | 100 | 97.1 |
| Overall accuracy | 87.7% | 89.2% | 94.9% | |||
| Kappa statistics | 0.83 | 0.86 | 0.93 | |||
| Land Cover Type | Change (%) | Net Change (ha) | Rate of Change (ha/Year) | ||||||
|---|---|---|---|---|---|---|---|---|---|
| 1986–2003 | 2003–2018 | 1986–2018 | 1986–2003 | 2003–2018 | 1986–2018 | 1986–2003 | 2003–2018 | 1986–2018 | |
| Forest | 3.49 | 9.98 | 13.47 | 4249.8 | 12,079 | 16,328.8 | 249.9 | 805.3 | 510.3 |
| Grassland | −4.95 | −0.75 | −5.7 | −6035.1 | −909.4 | −6944.5 | −355.0 | −60.6 | −217.0 |
| Cropland | −0.23 | −10.3 | −10.53 | −280.3 | −12,546.3 | −12,826.6 | −16.5 | −836.4 | −400.8 |
| Built-up | 1.16 | 2.86 | 4.02 | 1412.3 | 3490.2 | 4902.5 | 83.1 | 232.7 | 153.2 |
| Shrub/Veg | 2.02 | −1.04 | 0.98 | 2465.7 | −1276.3 | 1189.4 | 145.0 | −85.1 | 37.2 |
| Bare areas | −1.52 | −0.97 | −2.49 | −1848.9 | −1103.6 | −2952.5 | −108.8 | −73.6 | −92.3 |
| Water body | 0.03 | 0.22 | 0.25 | 36.5 | 266.4 | 302.9 | 2.1 | 17.8 | 9.5 |
| Drivers of Land Cover Change | Total | % |
|---|---|---|
| Increment of population growth | 286 | 83.4 |
| Overuse of land | 234 | 68.2 |
| Reduced farm size | 211 | 61.5 |
| Climate change | 229 | 66.8 |
| Rural land tenure system | 245 | 71.4 |
| High wood demand | 143 | 41.7 |
| Scarcity of grazing land | 219 | 63.8 |
| Pressures of Land Cover Change | Total | % |
|---|---|---|
| Competition on communal land | 240 | 70.0 |
| Over grazing of land | 256 | 74.6 |
| Demand for agricultural land | 277 | 80.8 |
| Increased demand for forest product | 151 | 44.0 |
| Agro-forestry | 260 | 75.8 |
| Selective cutting of trees | 227 | 66.2 |
| Soil moisture change | 158 | 46.1 |
| States of Land Cover Change | Total | % |
|---|---|---|
| Rainfall variability | 251 | 73.2 |
| Soil erosion | 211 | 61.5 |
| Forest cover change | 292 | 85.1 |
| Loss of soil fertility | 231 | 67.3 |
| Increase of land prices | 264 | 77.0 |
| Increased land fragmentation | 255 | 74.3 |
| Biodiversity change | 270 | 78.7 |
| Impacts of Land Cover Change | Total | % |
|---|---|---|
| Increase rural to urban migration | 279 | 81.3 |
| Scarcity of land | 261 | 76.1 |
| Land productivity decline | 233 | 67.9 |
| Change in population size | 273 | 79.6 |
| Loss of soil quality | 221 | 64.4 |
| Loss of biodiversity | 186 | 54.2 |
| Increase resource consumption | 231 | 67.3 |
| Responses of Land Cover Change | Total | % |
|---|---|---|
| Conservation and rehabilitation of resource | 284 | 82.8 |
| Investment in land resource | 184 | 53.6 |
| Raising awareness of farmers in land management | 299 | 87.2 |
| Applying appropriate land use planning | 236 | 68.8 |
© 2020 by the authors. Licensee MDPI, Basel, Switzerland. This article is an open access article distributed under the terms and conditions of the Creative Commons Attribution (CC BY) license (http://creativecommons.org/licenses/by/4.0/).
Share and Cite
Gedefaw, A.A.; Atzberger, C.; Bauer, T.; Agegnehu, S.K.; Mansberger, R. Analysis of Land Cover Change Detection in Gozamin District, Ethiopia: From Remote Sensing and DPSIR Perspectives. Sustainability 2020, 12, 4534. https://doi.org/10.3390/su12114534
Gedefaw AA, Atzberger C, Bauer T, Agegnehu SK, Mansberger R. Analysis of Land Cover Change Detection in Gozamin District, Ethiopia: From Remote Sensing and DPSIR Perspectives. Sustainability. 2020; 12(11):4534. https://doi.org/10.3390/su12114534
Chicago/Turabian StyleGedefaw, Abebaw Andarge, Clement Atzberger, Thomas Bauer, Sayeh Kassaw Agegnehu, and Reinfried Mansberger. 2020. "Analysis of Land Cover Change Detection in Gozamin District, Ethiopia: From Remote Sensing and DPSIR Perspectives" Sustainability 12, no. 11: 4534. https://doi.org/10.3390/su12114534