Article

Clear Data as a New Data Typology to Enhance Sustainability in Sport

1
School of Applied Sciences, Abertay University, Dundee DD1 1HG, UK
2
Skoosh, Sydney, NSW 2000, Australia
3
MaxCoaching, Sydney, NSW 2000, Australia
*
Author to whom correspondence should be addressed.
Sustainability 2020, 12(11), 4527; https://doi.org/10.3390/su12114527
Submission received: 14 May 2020 / Revised: 27 May 2020 / Accepted: 30 May 2020 / Published: 2 June 2020
(This article belongs to the Special Issue Sport Policy and Finance)

Abstract

:
(1) Background: Data-driven analysis and decision-making are playing an increasingly crucial role in improving organizational sustainability. This paper introduces clear data as a new typology. Further, it explores the utility of clear data to enhance sustainability in sport by enabling informed decision-making for the provision of targeted support to all stakeholders. We propose this typology to capture transparent data across an organization that assess levels of perceived and received support in key areas as validated by stakeholders. (2) Methods: Item development, content validation, instrument reliability, and utility of a survey designed to enhance sustainability in the sports industry is described. (3) Results: The instrument validation process found a high level of agreement among expert panel members, excellent test consistency, and high test–retest reliability. (4) Conclusions: Recommendations are provided for how clear data can enhance sustainability in sport.

1. Introduction

Organizational sustainability increasingly relies on collection and analysis of critical, reliable, and meaningful data. However, the impact of data cannot be realized without transparency [1]. This paper presents a new data typology based on the development and testing of a tool measuring perceived and received support. We propose the term clear data to capture information for organizations as validated by their stakeholders. This paper describes the development, testing, and validation of a survey instrument designed to enhance sustainability in sports. The utility of the instrument in the sports industry is also evaluated and discussed.
Data can be generated through captured or derived data. Captured data are generated through different forms of measurement (e.g., surveys, observations, and lab and field experiments), while derived data are produced through additional processing or analysis of captured data [2].
There are also different types of data. Primary data are generated within a research design. Secondary data are made available to others to reuse and analyze after they are generated by someone else. Other data typologies have also recently been introduced, including big data (i.e., large, diverse sets of information that grow at ever-increasing rates [3]), open data (i.e., data freely available to anyone in terms of their use and rights to republish within restrictions [4]), and gray data (i.e., user-generated web content, e.g., tweets, Facebook status/link postings, that is less formal than gray literature [5]). Further specialist understanding is needed on types of data required to enhance organizational sustainability [6].
Sports have a unique, high profile position in society, and are significant because of the potential wide-ranging benefits (e.g., positive mental well-being) [7]. However, there is a risk that these benefits will not be fully realized due to the challenges faced by sports organizations to demonstrate improvements with regard to duty of care issues without a mechanism to quantify the area [8]. Therefore, the aim of this paper is to develop, validate, and test the utility of a new measure of duty of care in sport designed to enhance sustainability in sport.

2. Instrument Validation

The validation process included item development, content validation, and instrument reliability.

2.1. Item Development

In 2016, the Government of the United Kingdom issued a call for evidence for a review into the sport sector’s duty of care as part of a new sport strategy, Sporting Future [9]. A public consultation was open for six weeks and 375 responses were received from organizations and individuals. In 2017, Grey-Thompson published a report based on the findings and proposed a framework with the following seven content domains: Safeguarding; Equality, Diversity and Inclusion; Prevention and Management of Medical Issues and Injuries; Entering and Leaving Talent Pathways; Mental Welfare; Representation of Athlete’s Interests; and Formal Education [8]. Grey-Thompson’s report concluded with a number of priority recommendations, including the creation of an independent sports ombudsman, a named board member responsible for duty of care, exit surveys for elite athletes, and establishment of a duty of care charter. Another priority recommendation was that duty of care should be measured via an independent survey giving equal voice to all stakeholders in the system and assessing levels of perceived and received support in sport [8]. Based on this recommendation and the seven content domains, the authors developed an initial questionnaire for content validation.
The initial questionnaire contained 14 items on a Likert-type response scale from 1 to 10. Seven items were included to measure perceived support with the stem: “To what extent was support available in your sport for…” followed by each of the seven content domain areas (e.g., “To what extent was support available in your sport for Safeguarding?”). Seven items were also included to measure received support with the stem: “To what extent have you been supported from your sport for…” followed by each of the seven content domain areas (e.g., “To what extent have you been supported from your sport for Mental Welfare?”). A higher score on each of the 14 questions indicated a greater extent of perceived support (items 1–7) or received support (items 8–14).

2.2. Content Validation

An expert panel was recruited to evaluate the content validity of the domains of interest and also the content validity of individual questionnaire items in two separate validation rounds.
Initially, 25 experts were identified and invited to participate in the validation process. Criteria used for the inclusion of experts included experience in the sports industry for more than 10 years and familiarity with the content domains in research or practice [10]. Twenty-three participants (13 female participants, 10 male participants; 12 with familiarity with the content domains in research, 11 with familiarity with the content domains in practice) agreed to participate and provided written consent prior to taking part in the validity assessment.
Information was distributed to each expert panel member electronically (via email) and returned to the first author via the same medium. In the first validation round, all panel members were provided with instructions to review and rate each of the seven content domain areas (i.e., Safeguarding; Equality, Diversity, and Inclusion; Prevention and Management of Medical Issues and Injuries; Entering and Leaving Talent Pathways; Mental Welfare; Representation of Athlete’s Interests; and Formal Education) based on a 4-point ordinal scale (1 = not relevant, 2 = somewhat relevant, 3 = quite relevant, 4 = highly relevant), and also to provide feedback on any deficient content domain areas or ways to improve the wording. They were also invited to review and rate the two uniform questionnaire (stem) items related to perceived support (i.e., “To what extent was support available in your sport for…”) and received support (i.e., “To what extent have you been supported from your sport for…”) based on a 4-point ordinal scale, and were requested to provide feedback on any perceived inconsistency or potential difficulty regarding the clarity of the individual items.
Content validity indices (CVI) were calculated to determine the validity of the content domain areas and individual questionnaire items for the first validation round. CVI is the proportion of agreement among expert panel members (reported as a value between 0 and 1) [11]. To calculate the CVI for each, the number of experts rating the content domain of interest/item as quite relevant or highly relevant (rating 3 or 4) was divided by the overall number of expert panel members. A CVI greater than 0.78 denotes a high level of agreement [12].
The CVI calculations for the first validation round were as follows: Safeguarding (1.0); Equality, Diversity, and Inclusion (0.96); Prevention and Management of Medical Issues and Injuries (0.91); Entering and Leaving Talent Pathways (0.83); Mental Welfare (0.87); Representation of Athlete’s Interests (0.83); Formal Education (0.96); perceived support (0.91); and received support (0.91).
Based on the first validation round ratings and feedback from panel members on the content domain areas, the wording of some of the seven domains of interests were changed to the following: Safeguarding; Equality, Diversity, and Inclusion; Safety, Injury, and Medical; Transition; Mental Health; Representation of Participant’s Voice; and Education.
Based on the first validation round ratings and feedback from panel members on the questionnaire items, the wording of the two stem items related to perceived support and received support were changed to include a temporal aspect (i.e., within 12 months) as follows, respectively: “In the last 12 months did you need support from your sport for…”, and “In the last 12 months to what extent were you supported from your sport for…”. Following each individual question related to perceived support, an item was added to assess whether the person completing the questionnaire had required support in each of the seven specific content domain areas over the last 12 months (with a dichotomous, yes/no response; e.g., “In the last 12 months did you need support from your sport for Education?”). Finally, in order to capture Grey-Thompson’s [8] recommendation for the survey to give equal voice to all stakeholders in the system, a demographic question was added asking participants their name, sport, and role (i.e., recreation participant, athlete, coach, referee, staff, volunteer, or other).
In the second validation round, expert panel members followed the same procedure as the first validation round and the CVI calculations were as follows: Safeguarding (1.0); Equality, Diversity, and Inclusion (1.0); Safety, Injury, and Medical (0.96); Transition (0.91); Mental Health (1.0); Representation of Participant’s Voice (0.96); Education (1.0); perceived support (1.0); received support (1.0); whether support was needed in a specific domain area over the last 12 months (1.0); and demographic (1.0). Feedback received from panel members with regard to content domain areas or questionnaire items included anonymizing the questionnaire and only asking participants their sport and role (i.e., recreation participant, athlete, coach, referee, staff, volunteer, or other).

2.3. Instrument Reliability

Retest reliability was assessed based on the questionnaire established following instrument validation, containing 21 items: 14 uniform questions on a Likert-type scale from 1 to 10, and also seven dichotomous (yes/no) response items.
During a two-week period, university students (N = 107) who participated in sports either as a recreation participant (n = 61), athlete (n = 21), coach (n = 7), staff (n = 2), volunteer (n = 7), referee (n = 2), or in some other capacity (n = 4) were invited to complete the questionnaire on two occasions. Fifty-two different sports were represented.
Intraclass reliability coefficients ranged from 0.78 to 0.93, indicating good to excellent test–retest reliability across each single-item measure [13] (Table 1). For the seven dichotomous response items, there was excellent test consistency with only eight discrepancies in total between Test 1 and Test 2 (0.98–0.99).

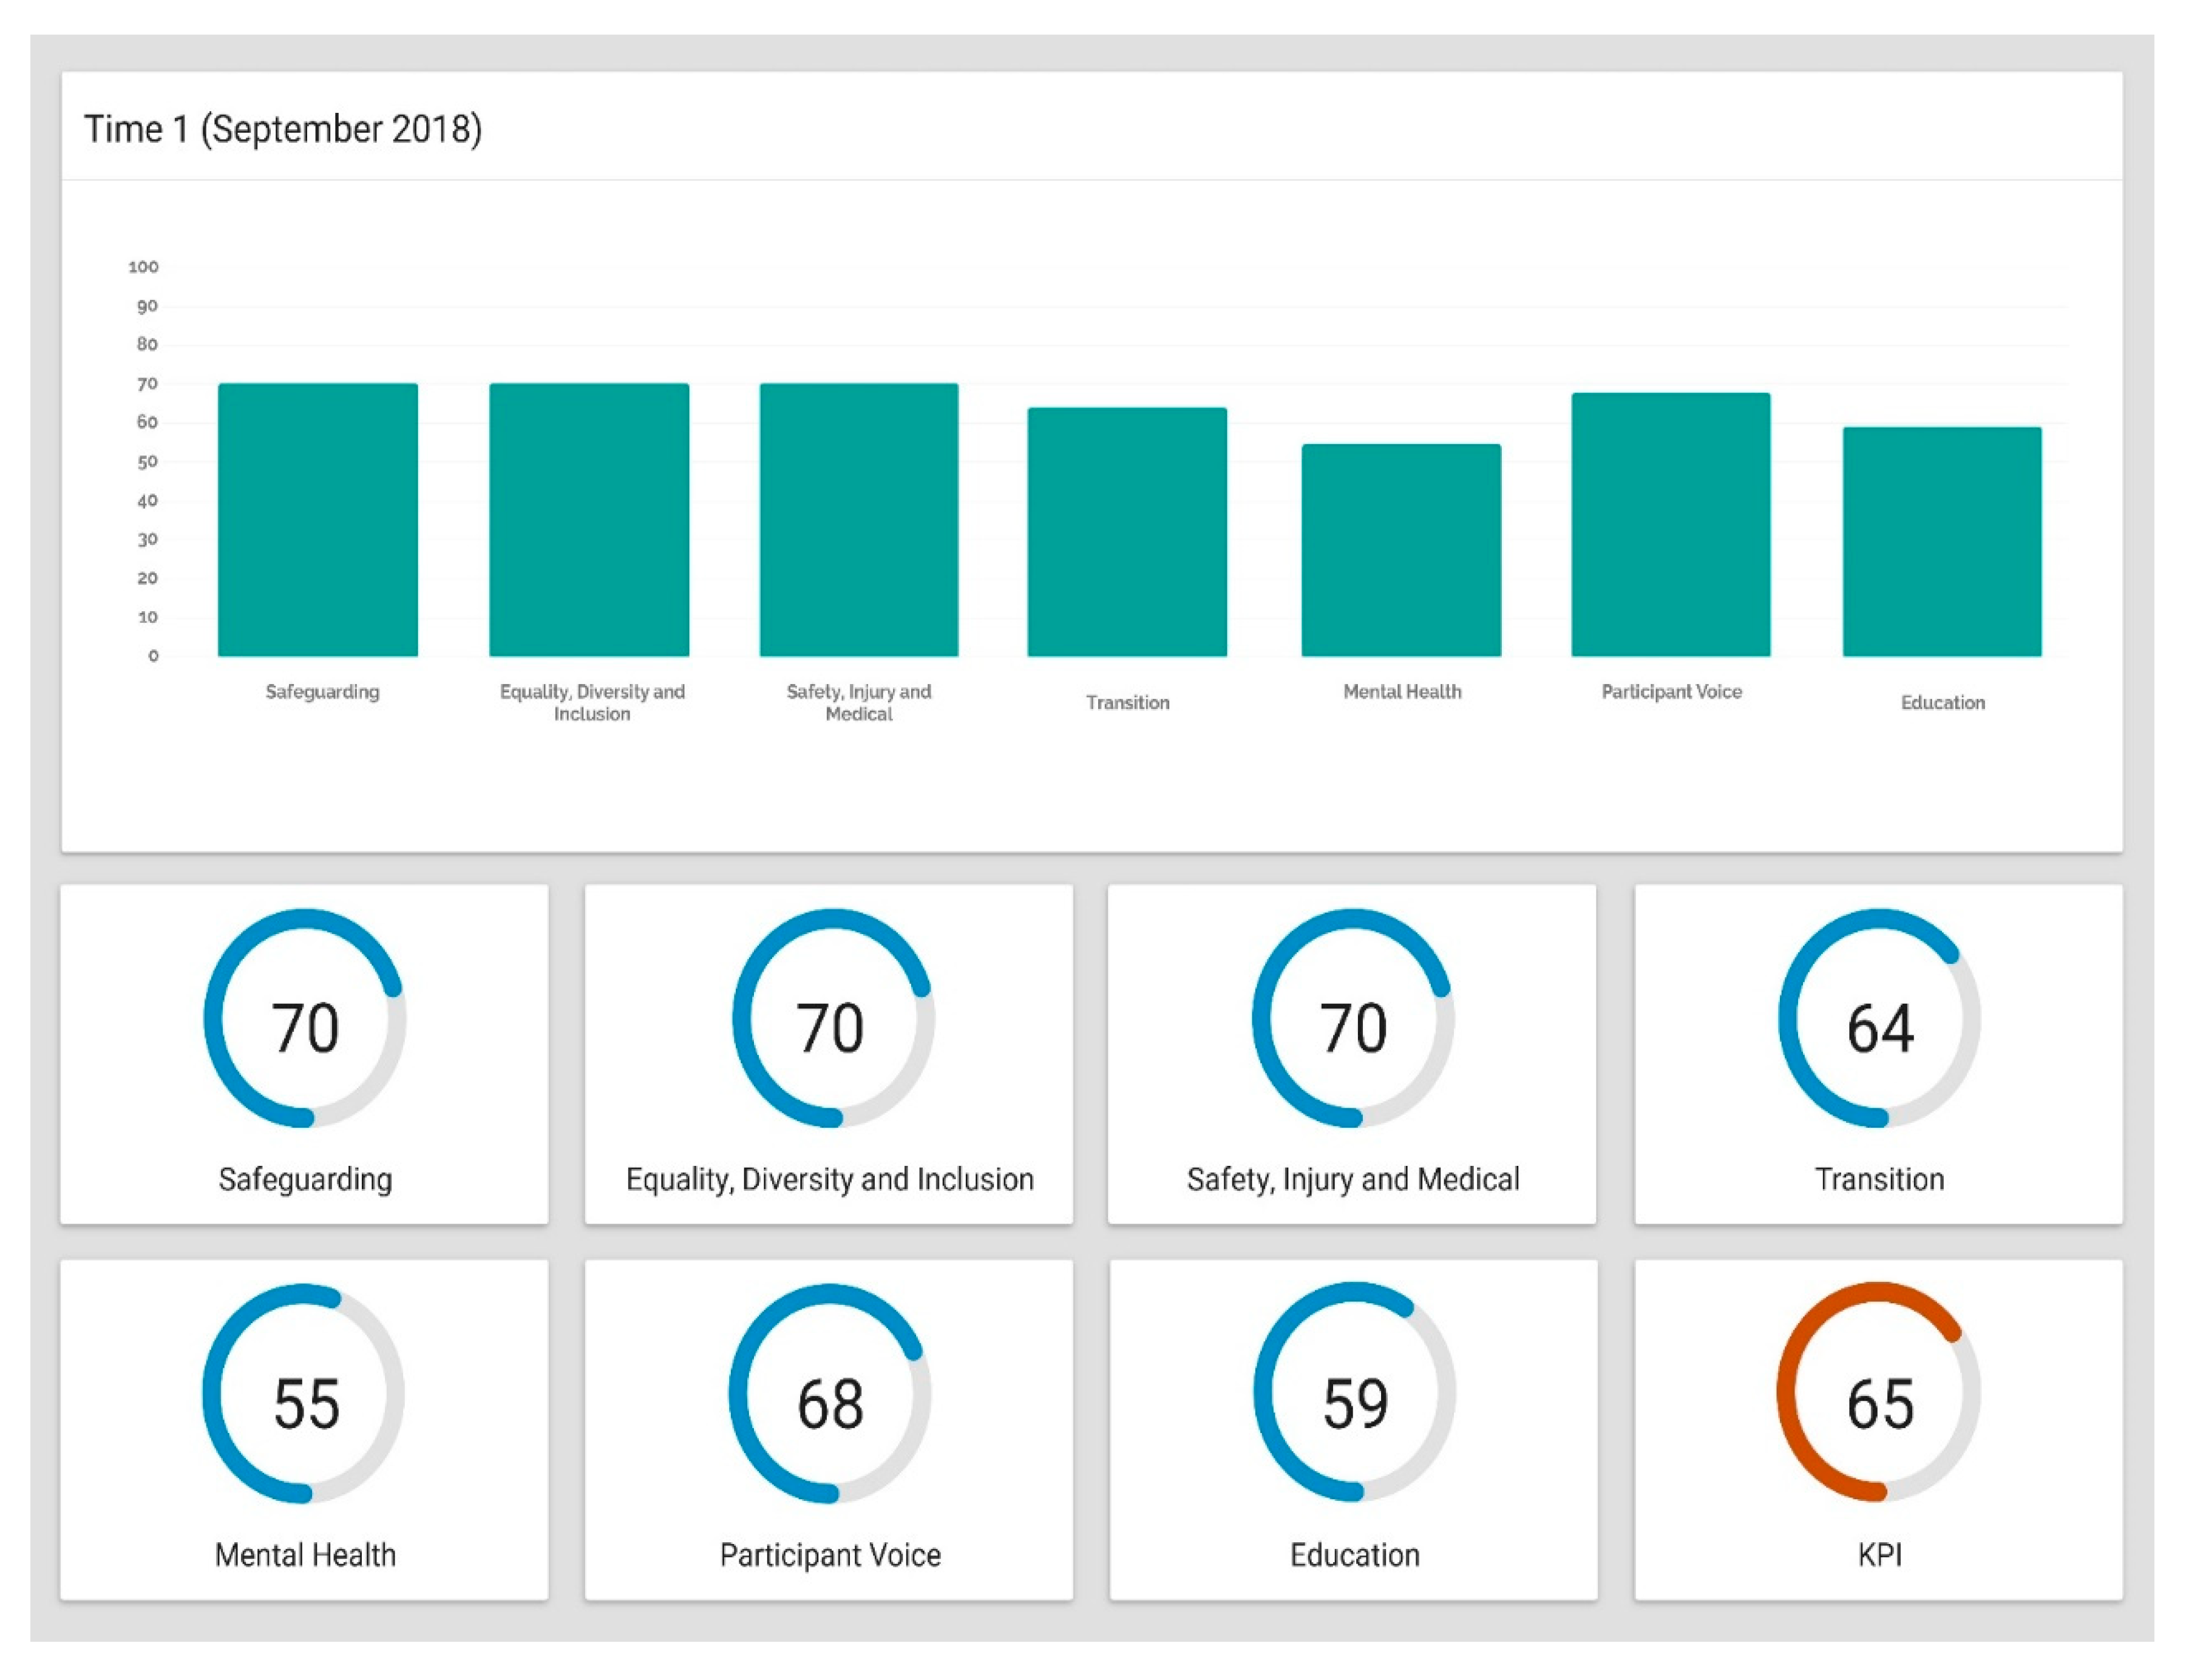
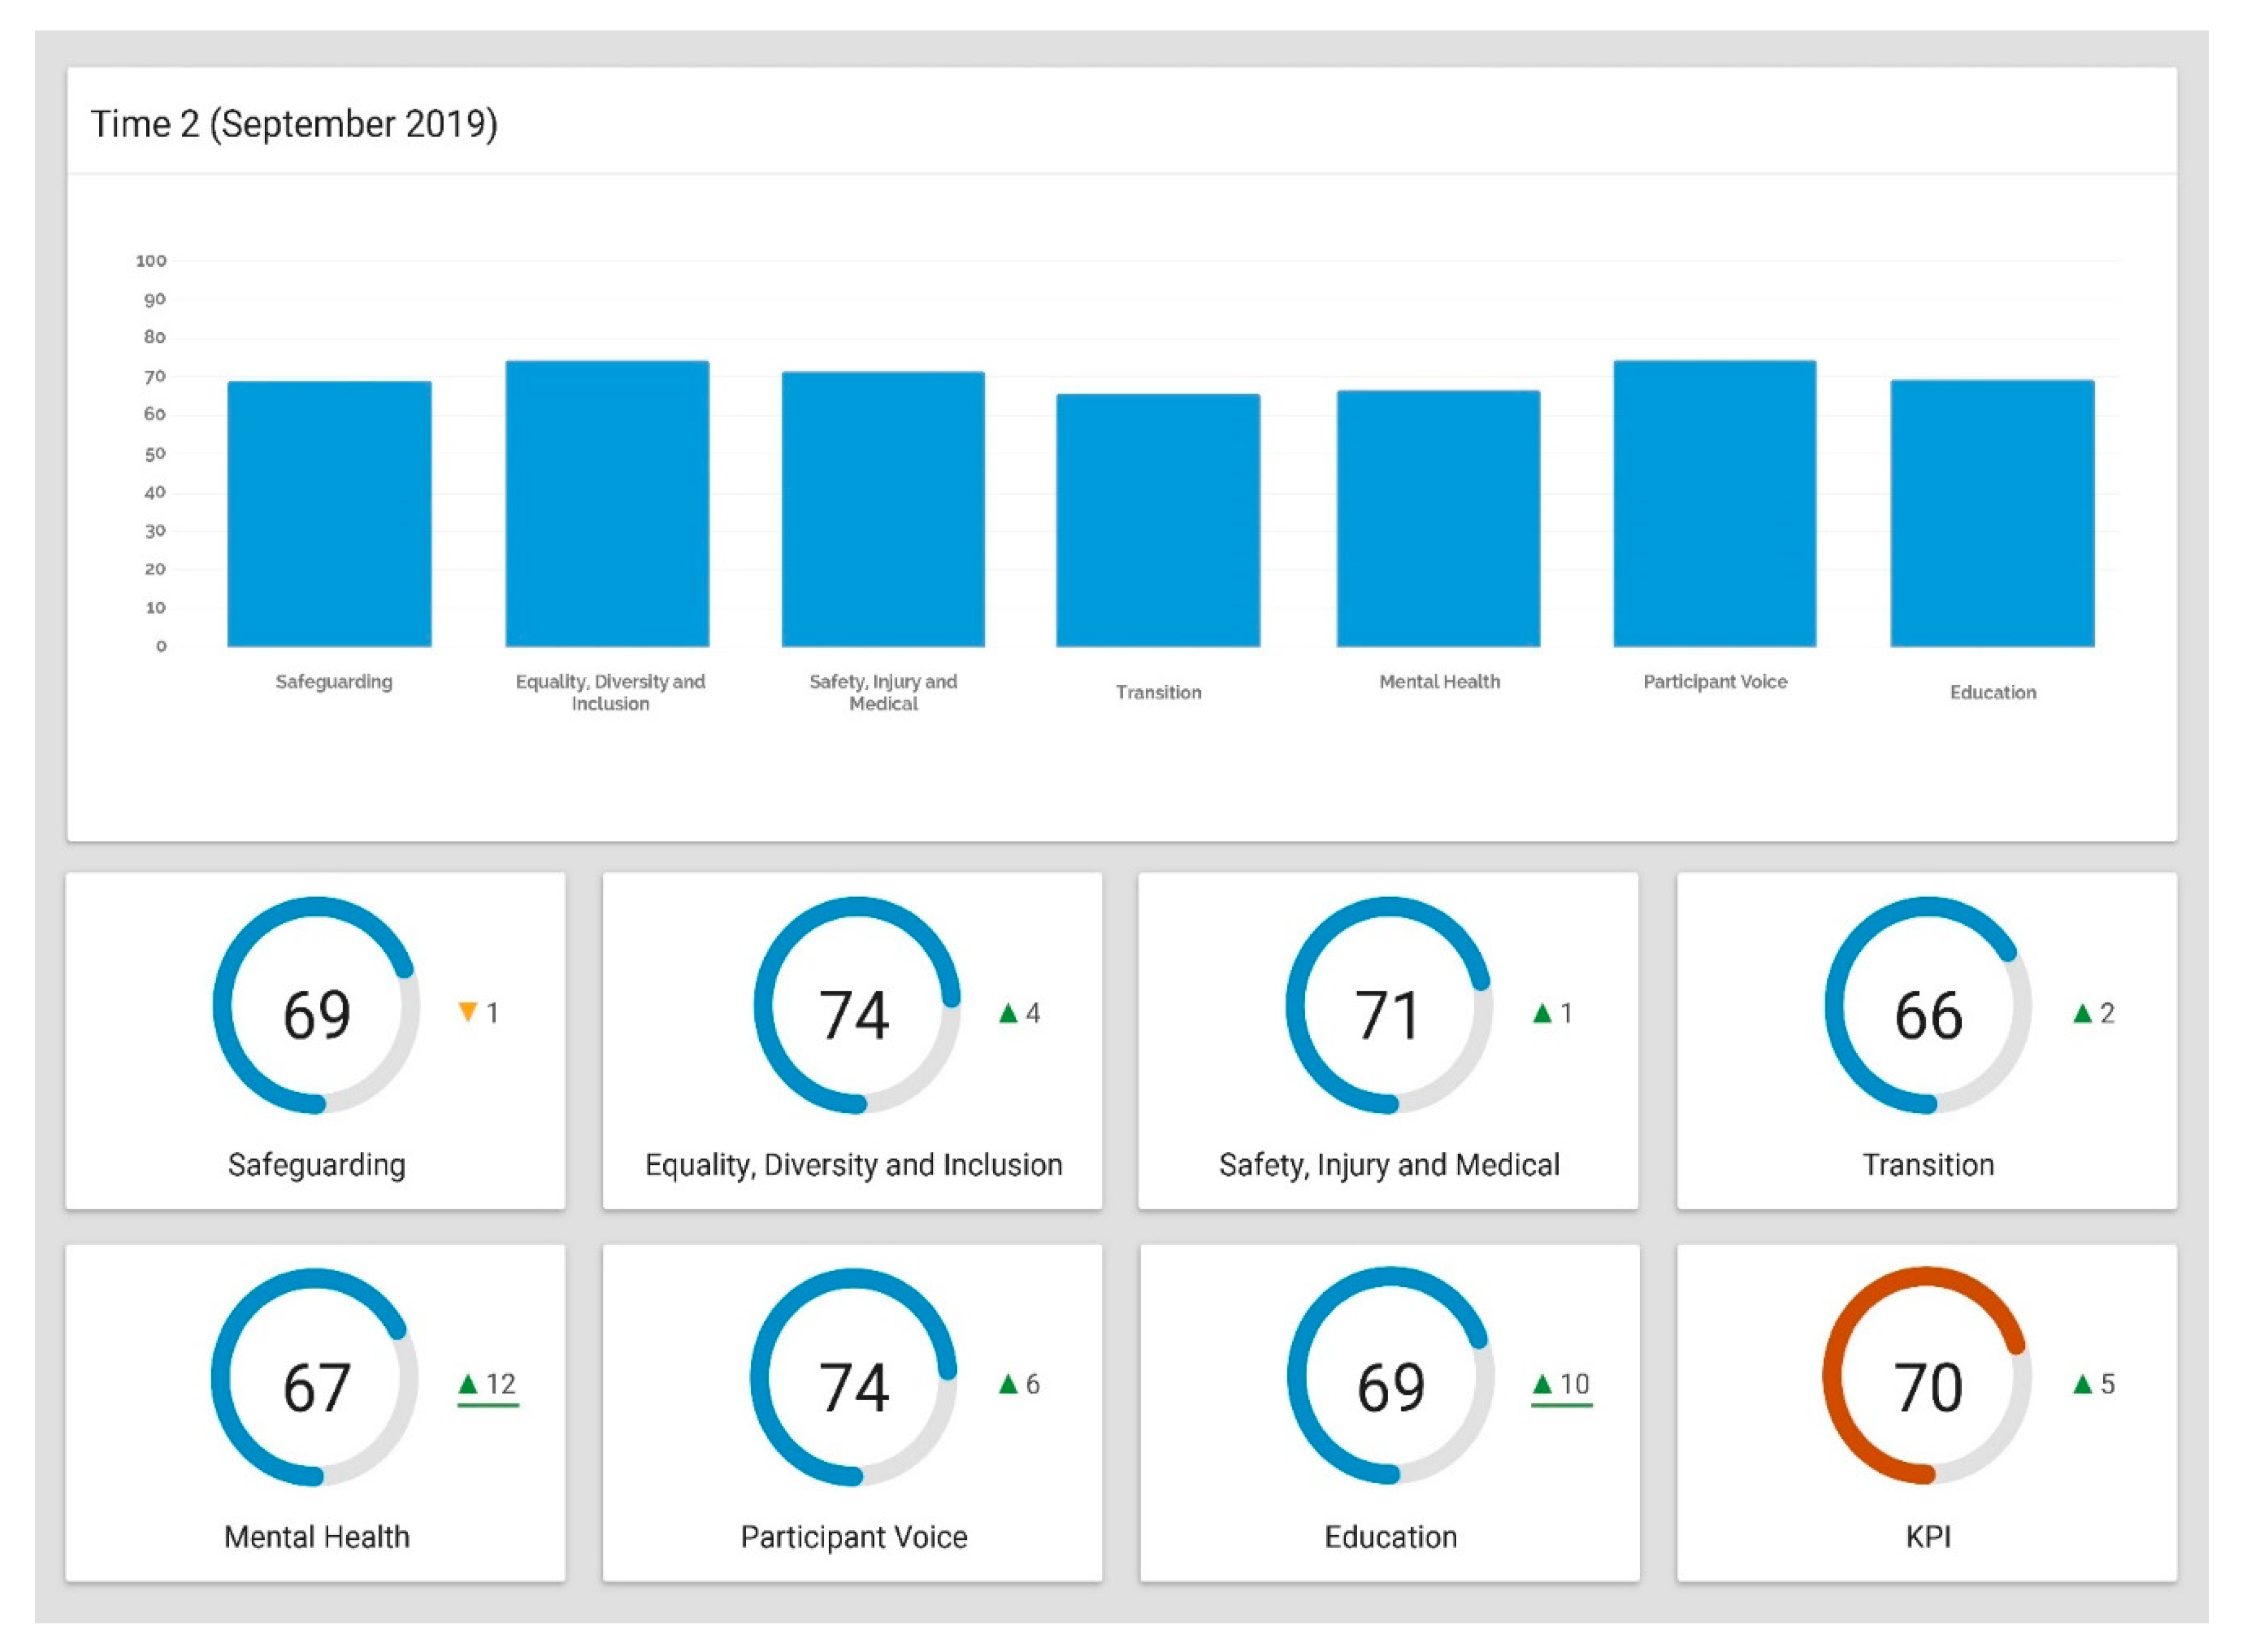
3. Instrument Utility

The utility of the questionnaire established following the instrument validation phase was assessed with a large sports organization over a 12-month period (September 2018–September 2019), with Time 2 data collected 12 months after Time 1.
A total of 494 individuals completed the questionnaire at Time 1 (recreation participant (n = 217), athlete (n = 141), coach (n = 68), staff (n = 11), volunteer (n = 45), referee (n = 5), or in some other capacity (n = 7)).
Average scores were calculated for each area once all individuals completed the survey. An overall total for each factor was then calculated out of 100 by multiplying the overall average scores of perceived support and received support. The seven areas were also averaged to create an overall total out of 100, reported as a key performance indicator (KPI) [14].
A dashboard of results was created including bar charts and visual numerical total (Figure 1) to assist the organization in utilizing the data. The individual scores for each area were as follows for Time 1: Safeguarding = 67; Equality, Diversity, and Inclusion = 72; Safety, Injury, and Medical = 70; Transition = 64; Mental Health = 52; Representation of Participant’s Voice = 68; and Education = 60. The overall total KPI at Time 1 was 65.
The decision-makers in the sport organization applied the learning from the Test 1 (T1) results and initiated a series of strategically targeted interventions in the areas of Mental Health and Education over the following year.
A total of 421 individuals completed the questionnaire at Time 2 (recreation participant (n = 182), athlete (n = 120), coach (n = 53), staff (n = 12), volunteer (n = 41), referee (n = 5), or in some other capacity (n = 8)).
A second dashboard was created based on Time 2 (Figure 2). The individual scores for each area were as follows for Time 2: Safeguarding = 69; Equality, Diversity, and Inclusion = 72; Safety, Injury, and Medical = 71; Transition = 66; Mental Health = 67; Representation of Participant’s Voice = 86; and Education = 70. The overall total KPI at Time 2 was 70.
The sport organization saw increases in the areas of Mental Health (from 52 at Time 1 to 67 at Time 2) and Education (from 60 at Time 1 to 70 at Time 2). Representation of Participant’s Voice also increased (from 68 at Time 1 to 86 at Time 2) while all other areas (Safeguarding; Equality, Diversity, and Inclusion; Safety, Injury, and Medical; and Transition) remained stable. The overall total KPI increased from 65 at Time 1 to 70 at Time 2.

4. Discussion

There is an increasing awareness that all parties engaged in the business of sports owe an essential duty of care to everyone involved [7]. The challenge has been to define duty of care in sport and quantify it so that organizations can identify at a sophisticated level of specificity what needs to be improved and for whom. The findings presented in this paper illustrate the validity and utility of a new measure of duty of care in sport designed to enhance sustainability. We have called the survey The Sport Census given the importance of giving equal voice to all stakeholders. The instrument validation process found a high level of agreement among expert panel members, excellent test consistency, and high test-retest reliability.
The utility assessment revealed how the questionnaire helped a large sports organization gain access to meaningful, transparent data that assessed the level of perceived and received support in key areas as validated by their stakeholders. The interventions led to improvements in the areas of Mental Health and Education over a 12-month period. The positive actions taken in these areas also likely contributed to a significant improvement in Representation of Participant’s Voice. In addition, the overall total KPI increased as support continued to be perceived and received at the same level in the other four areas (Safeguarding; Equality, Diversity, and Inclusion; Safety, Injury, and Medical; and Transition) across both years. Because enhancing sustainability in sport can often involve trade-offs between different impacts [15], the improvements in targeted areas while keeping all the other areas stable demonstrates further utility.
In addition to only one sport organization being included in the utility assessment, the potential for expert feedback being subjective is a limitation to consider. In order to control for bias, expert panel members were invited to provide feedback on any perceived inconsistency or potential difficulty regarding the clarity of the individual items. The CVI method employed in this paper also does not indicate the level of agreement, but rather the proportion of agreement among a panel of experts.
We propose the term clear data to capture transparent data across an organization that assesses levels of perceived and received support and gives an equal voice to all participants in the system [9].
Governance has become an essential part of sport sustainability in recent years, and clear data can help advance knowledge and provide practical recommendations for organizations through greater transparency [16]. The value of the new measure presented in this paper is dependent in the first instance on its ease of use, the accuracy of the data it collects, and the overall information it provides for analysis in an accessible format. Results can help sports not only track trends and identify their next steps in response to data collected on an annual basis, but also demonstrate the impact and return on investment of the programs and services they deliver. The ultimate measure of its value is that decision-makers apply the learning from the results to inform and improve policies and procedures associated with sustainability.

Author Contributions

Conceptualization, D.L., J.L. (Jeff Lowder) and J.L. (Jane Lowder); methodology, D.L.; software, J.L. (Jeff Lowder) and J.L. (Jane Lowder); formal analysis, D.L.; writing—original draft preparation, D.L.; writing—review and editing, D.L., J.L. (Jeff Lowder) and J.L. (Jane Lowder). All authors have read and agreed to the published version of the manuscript.

Funding

This research received no external funding.

Conflicts of Interest

The authors declare no conflict of interest.

References

  1. Albu, O.B.; Flyverbom, M. Organizational transparency: Conceptualizations, conditions, and consequences. Bus. Soc. 2019, 58, 268–297. [Google Scholar] [CrossRef]
  2. Kitchin, T. The Data Revolution; Sage: London, UK, 2014. [Google Scholar]
  3. De Mauro, A.; Greco, M.; Grimaldi, M. A formal definition of big data based on its essential features. Libr. Rev. 2016, 65, 122–135. [Google Scholar] [CrossRef]
  4. Ayre, L.B.; Craner, J. Open data: What it is and why you should care. Public Libr. Quart 2010, 36, 173–184. [Google Scholar] [CrossRef]
  5. Darace, D.; Schopfel, J. Grey Literature in Library and Information Studies; DeGruyter Saur: Berlin, Germany, 2010. [Google Scholar]
  6. Parida, V.; Wincent, J. Why and how to compete through sustainability. Int. Entrep. Manag. J. 2019, 15, 1–19. [Google Scholar] [CrossRef] [Green Version]
  7. International Olympic Committee. Sustainability Essentials; International Olympic Committee: Lausanne, Switzerland, 2016. [Google Scholar]
  8. Duty of Care in Sport Review. Available online: https://www.gov.uk/governmentpublications/duty-of-care-in-sport-review (accessed on 30 April 2018).
  9. Sport Duty of Care Review: Call for Evidence. Available online: www.gov.uk/government/consultations/sport-duty-of-care-review-call-for-evidence (accessed on 30 April 2018).
  10. Grant, J.S.; Davis, L.L. Selection and use of content experts for instrument development. Res. Nurs. Health 1997, 20, 269–274. [Google Scholar] [CrossRef]
  11. Wynd, C.A.; Schmidt, B.; Schaefer, M.A. Two quantitative approaches for estimating content validity. West J. Nurs. Res. 2003, 25, 508–518. [Google Scholar] [CrossRef]
  12. Polit, D.F.; Beck, C.T.; Owen, S.V. Is the CVI an acceptable indicator of content validity? Appraisal and recommendations. Res. Nurs. Health 2007, 30, 459–467. [Google Scholar] [CrossRef] [PubMed]
  13. Anastasi, A. Psychological Testing, 6th ed.; Macmillan: New York, NY, USA, 1988. [Google Scholar]
  14. Parmenter, D. Key Performance Indicators, 4th ed.; Wiley: London, UK, 2019. [Google Scholar]
  15. Morrison-Saunders, A.; Pope, J. Conceptualizing and managing trade-offs in sustainability assessment. Environ. Impact Assess. Rev. 2013, 38, 54–63. [Google Scholar] [CrossRef] [Green Version]
  16. Geeraert, A. National Sports Governance Observer: Final Report; Danish Institute for Sports Studies: Aarhus, Denmark, 2018. [Google Scholar]
Figure 1. A dashboard of results for Time 1 including bar charts and visual numerical total to assist the organization in utilizing the data.
Sustainability 12 04527 g001
Figure 2. A dashboard of results for Time 2 including bar charts and visual numerical total to assist the organization in utilizing the data.
Sustainability 12 04527 g002
Table 1. Retest reliability over a 2-week period.
ItemT1 NT1 Mean (CI)T2 NT2 Mean (CI)ICC
Safeguarding
- Perceived Support1076.76 (±0.32)1076.83 (±0.30)0.85
- Support NeededYes = 18; No = 89 Yes = 17; No = 90 0.99
- Received Support186.44 (±0.49)176.58 (±0.49)0.93
Equality, Diversity, and Inclusion
- Perceived Support1076.82 (±0.38)1076.79 (±0.37)0.89
- Support NeededYes = 19; No = 88 Yes = 18; No = 89 0.99
- Received Support197.47 (±0.57)187.5 (±0.56)0.78
Safety, Injury, and Medical
- Perceived Support1076.73 (±0.35)1076.79 (±0.35)0.79
- Support NeededYes = 31; No = 76 Yes = 29; No = 78 0.98
- Received Support317.81 (±0.71)297.83 (±0.69)0.91
Transition
- Perceived Support1076.64 (±0.30)1076.56 (±0.30)0.78
- Support NeededYes = 16; No = 91 Yes = 15; No = 92 0.99
- Received Support167.81 (±0.55)157.87 (±0.53)0.81
Mental Health
- Perceived Support1076.66 (±0.31)1056.63 (±0.30)0.83
- Support NeededYes = 15; No = 92 Yes = 16; No = 89 0.98
- Received Support156.53 (±0.44)166.56 (±0.47)0.84
Representation of Participant’s Voice
- Perceived Support1076.49 (±0.34)1036.45 (±0.35)0.79
- Support NeededYes = 20; No = 87 Yes = 18; No = 85 0.99
- Received Support207.4 (±0.58)187.44 (±0.58)0.92
Education
- Perceived Support1076.54 (±0.36)1026.59 (±0.37)0.84
- Support NeededYes = 23; No = 84 Yes = 20; No = 82 0.98
- Received Support237.26 (±0.61)207.3 (±0.61)0.91
Note. All correlations are significant at p < 0.01. CI, Confidence Interval = 95%; N, Number; T1, Test 1; T2, Test 2; ICC, intraclass coefficient. ‘Support Needed’ indicates whether support was needed in a specific domain area over the last 12 months (yes/no); ‘No’ number is indicated in ‘Support Needed’ rows whereas ‘Yes’ number is indicated in ‘Received Support’ rows.

