What Value Does the Public Put on Managing and Protecting an Endangered Marine Species? The Case of the Finless Porpoise in South Korea


Abstract
1. Introduction
2. Methodology
2.1. Literature Review
2.2. Contingent Valuation
2.3. Survey Instrument and Method
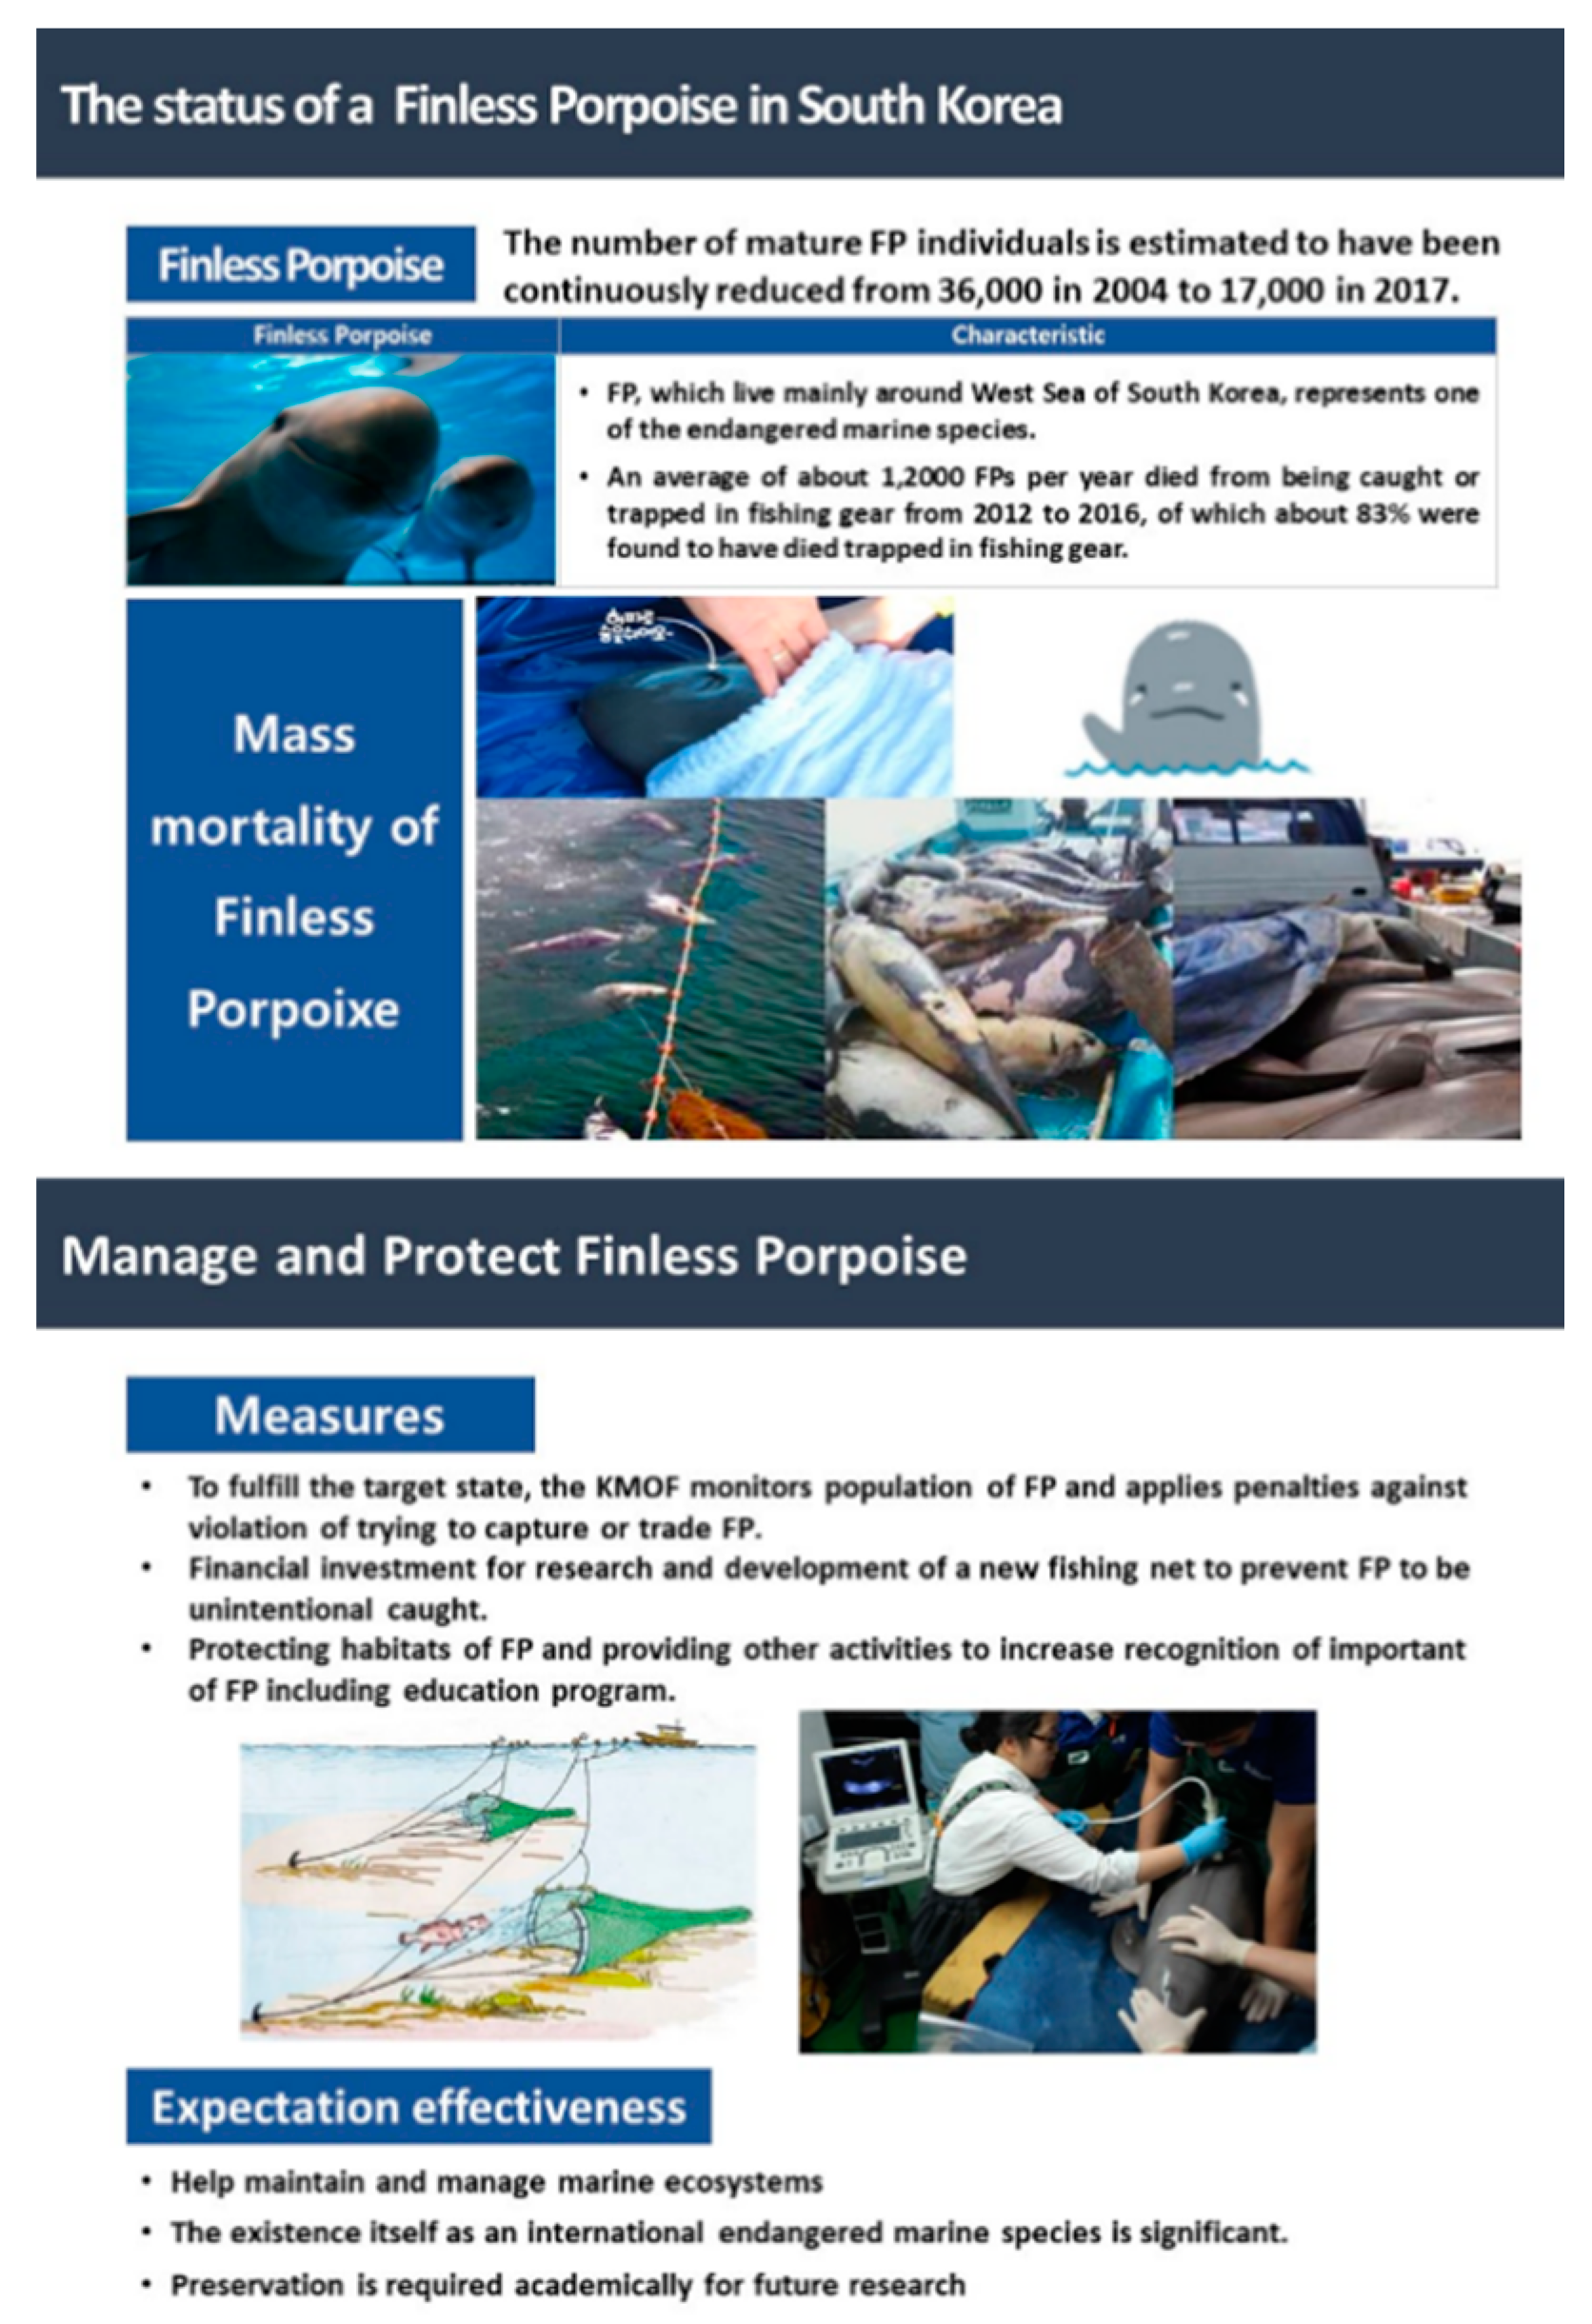
- To fulfill the target state, the KMOF monitors population of FP and applies penalties against violation of trying to capture or trade FPs.
- Financial investment for research and development of a new fishing net to prevent FPs from be unintentionally caught.
- Protecting habitats of the FP and providing other activities to increase recognition of the importance of the FP, including an education program.
2.4. How to Elicit WTP Responses
2.5. Econometric Model for Analyzing the WTP Responses
3. Results
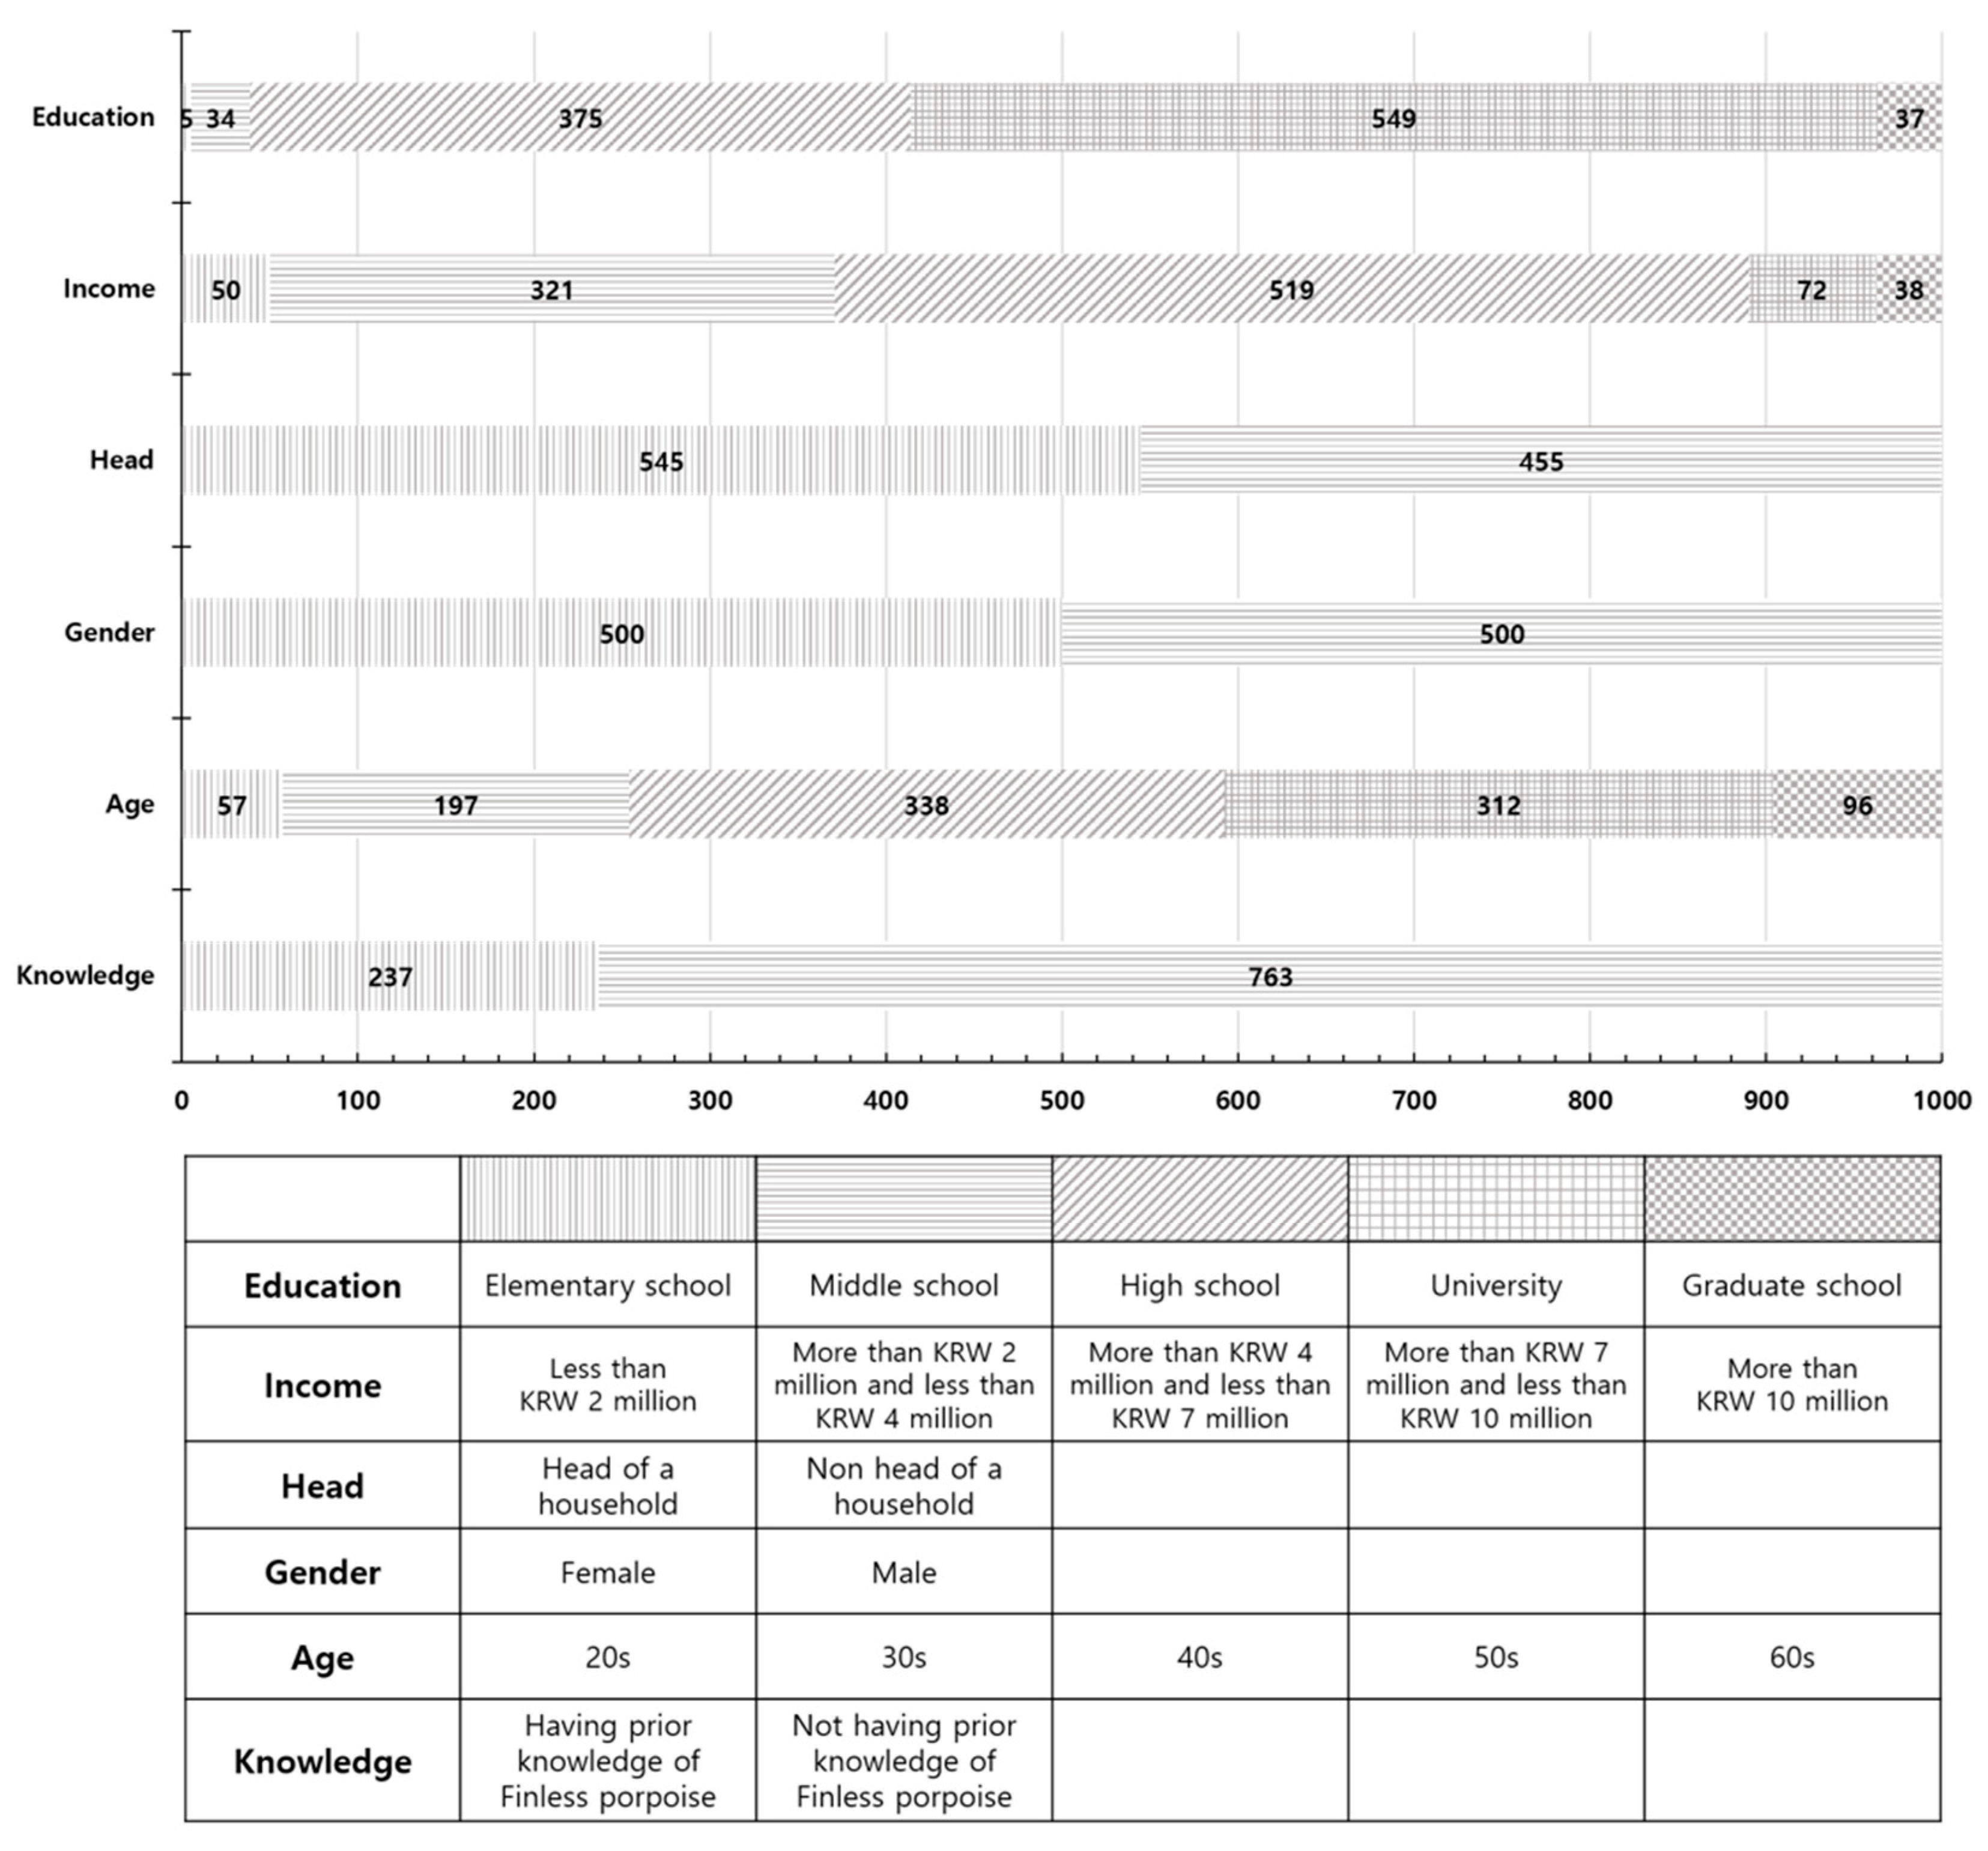
3.1. Data
3.2. Estimation Results
3.3. Discussion of the Results
4. Conclusions
Author Contributions
Funding
Conflicts of Interest
Appendix A. Main Part of the Survey Questionnaire
Appendix A.1. Part 1. Questions about Socio-Economic Characteristics
Q1. Please check with √ your education level in years.
| Education Level | Uneducated | Elementary School | Middle School | High School | University | Graduate School |
| Education level in years | 0 | 1 2 3 4 5 6 | 7 8 9 | 10 11 12 | 13 14 15 16 | 17 18 19 20 |
Appendix A.2. Part 2. Questions about Willingness to Pay for Protecting the Finless Porpoise (FP) in South Korea
Q3. Then, is your household not willing to pay anything for protecting the FP in South Korea?

References
- International Union for Conservation of Nature. Red List of Threatened Species. 2019. Available online: https://www.iucn.org/resources/conserbvation-tools/iucn-red-list-threatened-species (accessed on 20 March 2020).
- Korea Ministry of Oceans and Fisheries. Press Release for Conservation and Management of Marine Ecosystems Act. 2006. Available online: http://www.mof.go.kr (accessed on 20 March 2020).
- Korean Ministry of Oceans and Fisheries. Press Release for Renewed List of Protection for Endangered Marine Species Including Finless Porpoise. 2016. Available online: http://www.mof.go.kr (accessed on 20 March 2020).
- International Union for Conservation of Nature. New Red List Assessments for Two Species of Finless Porpoises. 2019. Available online: https://www.iucn.org/new-red-list-assessments-for-two-species-of-finless-porpoises (accessed on 20 March 2020).
- Gao, A.; Zhou, K. Growth and reproduction of three populations of finless porpoise, Neophocaena phocaenoides, in Chinese waters. Aquat. Mamm. 1993, 19, 3–12. [Google Scholar]
- Kim, H.J.; Jin, S.J.; Yoo, S.H. Public assessment of releasing a captive indo-pacific bottlenose dolphin into the wild in South Korea. Sustainability 2018, 10, 3199. [Google Scholar] [CrossRef]
- Davies, K.T.; Brillant, S.W. Mass human-caused mortality spurs federal action to protect endangered North Atlantic right whales in Canada. Mar. Policy 2018, 104, 157–162. [Google Scholar] [CrossRef]
- Guzman, J. How Can they Count Whales from Space? Available online: https://thehill.com/changing-america (accessed on 10 May 2020).
- Sèbe, M.; Christos, A.K.; Pendleton, L. A decision-making framework to reduce the risk of collisions between ships and whales. Mar. Policy 2019, 109, 103697. [Google Scholar] [CrossRef]
- Giraud, K.; Turcin, B.; Loomis, J.; Cooper, J. Economic benefit of the protection program for the Steller sea lion. Mar. Policy 2002, 26, 451–458. [Google Scholar] [CrossRef]
- Stithou, M.; Scarpa, R. Collective versus voluntary payment in contingent valuation for the conservation of marine biodiversity: An exploratory study from Zakynthos, Greece. Ocean Coast. Manag. 2012, 56, 1–9. [Google Scholar] [CrossRef]
- Bosetti, V.; Pearce, D.W. A study of environmental conflict: The economic value of Grey Seals in southwest England. Biodivers. Conserv. 2003, 12, 2361–2392. [Google Scholar] [CrossRef]
- Dong, Y. Contingent Valuation of Yangtze Finless Porpoises in Poyang Lake, China; Springer Science & Business Media: Berlin, Germany, 2012. [Google Scholar]
- Lim, S.Y.; Jin, S.J.; Yoo, S.H. The economic benefits of the Dokdo Seals restoration project in Korea: A contingent valuation study. Sustainability 2017, 9, 968. [Google Scholar] [CrossRef]
- Boxall, P.C.; Adamowicz, W.L.; Olar, M.; West, G.E.; Cantin, G. Analysis of the economic benefits associated with the recovery of threatened marine mammal species in the Canadian St. Lawrence Estuary. Mar. Policy 2012, 36, 189–197. [Google Scholar] [CrossRef]
- Bond, C.A.; Cullen, K.G.; Larson, D.M. Joint estimation of discount rates and willingness to pay for public goods. Ecol. Econ. 2009, 68, 2751–2759. [Google Scholar] [CrossRef]
- Lew, D.K.; Layton, D.F.; Rowe, R.D. Valuing enhancements to endangered species protection under alternative baseline futures: The case of the Steller sea lion. Mar. Resour. Econ. 2010, 25, 133–154. [Google Scholar] [CrossRef]
- Lew, D.K. Willingness to pay for threatened and endangered marine species: A review of the literature and prospects for policy use. Front. Mar. Sci. 2015, 2, 96. [Google Scholar] [CrossRef]
- Habb, T.C.; McConnell, K.E. Valuing Environmental and Natural Resources; Edward Elgar: Cheltenham, UK, 2002. [Google Scholar]
- Brent, R.J. Applied Cost-Benefit Analysis, 2nd ed.; Edward Elgar: Cheltenham, UK, 2006. [Google Scholar]
- Freeman, A.M., III; Herriges, J.A.; Kling, C.L. The Measurement of Environmental and Resource Values: Theory and Methods, 3rd ed.; RFF Press: New York, NY, USA, 2014. [Google Scholar]
- Haab, T.; Lewis, L.; Whitehead, J. State of the Art of Contingent Valuation. In Oxford Research Encyclopedia of Environmental Science; Oxford University Press: Oxford, UK, 2020. [Google Scholar]
- Freeman, A.M. The Measurement of Environmental and Resource Values: Theory and Methods; Resources for the Future: Washington, DC, USA, 1993. [Google Scholar]
- Hohmeyer, O.; Ottinger Richard, L. External Environmental Costs of Electric Power: Analysis and Internalization; Springer: Berlin, Germany, 1990. [Google Scholar]
- Flores, N.E. A Conceptual framework for nonmarket valuation. In A Primer on Nonmarket Valuation, 2nd ed.; Champ, P.A., Boyle, K.J., Brown, T.C., Eds.; Springer: Dordrecht, The Netherlands, 2017. [Google Scholar]
- Bateman, I.J.; Carson, R.T.; Day, B.; Hanemann, M.; Hanley, N.; Hett, T.; Sugden, R. Economic Valuation with Stated Preference Techniques: A manual; Edward Elgar Publishing: Cheltenham, UK, 2002. [Google Scholar]
- Garrod, G.; Willis, K.G. Economic Valuation of the Environment; Edward Elgar: Cheltenham, UK, 1999. [Google Scholar]
- Mitchell, R.C.; Carson, R.T. Using Surveys to Value Public Goods: The Contingent Valuation Method; Resources for the future: Washington, DC, USA, 1989. [Google Scholar]
- Champ, P.A.; Moore, R.; Bishop, R.C. A Comparison of Approaches to Mitigate Hypothetical Bias. Agric. Resour. Econ. Rev. 2009, 38, 166–180. [Google Scholar] [CrossRef]
- Carson, R. Contingent Valuation: A Comprehensive Bibliography and History; Edward Elgar: Cheltenham, UK, 2012. [Google Scholar]
- Arrow, K.; Solow, R.; Portney, P.R.; Leamer, E.E.; Radner, R.; Schuman, H. Report of the NOAA panel on contingent valuation. Fed. Regist. 1993, 58, 4601–4614. [Google Scholar]
- Johnston, R.J.; Boyle, K.J.; Adamowicz, W.; Bennett, J.; Brouwer, R.; Cameron, T.A.; Hanemann, W.M.; Hanley, N.; Ryan, M.; Scarpa, R.; et al. Contemporary guidance for stated preference studies. J. Assoc. Environ. Resour. Econ. 2017, 4, 319–405. [Google Scholar] [CrossRef]
- Cooper, J.C.; Hanemann, M.; Signorello, G. One and one-half bound dichotomous choice contingent valuation. Rev. Econ. Stat. 2002, 84, 742–750. [Google Scholar] [CrossRef]
- Kriström, B. Spike models in contingent valuation. Am. J. Agric. Econ. 1997, 79, 1013–1023. [Google Scholar] [CrossRef]
- Yoo, S.H.; Kwak, S.J. Using a spike model to deal with zero response data from double bounded dichotomous contingent valuation survey. Appl. Econ. Lett. 2002, 9, 929–932. [Google Scholar] [CrossRef]
- Statistics Korea. Korea Statistical Information Service. Available online: http://kosis.kr (accessed on 20 March 2020).
- Krinsky, I.; Robb, A.L. On approximating the statistical properties of elasticities. Rev. Econ. Stat. 1986, 68, 715–719. [Google Scholar] [CrossRef]
- Statistics Korea. Exchange Rates and Prices. Available online: http://kosis.kr (accessed on 20 May 2020).


| Sources | Object to be Valued | Countries | Main Results | Method a |
|---|---|---|---|---|
| Giraud et al. [10] | Steller sea lion | United States | 61.13 USD per household per year for conserving the Steller sea lion | CV |
| Stithou and Scarpa [11] | Loggerhead Turtle and Monk seal | Greece | Under donation, 22.52 EUR per respondent for turtles and 20.94 EUR per respondent for seals. Under a landing fee, 12.04 EUR per respondent for turtle and 12.40 EUR per respondent for seal | CV |
| Bosetti and Pearce [12] | Grey seal | England | An amount of 8 GBP per person for recreational use of seals and 9 GBP per person for seeing seals in the wild | CV |
| Dong [13] | Finless porpoise | China | Economic value of finless porpoise is 9.94, 5.92, and 6.67 EUR per household per year in three Chinese cities (Beijing, Guangzhou, and Nanchang), respectively. | CV |
| Lim et al. [14] | Dokdo seal | South Korea | An amount of 4.86 USD per household for implementation of the Dokdo seal restoration project | CV |
| Boxall et al. [15] | Marine mammal | Canada | An amount of 77 to 229 USD per year per household for different levels of marine mammal recovery programs | CV |
| Bond et al. [16] | Steller sea lion | United States | Mean willingness to pay for 5 and 15 year repayment periods is 46 USD per year for protecting Steller sea lions | CV |
| Lew et al. [17] | Steller sea lion | United States | An amount of 39.26 to 229.47 USD per household per year for increasing Steller sea lion population | CE |
| Variables | Definitions | Mean | Standard Deviation |
|---|---|---|---|
| Education | The interviewee’s education level in years | 14.04 | 2.27 |
| Income | The interviewee’s household’s monthly income (Unit: Million KRW = 849 USD) | 4.80 | 5.99 |
| Head | Dummy for the interviewee’s being a head of the household | 0.55 | 0.50 |
| Gender | The interviewee’s gender (0 = male; 1 = female) | 0.50 | 0.50 |
| Age | The interviewee’s age | 46.55 | 9.48 |
| Knowledge | Dummy for the interviewee’s knowing about the finless porpoise before the survey (0 = no; 1 = yes) | 0.24 | 0.43 |
| Lower Bid is Given First (%) b | Higher Bid is Given First (%) b | |||||||||
|---|---|---|---|---|---|---|---|---|---|---|
| Bid Amount a | Sample Size | |||||||||
| 1000 | 3000 | 101 (7.7) | 18 (12.6) | 2 (1.4) | 41 (28.7) | 18 (12.6) | 10 (7.0) | 3 (2.1) | 40 (28.0) | 143 (100.0) |
| 2000 | 4000 | 14 (9.8) | 12 (8.4) | 5 (3.5) | 40 (28.0) | 20 (14.0) | 8 (5.6) | 5 (3.5) | 39 (27.3) | 143 (100.0) |
| 3000 | 6000 | 5 (3.5) | 10 (7.0) | 9 (6.3) | 47 (32.9) | 11 (7.7) | 8 (5.6) | 8 (5.6) | 45 (31.5) | 143 (100.0) |
| 4000 | 8000 | 2 (1.4) | 11 (7.7) | 11 (7.7) | 48 (33.6) | 8 (5.6) | 5 (3.5) | 9 (6.3) | 49 (34.3) | 143 (100.0) |
| 6000 | 10,000 | 7 (4.9) | 11 (7.7) | 14 (9.9) | 39 (27.5) | 11 (7.7) | 2 (1.4) | 9 (6.3) | 49 (34.5) | 142 (100.0) |
| 8000 | 12,000 | 4 (2.8) | 8 (5.6) | 21 (14.8) | 38 (26.8) | 10 (7.0) | 0 (0) | 12 (8.5) | 49 (34.5) | 142 (100.0) |
| 10,000 | 15,000 | 3 (2.1) | 6 (4.2) | 17 (11.8) | 46 (31.9) | 10 (7.0) | 2 (1.4) | 18 (12.5) | 42 (29.2) | 144 (100.0) |
| Totals | 46 (4.6) | 76 (7.6) | 79 (7.9) | 299 (29.9) | 88 (8.8) | 35 (3.5) | 64 (6.4) | 313 (31.3) | 1000 (100.0) | |
| Variables | Coefficient Estimates |
|---|---|
| Constant | −0.4645 (−7.20) # |
| Bid amount a | −0.1786 (−17.12) # |
| Spike | 0.6145 (40.21) # |
| Mean willingness to pay per household per year | 2730 KRW (2.32 USD) |
| t-value | 14.63 # |
| 95% confidence interval b | 2403 to 3126 KRW (2.03 to 2.65 USD) |
| 99% confidence interval b | 2308 to 3279 KRW (1.96 to 2.80 USD) |
| Number of observations | 1000 |
| Log-likelihood | −1077.48 |
| Wald statistic (p-value) c | 214.16 (0.000) |
| Variables a | Coefficient Estimates (t-Values) |
|---|---|
| Constant | −1.8023 (−2.31) # |
| Bid amount b | −0.1899 (−17.25) # |
| Education | 0.0930 (2.84) # |
| Log of Income | 0.2900 (1.84) # |
| Head | 0.6481 (2.29) # |
| Gender | 0.8289 (2.89) # |
| Knowledge | 0.9317 (6.40) # |
| Age | −0.0216 (−2.85) # |
| Spike | 0.6195 (39.35) |
| Mean household willingness to pay per year | 2522 KRW (2.14 USD) |
| t-value | 14.56 # |
| 95% confidence interval c | 2212 to 2902 KRW (1.88 to 2.46 USD) |
| 99% confidence interval c | 2111 to 3015 KRW (1.79 to 2.56 USD) |
| Wald statistic (p-value) d | 212.09(0.000) |
| Log-likelihood | −1040.43 |
| Number of observations | 1.000 |
© 2020 by the authors. Licensee MDPI, Basel, Switzerland. This article is an open access article distributed under the terms and conditions of the Creative Commons Attribution (CC BY) license (http://creativecommons.org/licenses/by/4.0/).
Share and Cite
Kim, J.-H.; Kim, J.; Yoo, S.-H. What Value Does the Public Put on Managing and Protecting an Endangered Marine Species? The Case of the Finless Porpoise in South Korea. Sustainability 2020, 12, 4505. https://doi.org/10.3390/su12114505
Kim J-H, Kim J, Yoo S-H. What Value Does the Public Put on Managing and Protecting an Endangered Marine Species? The Case of the Finless Porpoise in South Korea. Sustainability. 2020; 12(11):4505. https://doi.org/10.3390/su12114505
Chicago/Turabian StyleKim, Ju-Hee, Joseph Kim, and Seung-Hoon Yoo. 2020. "What Value Does the Public Put on Managing and Protecting an Endangered Marine Species? The Case of the Finless Porpoise in South Korea" Sustainability 12, no. 11: 4505. https://doi.org/10.3390/su12114505
APA StyleKim, J.-H., Kim, J., & Yoo, S.-H. (2020). What Value Does the Public Put on Managing and Protecting an Endangered Marine Species? The Case of the Finless Porpoise in South Korea. Sustainability, 12(11), 4505. https://doi.org/10.3390/su12114505