Article

Detecting and Analyzing Land Use and Land Cover Changes in the Region of Al-Jabal Al-Akhdar, Libya Using Time-Series Landsat Data from 1985 to 2017

by
Jamal Suliman Alawamy
1,2,
Siva K. Balasundram
1,*,
Ahmad Husni Mohd. Hanif
1 and
Christopher Teh Boon Sung
1
1
Faculty of Agriculture, Universiti Putra Malaysia, Serdang 43400, Selangor, Malaysia
2
Faculty of Natural Resources and Environmental Sciences, Omar Al-Mukhtar University, Al Bayda 218-69463, Libya
*
Author to whom correspondence should be addressed.
Sustainability 2020, 12(11), 4490; https://doi.org/10.3390/su12114490
Submission received: 27 February 2020 / Revised: 15 April 2020 / Accepted: 15 April 2020 / Published: 1 June 2020
(This article belongs to the Special Issue Impacts of Land Tenure Systems on Land Use Sustainability)

Abstract

:
The region of Al-Jabal Al-Akhdar in northeastern Libya has undergone rapid, wide-ranging changes in the land use and land cover (LULC) intensified by the conversion of natural resources for food purpose, urbanization, and other socioeconomic benefits. This study examined the use of geographic information system (GIS) and remote sensing techniques to gain a quantitative understanding of the spatiotemporal dynamics of LULC. In addition, the major factors behind LULC changes and decline of natural vegetation in the region were analyzed. A post-classification comparison approach was used to detect LULC changes in the study area between 1985 and 2017 using four Landsat images from 1985, 2000, 2010, and 2017. The observed changes were indicative of a decrease in the expanse of the natural Mediterranean forest which lost 9018 ha over 32 years, 39% of its total area, with the highest deforestation rate registered between 2010 and 2017 estimated at 513 ha. year−1. Orchards and rain-fed agriculture lands gained 4095 ha, which matches 55% of initial area, whereas the land under irrigated crops increased by 2266 ha, about 85% of the original area. The area of urban and built-up land in 2017 was more than double in 1985 and achieved the highest urbanization rate between 2010 and 2017 at 203 ha.year−1. Results indicate an unstable trend of bare and low vegetation lands which generally increased by about 50%. From the outcomes of this research, it is strongly recommended that urgent measures be taken to conserve the natural forest and to achieve a rational use of agricultural land in the region of Al-Jabal Al-Akhdar.

1. Introduction

Many countries in the world are faced with rapid, wide-ranging changes in land use (e.g., human activities and various utilization of the land) and land cover (e.g., physical characteristics of the land surface) [1]. Numerous studies have shown that only a few landscapes on earth, in peripheral sites and remote locations, are still remaining in their natural state [2]. The rapid increase in the world population, which necessitates an increase in anthropogenic activities, has resulted in speedy alteration in the land use and land cover (LULC), leading to forest deterioration and transformation of fertile land to urban construction with significant impact on the ecosystem [3]. LULC change has generated considerable interest as it focuses on the central issue in the field of global change study. Management of the earth’s surface transformation due to LULC changes represents one of the pressing global ecological challenges to address in this century [4]. At present, understanding and mapping of LULC change have occupied an important position in policy-making with regards to the management of natural resources and monitoring of environmental changes. Changes in the LULC are a vital expression of human interactions with the environment [5] and are characterized and affected by a plethora of factors in space and time at different magnitudes. These factors include natural, political, socioeconomic, cultural, and several other factors [2,6].
Globally, land use change through the conversion of the world’s forest land to other uses continues on an increasing scale due to the unprecedented growth of the human population which increases the demand for food and land [7]. Many studies have confirmed that, several decades ago, forests covered a vast portion of the land area on earth. According to Food and Agriculture Organization (FAO) [7], the world’s forest decline was estimated at about 129 million ha between 1990 and 2015, approximately the size of South Africa’s land mass, representing an annual rate of loss of 1.3%. Regionally, Africa had the largest annual rate of forest loss, estimated at about 0.49%, and reports from African countries documented that about 82 million ha of forest have been converted into other land uses between 1990 and 2015 [7]. Deforestation, forest degradation, and their associated environmental problems are the focus of discussion at several environmental fora deliberating on the measures required to mitigate the impact of these global phenomena [8]. The historical linkage between forest cover alterations and economic growth have been outlined by sociologists and forestry scientists about three decades ago [9]. The industrial development and the accelerated pace and intensity of human activities have greatly altered forest cover with spatiotemporal heterogeneity among nations [10]. In the United States and Canada, for example, economic growth in the 18th and 19th centuries encouraged investors to clear large areas of forest land for industrial and settlement purposes. Despite this, industrial expansion and urbanization had some positive effects on the vegetation cover, where the rural to urban migration and the rising farming incomes led to the restoration of forests on agricultural fields that were abandoned [11]. Some analysts pointed out that, despite the main role that inadvertent or spontaneous aforestation played in recovering the forest cover after farmers abandoned their fields [12], the planned activities for reforestation, whether at the level of plantations or small fields, have the greatest role in forest recovery processes [13].
In Libya, LULC changes have been intensified by the conversion of natural resources for food purpose and other socioeconomic benefits which have increased land exploitation and conversion by humans both on spatial and temporal scales [14,15]. Factors such as population growth, urbanization, and agricultural expansion are the major drivers of LULC change in Libya [16,17]. The region of Al-Jabal Al-Akhdar in northeastern Libya is no exception from the dynamics of LULC change [18,19]. With the highest precipitation (250–600 mm) in Libya, the Al-Jabal Al-Akhdar region comprises areas of intensive cultivation on flat areas in plains and lengthways at the bottoms of valleys and of natural forest and shrubland on steep canyons and terra rosa slopes [20]. The region constitutes only 1% of Libya’s total area; however, it is a regional hotspot of Mediterranean biodiversity, constituting 90% of the country’s forest [21], and is considered the only natural forest in North Africa, flanked by Lebanon to the east and Tunisia to the west [22]. Since mechanization was introduced to the region in the 1950s, the conventional farming methods which rely on the production of annual or permanent crops have gone through major changes [23]. Studies have shown that forest lands in the region of Al-Jabal Al-Akhdar have experienced a great threat of deforestation for agriculture expansion, urbanization, and various other purposes. Al-Idrissi et al. [24] reported that natural forest in the region of Al-Jabal Al-Akhdar once covered about 500,000 ha of which 35% has been converted into agricultural land. A comprehensive study conducted in the region of Al-Jabal Al-Akhdar by a team of forestry and agricultural experts from Omar Al-Mukhtar University estimated the area of land cover using a Landsat-7 image captured in May 2002 and found that natural forest area was about 299,000 ha whereas cultivated land was estimated at about 103,000 ha [19]. A more recent study covering a part of the southern side of the Al-Jabal Al-Akhdar region reported a dramatic change in LULC between 1984 and 2005, where forest and shrub covers lost about 21% and 46%, respectively, while farmlands and urban areas have increased by about 58% and 75%, respectively. The study also showed that, in 1984, there was no irrigated cultivation within the study area while irrigated farmlands occupied about 3.8% of the total area in 2005 [25].
Land cover classification is one of the most important remote sensing applications in the interests of identifying features such as land use by employing commonly multispectral satellite imagery [26]. The use of multitemporal data as inputs has been reported to assist in improving classification accuracy, particularly for vegetation, due to the unique phenological characters of various kinds of vegetation [27]. However, using multitemporal data also may involve some problems when using conventional automated classification algorithms [27]. One of these problems is the difficulty in obtaining cloud-free images for some locations in particular years, especially when using data with a relatively low temporal frequency such as Landsat. Therefore, land cover maps generated from Landsat imagery are mostly produced at intervals of 5 or 10 years, which makes them less valuable [27]. Moreover, when the magnitude of the errors in the classified land cover maps is much larger than the size of changes, which frequently happened in common classification methods, it would cause incorrect detection of the changes that actually occurred [27,28]. There is a general belief that the accuracy of the land cover classification process depends on several factors: classification scheme, imagery data used, training samples selection, preprocessing procedures, classification algorithm, postprocessing techniques, validation data collection, and validation methods [29]. It was found that most supervised algorithms could perform reasonably well and could produce land cover maps with high classification accuracies when parameters are accurately set and when adequately representative training samples were used [30]. Supervised algorithms such as Maximum Likelihood Classifier (MLC), Logistic Regression (LR), and Logistic Model Tree (LMT) are more proper for users and can be easily run with relative stability of performances [30].
In Libya, LULC change continues without a national monitoring program [16,17]. The lack of necessary information presents remote sensing technology as the only practical means for accurate and cost-effective multispectral and multi-temporal data, which can be used to extract and analyze the mode, frequency, and trend of environmental change at different spatiotemporal scales using satellite imagery coupled with geographic information system (GIS) [31]. Therefore, the study area of Al-Bayda-Lussitah, which in the middle northern part of the Al-Jabal Al-Akhdar region, was subjected to comprehensive assessment employing remote sensing techniques and field observation to quantify the long-term spatiotemporal LULC change dynamics. The specific objectives were to distinguish and classify the different LULC types, to quantify rate and magnitude of change, and to investigate the major factors driving LULC change in the study area between 1985 and 2017.

2. Materials and Methods
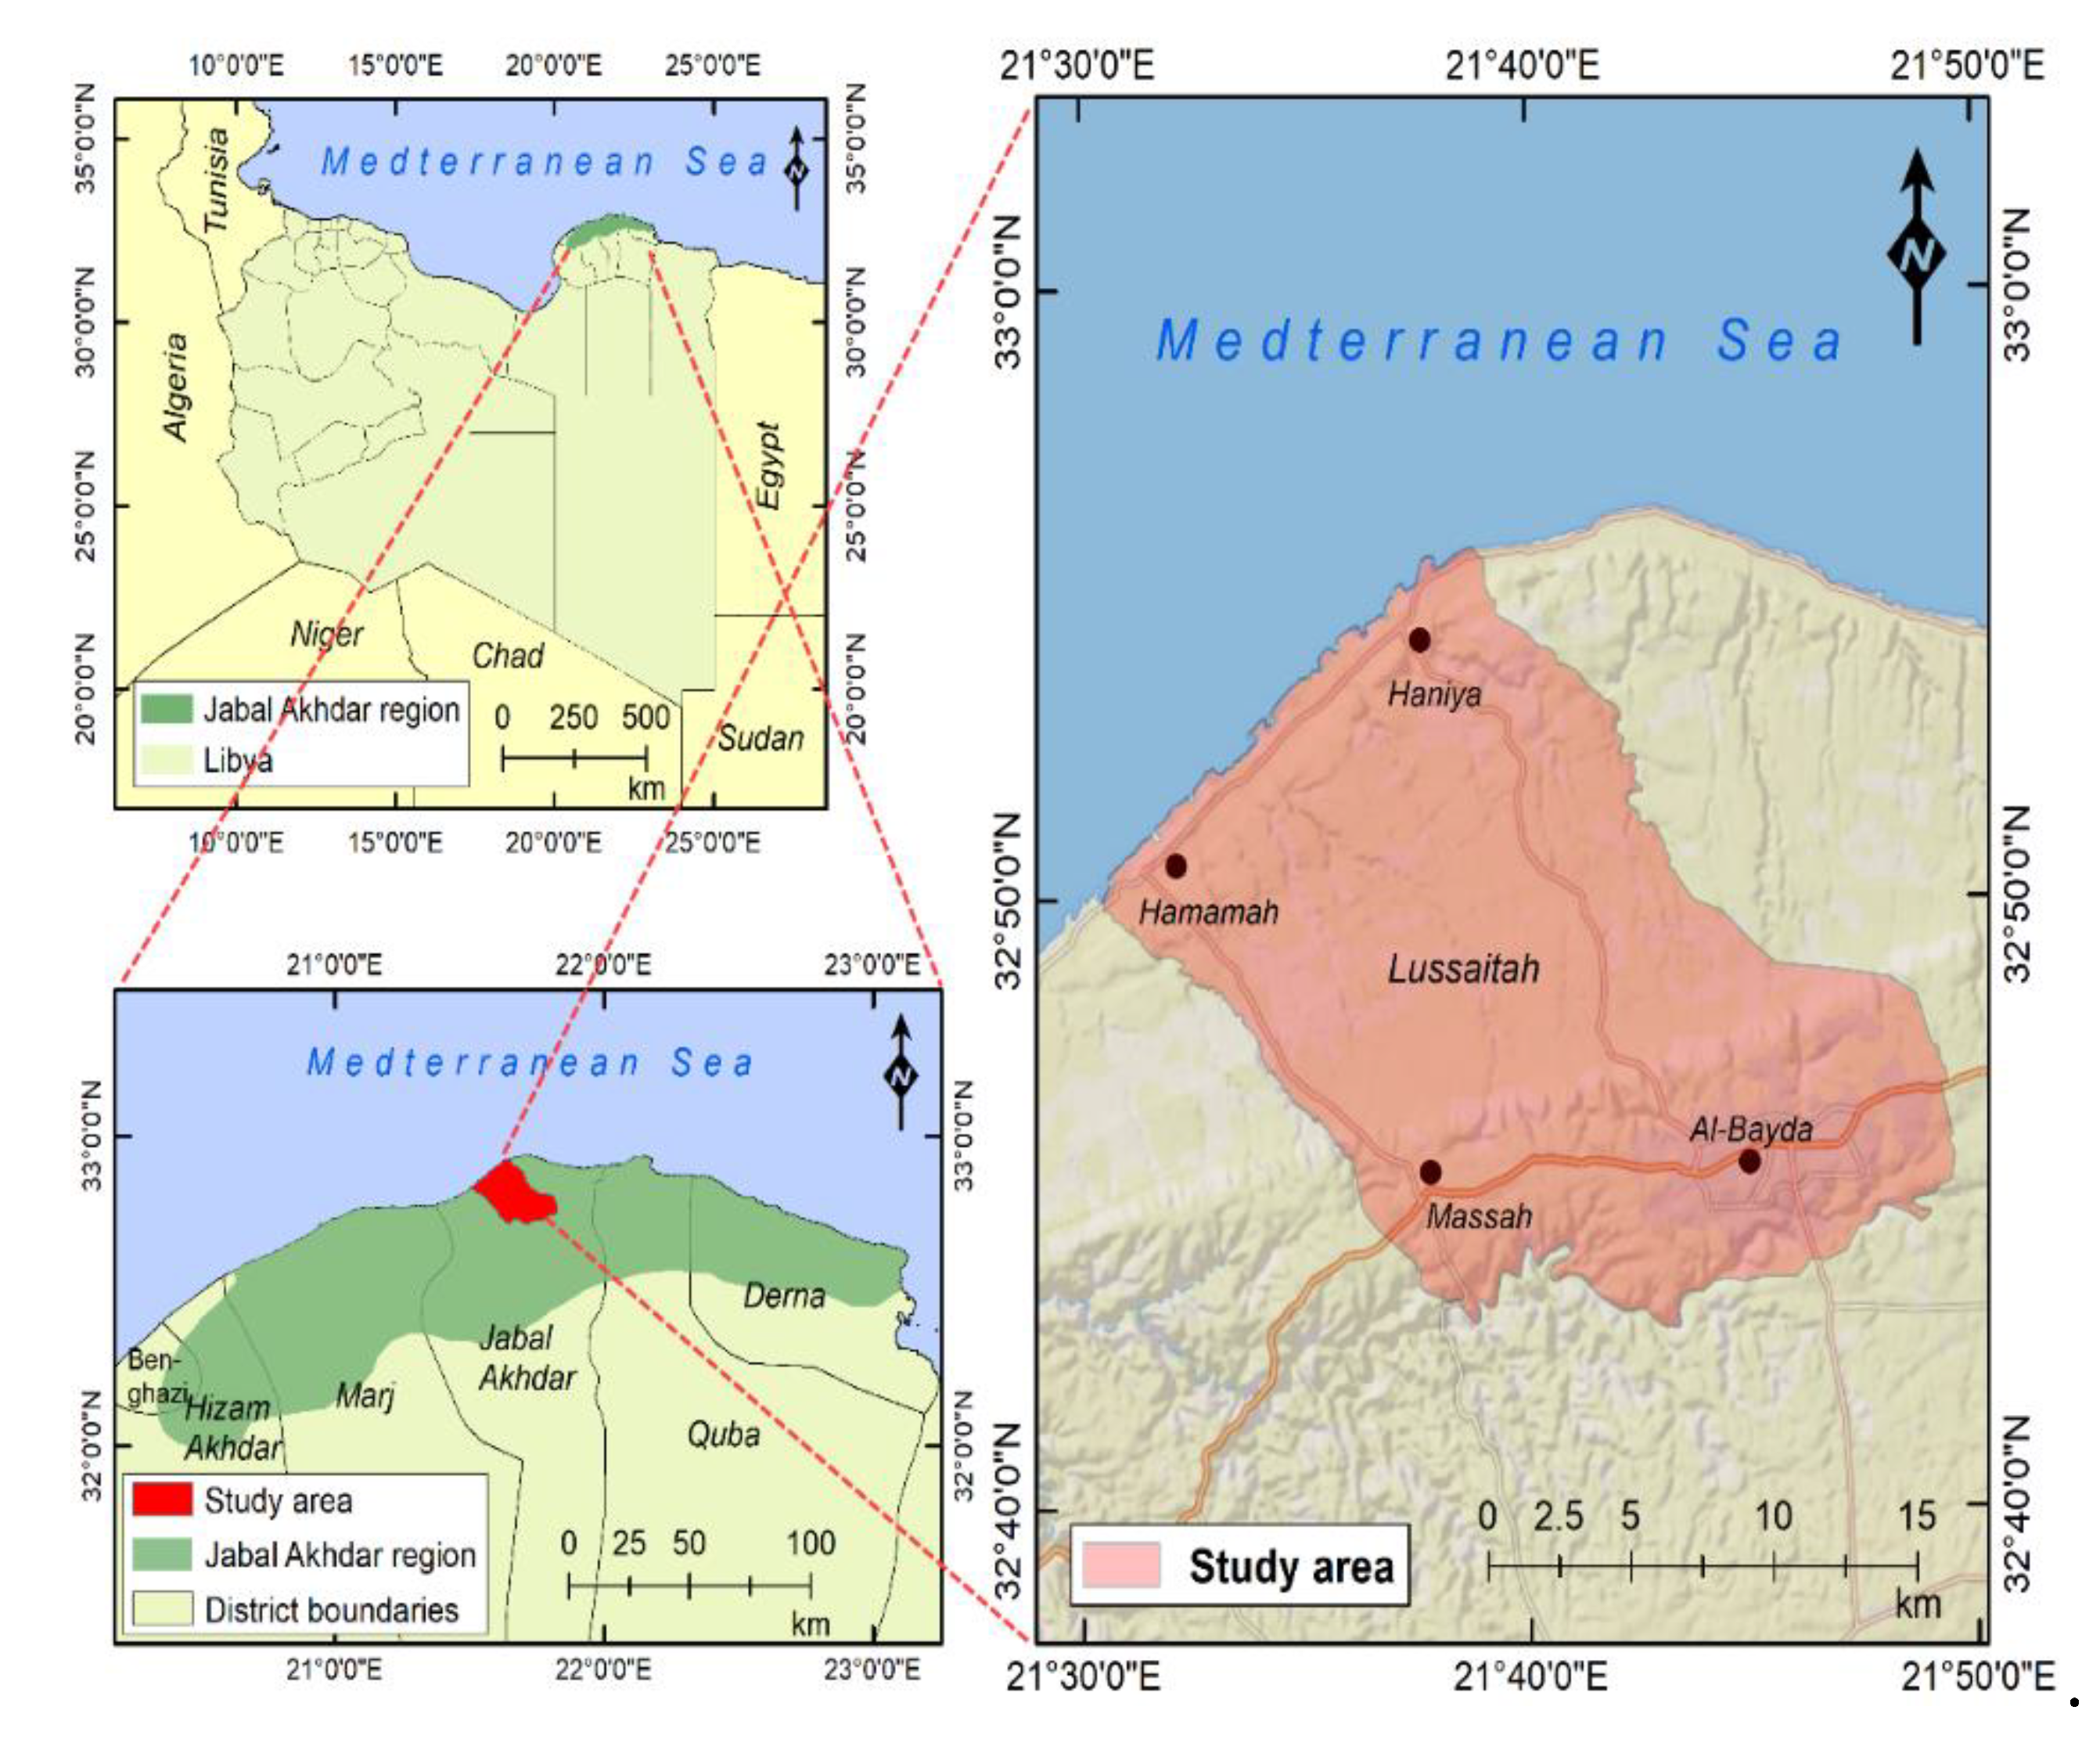
2.1. Study Area

Libya lies along the southern side of the Mediterranean coast, approximately between the latitudes of 19°30′ N and 33°10′ N and the longitudes of 09°30′ E and 25°00′ E. Libya is mostly a desert country with a dry climate and a rare vegetation cover. However, the region of Al-Jabal Al-Akhdar in the northeastern part is an exception with a relatively high annual rainfall (250–650 mm) combining intense farming areas, natural forests, and shrubs. This region is the most favored part of the country from the climatic aspect with human settlements and land use dating back to the classical period and where agricultural activities are concentrated and expanding until today. As shown in Figure 1, the region is located in the northeastern part of Libya immediately south of the coastal belt extending along with it for about 300 km at the latitudes of 32°00′ N to 32°56′ N and the longitudes of 20°19′ E to 23°08′ E, encompassing approximately 1.149 million ha. It is a high plateau, largely rocky and stony, rising to about 882 m above sea level with an undulant surface gradually inclining to the south and dissected frequently by many deep ravines (rivers) streaming toward the east, west, and north through a steep escarpment toward the north to either the sea or a narrow coastal plain.
This work was carried out in an area covering the middle northern part the of Al-Jabal Al-Akhdar region between the latitudes of 32°42’N and 32°56’N and the longitudes of 21°30′ and 21°50′ E (Figure 1) and with a total area of about 36,860 ha. The study area included Al-Bayda, the capital city of the Jabal al Akhdar region, and three villages, Massah, Al-Hamamah, and Al-Haniya, in addition to the Lussaitah area that is very intensively used for agriculture. The rationale behind choosing this area as a research site emanates from the fact that urbanization and agricultural expansion have adversely affected the natural ecosystem, particularly after the Libyan revolution in 2011.

2.2. Data Collection

Satellite imagery and ancillary data were used for investigating the historical changes of LULC in the study area over 32 years from 1985 to 2017. Four Landsat satellite scenes for Path/Row 183/37 from three types of sensors were downloaded from the United States Geological Survey (USGS) website (https://earthexplorer.usgs.gov/). Table 1 shows the characteristics of the Landsat images used in this study.
To assure the best comparability, we chose images that were captured between May and September (dry season in Libya) when the sky is usually clear, which enabled us to obtain cloud-free imagery with the best visibility.
The dates of imagery were defined based on events that had considerable impacts in expanding deforestation activities and LULC changes in Libya. The image of Landsat 5 Thematic Mapper (TM) captured in 1985 was used to represent the status before the first abolishment of the Ministry of Agriculture in 1986. Unfortunately, we could not get a usable image from the same year. The Landsat 7 Enhanced Thermal Mapper Plus (ETM+) image of 2000 was captured in May, about two months after the second abolishment of the Ministry of Agriculture, and thus was selected to picture the LULC status at the beginning of the second period. The popular uprising in Libya which started on 17 February 2011, was an important event, after which the whole country experienced dramatic changes in many political, economic, and social aspects that significantly contributed to LULC change; therefore, the Landsat 7 ETM+ image acquired on 5 September 2010, just five months before this event, was used as a reference for the beginning of the third period.
Ancillary data comprised a collection of Ground Control Points (GCP) and a combination of digital and paper maps covering the study area including a series of topographic maps at scale (1:50,000) and land use and land cover maps of 2005. In addition, aerial photographs covering a part of the study area taken on 30 May 1979, with a scale of 1:6000, were obtained and used for identification of areas subjected to LULC change. Ground truthing points were collected using a hand-held Geographical Positioning System (GPS) through field visits organized in 2016 during the same season in which satellite images were acquired. Points were separated into two groups, one for training samples used in the classification stage and another for test samples for classification accuracy assessment.

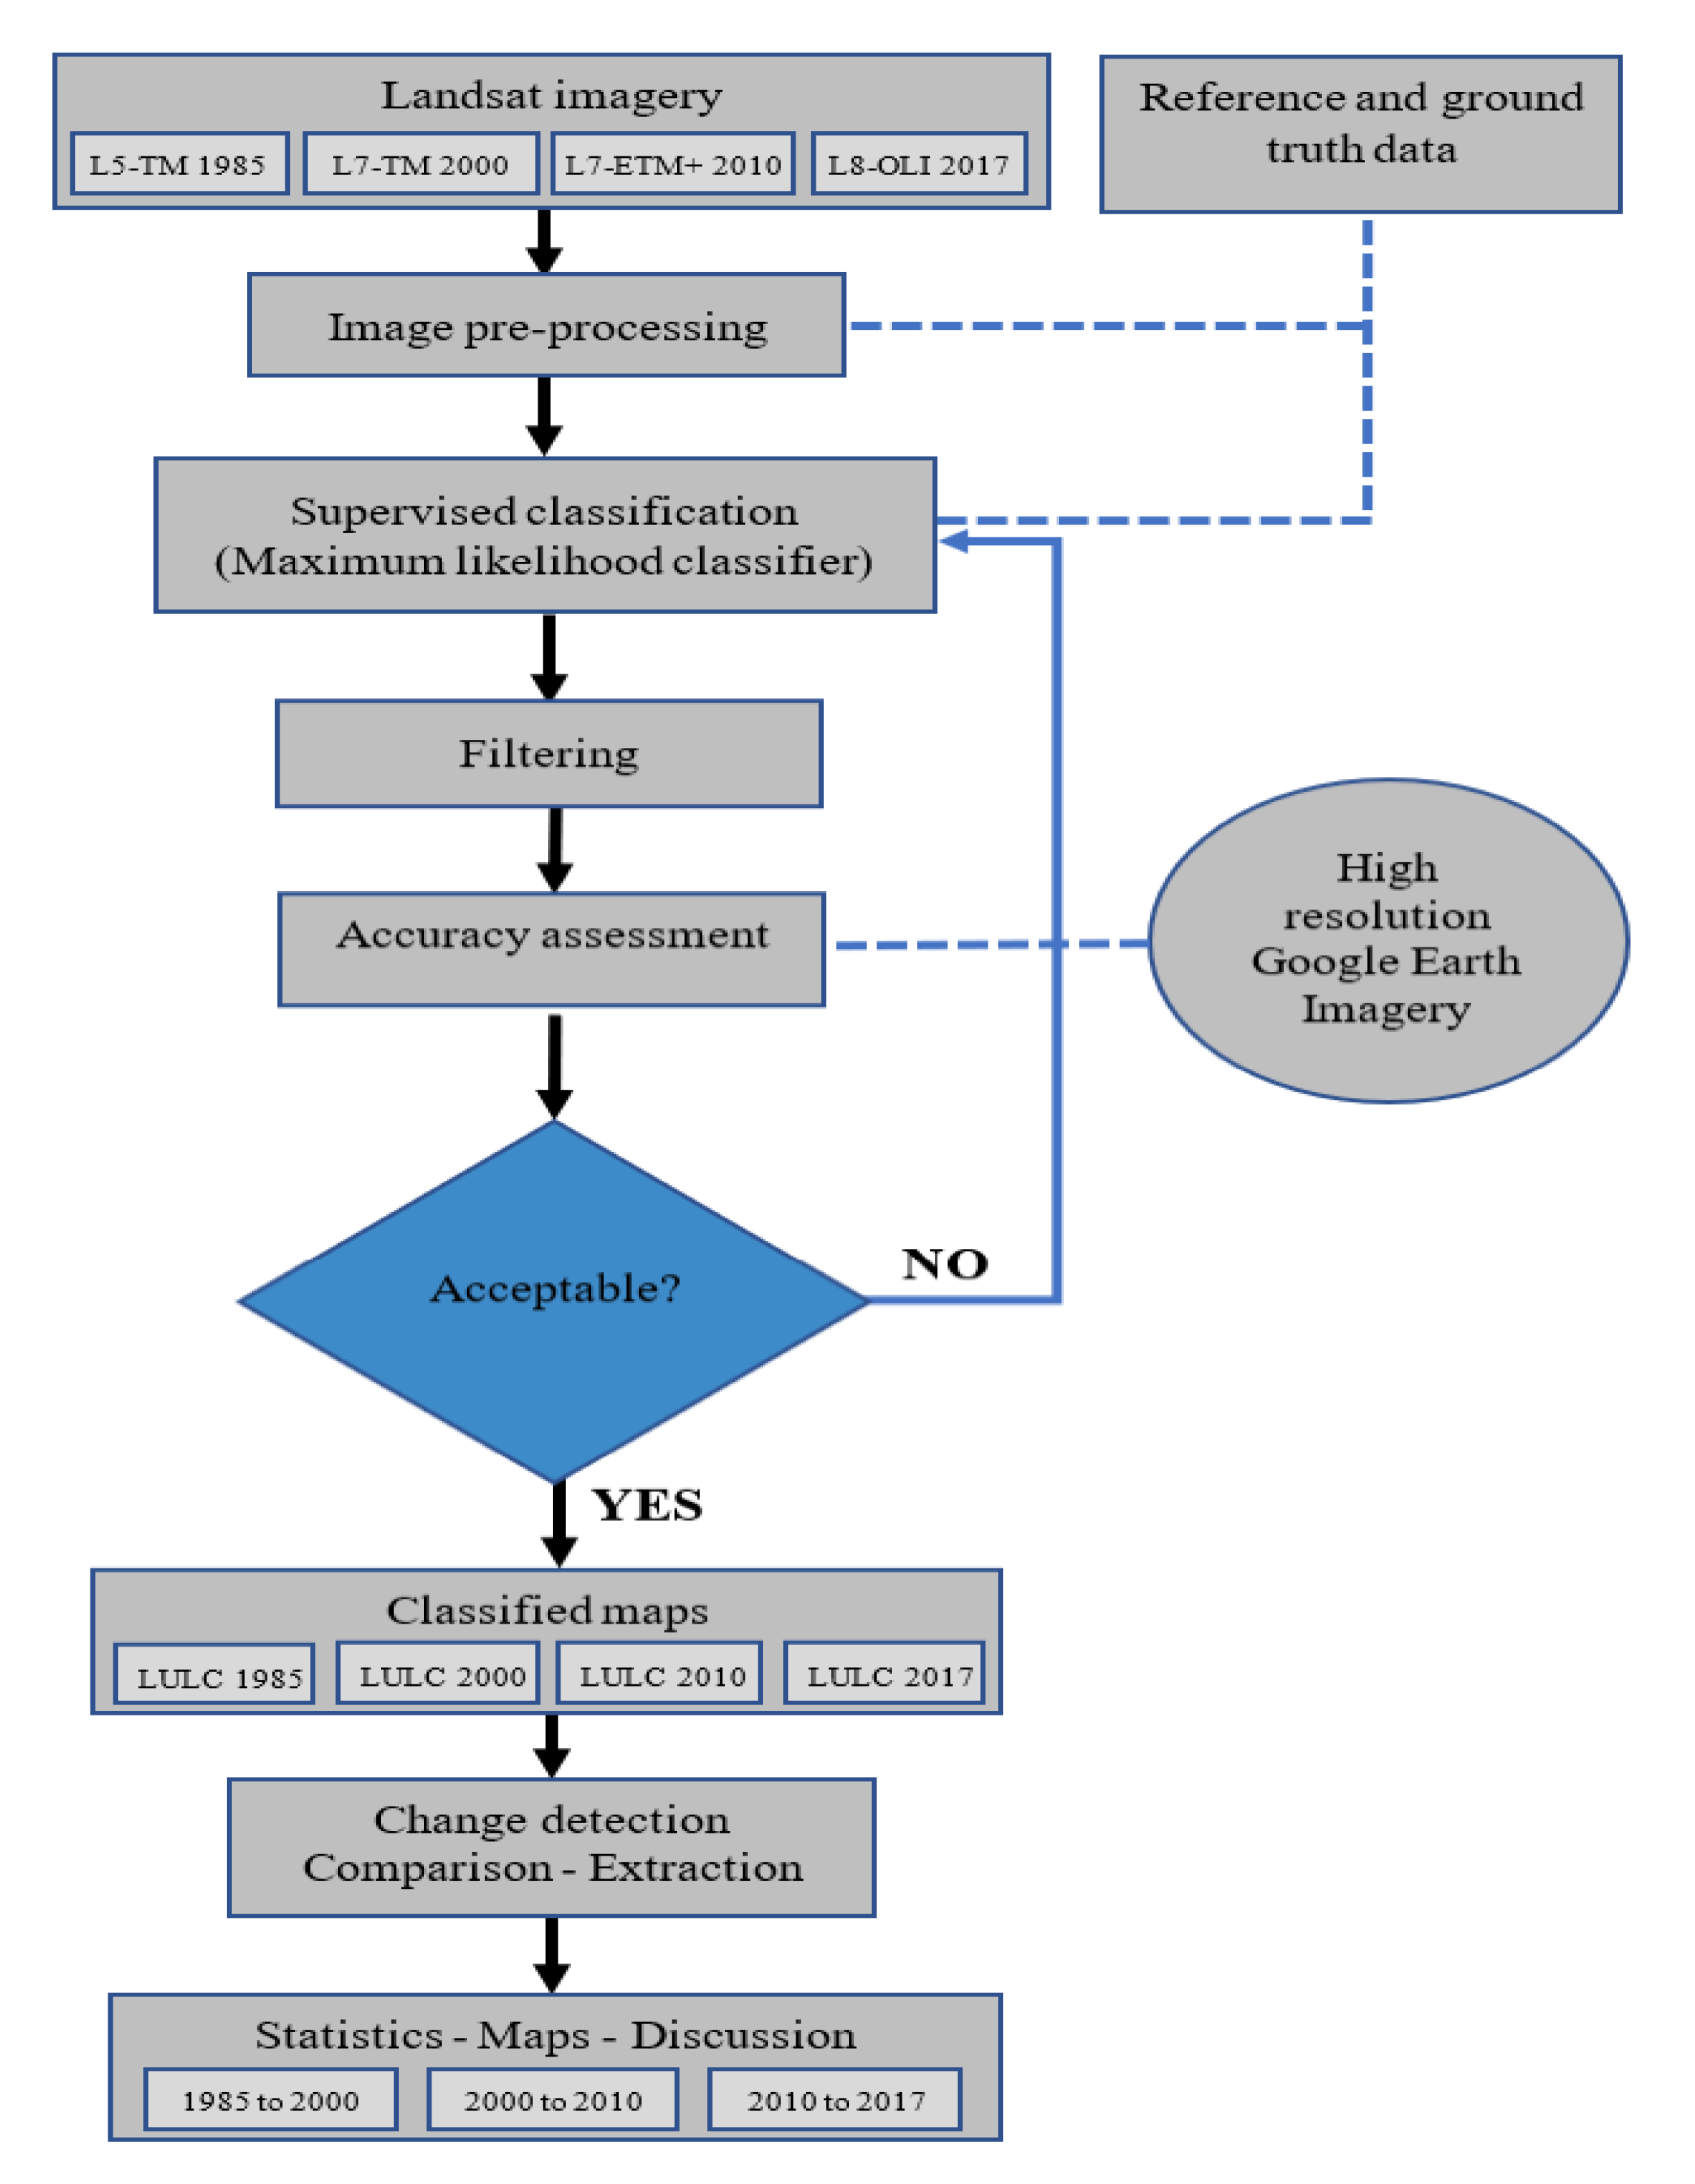
2.3. Image Processing and Analysis

Image data were treated using ENVI 5.3 and Arc-GIS 10.3 software packages. The data processing steps are given in Figure 2 and explained in the following section.

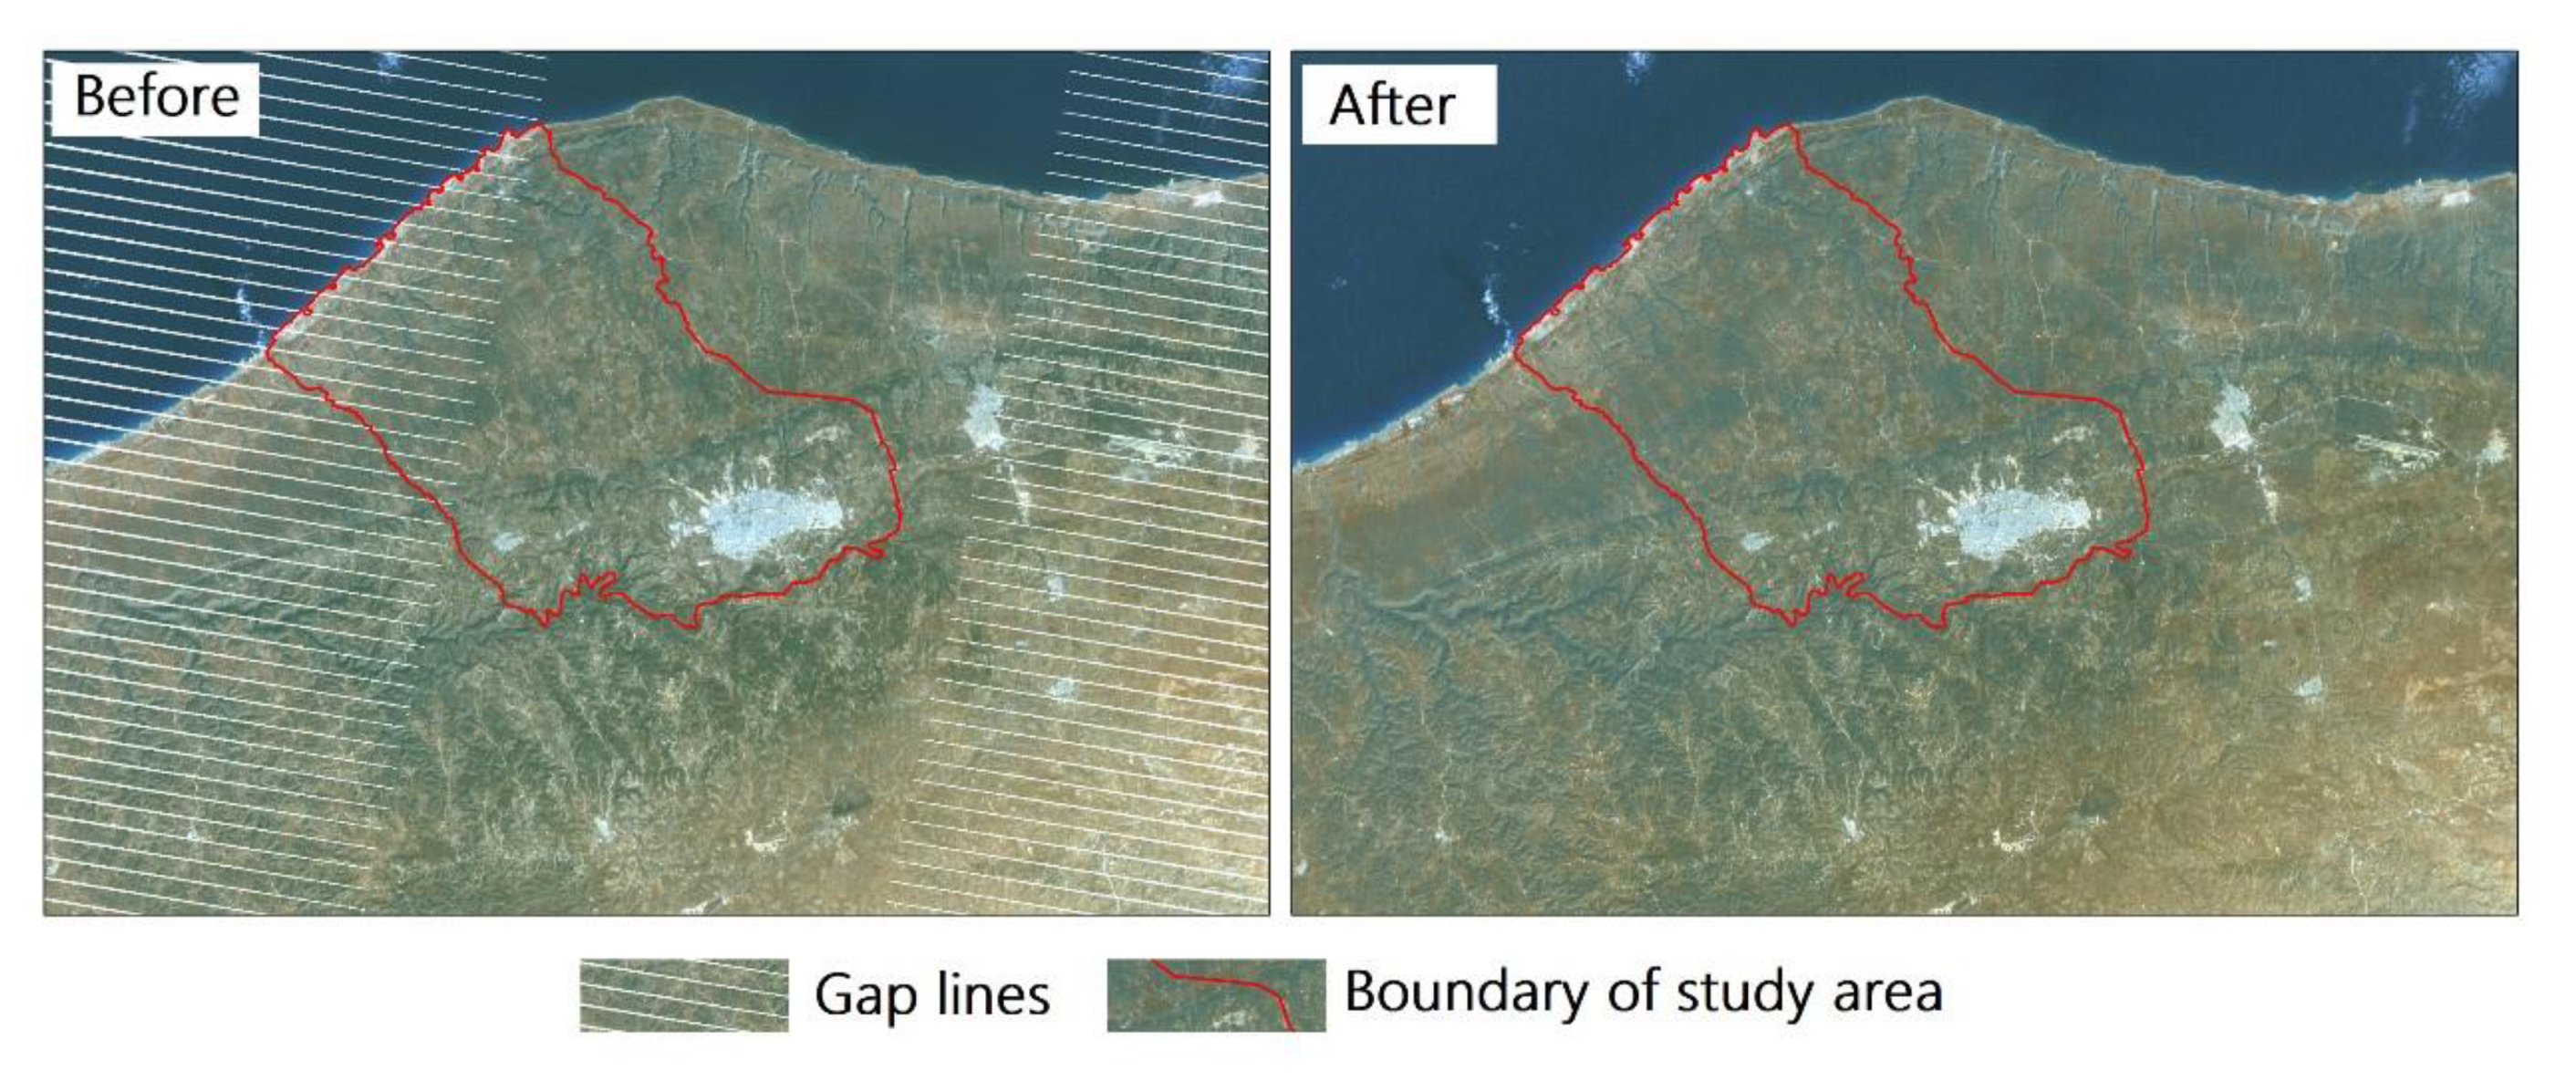
2.3.1. Satellite Image Preprocessing

Comparative analysis using different Landsat data (i.e., TM, ETM+, and OLI (Operational Land Imager)) can be challenging due to the instrumental errors related to ache sensor, noise from several sources, and uncertainty in scale and geometric conditions [32]. Preprocessing satellite imagery before conducting image classification and change detection is very vital to minimize those errors and to build a more thorough association between the obtained data and biophysical features on the ground [33]. In this study, a number of sequential steps of data preprocessing was performed using Arc GIS 10.3 and ENVI 5.3 software packages. These steps comprised radiometric, atmospheric, and geometric corrections in addition to image gap-filling, sub-setting, and enhancement. Preprocessing also involved the selection of the appropriate band combinations to be used in image classification.
To reduce radiometric errors, images were calibrated using the radiometric correction tool in ENVI 5.3, where raw data from the sensors (DNs) were converted to top-of-atmosphere reflectance. For atmospheric correction, a dark object subtraction model was applied in the current study as it is relatively the simplest and most widely used empirical method for classification and change detection applications [34]. This technique operates on the assumption that radiances received at the satellite for dark objects (zero or small surface reflectance) within the image is attributed to atmospheric scattering (path radiance), and thus, the minimum radiance value from the entire image is subtracted from all pixel values [35].
The imageries were projected to the Universal Transverse Mercator (UTM) coordinate system, Datum LGD2006, zone 34 North and corrected for geometric errors from the sources. Image-to-map rectification method was applied to geometrically correct the Landsat 8 OLI/TIRS (Operational Land Imager and Thermal Infrared Sensor) satellite image dated 11 May 2017 using well-distributed ground control points (GCPs) taken from topographic maps at a scale of 1:50000. The other three Landsat images (1985 TM, 2000 TM, and 2010 ETM+) were then referenced by performing the image-to-image registration method using the corrected Landsat 8 OLI/TIRS 2017 image as a reference image. The first-degree polynomial method and nearest neighbor resampling technique were applied when performing the geometrical rectification and image registration.
Because of scan line corrector (SLC) failure (known as the SLC-Off problem) that occurred on May 31, 2003, for the Enhanced Thermal Mapper Plus (ETM+) sensor of Landsat 7, all Landsat 7 images collected from that date till 2013 have had line gaps appear as long lines on both sides of each image, resulting in a loss about 22% of data. However, it was found that the effect of those missing data was slight or passable in some applications, such as monitoring land use change and crop quality [36]. For this study, only the Landsat 7 image dated 05 September 2010 was affected by the SLC-Off error where line gaps covered a portion of the study area in the northwestern side. Therefore, the image was corrected in such a way that the missing data caused by the failure of the SLC were filled. A correction was made to the gap-filling based on a single image by applying the Landsat Gap Fill extension in ENVI 5.3 using the single file gap fill (triangulation) method. This procedure performs correlations between the pixels of the image based on geostatistical interpolation techniques, which use data from the same image where empty pixels are replaced by the mean of their neighbors in the nearest two lines. Figure 3 shows the scene from LSC-Off-affected image before and after correction.
Landsat 8 OLI and Landsat 7 ETM+ imagery were sharpened to increase the resolution from 30 m to 15 m, where the spatial information in the high-resolution panchromatic bands and the color information in the multispectral bands were merged using the nearest neighbor diffusion (NNDiffuse) pan sharpening technique in order to create a more valuable color image with high resolution that improves mapping and classification accuracy [37,38]. However, it was not possible to perform this on the Landsat 5 TM image captured in 1985 since the panchromatic band is not available. Therefore, data were resampled from 30 to 15 m using the nearest neighbor technique to ensure consistency with OLI and ETM+ data used in this study. Furthermore, a collection of enhancement techniques including histogram stretching and spatial filtering and creating band compositions were performed to improve the clarity and visualization of the Landsat images used in this study. All images were clipped to the study area using Arc GIS 10.3 to speed up the data processing.

2.3.2. Image Classification

Image classification is an important remote sensing technique used to catalog all pixels in an image or raw remotely sensed data into a finite number of individual LULC classes to produce beneficial thematic maps and information [39]. The image classification process is normally conducted to assign different spectral signature from the dataset to several classes based on reflectance attributes of the diverse types of LULC.
For this study, a classification scheme was developed after Anderson et al. [40] based on prior knowledge about the study area, reconnaissance field survey, and information from previous studies. The field observations and available map of land cover/vegetation in the northeastern zone of Libya, prepared in 2005 by FAO and The United Nations Development Programme (UNDP), were the basic references for identification of the prevalent LULC classes. Accordingly, five LULC classes, including the natural Mediterranean forest (NMF), orchards and rain-fed agriculture (OR), irrigated crops (IC), urban and built-up lands (UB), and bare and low vegetation lands (BLV), were defined to form the adopted general LULC classification scheme for this study as described in Table 2.
There are several different methods of imagery data classification; however, unsupervised and supervised techniques are the two main approaches commonly used for mapping land cover [41]. Most researchers prefer using the supervised technique because it produces more accurate classification than the unsupervised technique [42,43,44]. There are several statistics-based supervised classifiers. However, the maximum likelihood, minimum distance, parallopiped, and Mahalanobis are the most popular classifiers [45]. While reviewing the literature, it transpired that the maximum likelihood classifier is widely used in remote sensing research as it is quick, is simple to implement, allows a clear interpretation of the outcomes, and mostly delivers a satisfactory accuracy [46,47,48]. The technique presumes that the statistics for each LULC category in each band are subject to the normal distribution and computes the likelihood for each pixel to belong to a particular category [4]. In this work, supervised classification was applied for LULC classification. The process began with the most important step, which is selecting more than 200 training samples in each Landsat image by delineating polygons around representative areas of each LULC class. True and false composites were used to improve the visualization of different features to easily delineate LULC classes in the imagery. Training sites for the predefined LULC classes (Table 2) were developed by the visual interpretation of the Landsat images (1985, 2000, 2010, and 2017) based on ground truthing information, Google Earth imagery, familiarity with the study area, field observations, and historical information derived from interviews conducted with local landholders. Once the training sites were developed, the maximum likelihood classifier was applied to create spectral signatures and then used to classify all pixels in the image. After the initial classification, a majority filter was used to smoothen classification results by removing “salt and pepper” noise from the classified maps, and thus, final LULC maps were produced and used for further analyses.

2.3.3. Classification Accuracy Assessment

The accuracy assessment in this study was done using historical high-resolution google imagery obtained from Google Earth Pro 7.3.1.4507 (Google Inc., Mountain View, CA, USA). Two google images captured in October 2010 and July 2017 were used to carry out the accuracy validation for LULC maps of 2010 and 2017, respectively. The random sampling technique was used to identify verification points based on the density and distribution of each LULC class which was performed in ArcGIS 10.3 using the “create random points” tool. A total number of 280 verification points were randomly selected with a minimum sample number of at least 50 for each class [49]. However, no accuracy assessment was conducted for the land use map of 1985 and 2000 due to the dearth of adequate reference data, and it was assumed that accuracy validation for classification maps of 2010 and 2017 should be adequate to give information on the general accuracy of the adopted procedures in this research for mapping LULC.
Classification accuracy was assessed using measures derived from the error matrices, and these included overall accuracy and kappa coefficient. In addition, user’s and producer’s accuracies were also obtained for each class, which respectively measure the commission and omission errors. The value of overall accuracy greater than 70% is regarded as an acceptable classification accuracy [50]. For most applications, values of Kappa statistic more than 0.75 can be accepted as an excellent or very good agreement while values in the range of 0.40 to 0.75 are indicative of fair or good correspondence and values less than 0.4 represent poor correspondence [51].

2.3.4. Change Detection

Change detection is defined as “the process of identifying differences in the state of an object or phenomenon by observing it at different times” [52]. Change detection analysis makes LULC study a subject of interest because it not only explore changes that have taken place but also identifies their nature and determines their spatial extent and pattern [53,54]. There are several methods that have been developed for change detection analysis of remote sensing data, and they have been classified into two major categories: pre-classification and post-classification comparison techniques [55]. However, the post-classification comparison approach has been proven to be the most commonly used method for LULC change detection [56].
The post-classification approach involves the classification of multiple date images separately to generate thematic maps, after which a pixel-based comparison of the corresponding classes is used to produce tables and maps of changes that have occurred [57]. There are several advantages to using post-classification comparison approach, and this includes the following: 1) it minimizes the possible effects of sensor and atmospheric and environmental differences between images as they are independently classified, 2) it provides more detailed information obtained from a complete matrix of LULC change, and 3) it quantifies the change rates and magnitude of change [58]. However, the degree of change detection success depends on the accuracy of individual classifications [59]. Many studies have employed post-classification techniques based on maximum likelihood classification for detecting LULC changes in different areas around the world using Landsat imagery data and have attained high accuracy [47,60,61,62,63]. The capability of the post-classification comparison techniques is not limited to just identifying the size and distributions of areas that have changed, but it goes beyond that to determine the individual participation rate of each LULC class in changing another particular class. Therefore, the post-classification comparison technique was chosen in this study to be employed for change detection. Pairs of the produced classified thematic maps for the four dates (1985, 2000, 2010, and 2017) were compared by applying the detection algorithm using ENVI 5.3. Change maps and matrices were produced to understand the change status and its magnitude rate for the periods of 1985 to 2000, 2000 to 2010, and 2010 to 2017.
The magnitude of change (MC), the percentage of change (PC), and the annual rate of change (ARC) for each LULC class during each period of time were computed based on the following equations:
M C ( h a ) = A i - A f
P C   ( % ) = A i - A f A i × 100
A R C   ( h a .   y e a r 1 ) = ( A i A f   n )
ARC   ( % ) = ( A i - A f   A i × n ) × 100
where A i is the class area (ha) at the initial time, A f is the class area (ha) at the final time, and n is the number of years of the time period.

3. Results and Discussion

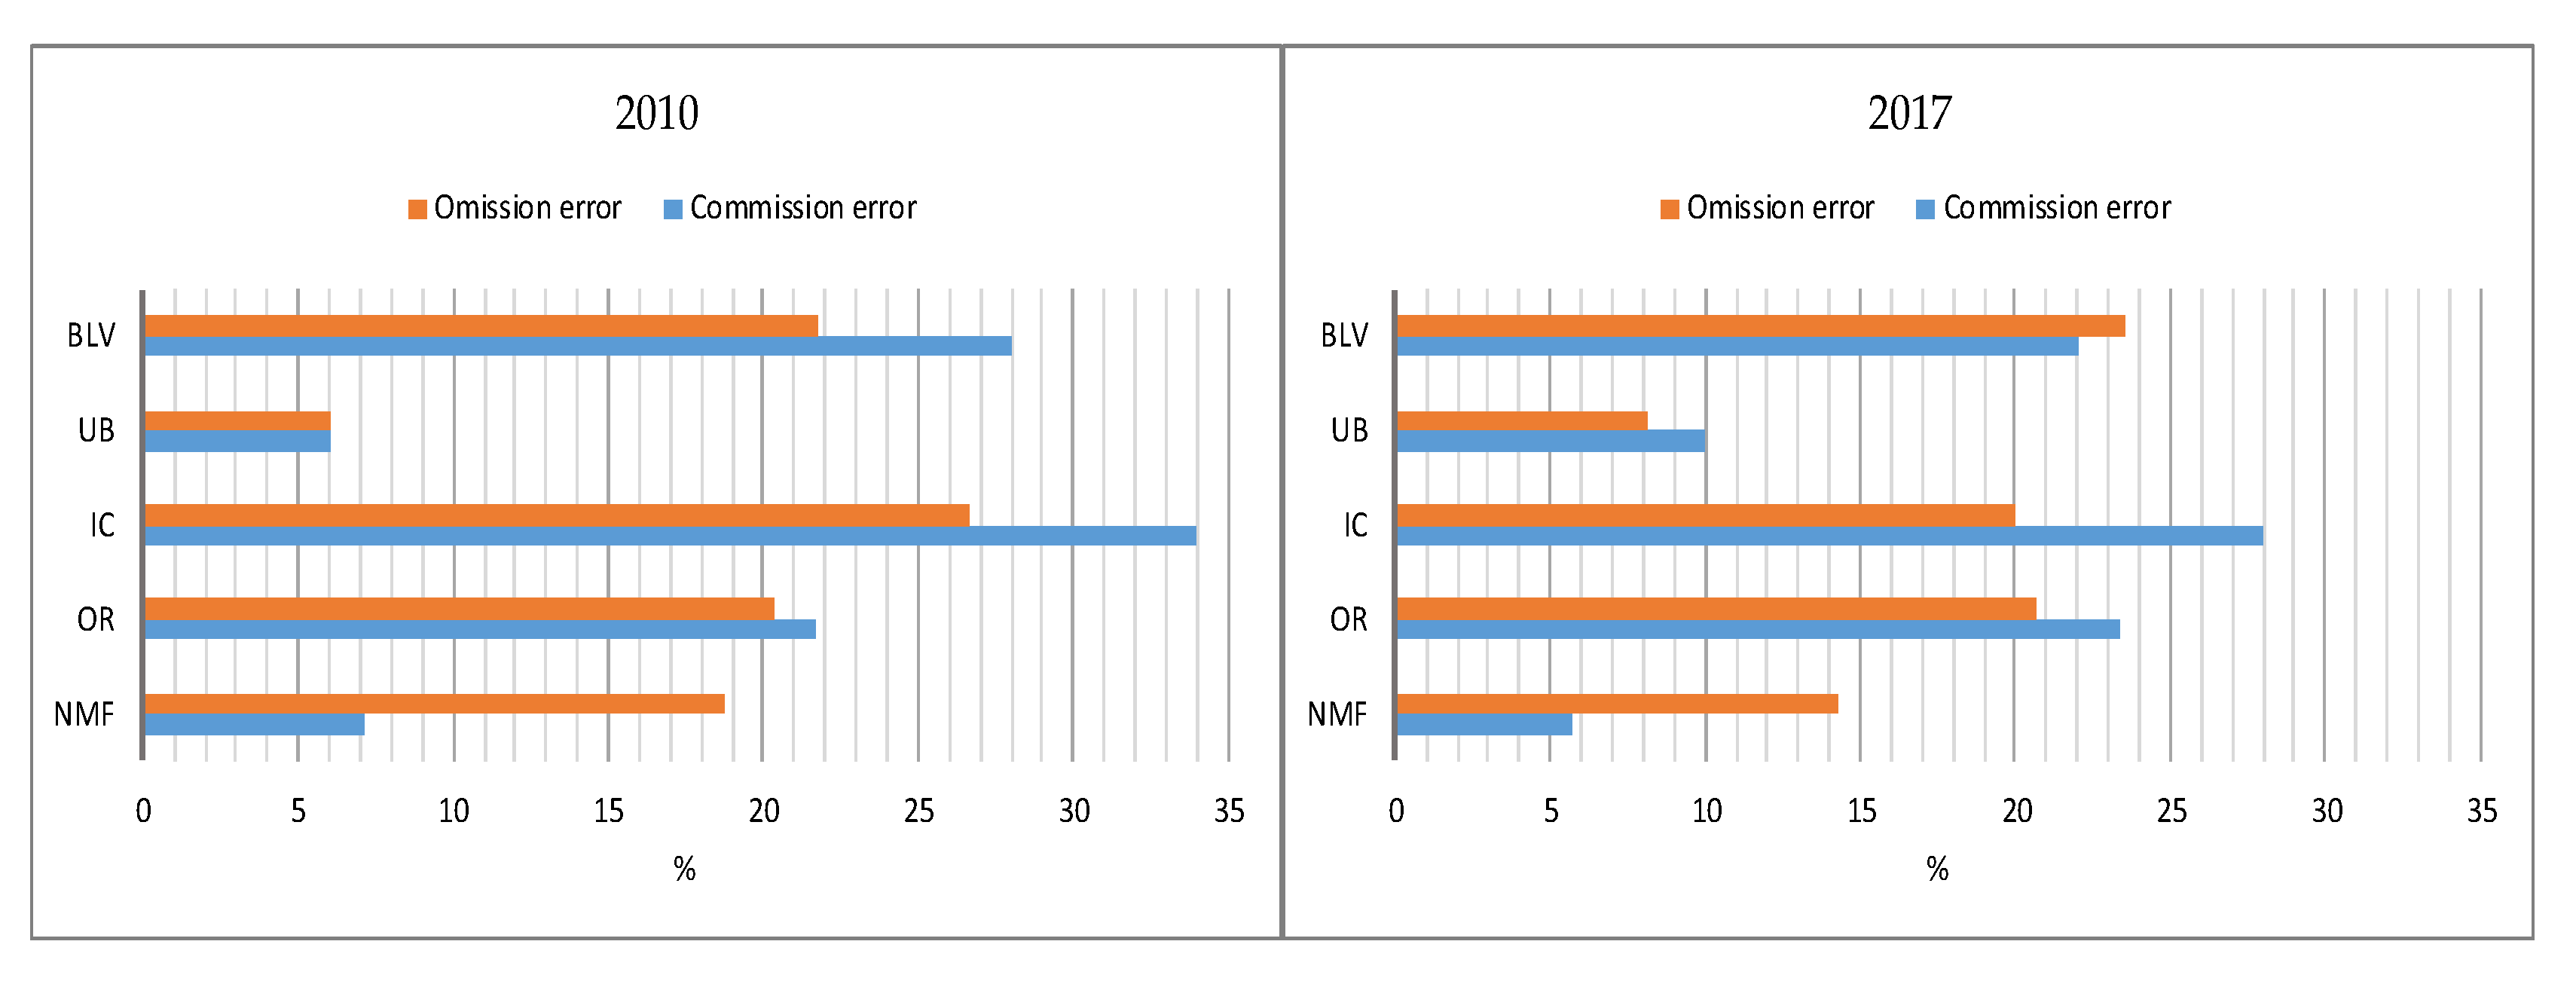
3.1. Accuracy Assessment

The use of maximum likelihood classifier to categorize the Landsat images (TM, ETM+, and OLI/TIRS) has produced maps showing the distribution of the five prevalent LULC classes in the study area for the years 1985, 2000, 2011, and 2017. Accuracy assessment was carried out for the classified maps of 2010 and 2017 to examine the agreement between the produced maps and what actually exists on the ground. Table 3 illustrates the summarized results of classification accuracy.
The classified maps of 2010 and 2017 achieved overall accuracy values of 81% and 83%, respectively, indicating that both LULC maps met the criterion. Furthermore, values of the kappa coefficient for both the two maps were more than 0.75, indicating good agreements. Results also showed that means of commission and omission errors were less than 20%, inferring an acceptable classification accuracy.
The LULC classification of Landsat ETM+ 2010 and OLI 2017 recorded the largest commission and omission error within the BLV, IC, and OR classes (Figure 4). Commission errors varied among these classes between 22% and 34%, while omission errors varied from 20% to 27%. These classes were confused with each other and with other classes. These errors might be due to the spatial pattern of vegetation growth which might lead to spectral confusion. For example, the fields of IC class in the study area often are small areas adjacent to lands of other land uses, especially OR. Also, leaving the agricultural lands (IC and OR) exposed without any vegetation cover after harvesting and before the next planting season might be a source of spectral confusion with BLV class. However, there are some other sources of errors, such as mixed pixels and atmospheric reflection effects, that may have resulted in confusion between LULC classes. Generally, the accuracy achieved by the maximum likelihood classification for the different LULC in this study is in agreement with previous studies that have worked on LULC classification in semiarid areas and is hence adequate for further investigation.

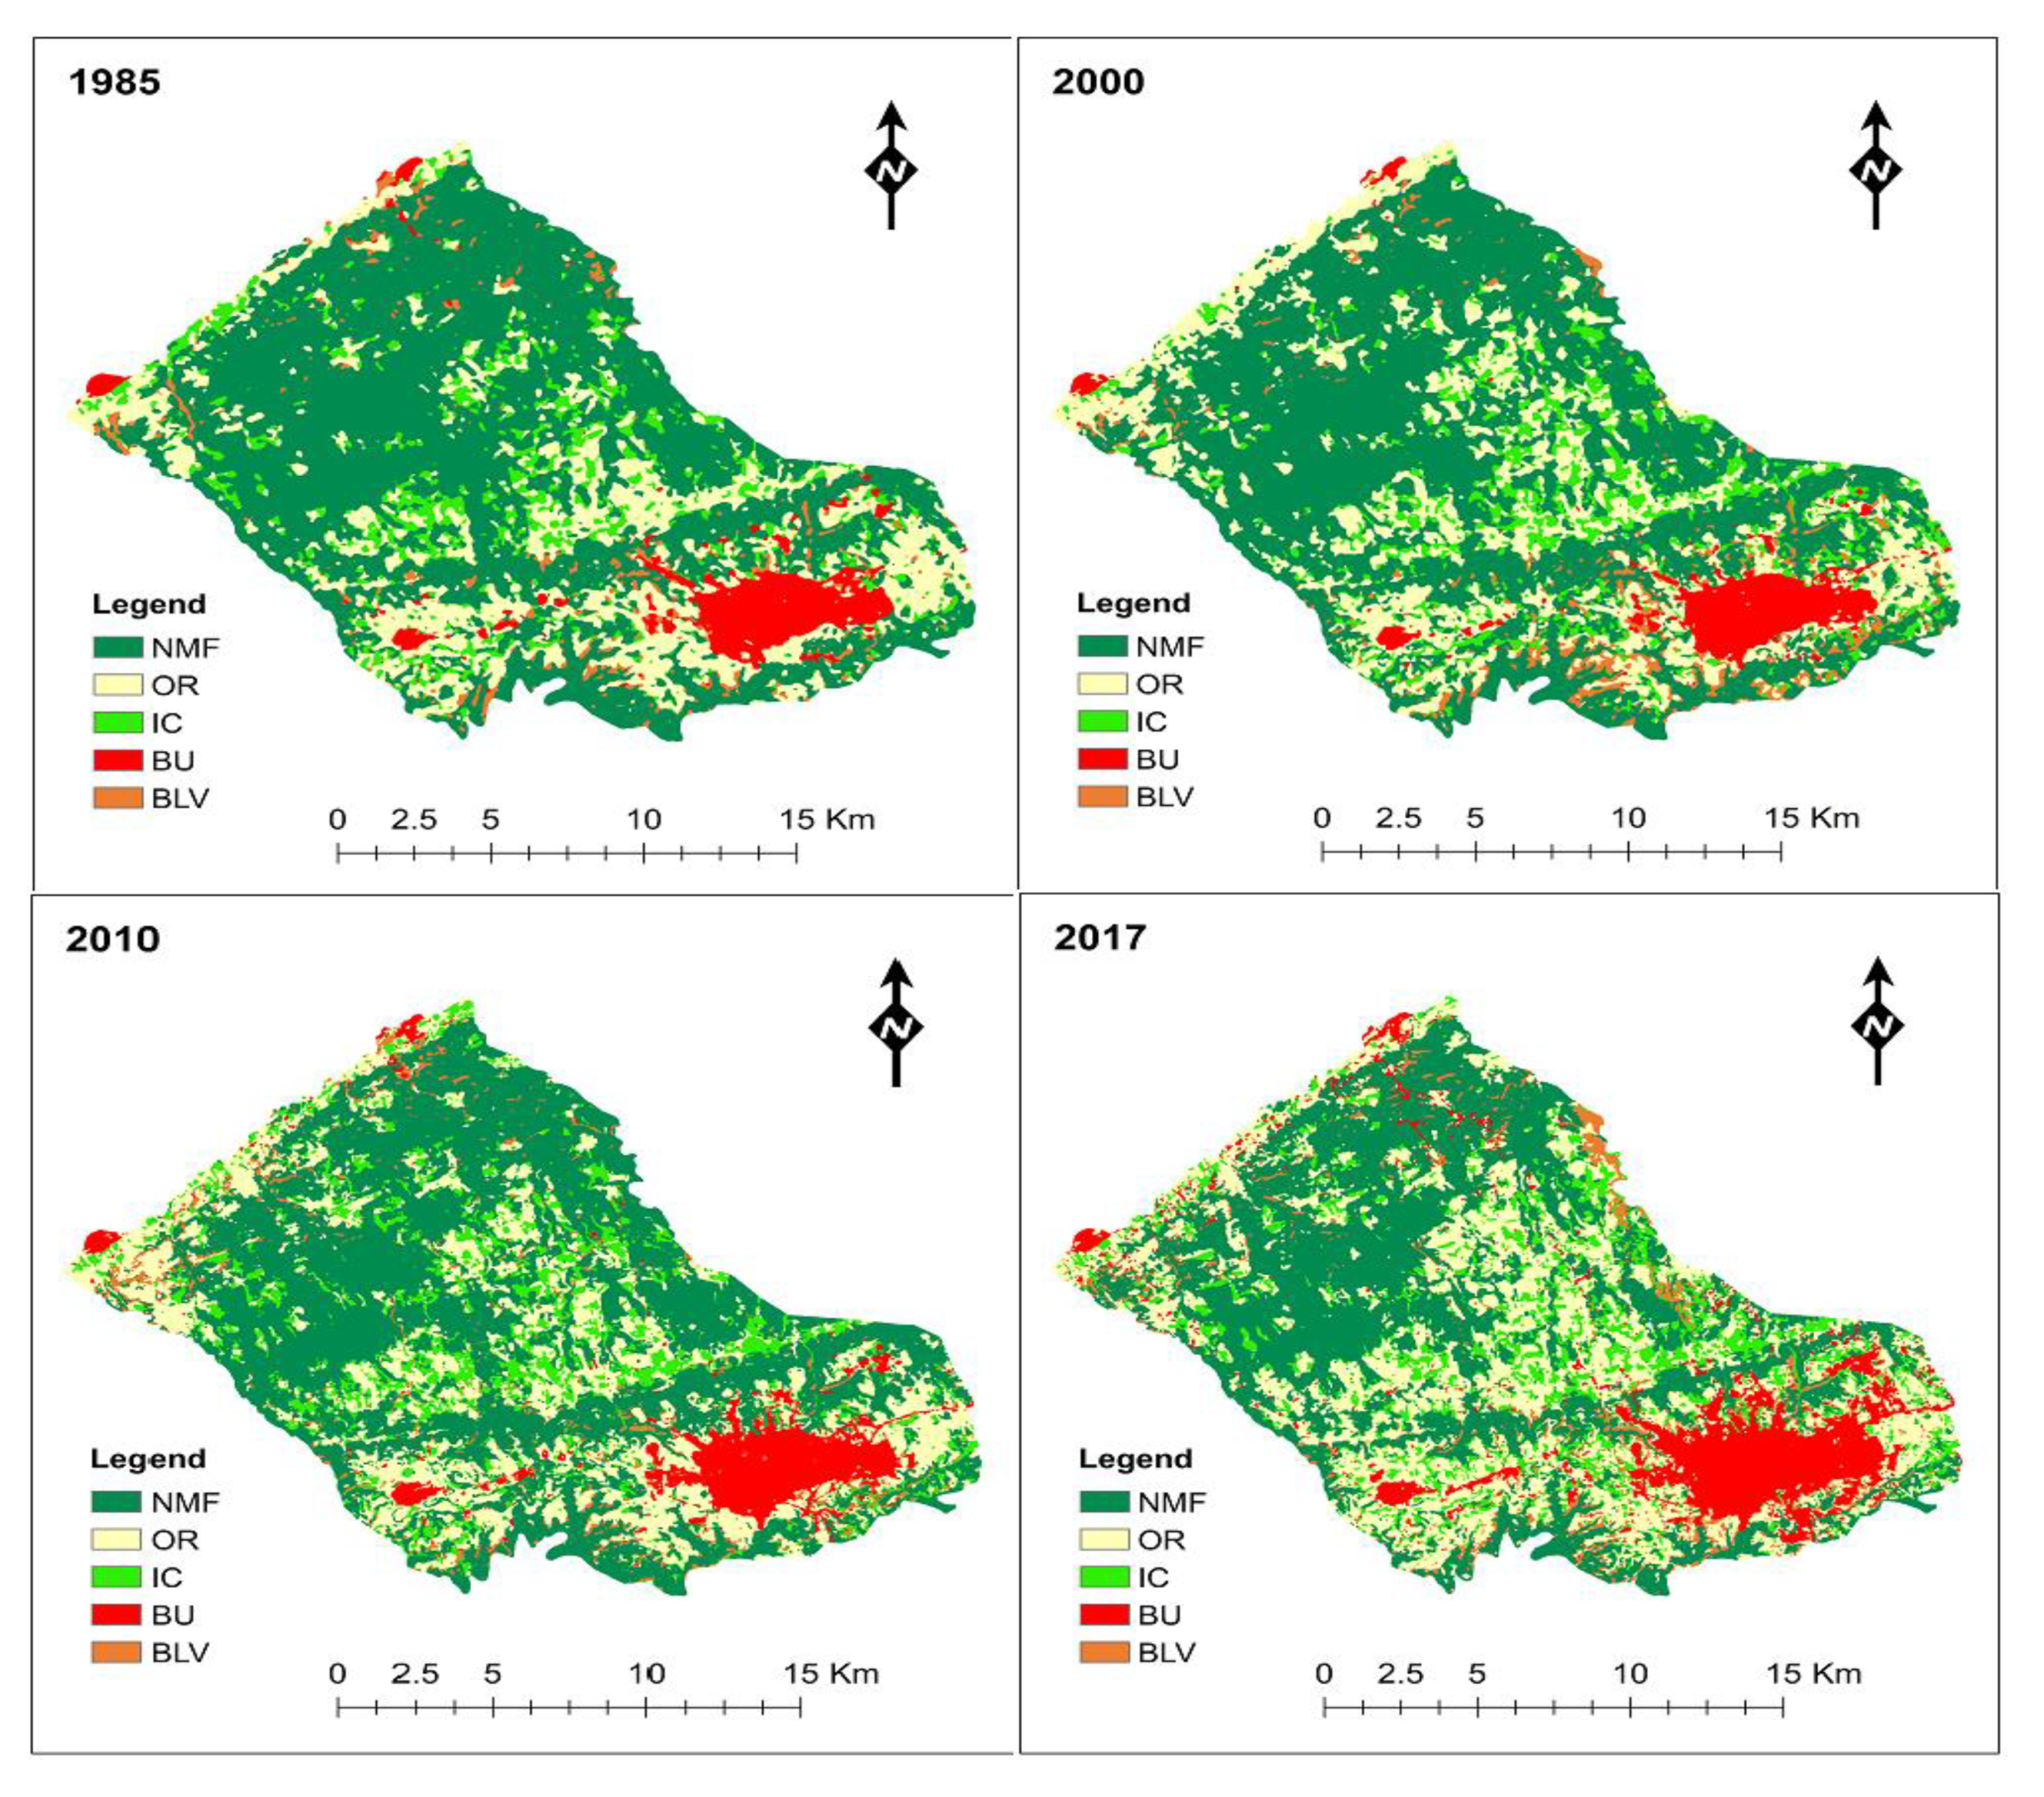
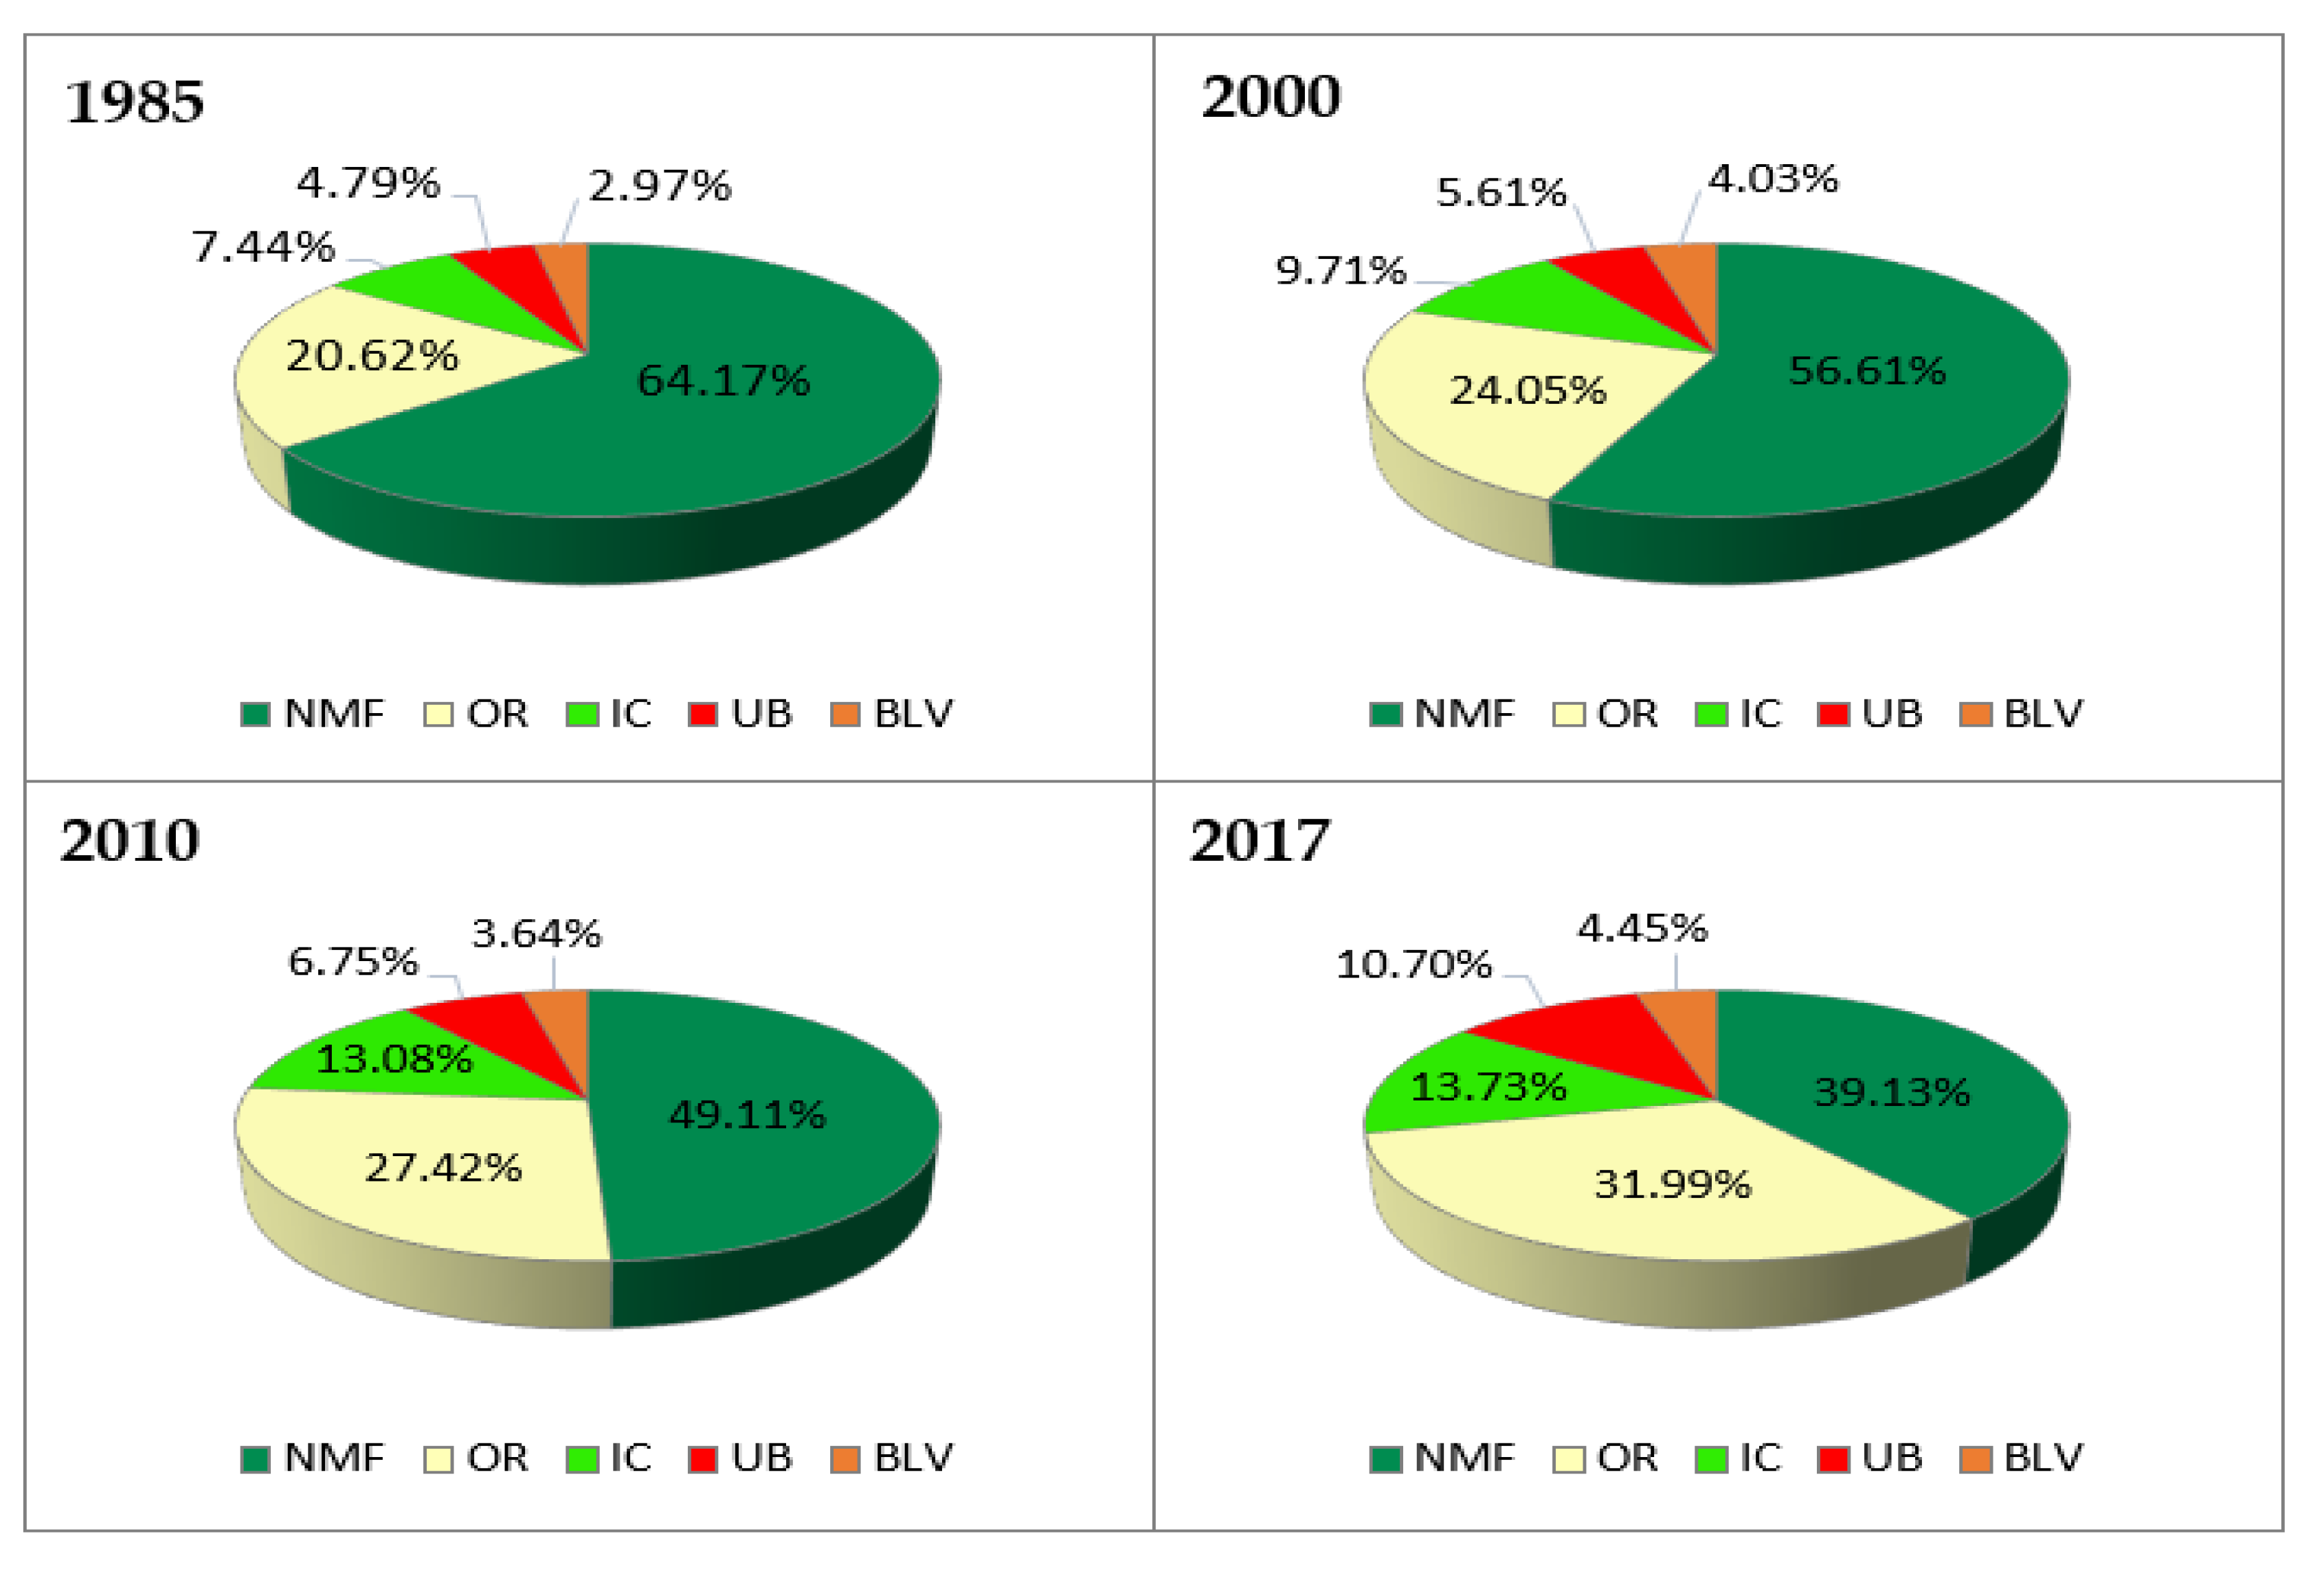
3.2. Supervised Classification

The processing and supervised classification of Landsat imagery (TM, ETM+, and OLI/TIRS) acquired in 1985, 2000, 2010, and 2017 produced four classification maps for the five LULC types prevalent in the study area (Figure 5). Classification results showed that the areas of LULC classes in the four produced maps (1985, 2000, 2010, and 2017) are in descending order as follows: NMF > OR > IC > UB > BLV (Figure 6). NMF is the dominating class, especially in the northern latitudes of the study area, covering more than half of the total landscape in 1985 and 2000 but decreased to less than 40% in 2017. The OR class occupied an area ranging from 20% to about 32% of the total area over the study time period, while the maximum area of each of the other classes represents less than 15%. With regard to agricultural uses, lands of the OR class are distributed over different parts within the study area, whereas lands under the IC class are concentrated in the middle latitudes of the study area (Lussaitah area) and in the narrow coastal strip in the north. These areas are considered as the most important agricultural areas in the region of Al-Jabal Al-Akhdar due to the sufficient amount of precipitation and soil fertility in addition to the availability of groundwater. On the other hand, areas of the UB class are concentrated in the southeastern part, where the city of Al-Bayda lies.

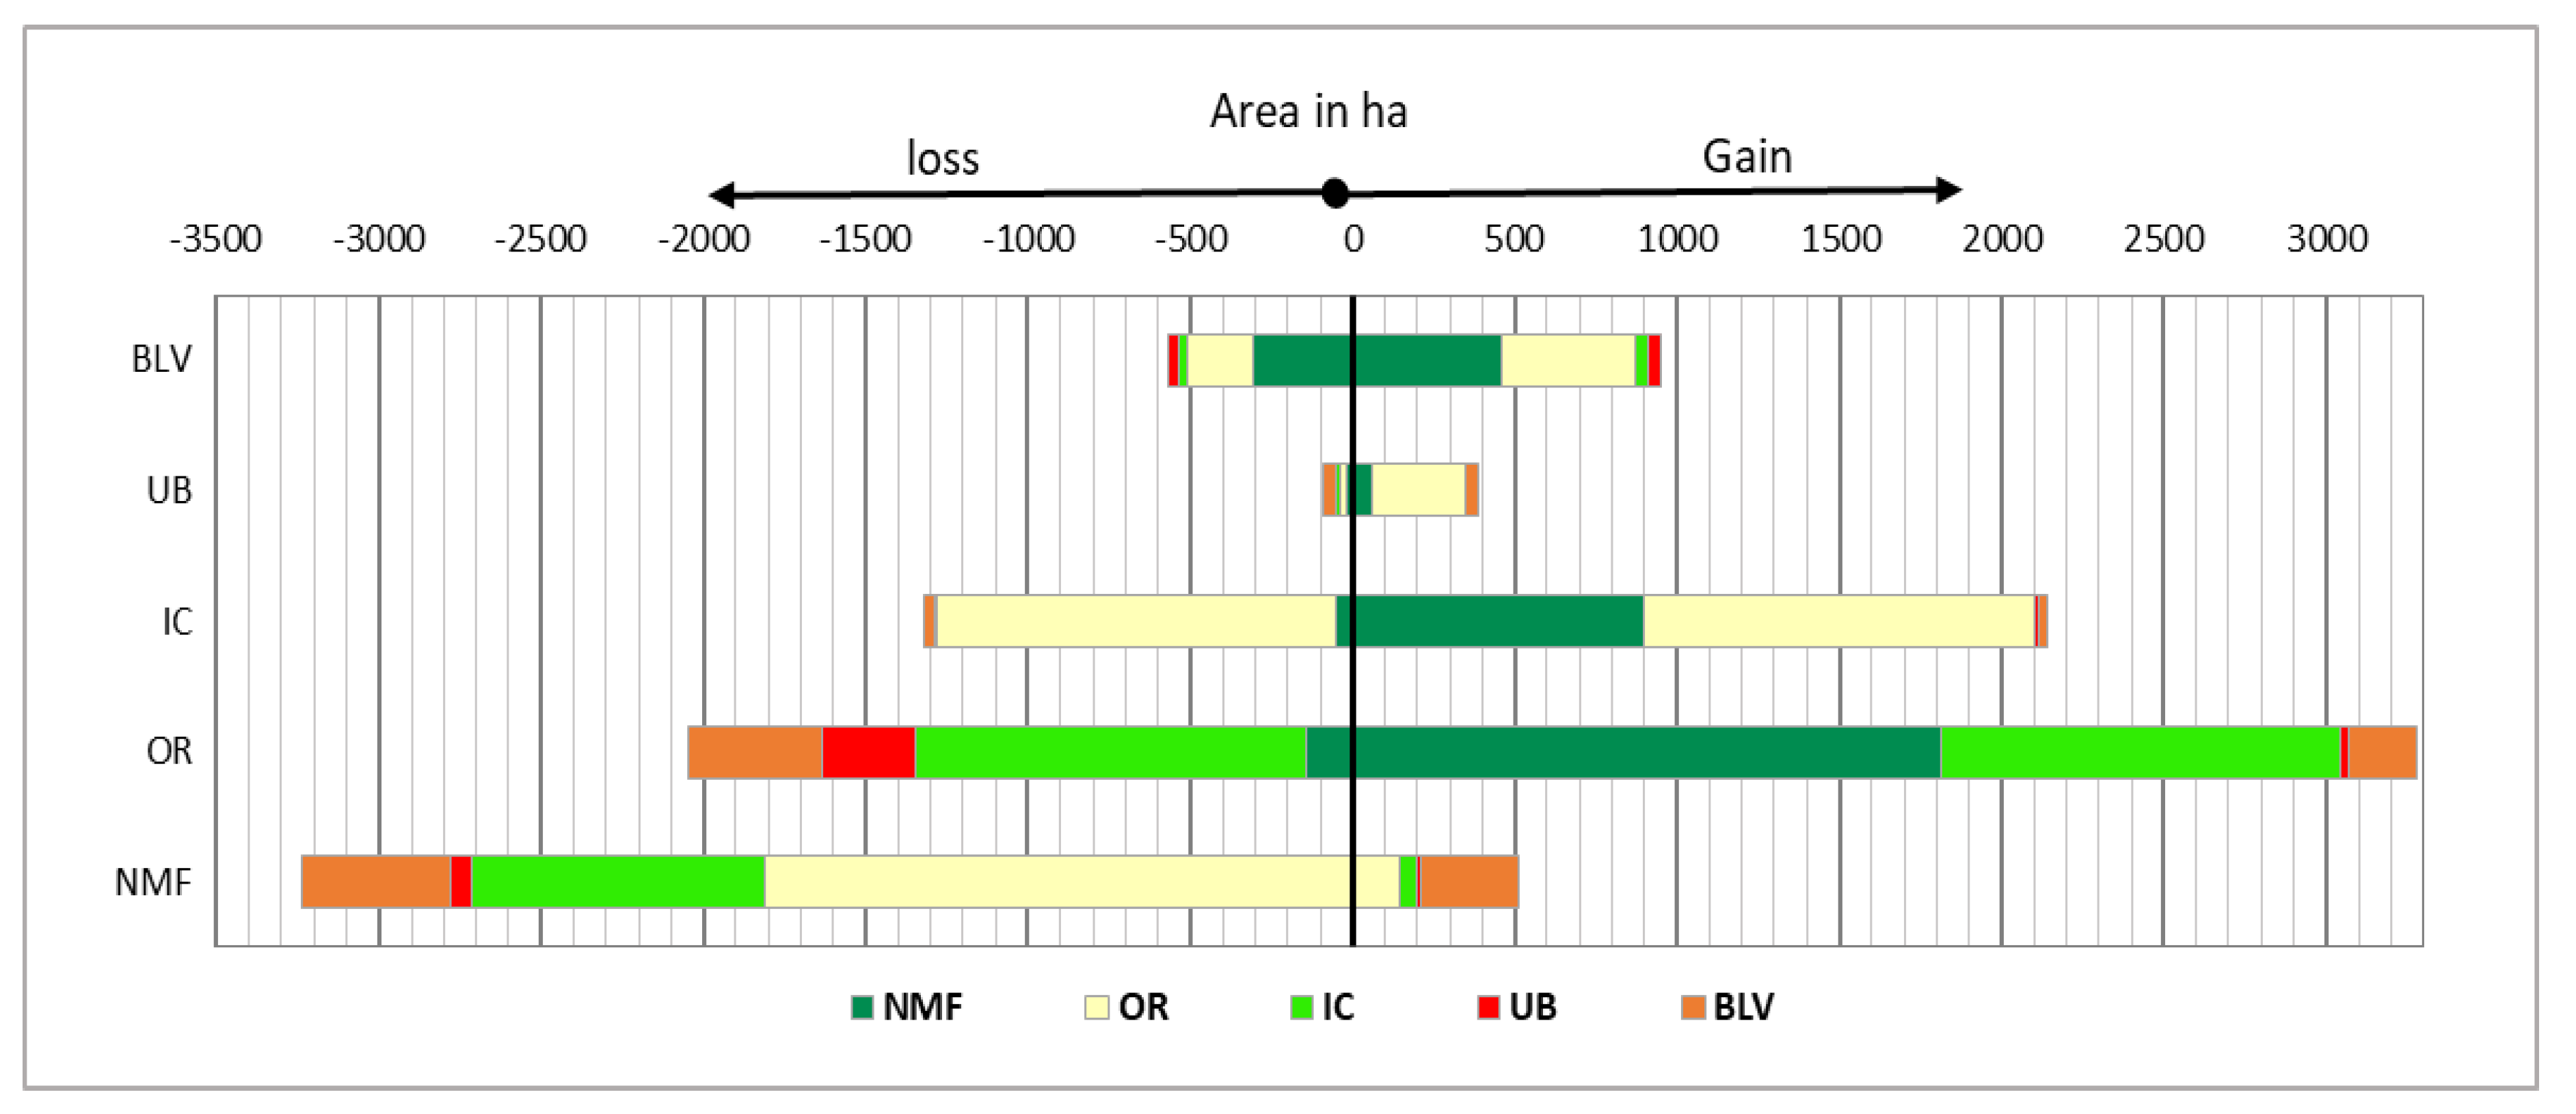
3.3. LULC Change Detection

The outcomes of the post-classification comparison give an account of the amount and type of change that has taken place for each LULC class. Areal change of LULC types in all imageries was obviously visible and occurred as either an expansion or a decline between sequential dates. Attempts to further study these outcomes can give insight to the land use behavior, pattern, and rate at which the changes occur in the study area in particular and in the region of Al-Jabal Al-Akhdar in general. This essential information would be vital for development planners and decision makers.
Change matrices and statistics for the periods of 1985–2000, 2000–2010, and 2010–2017 were generated from the comparison of classified maps of 1985, 2000, 2010, and 2017 and will be discussed in detail in the following sections.

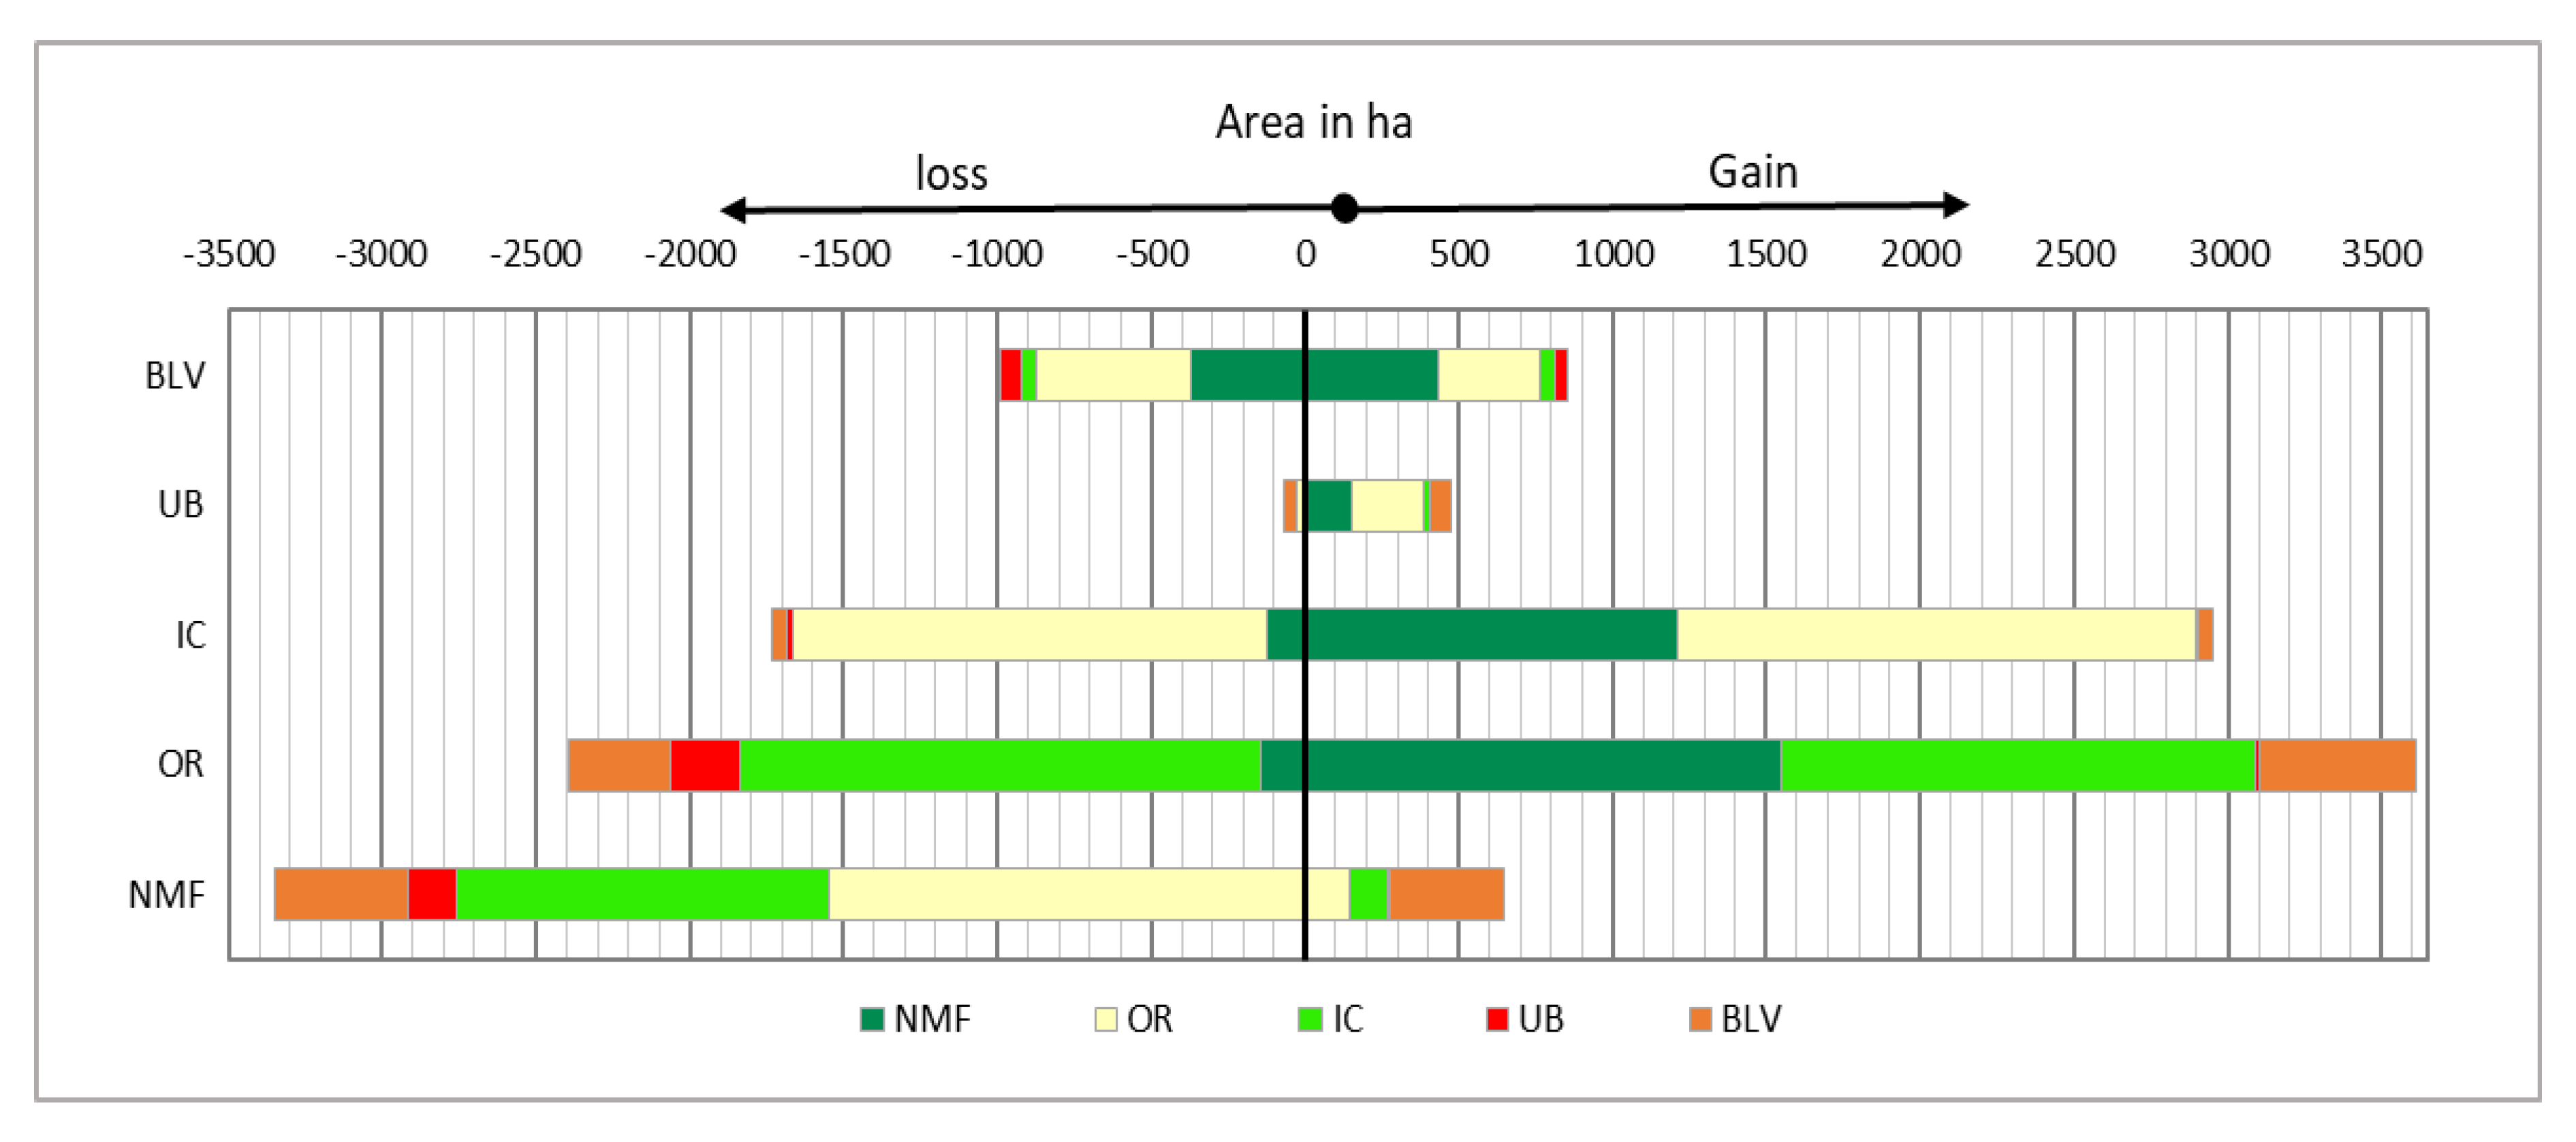
3.3.1. LULC Change between 1985 and 2000

In 1985, the NMF class constituted the major type of LULC in the study area at 64.17% of the total area, followed by OR (20.62%), IR (7.44%), and UB (4.79%), whereas BLV only covered 3% and occupied the smallest area. During the 15-year time frame from 1985 to 2000, the area covered by NMF declined by 2724 ha, viz. 11.79% of the initial area, while other LULC types increased at different rates. Table 4 and Figure 7 summarize the major LULC conversion that occurred within the study area between 1985 and 2000.
As shown in Table 4, based on 36,010 ha, the total size of the study area, NMF covered 23,109 ha in 1985 (64.17% of the total area), but this changed to 20,385 ha (56.61%) in the year 2000, with a negative annual rate of change of 182 ha.year−1 (0.79%). As shown in Figure 7, out of the 23,109 ha that was NMF in 1985, about 19,871 ha (85.99%) remain unchanged in 2000. The remaining area, which was estimated at 3238 ha (14.01%), was either cleared or converted to other LULC types, mostly for agricultural purpose. About 1814 ha (56.02% of NMF loss) was converted to OR, whereas about 900 ha (27.79% of NMF loss) was cultivated for IC. Additionally, about 461 ha (14.24% of NMF loss) was changed to BLV, and only 63 ha (1.95% of loss) was converted to UB. However, during the 15 years, NMF was restored in small areas of about 515 ha mostly over BLV and abandoned OR lands.
It is important to remember that, in 1986, under the previous political regime, the Ministry of Agriculture in Libya was abolished with all its departments and various control and enforcement agencies at the national level including the forest guard; thus, the agricultural sectors in all regions regrouped under the management of the sector directors, and this encouraged forests encroachment and failure of protection efforts. The weakness of institutions and absence of accountability among other factors encouraged the local people to engage in forest encroachment by either clearance of vegetation cover for agricultural expansion or by cutting trees for gathering firewood, especially for making the popular Libyan bread, in addition to producing charcoal for heating, barbecue, and cooking. In addition, some landowners have tried exploiting forest land in an attempt to regain their lands that were confiscated and turned into state property by law (No. 142 of 1970). Although the Ministry of Agriculture was reinstated in 1990 and a new forest law was enacted in 1992 to correct the accesses committed, the disaster of forest loss had already taken place and its negative effects were visible and tangible.
On the other hand, forests in Libya, like others in the Mediterranean region, which is one of the most affected regions by forest fires, have suffered excessive degradation by fires which are mainly due to manmade activities [64]. Destructive forest fires in Al-Jabal Al-Akhdar have always been present since the last few decades, often attributed to human activities and sometimes to natural factors. People in the region use fires to remove the natural vegetation, either to exploit the lands for agricultural use, or to induce annual plants to grow intensively to improve site characteristics as pasturelands for grazing their livestock. According to official reports from the Ministry of Justice and Public Security and the Ministry of Agriculture cited in OMU [19], forest fires devoured as much as 33,230 ha of the natural Mediterranean forest in the region of Al-Jabal Al-Akhdar in the period between 1985 and 2003, of which 4000 hectares were located in the focus area of this study (in Massah, Lussaitah and Al-Haniya).
The area of agricultural land in 2000, in comparison to 1985, increased by 2050 ha, where the area of OR increased from 7426 ha (20.62%) to 8659 ha (24.05%) with an annual rate of 82 ha.year1, while the area of IC increased from 2679 ha (7.44%) to 3496 (9.71%) with an annual rate of 55 ha.year1 (Table 4). The results shown in Figure 7 illustrate that about 5382 ha (72.48%) of OR land in 1985 did not change in 2000 whereas about 2044 ha (27.52%) were converted to other land uses, especially for IC, which acquired an area of 1202 ha from OR (58.81% of OR loss). However, OR gained new areas in 2000, estimated at 3277 ha. Much of OR gains were obtained from the clearance of NMF and conversion of IC land, which account for about 55.36% and 37.56% of OR gains, respectively. Clearance of NMF also contributed 900 ha to IC (42.08% of IC gain).
Libya has given the agricultural sector the largest share of the allocation of its transformation agenda through developmental projects during the 1970s and 1980s such as vertical and horizontal expansion in crop and fodder production. The region of Al-Jabal Al-Akhdar received a large share of these allocations that were used to reclaim large tracts of land estimated at about 160,000 ha. New farms were established in the Al-Jabal Al-Akhdar region to produce fruit and grain crops to attain self-sufficiency in food production; however, substantial areas of natural cover have been left without change for conservation purposes or to be used for natural grazing, particularly on hilly sites. The local people later exploited these marginal unused areas for establishing more private fields to produce cereal crops as well as fruits and irrigated vegetables in order to capitalize on the increasingly lucrative market.
The results shown in Table 4 indicate that the urban expansion in this period was not very large in the study area. The areas of UB increased by only 295 ha, with an annual rate of 20 ha.year−1, and most of the UB gains were from the conversion of OR land, which represented 73.71% of the UB gains (Figure 7). This slight rate of increase in urban expansion may be attributed to several factors, one of them is the decrease in the annual rate of population growth in the Al-Jabal Al-Akhdar region and the whole country in general. As shown in Figure 8, the annual rate of population growth in the Al-Jabal Al-Akhdar region was 4.53% during the period 1964–1973 and dropped to 3.92% during the period 1973–1984 and then to 2.35% during the period 1984–1995. Another factor that strongly limited the urban expansion is the suspension of development programs and housing projects in the whole country due to many reasons such as the global economic depression of the mid-80s, the decline in oil prices and sales, and the trade sanctions against Libya during the 90s.
More land was converted to BLV in over 15 years between 1985 and 2000, which resulted in an increase in the total area of BLV by 379 ha (35.39%) with an annual rate of 25 ha.year1 (Table 4). As shown in Figure 7, the clearance of NMF land and abandonment of agricultural lands, particularly OR land, were the main factors that led to the increase in BLV area which represented 48.58% and 43.41% of BLV gains, respectively, by a combined area of about 873 ha. However, forest restoration occurred on about 303 ha (58.83% of the BLV loss) and about 208 ha (40.39% of the BLV loss) were converted to OR.

3.3.2. LULC Change between 2000 and 2010

During the 10 years between 2000 and 2010, more forest land was cleared or changed to other land uses. NMF areas, which amounted to 20,385ha (56.61%) in 2000, decreased to 17,685 ha (49.11%) in 2010, with an annual rate of 270 ha.year−1 (1.32%) (Table 5). From the result in Figure 9, it is apparent that, out of 20,385 ha of NMF in 2000, about 17,035 ha (83.57%) of NMF did not change in the subsequent ten years whereas 3350 ha (16.43%) were cleared or converted to other land uses. Most of the lost area of NMF changed to agricultural land uses, where about 1547 ha (46.18% of NMF loss) was transferred to OR and about 1213 ha (36.21% of NMF loss) was cultivated for IC. Moreover, about 435 ha (12.99% of NMF loss) was changed to BLV in 2010, while only 155 ha (4.63% of NMF loss) changed to UB. However, during this period, the natural vegetation (NMF) was restored in some areas, estimated at about 560 ha (3.19 of NMF area in 2000), especially from BLV, which represented about 57.23% of NMF gains.
It was argued that the administrative instability and the permanent state of change in the Ministry of Agriculture, which was reabolished in March 2000, and legal inconsistencies in the way of allocating the liabilities have contributed significantly to rising encroachments and violations on NMF land within the Al-Jabal Al-Akhdar region. In 2006, the ministerial resolution (No. 13; 2006) was enacted through which an agricultural policing body was created for the purpose of monitoring and limiting encroachment on forest land. However, the results shown in Figure 7 and Figure 9 revealed that the area of deforested land, which has been converted into other land uses, increased from 3238 ha (216.87 ha.year−1) through the period 1985–2000 to 3350 ha (335 ha.year−1) through the period 2000–2010, which suggests that those employed for the purpose of forest protection were incapable of executing their work properly. Such incapability could be due to the lack of financial and technical support. Moreover, according to many local residents, deforestation was often carried out within private property in the cover of the night where agricultural police control is absent.
During the second period, each of the OR and IC classes increased by 1214 ha, with an annual rate of 121 ha.year−1 (Table 5). The results in Figure 9 illustrate that, between 2000 and 2010, there was no change in about 6263 ha (63.44%) of the area of OR class whereas about 2396 ha (27.67%) was converted to other land uses, especially to IC class which extended over an area of 1687 ha (70.41% of the OR loss). However, OR in 2010 gained about 3610 ha (36.56% of OR area in 2010). Much of the OR gains were obtained from clearance of NMF land and conversion of IC areas, each accounting for 42% of the OR gains. About 1357 ha (50.37%) of IC area in 2000 did not change during the 10 years, whereas about 1735 ha (49.63%) was converted to other land uses in 2010. Most of the lost area of IC was converted to OR, which represented 88.93% of IC loss. On the other hand, additional areas of about 2949 ha have been converted and cultivated for IC within the period from 2000 to 2010. Most of the IC gains were obtained from the conversion of the OR and NMF and represent about 57.21% and 41.13% of IC gains, respectively.
Population growth and the consequent increase in food demand encouraged farmers in the study area to extend their cultivated areas through the clearance of more forests in order to benefit from the increased profits by marketing the agricultural produce in neighboring towns and cities as well as in the remote areas in the west of the country. Drilling more underground wells by the local population in the study area, either at their own expense or through state support in form of agricultural and pastoral loans, has greatly augmented the rate of deforestation and land conversion for irrigated agriculture.
Classification results shown in Table 5 reveal that the annual rate of urban expansion has doubled during the period 2000–2010 compared to the period 1985–2000, where it increased from 20 ha.year−1 in the first period to 41 ha.year−1 in the second period. The area of UB increased from 2020 ha (5.61%) in 2000 to 2430 ha (6.75%) in 2010. Figure 9 shows that most of the UB gains were obtained from converting OR land which represented about 48.43% of the UB gains, followed by clearance of NMF land, which represented about 32.49% of the UB gains.
The increase in urban expansion might be attributed to population growth within the region of Al-Jabal Al-Akhdar through the period 1995–2006 (Figure 8), which required constructing more housing units to accommodate the growing numbers of families. On the other hand, the period 2000–2010 experienced a recovery in the country’s economic situation. The housing crisis was beginning to ease, especially after lifting economic sanctions imposed against Libya in 2003 after which oil incomes dramatically increased. As a result of this positive event, significant economic and political changes were made in the country. Thus, many residential projects were constructed and more housing loans were granted in an attempt to solve the housing crisis. This progress was accompanied by the expansion of construction of networks of paved and unpaved roads across forests over mountains and valleys of the Al-Jabal Al-Akhdar region as in all areas of the country. However, although urban expansion and road construction are extremely crucial for national development with the growing population, they are critical factors that significantly affect the rate of deforestation and decline of agricultural land as they facilitate the access to more land for forests clearance, construction, and exploitation for different purposes [66].
The area of BLV in the period between 2000 and 2010, unlike in the previous period (1985–2000), decreased by 138 ha with an annual rate of 9.52% (Table 5). Although the BLV in the second period gained about 845 ha, mostly from the clearance of NMF land and abandonment of OR land, which represent 50.94% and 38.76% of the BLV gains, respectively, there is about 992 ha of BLV that was converted in 2010 to other LULC types. As seen in Figure 9, during the period 2000–2010, an area of 504 ha of BLV land was exploited for OR land use which represents 50.81% of the BLV loss. NMF cover was restored in some areas (about 372 ha) which were classified as BLV in 2000, representing 37.50% of the BLV loss. The data in Figure 7 and Figure 9 indicate that the rate of exploitation of BLV land by conversion into OR increased in the period 2000–2010 compared to the past (1985–2000), where the first period witnessed a conversion of 208 ha (about 14 ha. year−1) of BLV land to be used for OR land use while in the second period more BLV land, estimated at 504 ha (about 51 ha. year−1), was converted into OR. Moreover, the rate of change from NMF to BLV increased from about 34.16 ha. year−1 through the first period to about 50 ha. year−1 through the second period, indicating the inability of the agricultural police to effectively perform its function to protect forests and to limit clearance activities. The anthropogenic violations of any kind against these forests, at whatever size, definitely represent a real threat to the natural forests in the Al-Jabal Al-Akhdar region.

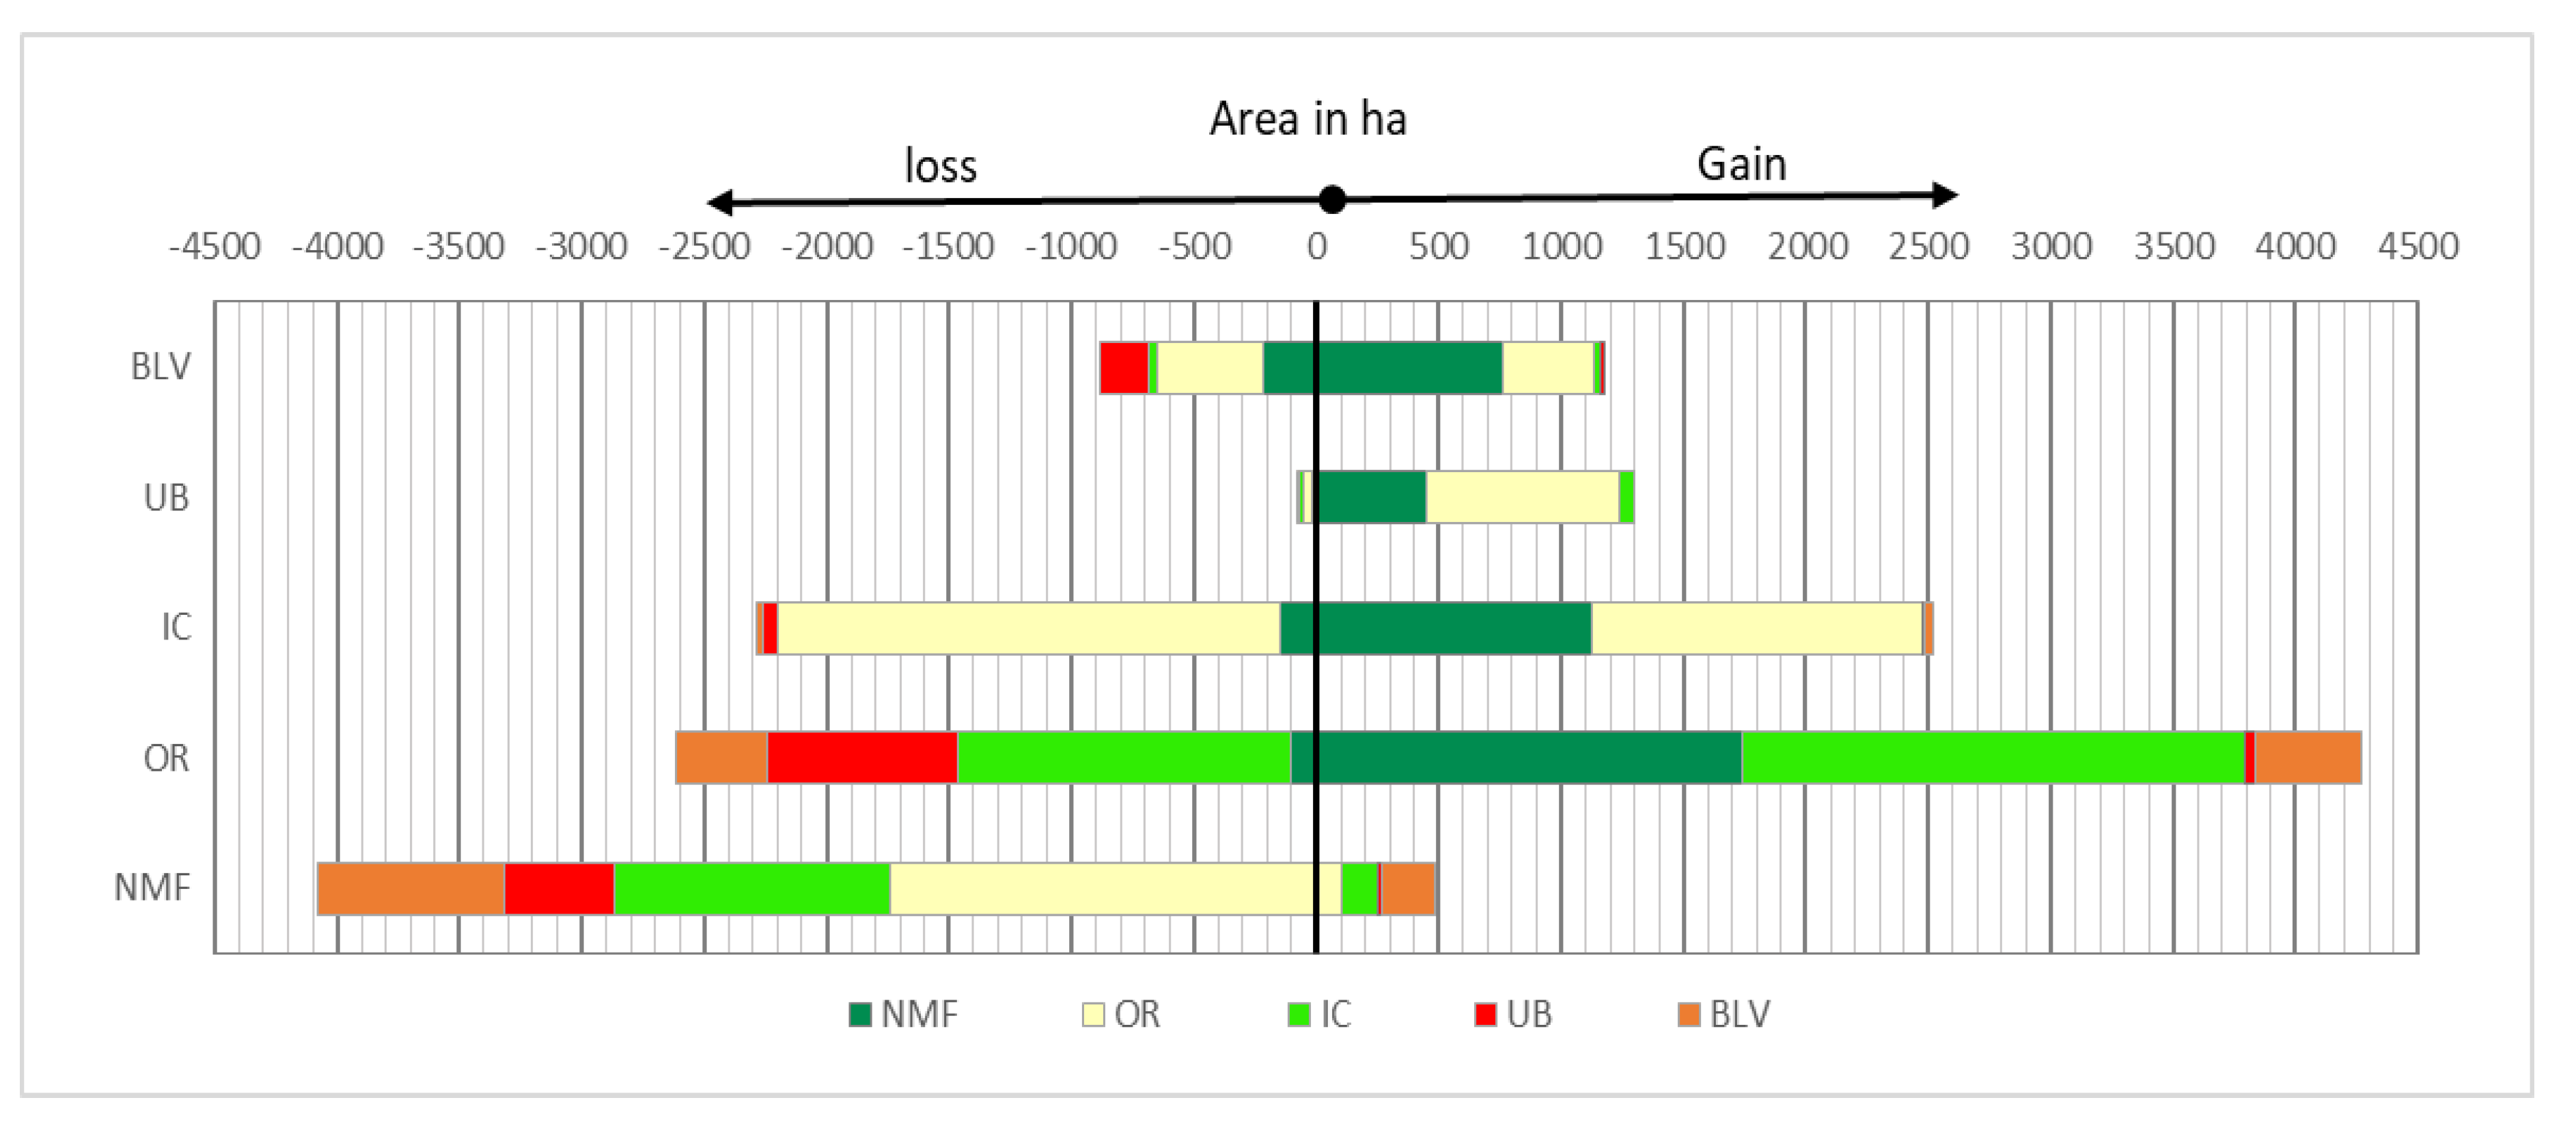
3.3.3. LULC Change between 2010 and 2017

The results shown in Table 6 illustrate that, during this period, more changes occurred in the areas of LULC types within the study area. After the Libyan uprising in 2011, the natural vegetation cover in the study area was subjected to massive deforestation in the forms of forest cutting, frequent fires, and overgrazing. In general, the natural forest in Al-Jabal Al-Akhdar continues to be deteriorated in terms of quality and density in the absence of proper management and silvicultural activities [67].
According to the supervised classification results shown in Table 6, the area of NMF decreased from 17,685 ha (49.11%) in 2010 to 14,091 ha (39.13%) in 2017. The decline rate of NMF in the study area between 2010 and 2017 was estimated at 513 ha. year−1, twice the rate recorded in the period 2000–2010 and about three times the rate recorded in the period 1985 and 2010, which were estimated at 270 and 182 ha.year−1, respectively (Table 4 and Table 5). The results in Figure 10 show that, from 17,685 ha of NMF land in 2010, about 13,608 ha (76.95%) remained with no change while 4077 ha (23.05%) was deforested for different purposes in the following seven years. Data show that about 1742 ha of NMF land was converted into OR and represents the majority of NMF net loss (42.73%) followed by the conversion to IC, which gained about 1122 ha in deforested lands, representing 27.52% of the net loss of NMF land. Also, about 763 ha (18.71% of NMF loss) changed to BLV land while about 450 ha (11.04% of NMF loss) was exploited for UB. On the other hand, some gains in NMF were recorded within the period 2010–2017, where the forest was restored in 483 ha (2.73% of NMF area in 2010), particularly on BLV land, which represents about 44.51% of NMF gains.
Comparing the results of this study to those obtained from Achour et al. [68] in the northern part of Tunisia to evaluate forest cover 4 years before and after the 2011 Tunisian popular uprising, it was found that the current deforestation rate in our study area is much higher than that reported in Tunisia. As shown in Table 6, the annual deforestation rate in our study area that was covered by natural forest on about 17,685 ha of its area before the Libyan uprising in 2011 was estimated at 513 ha.year−1 between 2010 and 2017, representing a loss of 2.9% of forest area per year. The annual rate of forest loss in the north of Tunisia that was covered by forest in 72,000 ha before the revolution in 2011 was estimated at about 2245 ha.year−1 during the period 2010–2014, representing a loss of 0.31% of forest area per year [68]. However, the deforestation rate in our study area appears to be lower compared to that documented in the Algarabulli district in the northwest part of Libya [16], where 3883 ha of forest was lost through the period 2010–2013, with an annual rate of decline estimated at 1295 ha.year−1 (16.2% per year). This difference can be attributed to the fact that most of the forests cover in the Algarabulli district are planted forests located in accessible sites near residential communities with a high population unlike the natural forest of Al-Jabal Al-Akhdar that is largely situated in hard-to-reach areas such as steep slopes and valley bottoms. Being located away from main roads and residential communities gives the forest greater protection against human encroachments. However, deforestation rate in the study area still remains at a significant rate, given the fact that the country is very lightly forested, with forest only covering about 217,000 ha [7] approximately representing 0.1% of the country’s total area and mostly situated in the region of Al-Jabal Al-Akhdar, which comprises 90% of the Libyan natural forests. Indeed, if the present trend of deforestation continues, more than 50% of the natural forest cover in the study area will be lost over the next 15 years. Therefore, deforestation in Al-Jabal Al-Akhdar and Libya in general presents a huge environmental challenge since the governments after the revolution were unable to act effectively to protect country’s natural resources including natural forests.
It should be recalled that the deforestation during the third period was induced by some factors entirely unlike those during the previous periods from 1985 to 2010. Presently, increased deforestation might be attributed to a range of factors including the total breakdown of the Al-Qaddafi regime in 2011 and the accompanying chaos and spread of weapons, the inability of subsequent governments to prevent forest clearance, the lack of housing projects, and the significant increase in land price. Some citizens exploited the fall of the government regime, the cessation of regulatory agencies, and the complete absence of agricultural policing to clear more forest land for agricultural expansion or to sell cleared land building houses or construction of holiday homes and resorts.
The supervised classification analysis indicated an increase in the area of agricultural land in the study area during the third period (2010–2017), which was estimated at 1883 ha, where the area of agricultural land use increased from 14,583 ha (40.50% of total area) in 2010 to 15,466 ha (44.72% of total area) in 2017 (Table 6). The expansion of agriculture due to increased demand for food is one of the major factors that contributed to the reduction of the natural vegetation cover area, where more than 70% of deforested areas in the study area between 2010 and 2017 was used for cultivating irrigated and rainfed crops. This is consistent with the report by Kissinger et al. [69] which identified agriculture as being responsible for roughly 80% of worldwide deforestation. The report rated commercial agriculture and subsistence agriculture as the main direct drivers of deforestation in Africa and both account for one-third of all deforestation, while in Latin America, two-thirds of forest degradation is a result of the expansion of commercial agriculture. Although agriculture is important in the development of any nation, it has some undesirable impacts on natural environments. As the area of agricultural land grows and increases, the area of natural vegetation declines and the soil is exposed to erosion and deterioration of its physical and chemical properties.
The results shown in Table 6 illustrate that the area of OR land increased from 9873 ha (27.42%) in 2010 to 11,521 ha (about 32%) in 2017 by an annual rate of 235 ha.year−1 (2.38%), whereas the area of IC increased in the same period from 4710 ha to 4954 ha, registering a lower annual rate of change estimated at 34 ha.year−1. Data presented in Figure 10 show that about 7254 ha (73.47%) of OR land in 2010 did not change in the ensuing 7 years, whereas about 2619 ha (26.53%) was changed to other land uses. About 51.78% of OR loss was converted to IC land use, while 28.56% was altered to UB and 14.20% was altered to BLV. However, during the 7 years between 2010 and 2017, OR land use gained about 4267 ha, representing 37.04% of its area in 2017. Most gains of OR were obtained from converting IC and NMF land, which represented 48% and 40.83% of OR gains, respectively. The change matrix in Figure 10 also shows that about 51.50% of IC land in 2010 did not change in 2017 whereas the remaining was converted into other agricultural and even nonagricultural land uses. Most the lost area of IC land was converted to OR, which represents 89.67% of IC net loss. IC land in the third period gained 2519 ha mostly from the conversion of OR land, which contributed about 1356 ha (53.83% of IC gains), in addition to clearance of about 1122 ha NMF land (44.54% of IC gains). The gained area of IC in this period was only 10% greater than the area was lost (2284 ha), which is different from the first and second periods when IC gains were 62% and 70% higher than losses, respectively. From Figure 10, it can be also seen that the conversion from IC to OR during the recent period (2010–2017) was greater than conversion from OR to IC by about 50%, unlike the previous periods when both conversions were similar to some extent. The annual rate of increase in the area of IC land use, during the period from 2010 to 2017, which was estimated at 34 ha.year−1, considers the lowest rate of this land use when compared to previous periods, where the annual rate of increase reached 55 ha.year−1 during the period 1985–2000 and increased to 121 ha.year−1 during the period 2000–2010 (Table 4, Table 5 and Table 6). Several factors have contributed to reducing the annual rate of increase in the total area of IC land in the study area during the period 2010–2017. The high increase in agricultural input cost, such as fertilizers, pesticides, seeds, and equipment in addition to increasing labor wages and shrinking of skilled workforce, which often is nonlocal, were the main factors that have driven farmers to abandon the cultivation of irrigated crops and to turn to other activities.
During the third period, UB extended from 6.75% to 10.70% of the total land use and had an annual rate of increase of 8.36%, which was much higher compared to the previous periods. The UB area increased from 2430 ha in 2010 to 3852 ha in 2017, achieving a total increase of 1422 ha and representing about 58.52% of the initial area. The annual rate of increase during this period which was estimated at 203 ha.year−1 (Table 6) is about 10 times the annual rate recorded between 1985 and 2000 as 20 ha.year−1 (Table 4) and about 5 times the rate achieved during the second period from 2000 to 2010 and estimated at 41 ha.year−1 (Table 5).
Results in Table 6 shows that the urban expansion at the expense of agricultural land during the third period saw a significant increase comparing the first and second periods, particularly around the city of Al-Bayda. An area of about 845 ha of land which was previously classified as agricultural land (OR + IC) was converted during the 7 years between 2010 and 2017 into UB, which approximate twice the converted agricultural area in 25 years between 1985 and 2010. It also can be deduced that conversion from NMF into UB during the third period (450 ha) equals twice the converted area in the first and second periods combined (218 ha). Additionally, exploitation of BLV for urban expansion was doubled during the third period compared to the previous periods, where about 206 ha of BLV was converted into UB between 2010 and 2017 compared to the 107 ha converted between 1985 and 2000.
Several factors were responsible for the increase in the urban expansion in the Al-Jabal Al-Akhdar region. The most important factors are administrative causes that are related to the state policy, the weak application of legislation, and urban laws relating to the protection of agricultural and forest lands. Furthermore, population concentration in cities is not in tandem with their needs for residential schemes due to poor planning and organization which have contributed to the emergence of social and financial motivation for unplanned urban sprawl represented in the dominance of some tribes on large areas of land who capitalized on the housing deficit and the lack of new housing projects to sell land as residential plots without approval from the state. On the other hand, after the fall of the previous political regime in 2011, some people misappropriated state funds and bought lands in or around cities and then constructed residential or holiday houses as a means of money laundering. Additionally, some people from outside the district, particularly displaced citizens and migrants from some Arabic countries who left their homelands fleeing the menace of ongoing wars and armed conflicts, have shown interest in acquiring land and building houses to live in the study area. These people perceive the study area as comparatively safer than other regions in Libya, so land ownership is regarded as a means of attaining stability.
Additionally, because the region of Al-Jabal Al-Akhdar includes the finest places for tourism and recreation in Libya, the demand for accommodations for tourists and visitors has increased, which encouraged some citizens to establish more holiday homes and resorts in the absence of government control and stringent regulations.
The results in Table 6 illustrate that BLV land during the third period increased by 289 ha, achieving a positive annual rate of change of 41 ha.year−1 (3.15%), which is greater when compared to the previous periods. The results shown in Figure 10 shows that clearance of NMF land and abandonment of OR land were the main contributors to the increase in the area of BLV land, where their contributions were estimated at 763 ha (64.88% of BLV gains) and 372 ha (31.63% of BLV gains), respectively.
On the other hand, forest fires were a serious occurrence that led to the increase in the area of BLV land and to the decline of natural vegetation. Government reports indicated a significant increase in forest fires in Libya after 2011. In May 2013, after a dry season with severe shortage of rainfall and severe heat wave, a total of 5924 ha was destroyed in Libya due to more than seven fires of at least 40 ha, most of which occurred in the Al-Jabal Al-Akhdar region, which includes a single very large fire of more than 3300 ha [70]. Some parts of our study area, especially the Lussaitah area, were affected by these fires. In 2017, more land was affected by indiscriminate fires that occurred simultaneously and stripped considerable areas of their natural vegetation cover. To this day, forest fires are still a real threat to the natural forests in the Al-Jabal Al-Akhdar region, where fires occur every year at several locations due to various reasons.
The increased demand for firewood during the years following the Libyan uprising as a result of the wars which broke out in some Libyan cities was another factor that contributed to the decline in forest cover and to the increase in BLV. A severe shortage of cooking gas and kerosene in addition to electricity outage were common during the period after 2011. This has forced citizens to seek alternatives for heating and cooking; regrettably, they found cutting forest trees to be the easier option for gathering firewood and for producing charcoal for use or selling in local markets. Cutting forest trees is a negative phenomenon that can lead to stripping plenty of spaces of their natural vegetation cover. In fact, in such a semiarid climate, the loss of natural trees is difficult to recover due to the inability of the existing tree species in the region to regenerate naturally in addition to other limiting factors such as insufficient moisture due to frequent droughts and soil shallowness resulting from increased erosion rate after removal of protective vegetation.

4. Conclusion

Remote sensing is an effective tool for mapping natural resources at a regional level. The outcomes of the investigation enumerated in this research highlight the importance of satellite digital image processing with the aid of GIS technology in mapping and detecting LULC changes. Maximum likelihood supervised classification of Landsat TM5, ETM+7, and OLI8 imagery and post-classification comparison approach can be used to predict and obtain fairly accurate maps of LULC changes. The overall accuracy and kappa coefficient values of the LULC classifications achieved in this research is encouraging. It was generally observed that there was a significant decline in natural Mediterranean forest (NMF) and a corresponding increase in other land uses such as orchards and rain-fed agriculture (OR), irrigated crops (IC), urban and built-up lands (UB), and bare and low vegetation (BLV). The changes observed were indicative of a decrease in the expanse of NMF land, which lost about 39% of its total area over the 32 years, and the highest deforestation rate was registered in the third period (2010–2017). The high deforestation was generally a result of citizen exploitation of the weakness of the state’s institutions post 2011 revolution in addition to the frequency of forest fires. Most of the changed area of NMF were converted for agricultural land use. Land under the OR class increased by about 55% and achieved a greater rate of increase during the third period, whereas the land under the IC class increased by about 85% with a higher rate of increase achieved between 2000 and 2010, and the lowest rate was recorded during the third period from 2010 to 2017. The urban expansion in the study area was mostly at the expense of forest and agricultural lands. The annual rate of urbanization during the third period was approximately 10 and 5 times more than those recorded in the first period (1985–2000) and second period (2000–2010), respectively. Our results indicate an unstable trend of BLV land which generally increased by about 50%.
Indeed, if the present trend of deforestation continues, the forest in the study area will lose more than 50% of its current natural forest cover over the next 15 years. Deforestation in the study area and Al-Jabal Al-Akhdar in general is an important environmental challenge.

Author Contributions

Conceptualization, J.S.A. and S.K.B.; methodology, J.S.A. and S.K.B.; software, J.S.A.; data collection, J.S.A.; analysis and validation, J.S.A. and S.K.B.; writing—review and editing, J.S.A. and S.K.B.; supervision, S.K.B., A.H.M.H. and C.T.B.S. All authors have read and agreed to the published version of the manuscript.

Funding

This research was funded by the Ministry of Education, Libya, grant number 293.

Conflicts of Interest

The authors declare no conflict of interest.

References

  1. Mas, J.-F. Monitoring land-cover changes: A comparison of change detection techniques. Int. J. Remote Sens. 1999, 20, 139–152. [Google Scholar] [CrossRef]
  2. Omar, P.J.; Gupta, N.; Tripathi, R.P.; Shekhar, S.S. A study of change in agricultural and forest land in Gwalior city using satellite imagery. S-JPSET 2017, 9, 109–112. [Google Scholar]
  3. Al-sharif, A.A.A.; Pradhan, B. Monitoring and predicting land use change in Tripoli Metropolitan City using an integrated Markov chain and cellular automata models in GIS. Arab. J. Geosci. 2014, 7, 4291–4301. [Google Scholar] [CrossRef]
  4. Ayele, G.T.; Tebeje, A.K.; Demissie, S.S.; Belete, M.A.; Jemberrie, M.A.; Teshome, W.M.; Mengistu, D.T.; Teshale, E.Z. Time series land cover mapping and change detection analysis using geographic information system and remote sensing, Northern Ethiopia. Air Soil Water Res. 2018, 11, 1–18. [Google Scholar] [CrossRef] [Green Version]
  5. Sharma, R.; Nguyen, T.T.; Grote, U. Changing consumption patterns—Drivers and the environmental impact. Sustainability 2018, 10, 4190. [Google Scholar] [CrossRef] [Green Version]
  6. Defries, R.; Hansen, A.; Turner, B.L.; Reid, R.; Liu, J. Land use change around protected areas: Management to balance human needs and ecological function. Ecol. Appl. 2007, 17, 1031–1038. [Google Scholar] [CrossRef]
  7. FAO. Global Forest Resources Assessment 2015: How are the World’s Forests Changing? 2nd ed.; Food and Agriculture Organization of the United Nations: Rome, Italy, 2016. [Google Scholar]
  8. Goll, I.I.; Nick, B.; Li, J.; McKay, J.; John, S. Analysis on the causes of deforestation and forest degradation in Liberia: Application of the DPSIR framework. Res. J. Agric. For. Sci. 2014, 2, 20–30. [Google Scholar]
  9. Rudel, T.K. Is there a forest transition? Deforestation, reforestation, and development 1. Rural Sociol. 1989, 63, 533–552. [Google Scholar] [CrossRef]
  10. Wang, C.; Gao, Q.; Wang, X.; Yu, M. Spatially differentiated trends in urbanization, agricultural land abandonment and reclamation, and woodland recovery in Northern China. Sci. Rep. 2016, 6, 37658. [Google Scholar] [CrossRef] [Green Version]
  11. Rudel, T.K.; Coomes, O.T.; Moran, E.; Achard, F.; Angelsen, A.; Xu, J.; Lambin, E. Forest transitions: Towards a global understanding of land use change. Global. Environ. Chang. 2005, 15, 23–31. [Google Scholar] [CrossRef]
  12. Rudel, T.; Fu, C. A requiem for the southern regionalists: Reforestation in the South and the uses of regional social science. Soc. Sci. Q. 1996, 77, 804–820. [Google Scholar]
  13. Marchak, M.P. Logging the Globe. Montreal and Kingston; Mcgill-Queens University Press: Montreal, QC, Canada, 1995. [Google Scholar]
  14. Mahmood-Misrati, A.A. Land conversion to urban use: Its impact and character in Libya. Ekistics 1983, 50, 183–194. [Google Scholar]
  15. Saad, A.; Shariff, N.; Gairola, S. Nature and causes of land degradation and desertification in Libya: Need for sustainable land management. Afr. J. Biotechnol. 2013, 10, 13680–13687. [Google Scholar]
  16. Alsoul, A.H.K. Deforestation in Jefara Plain, Libya: Socio-Economic and Policy Drivers (Algarabulli District Case Study). Ph.D. Thesis, Bangor University, Bangor, UK, 2015. [Google Scholar]
  17. Ahwaidi, G.M.A. Factors Affecting Recent Vegetation Change in North-East Libya. Ph.D. Thesis, University of Salford, Salford, UK, 2017. [Google Scholar]
  18. Basim, Y.M.; Sanaa, A.A. Application of Remote Sensing and GIS In Change Detection in Green Mountian Forest, Libya. In Proceedings of the fifth Scientific Conference of Environment and Sustainable Development in the Arid and Semi-Arid Regions (ICESD), Ajdabiya, Libya, 23–25 July 2018; University of Ajdabiya: Ajdabiya, Libya, 2018; pp. 247–258. [Google Scholar]
  19. OMU. Studying and Evaluating the Natural Vegetation in Al Jabal Al Akhdar Area; Omar Al-Mukhtar University: Al Bayda, Libya, 2005. (In Arabic) [Google Scholar]
  20. Suleiman, B.M.; Elmehdy, S.I.; Mohamed, M.; Hamad, S.; Alhendaw, R. Infrared Spectral Measurements in Remotes Sensing and GIS to asses factors controlling Flora diseases in Jabal Al Akhdar, Libya. In Latest Trends in Energy, Environment and Development; Ceron Breton, J.G., Quartieri, J., Guida, M., Guida, D., Guarnaccia, C., Eds.; WSEAS Press: Salerno, Italy, 2014; pp. 385–392. [Google Scholar]
  21. Abdlrahman, A.Y.A. Insect Herbivores and Neighbourhood Effects in Plant Communities of Al Jabal Al Akhdar, Libya. Ph.D. Thesis, University of Nottingham, Nottingham, UK, 2011. [Google Scholar]
  22. Al-Zeni, A.; Bayoumi, M. The Important Local and Imported Trees and Shrubs in Al-Jabal Al-Akhdar Region, Libya; Aldar Alacademya for printing, writing, translation and publishing: Tripoli, Libya, 2006. (In Arabic) [Google Scholar]
  23. Caraveli, H. A comparative analysis on intensification and extensification in Mediterranean agriculture: Dilemmas for LFAs policy. J. Rural Stud. 2000, 16, 231–242. [Google Scholar] [CrossRef]
  24. Al-Idrissi, M.; Sbeita, A.; Jebriel, A.; Zintani, A.; Shreidi, A.; Ghawawi, H. Libya: Country report. In Proceedings of the FAO international technical conference on plant genetic resources, Leipzig, Germany, 17–23 June 1996. [Google Scholar]
  25. Mnsur, S.; Rotherham, I.D. Using TM and ETM+ data to determine land cover/land use changes in the Libyan Al-jabal Alakhdar region. Landsc. Archaeol. Ecol. End Tradit. 2010, 8, 132–138. [Google Scholar]
  26. Osei, K.N.; Osei Jnr, E.M.; Adjapong, A.S. Comparison of land cover image classification methods. J. Geomat. 2012, 6, 31–36. [Google Scholar]
  27. Zhu, Z.; Woodcock, C.E. Continuous change detection and classification of land cover using all available Landsat data. Remote Sens. Environ. 2014, 144, 152–171. [Google Scholar] [CrossRef] [Green Version]
  28. Friedl, M.A.; Sulla-Menashe, D.; Tan, B., Schneider; Schneider, A.; Ramankutty, N.; Sibley, A.; Huang, X. MODIS Collection 5 global land cover: Algorithm refinements and characterization of new datasets. Remote Sens. Environ. 2010, 114, 168–182. [Google Scholar] [CrossRef]
  29. Gong, P.; Howarth, P.J. An assessment of some factors influencing multispectral land-cover classification. Photogramm. Eng. Remote Sens. 1990, 56, 597–603. [Google Scholar]
  30. Li, C.; Wang, J.; Wang, L.; Hu, L.; Gong, P. Comparison of classification algorithms and training sample sizes in urban land classification with Landsat thematic mapper imagery. Remote Sens. 2014, 6, 964–983. [Google Scholar] [CrossRef] [Green Version]
  31. Mustafa, Y.M.; Amin, M.S.M.; Lee, T.S.; Shariff, A.R.M. Evaluation of Land Development Impact on a tropical Watershed Hydrology Using Remote Sensing and GIS. JOSH 2003, 5, 16–30. [Google Scholar]
  32. Giri, C.; Long, J.; Abbas, S.; Murali, R.M.; Qamer, F.M.; Pengra, B.; Thau, D. Distribution and dynamics of mangrove forests of South Asia. J. Environ. Manag. 2015, 148, 101–111. [Google Scholar] [CrossRef] [PubMed]
  33. Coppin, P.; Jonckheere, I.; Nackaerts, K.; Muys, B.; Lambin, E. Digital change detection methods in ecosystem monitoring: A review. Int. J. Remote Sens. 2004, 25, 1565–1596. [Google Scholar] [CrossRef]
  34. Hadjimitsis, D.G.; Papadavid, G.; Agapiou, A.; Themistocleous, K.; Hadjimitsis, M.G.; Retalis, A.; Michaelides, S.; Chrysoulakis, N.; Toulios, L.; Clayton, C.R. Atmospheric correction for satellite remotely sensed data intended for agricultural applications: Impact on vegetation indices. Nat. Hazards Earth Syst. Sci. 2010, 10, 89–95. [Google Scholar] [CrossRef] [Green Version]
  35. Chávez, P.S.J. Image-based atmospheric corrections—Revisited and improved. Photogramm. Eng. Remote Sens. 1996, 62, 1025–1036. [Google Scholar]
  36. Andrefouet, S.; Bindschadler, R.; Brown De Colstoun, E.C.; Choate, M.; Chomentowski, W.; Christopherson, J.; Doorn, B.; Hall, D.K.; Holifield, C.; Howard, S.; et al. Preliminary Assessment of the Value of Landsat 7 ETM+ Data following Scan Line Corrector Malfunction; US Geological Survey, EROS Data Center: Sioux Falls, SD, USA, 2003.
  37. Ghassemian, H. A review of remote sensing image fusion methods. Inf. Fusion 2016, 32, 75–89. [Google Scholar] [CrossRef]
  38. Gilbertson, J.K.; Kemp, J.; van Niekerk, A. Effect of pan-sharpening multi-temporal Landsat 8 imagery for crop type differentiation using different classification techniques. Comput. Electron. Agric. 2017, 134, 151–159. [Google Scholar] [CrossRef] [Green Version]
  39. Boakye, E.; Odai, S.N.; Adjei, K.A.; Annor, F.O. Landsat images for assessment of the impact of land use and land cover changes on the Barekese catchment in Ghana. Eur. J. Sci. Res. 2008, 22, 269–278. [Google Scholar]
  40. Anderson, J.R.; Hardy, E.E.; Roach, J.T.; Witmer, R.E. A Land Use and Land Cover Classification System for Use with Remote Sensor Data, 3rd ed.; US Government Printing Office: Arlington, TX, USA, 1978; Volume 964. [Google Scholar]
  41. Luo, Y.-M.; Ouyang, Y.; Zhang, R.-C.; Feng, H.-M. Multi-feature joint sparse model for the classification of mangrove remote sensing images. ISPRS Int. J. Geo Inf. 2017, 6, 177. [Google Scholar] [CrossRef] [Green Version]
  42. Krishna Bahadur, K.C. Improving Landsat and IRS image classification: Evaluation of unsupervised and supervised classification through band ratios and dem in a mountainous landscape in Nepal. Remote Sens. 2009, 1, 1257–1272. [Google Scholar] [CrossRef] [Green Version]
  43. Mukherjee, S.; Mukherjee, P. Assessment and comparison of classification techniques for forest inventory estimation: A case study using IRS-ID imagery. Int. J. Geoinformatics 2009, 5, 63–73. [Google Scholar]
  44. Peacock, R. Accuracy Assessment of Supervised and Unsupervised Classification Using Landsat Imagery of Little Rock, Arkansas. Master’s Thesis, Northwest Missouri State University, Maryville, MO, USA, 2014. [Google Scholar]
  45. Soni, S.K. Crop Area Estimation for Bundi Tahsil of Rajasthan using Remote Sensing and GIS Technique. In Proceedings of the Geospatial World Forum, Hyderabad, India, 18–21 January 2011. [Google Scholar]
  46. Bolstad, P.; Lillesand, T.M. Rapid maximum likelihood classification. Photogramm. Eng. Remote Sens. 1991, 571, 67–74. [Google Scholar]
  47. Islam, K.; Jashimuddin, M.; Nath, B.; Nath, T.K. Land use classification and change detection by using multi-temporal remotely sensed imagery: The case of Chunati wildlife sanctuary, Bangladesh. Egypt. J. Remote Sens. Space Sci. 2018, 21, 37–47. [Google Scholar] [CrossRef]
  48. Ren, P.; Zhang, X.; Liang, H.; Meng, Q. Assessing the Impact of Land Cover Changes on Surface Urban Heat Islands with High-Spatial-Resolution Imagery on a Local Scale: Workflow and Case Study. Sustainability 2019, 11, 5188. [Google Scholar] [CrossRef] [Green Version]
  49. Congalton, R.G. A review of assessing the accuracy of classifications of remotely sensed data. Remote Sens. Environ. 1991, 37, 35–46. [Google Scholar] [CrossRef]
  50. Lillesand, T.M.; Kiefer, R.; Chipman, J. Remote Sensing and Image Interpretation, 6th ed.; John Wiley & Sons: New York, NJ, USA, 2008. [Google Scholar]
  51. Fleiss, J.L.; Levin, B.; Paik, M.C. The Measurement of Interrater Agreement, in Statistical Methods for Rates and Proportions. In Statistical Methods for Rates and Proportions; John Wiley & Sons Inc.: Hoboken, NJ, USA, 2003; pp. 598–626. [Google Scholar]
  52. Singh, A. Digital change detection techniques using remotely-sensed data. Int. J. Remote Sens. 1989, 10, 989–1003. [Google Scholar] [CrossRef] [Green Version]
  53. Gallego, F.J. Remote sensing and land cover area estimation. Int. J. Remote Sens. 2004, 25, 3019–3047. [Google Scholar] [CrossRef]
  54. Macleod, R.D.; Congalton, R.G. Quantitative comparison of change-detection algorithms for monitoring eelgrass from remotely sensed data. Photogramm. Eng. Remote Sens. 1998, 64, 207–216. [Google Scholar]
  55. Lu, D.; Mausel, P.; Brondízio, E.; Moran, E. Change detection techniques. Int. J. Remote Sens. 2004, 25, 2365–2401. [Google Scholar] [CrossRef]
  56. Foody, G.M. Status of land cover classification accuracy assessment. Remote Sens. Environ. 2002, 80, 185–201. [Google Scholar] [CrossRef]
  57. El-Hattab, M.M. Applying post classification change detection technique to monitor an Egyptian coastal zone (Abu Qir Bay). Egypt. J. Remote Sens. Space Sci. 2016, 19, 23–36. [Google Scholar] [CrossRef] [Green Version]
  58. Ukor Chioma, D.; John, O.; Alaga, A.T. Analysis of Land Use Land Cover Change in Ikeja, Lagose State. Nigeria Using Remote Sensing and GIS Techniques. Int. J. Sci. Technol. 2016, 5, 462–472. [Google Scholar]
  59. Jensen, J.R. Introductory Digital Image Processing: A Remote Sensing Perspective, 3rd ed.; Prentice Hall: Upper Saddle River, NJ, USA, 2005. [Google Scholar]
  60. Rawat, J.S.; Kumar, M. Monitoring land use/cover change using remote sensing and GIS techniques: A case study of Hawalbagh block, district Almora, Uttarakhand, India. Egypt. J. Remote Sens. Space Sci. 2015, 18, 77–84. [Google Scholar] [CrossRef] [Green Version]
  61. Butt, A.; Shabbir, R.; Ahmad, S.S.; Aziz, N. Land use change mapping and analysis using Remote Sensing and GIS: A case study of Simly watershed, Islamabad, Pakistan. Egypt. J. Remote Sens. Space Sci. 2015, 18, 251–259. [Google Scholar] [CrossRef] [Green Version]
  62. Tena, T.M.; Mwaanga, P.; Nguvulu, A. Impact of Land Use/Land Cover Change on Hydrological Components in Chongwe River Catchment. Sustainability 2019, 11, 6415. [Google Scholar] [CrossRef] [Green Version]
  63. Matlhodi, B.; Kenabatho, P.K.; Parida, B.P.; Maphanyane, J.G. Evaluating Land Use and Land Cover Change in the Gaborone Dam Catchment, Botswana, from 1984–2015 Using GIS and Remote Sensing. Sustainability 2019, 11, 5174. [Google Scholar] [CrossRef] [Green Version]
  64. Eldiabani, G.; Hale, W.; Chem, C.H. The effect of forest fires on physical properties and magnetic susceptibility of semi-arid soils in northeastern, Libya. Int. J. Environ. Ecol. Eng. 2014, 8, 54–60. [Google Scholar]
  65. Bureau of Statistics and Census Libya. Available online: http://www.bsc.ly/ (accessed on 15 June 2019).
  66. Portnov, B.A.; Safriel, U.N. Combating desertification in the Negev: Dryland agriculture vs. dryland urbanization. J. Arid Environ. 2004, 56, 659–680. [Google Scholar]
  67. Ben-Mahmoud, K. Towards a National Strategy for the Sustainability of Natural Resources and Enhancing Food Security in Libya, 1st ed.; The National Library: Benghazi, Libya, 2013. (In Arabic) [Google Scholar]
  68. Achour, H.; Toujani, A.; Rzigui, T.; Faïz, S. Forest cover in Tunisia before and after the 2011 Tunisian revolution: A spatial analysis approach. J. Geovisualization Spat. Anal. 2018, 2, 10. [Google Scholar] [CrossRef]
  69. Kissinger, G.; Herold, M.; De Sy, V. Drivers of deforestation and forest degradation: A synthesis report for REDD+ policymakers; Lexeme Consulting: Vancouver, BC, Canada, 2012. [Google Scholar]
  70. Schmuck, G.; San-Miguel-Ayanz, J.J.; Camia, A.; Houston Durrant, T.; Boca, R.; Libertà, G.; Petroliagkis, T.; Di Leo, M.; Rodriguez-Aseretto, D.; Boccacci, F.; et al. Forest fires in Europe, Middle East and North Africa 2013. In Joint Report of JRC and Directorate-General Environment; Publications Office of the European Union: Brussels, Belgium, 2014; Volume EUR 26791. [Google Scholar]
Figure 1. Location of Al-Jabal Al-Akhdar and the study area.
Sustainability 12 04490 g001
Figure 2. Flowchart of data processing steps.
Sustainability 12 04490 g002
Figure 3. Scenes showing the result of scan line corrector (SLC) failure (LSC-Off) correction for the Landsat 7 Image acquired in 2010 (displayed in true color (RGB: 3, 2, 1)).
Sustainability 12 04490 g003
Figure 4. Classified maps of the study area based on supervised classification of 1985, 2000, 2010, and 2017 Landsat imageries.
Sustainability 12 04490 g004
Figure 5. Commission and omission errors (%) for each LULC class in classification map of 2010 and 2017.
Sustainability 12 04490 g005
Figure 6. Percentage LULC from the total area in 1985, 2000, 2010, and 2017.
Sustainability 12 04490 g006
Figure 7. Net loss and gain of each LULC class from other land uses for the period 1985–2000.
Sustainability 12 04490 g007
Figure 8. Population and growth rate in Al-Jabal Al-Akhdar for 1964–2012. Source: Prepared by the researcher based on the initial and final results of general censuses of 1964, 1973, 1984, 1995, 2006, and 2012 by Bureau of Statistics and Census, Libya [65].
Sustainability 12 04490 g008
Figure 9. Net loss and gain of each LULC class from other land uses for the period 2000–2010.
Sustainability 12 04490 g009
Figure 10. Net loss and gain of each LULC class from other land uses for the period 2010–2017.
Sustainability 12 04490 g010
Table 1. Source and characteristics of satellite imagery used in this study.
Satellite DataPath/RowImage DateNumber of BandsSpatial Resolution
L5 TM183/3720/06/1985730 m
L7 ETM+183/3720/05/2000830 m
L7 ETM+183/3705/09/2010830 m
L8 OLI/TIRS183/3711/05/20171130 m
Note: L5 TM is Landsat 5 Thematic Mapper, L7 ETM+ is Landsat 7 Enhanced Thermal Mapper Plus, L8 OLI/TIRS is Landsat 8 Operational Land Imager and Thermal Infrared Sensor.
Table 2. Definition of land use and land cover (LULC) classes of classification scheme adopted in this study.
LULCCodeDescription
Natural Mediterranean ForestNMFAreas covered by a dense evergreen natural woody vegetation known as Maquis which characterizes the Mediterranean regions, with cover reaching 70–80%, generally composed of shrubs, bushes, and trees (usually less than 6 m)
Orchards and Rain-fed AgricultureORAgricultural lands that totally depend on rainfall for growing cereal crops and some fruit crops
Irrigated CropsICAgricultural lands that depend on groundwater for irrigation, often cultivated as small fields for production of different vegetable crops
Urban and Built-up LandsUBAreas of intensive use where most land is covered with structures including residential, commercial, and industrial areas; buildings and farmhouses spread in the countryside are involved in this class
Barren and Low VegetationBLVAreas with low or no vegetation including rocky areas with thin soil layer on steep slopes or in areas of severe erosion, exposed soil resulting from overgrazing or poor cultivation practices, or construction activities and areas that have been stripped of vegetation due to deliberate or accidental fires
Table 3. Accuracy assessment for classified maps of 2010 and 2017.
YearOverall Accuracy (%)Kappa Statistic KhatMean Commission/Class (%)Mean Omission/Class (%)
2010810.7719.36 ± 12.4718.70 ±7.69
2017830.7817.81 ± 9.4817.33 ±6.13
Table 4. Comparison of areas based on the five LULC classes and annual rate of change between 1985 and 2000.
LULC Classes19852000Change between
1985–2000
Annual Rate of Change
1985–2000
Area (ha)Area (ha)Area (ha)% of initialha.year−1%
NMF23,10920,385−2724−11.79−182−0.79
OR74268659123316.60821.11
IC2679349681730.50552.03
UB1725202029517.10201.14
BLV1071145037935.39252.36
Total36,01036,010--------
Table 5. Comparison of areas based on the five land use/cover classes and annual rates of change between 2000 and 2010.
LULC Classes20002010Change between 2000–2010Annual Rate of Change 2000–2010
Area (ha)Area (ha)Area (ha)% of Initialha.year1%
NMF20,38517,685−2700−13.25−270−1.32
OR86599873121414.021211.40
IC34964710121434.731213.47
UB2020243041020.30412.03
BLV14501312−138−9.52−14−0.95
Total36,01036,010--------
Table 6. Comparison of areas based on the five land use/cover classes and annual rates of change between 2010 and 2017.
LULC Classes20102017Change between
2010–2017
Annual Rate of Change
2010–2017
Area (ha)Area (ha)Area (ha)% of initialha.year−1%
NMF17,68514,091−3594−20.32−513−2.90
OR987311,521164816.692352.38
IC471049452354.99340.71
UB24303852142258.522038.36
BLV1312160128922.03413.15
Total36,01036,010--------

