Article

Can International Trade Help Africa’s Least Developed Countries Achieve SDG-1?

by
R. Margarita Navarro-Pabsdorf
1,
Concepción Martínez-Alcalá
2 and
Encarnación Moral-Pajares
2,*
1
Department of International Economy and from Spain, University of Granada, 18071 Granada, Spain
2
Department of Economy, University of Jaén, 23071 Jaén, Spain
*
Author to whom correspondence should be addressed.
Sustainability 2020, 12(11), 4470; https://doi.org/10.3390/su12114470
Submission received: 19 April 2020 / Revised: 25 May 2020 / Accepted: 29 May 2020 / Published: 1 June 2020
(This article belongs to the Section Sustainability in Geographic Science)

Abstract

:
In order to reduce poverty and achieve Goal 1 of the 2030 Agenda for Sustainable Development, countries’ foreign trade flows must be a driving force for productive activity, as proposed by the WTO-led (World Trade Organization) Aid for Trade initiative. This work analyzes the evolution of international trade in goods and services between Africa’s Least Developed Countries and customers and suppliers from other countries between 2005 and 2015, based on the information provided by UNCTAD and the World Bank. The results confirm a greater degree of trade openness and especially an increase in service imports. Overall, the data show that the purchases made in the international market have a greater marginal effect on GDP than sales, leading to the conclusion that changes in trade policy are needed, at both international and national level. Actions should be aimed at ensuring that the growing integration of these economies in the world trade system does not result in continued deficits in the trade balance but, on the contrary, does contribute to GDP growth and poverty reduction.

1. Introduction

The 2030 Agenda for Sustainable Development, approved by the United Nations in 2015, includes as its Goal 1: “End poverty in all its forms everywhere” [1,2]. In Africa’s Least Developed Countries (LDCs), one out of every ten people survives on less than US $1.90 a day, thus living below the poverty line. Furthermore, Goal 17 in this Agenda “Partnerships for the goals”, includes three targets referring trade: 17.10: “Promote a universal, rules-based, open, non-discriminatory and equitable multilateral trading system under the World Trade Organization, including through the conclusion of negotiations under its Doha Development Agenda”; 17.11: “Significantly increase the exports of developing countries, in particular with a view to doubling the LDCs’ share of global exports by 2020”; and 17.12: “Realize timely implementation of duty-free and quota-free market access on a lasting basis for all least developed countries, consistent with World Trade Organization decisions, including by ensuring that preferential rules of origin applicable to imports from least developed countries are transparent and simple, and contribute to facilitating market access”. According to the World Trade Organization (WTO) [3], trade flows between countries have proved to be an engine of development and poverty reduction by allowing national economies to use their resources more efficiently, specializing in the goods and services they can produce most competitively. The World Bank report [4] states that the expansion of international trade flows during the 1990s and until 2007, driven by the development of Global Value Chains (GVCs), has allowed an unprecedented alignment: poor countries have grown faster and started to catch up to the richest countries, contributing to significant poverty reduction.
The analysis of the benefits generated by trade flows has long been a focus of economic research [5]. However, the statistical evidence on the relationship between international trade and economic growth is not conclusive [6]. While a large number of cross-sectional studies confirm the hypothesis that trade between countries, especially exports, is the engine of economic growth [7,8,9,10], other time-series studies for individual countries are less encouraging [11,12], as regressions differ too widely from country to country and empirical evidence about the connection between international trade and economic growth remains inconclusive. In many cases, such as [13], the capacity of traditional arguments to explain the trade flows of LDCs is limited, requiring operating models that can be applied to real cases. This paper thus attempts to contribute to the literature by studying the specific case of the African LDCs.
LDCs’ greater integration in the international trade system raises important questions about the effects on the environment and sustainability. Several papers justify the relocation of the most polluting activities to less developed countries; in this regard the Heckscher-Ohlin (H–O) model holds that advanced countries specialize in the production of sustainable goods [14], creating an ecologically unequal exchange between trade partners [15,16,17,18,19]. The WTO claims that sustainability requirements may hinder trade and be used as a protectionist tool [20]. Measures aimed at environmental protection may make it more difficult for LDC exports to access markets in countries with higher income levels and stricter rules to protect the natural environment [21]. However, strict environmental regulations to ensure sustainability may trigger innovation, encouraging companies in LDCs to adopt new production methods and generate more sustainable products and services, in accordance with trade requirements [22,23].
Between 2005 and 2015, the LDCs in continental Africa underwent a major process of integration into international trade flows. In 2005, their participation as suppliers and demanders of products and services in the world market stood at 0.51%, with this figure rising to 0.70% 10 years later, as a result of an average annual accumulated growth in their international exchanges of 8.42%, almost three percentage points over the average global growth in the international trade of goods and services. Based on the aforementioned arguments, the aim of this research is, firstly, to ascertain the sectoral and geographical features that characterize the integration process of African LDCs into the world trade system between 2005 and 2015 and, secondly, to analyze the influence of these countries’ global sales and purchases on GDP, as an indicator of economic growth and poverty reduction [24,25]. However, it should not be forgotten that poverty is a multidimensional problem whose causes differ from one country to another [26,27]. Above all, this research seeks to draw conclusions that allow the implementation of trade policy actions and strategies aimed at ensuring that trade relations with buyers and suppliers from other countries help to achieve SDG-1.
The rest of the paper is structured as follows. The second section provides a review of the literature about trade promotion in LDCs. The third section presents a descriptive analysis of the evolution of international trade in the 28 LDCs in Africa. Above all, it emphasizes the high concentration of flows in a minority of countries and the trade surplus in three specific economies: Angola and Equatorial Guinea, which are exporters of energy products, and Zambia, a supplier in the international copper trade. The rest of the countries, by contrast, recorded deficits in their foreign trade flows throughout the period. Additionally, in the fourth section, a panel data model is used to analyze how exchanges of goods and services with foreign buyers and suppliers have affected the GDP growth in these economies. Finally, the main conclusions of the study are presented in the fifth section.

2. Literature Review and Research Hypotheses

In 1971, the UN Conference on Trade and Development (UNCTAD) recognized 24 countries as LDCs. These countries had a GDP per capita of $1000 or less (in 1968 prices), a share of manufacturing in GDP of less than 10%, and an adult literacy rate of less than 20%. Every three years, the list of LDCs is reviewed and updated to add or remove countries. In 2015, there were 32 LDCs in Africa, mainly in Sub-Saharan Africa; 8 in Asia, mainly in South and South-East Asia; 7 in Oceania; and Haiti [28].
Foreign trade helps countries to make better use of their resources, by fostering productive specialization, using comparative advantages and economies of scale. It enables access to new technologies implemented in partner countries, resulting in efficiency gains [29,30,31,32,33]. When national economies participate in international trade, companies and consumers gain access to a wide range of new products at lower prices [34,35]. However, trade openness exposes national economies to foreign competition, sometimes causing the closure of local companies that are unable to compete in such a demanding environment and to take advantage of the potential benefits of specialization [36]. The H-O model predicts that resources used in companies that are forced to close will be reassigned to productive companies and sectors, but in many cases this does not happen, leading to a marked drop in production and employment [37,38]. In the short term, there is evidence of the adverse effects of trade liberalization [39].
In a world characterized by globalization and high competition, LDCs have to implement structural transformations in their economies, raise productivity levels and integrate into the world trading system. Many studies have shown the relationship between trade and economic growth [40,41,42], specifically how trade can increase economic growth [43,44]. The structure of trade is also important, as there is a difference between commodities and manufacturing [45].
Commodity exports are subject to short-term prices, demand fluctuations and intense price competition. In contrast, manufacturing is subject to significant static and dynamic economies of scale. There is often greater income flexibility for the supply of manufacturing exports than for commodity exports.
The structure of imports also matters. Imports can act as a channel for technological innovation. Such technology transfer is more important in sectors with medium productivity growth in high-income countries and less important in “traditional” sectors [46]. In addition, capital imports have been found to have specific and important growth effects [47,48,49].
In summary, a good trade policy cannot make a poor country rich, but it can provide an enabling environment for development. However, a good trade policy guarantees neither development nor private investment.
On the other hand, services play an important role as a source of export diversification and as inputs in many production processes [50,51,52]. However, assessing the importance of trade in services requires data and statistics that are rarely complete, especially for LDCs [53].
The unequal distribution of opportunities and challenges among countries involved in international trade exchanges is the reason why UNCTAD has worked since 1964 to ensure that LDCs share the benefits of a globalized economy, by providing technical analysis and support [54]. At the same time, the International Trade Centre (ITC) has been developing practical projects for micro and small businesses in developing countries to improve their competitiveness in the international market [55]. In 2011, the WTO launched the Doha Development Round or Doha Development Agenda, with the aim of implementing actions that improve the trade prospects of developing countries and, especially, LDCs [56].
The WTO-led Aid for Trade initiative encourages developing countries to realize the role that trade can play in their economic growth. In particular, this initiative seeks to mobilize resources to address trade-related restrictions identified by LDCs and to build the trade capacities needed to benefit from international trade.
The Aid for Trade initiative was created at the Hong Kong Ministerial Conference in December 2005. This initiative was designed to assist LDCs facing a range of supply-side and trade-related obstacles to their participation in international trade. It included technical assistance, infrastructure and investment in industries and sectors, all of which can help diversify exports. There was a need to mainstream trade into national development strategies, establish structures to coordinate the delivery of trade-related technical assistance and develop trade capacity.
In 2016 over 11,000 public officials as well as 5000 private sector officials in 40 LDCs were trained in trade-related areas, including trade facilitation, global value chains, trade standards and quality, enterprise development, taxation, trade policy formulation, implementation of trade remodeling, trade integration and gender mainstreaming [57].
The active involvement of LDCs in world trade, supported by international institutions such as the WTC, UNCTAD and the ITC, should be assessed in the light of the fact that, according to open economy macroeconomics [58], while exports boost GDP growth, imports reduce it. Based on the aforementioned arguments, the following hypothesis can be formulated:
Hypothesis 1.
LDCs’ exports and imports have an unequal influence on their GDP growth, which, in turn, affects the achievement of SDG-1.

3. Data and Methodology

The statistical information used in this study is gathered from the UNCTAD [59] and World Bank databases [60]. Figures for GDP, exports and imports are provided in current prices in United States dollars. Specifically, the data referring to foreign trade flows of goods and services are obtained from UNCTADSTAT [59], with the Balance of Payments (BPM6) of individual countries as the source for service exports and imports. It should be noted that the information recorded in the Balances of Payments of the countries includes only some modes of services, thereby causing a biased measurement of these transactions. Although the UNCTAD database includes information on the LDCs in continental Africa, such information is not available for all of them, with gaps for certain countries. Thus, the final sample for the panel data analysis includes data from 28 countries (LDCs-28), for the period 2005–2015. It is worth noting the following clarifications:
(a) The countries included in the analysis are Angola, Benin, Burkina Faso, Burundi, Central African Republic, Chad, the Democratic Republic of the Congo, Djibouti, Equatorial Guinea, Ethiopia, Gambia, Guinea, Guinea-Bissau, Lesotho, Liberia, Malawi, Mali, Mauritania, Mozambique, Niger, Rwanda, Senegal, Sierra Leone, Togo, Uganda, the United Republic of Tanzania, and Zambia. Three LDCs in continental Africa—Eritrea, Somalia and Southern Sudan—have been excluded from the analysis as no information is available on their exports and imports of services in the period under study.
(b) The sample contains data for 11 consecutive years, covering the period 2005–2015. The studied time period is determined by the fact that it is not possible to obtain statistics on exports and imports of services for any country prior to 2005. In addition, for certain countries, such as Chad or Equatorial Guinea, data on foreign trade in services are not available from 2015 onwards.
(c) It should be taken into account that, as established by open economy macroeconomics, exports and imports are a part of GDP and, in some cases, quite a large part; however, various studies consider exports and imports as variables that explain the evolution of GDP [61,62]. In contrast, the objective of this paper is to compare the effects associated with international purchases and sales on GDP. For this purpose, the analysis is based on panel data for the 28 selected LDCs over the period 2005–2015. The panel data allows the estimation of multiple regression coefficients, which could not be estimated with either cross-sectional data or time-series data.
This part of the research aims to quantify the effect of exports and imports of goods and services on GDP. The panel data method is chosen to capture the effects of variables that have not been measured but that may explain the variation between countries. The application of this method requires data from different individuals, countries, regions, etc., (n) collected over time (t). To ensure sufficient degrees of freedom and to avoid overidentification, it is recommendable that n > t. There are two models of panel data analysis, static models and dynamic models. Static panel data models can be estimated with fixed or random effects, depending on how the individual effects are considered, assuming, in both cases, that they are constant over time. This restriction and endogeneity problems require the use of dynamic panel data models. Dynamic models enable the inclusion of endogenous elements in the model, through instrumental variables [63,64].
Equations (1) and (2) have been specified, in which GDP is the dependent variable. The variables used in the estimation are interrelated, present endogeneity problems and spurious correlations, and are nonstationary, so we used the dynamic panel data procedure. Endogeneity is defined as the existence of correlation between the independent variable and the error term, which is related to the causal relationship between independent and dependent variables, measurement errors, autoregression with autocorrelated errors and/or the omission of relevant variables. In economic terms, it can be interpreted as the effect of the past on the present in all variables considered, or as causality [63].
To address endogeneity, instrumental variables are constructed in levels or differences, depending on the estimator used. The Arellano-Bond GMM estimator [65] uses instruments in differences. The system-GMM estimator, later developed by Arellano and Bover [66], also includes instruments in levels and makes it possible to analyze short periods of time. Roodman’s xtabond2 estimator [67,68], which is based on the same logic as the former, treats the endogeneity of the variables independently. As such, it is recommended for panels with short periods of time. All of these estimators can be used to carry out a one-step estimation if the weight matrix is homoskedastic, or a two-step estimation if it is heteroskedastic.
The model is estimated with Roodman’s xtabond2, including the correction proposed by Windmeijer [69] for the downward bias of standard errors. This estimator employs lagged values of the endogenous regressors as instrumental variables to solve the endogeneity problem, uses first differences to eliminate fixed effects, and solves autocorrelation problems by lagging the dependent variable [64,65,66,67,68,69].
Y i t = α i t + α 1 Y i t 1 + α 2 X i t + α 3 X i t 1 + ϑ i + μ t + e i t
Y i t = β i t + β 1 Y i t 1 β 2 M i t β 3 M i t 1 + ϑ i + μ t + e i t .  
Applying equations in differences
Δ Y i t = Y i t Y i t 1  
Results:
Δ Y i t = α 1 Δ Y i t 1 + α 2 Δ X i t + α 3 Δ X i t 1 + Δ μ t + Δ e i t   ( 1 )
Δ Y i t = β 1 Δ Y i t 1 β 2 Δ M i t β 3 Δ M i t 1 + Δ μ t + Δ e i t   ( 2 )
where:
Yit = GDP of country i at time t.
Yit−1 = GDP of country i at time t − 1
Xit = value of goods and services exports of country i at time t
Xit−1= value of goods and services exports of country i at time t − 1
Mit = value of goods and services imports of country i at time t
Mit−1 = value of goods and services imports of country i at time t − 1
α 1 ,   ,   α 2 ,     ,   α 3 ,   β 1 ,     β 2 , β 3   = estimated coefficients.
The transformation of the initial equation removes the constants αit and βit, which capture the unobserved effects, and ϑi, which captures time-invariant differences between countries. In this way, the dependent variable is the result of a linear combination of lagged (t − 1) and endogenous variables, including a temporal effect μ t and the eit error coefficient, that collects what regressors are not able to explain. Coefficients α 2 ,   , β 2 , allow for approximate objectivity of the influence of exports and imports on GDP, respectively.

4. Results and Discussions

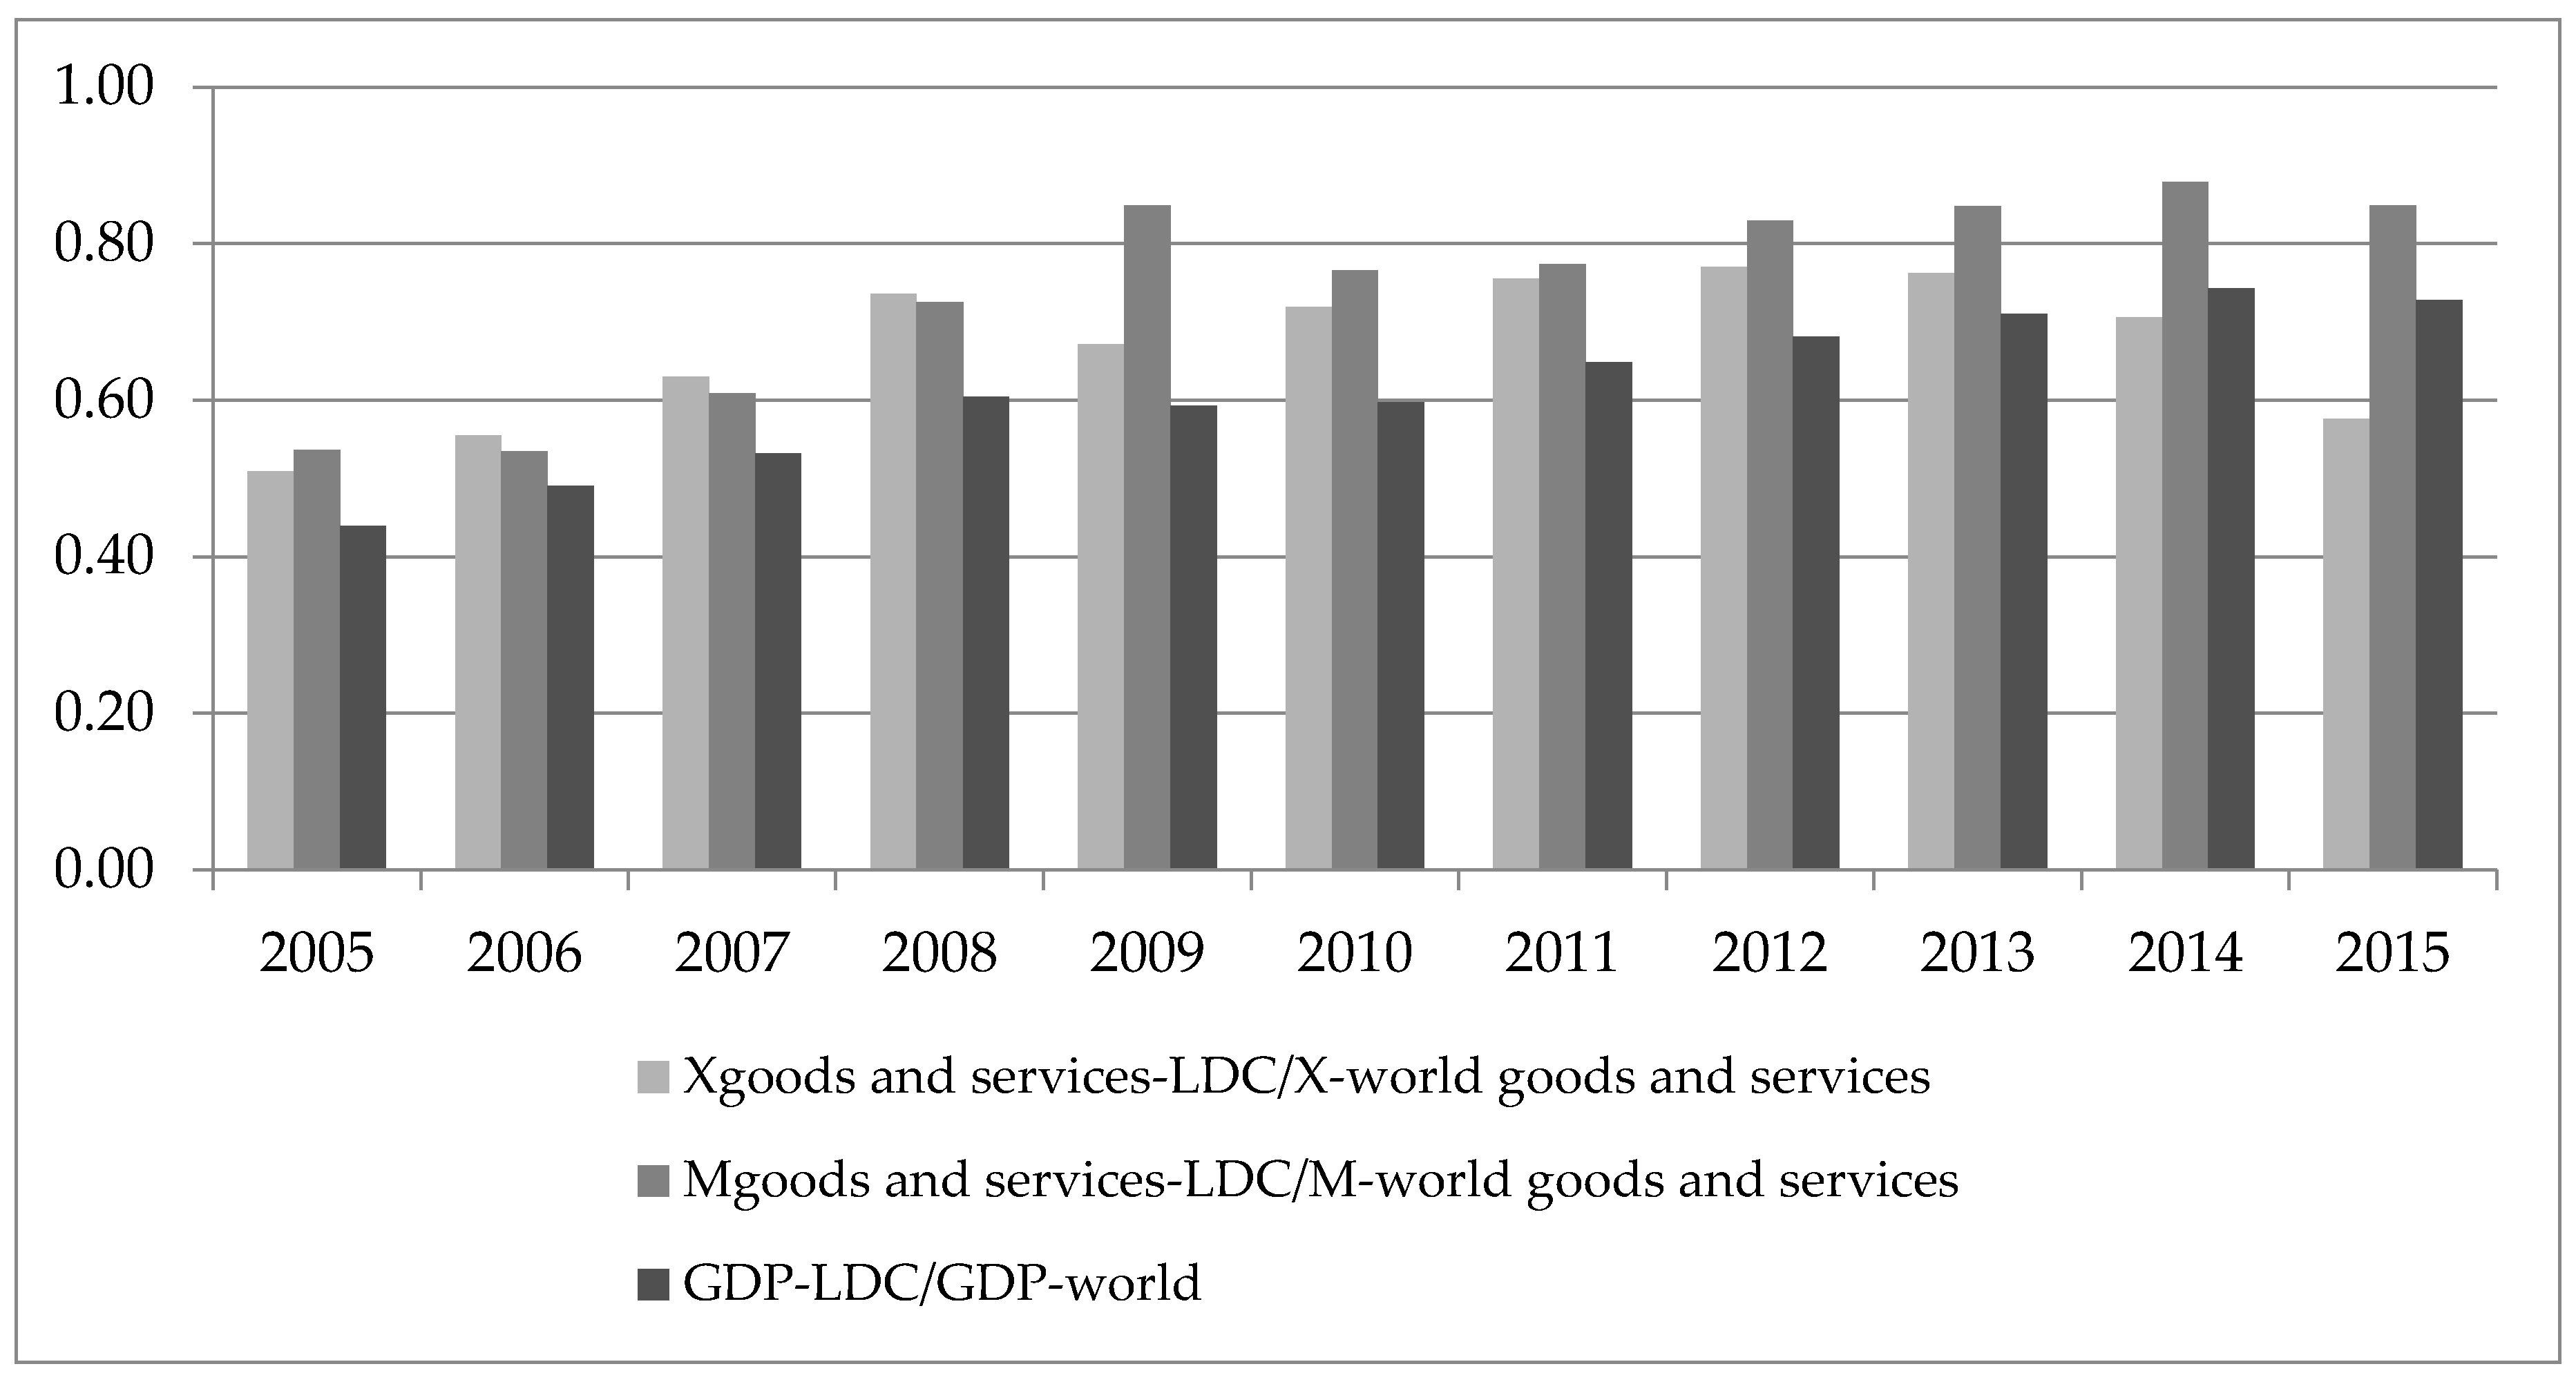
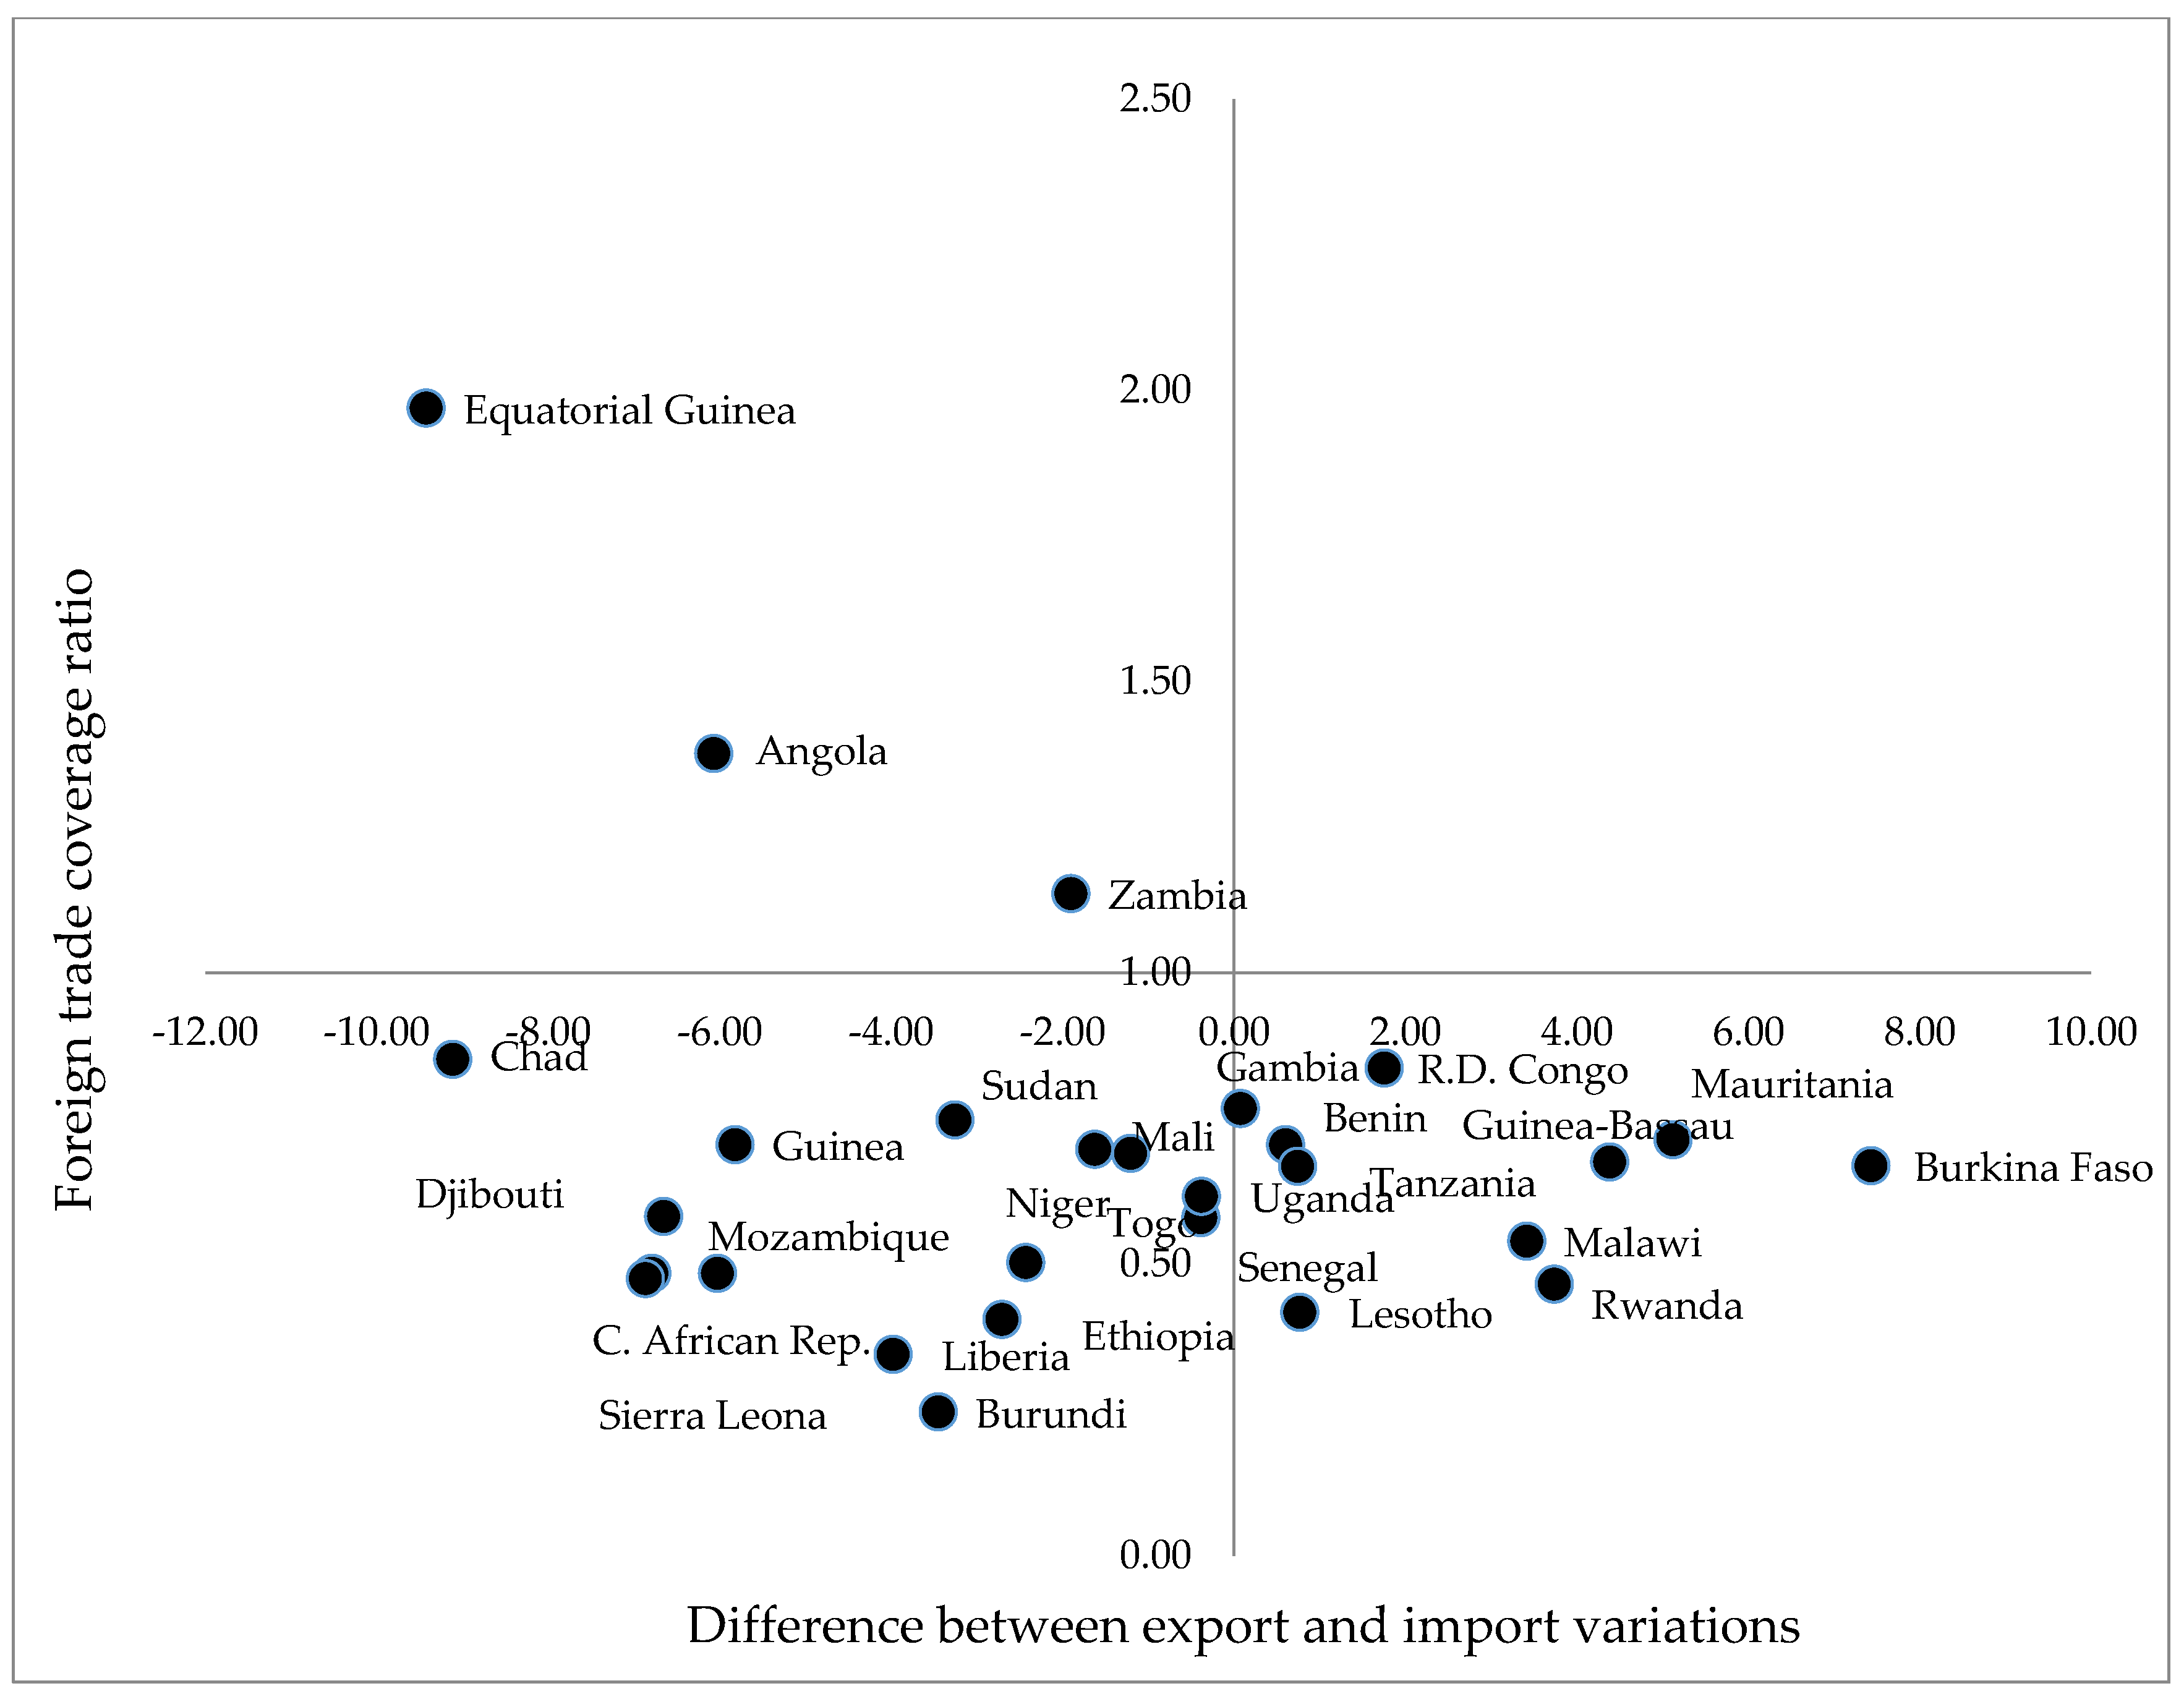
4.1. Descriptive Analysis: Evolution of African LDCs’ Trade Flows 2005–2015

During the period considered, an intense process of internationalization can be observed in these countries, especially in imports of goods and services. The volume of international trade multiplied by 2.24, with an average annual variation rate of 6.33% in exports and 10.14% in imports. At the same time, world trade registered a cumulative annual average rate of only 5.08%.
Data show that openness rate (X + M/GDP) of the countries considered in 2015 was 67.50%, more than three points higher than in 2005. The maximum value was registered in 2011, the year in which foreign trade flows from these countries reached a value greater than 72% of GDP. At the same time, the importance of this group of countries in international trade increased. In 2005, the volume of exports and imports of goods and services in the 28 countries accounted for 0.50% and 0.52% of the total world trade, respectively, while their global GDP represented 0.43%. In 2015, these percentages were 0.56% for exports, 0.83% for imports, and 0.71% as a percentage of GDP (Figure 1).
In the period analyzed, the different trend between exports and imports, with more emphasis on imports, explains the progressively increasing deficit in the balance of standardized goods and services, with a maximum value in 2015, representing more than 19% of the total volume of international flows of that year. In fact, it was only in 2006, 2007 and 2008, that the balance of goods and services in these countries was positive.
Furthermore, there is a clear specialization in the export of goods in the group. Goods represented 89.16% of the income from the goods and services balance for the period analyzed, whereas globally, these flows represented 80% of the total, according to the WTO data. However, the data in Table 1 shows a greater relative role for services imports (31.85% of imports).
Between 2005 and 2015, the value of imports of services multiplied by 2.43%, with an annual average growth of 9.29%, much higher than the worldwide average (6.24%) and slightly lower than the one for imported goods (10.52%).
With the exception of 2009 and 2015, during this period, LDCs in Africa increased imports of services. This increase was greater than that registered by the rest of the variables considered.
The growth in the imports of services generated negative signs in the balance during the entire period, in spite of the positive evolution of the exports. Likewise, it was the cause of the deficit in the balance of goods and services during a large part of this period.
In addition, trends in goods and services across the 28 countries show notable differences between countries. The concentration of foreign trade in a few countries, especially in exports and imports of commodities and manufactured products and imports of services, is noteworthy.
To confirm this concentration, the Herfindahl-Hirschman index was calculated for the four variables (goods and services exports and imports), revealing a greater degree of concentration in exports of goods and imports of services whose range is between 1 (zero concentration) and 100 (high concentration) reaching values above 40% (Table 2). According to the results, not all the countries have participated with the same intensity in the internationalization process that has taken place in the area.
Regarding the export of goods, Angola stands out, accounting for more than 40% of the African LDCs’ total, and registering a significant fall at the end of the period due to the downward trend in oil prices, the main component of its exports.
Equatorial Guinea is in the second position, with a clear concentration in the exports of crude oil and petroleum gas. Following these two countries, there is a group with values that range between 2% and 7%: Chad (3.2%), the Democratic Republic of the Congo (6.6%), Mozambique (2.5%), Senegal (2%), Sudan (5.4%), the United Republic of Tanzania (3.5%) and Zambia (5.8%). The 19 remaining countries represent the remaining 23.4% of the group’s total exports in 2015.
The United Republic of Tanzania and Ethiopia stand out with a specialization in services that represent more than 40% of their GDP (according to The World Bank data), especially in tourism. These two economies have progressively increased their importance in this regard, generating 16.8% and 15.4% of the total, respectively (Table 2). Other noteworthy countries with respect to services are Uganda (10.0%), Sudan (8.9%), Angola (6.3%), Senegal (6.0%), Zambia (4.4%) and Rwanda (3.1%). As for the rest, income from services exports in 2015 did not reach 800 million dollars, ranging between 722.6 million in Mozambique and 36.0 million in Guinea Bissau [60].
Angola is the main importer of the group, with 19.5% of total goods and 39.7% of services in the period. Countries that accounted for more than 5% in goods in 2015 were the Democratic Republic of the Congo (7.8%), Ethiopia (8.7%), Mozambique (5.1%), Sudan (7.4%), United Republic of Tanzania (7.7%) and Zambia (5.6%). Likewise, equivalent countries in the imports of services were Chad (5.0%), Ethiopia (5.3%), Mozambique (4.6%), Uganda (4.0%) and the United Republic of Tanzania (5.2%).
Figure 2 shows the countries grouped according to the results of the foreign trade coverage ratio (below or above 1) on the vertical axis and the difference between export and import variations (percentage points) on the horizontal axis. Three groups of countries are identified.
Group 1 includes economies with a foreign trade coverage ratio higher than 1 for the entire period and with higher growth in their imports than in their exports. These countries are Angola, Equatorial Guinea and Zambia. The energy resources of Angola and Equatorial Guinea, and copper, in the case of Zambia, explain their relatively advantageous position in their trade balance and the fact that their integration in world trade fostered their growth. However, the high increase in imports of goods and services, with average annual variation rates of more than 9%, negatively affected the short- and medium-term evolution of their external balance. According to the data, between 2005 and 2015, imports from Angola grew at an average annual rate of 9.50%, those of Guinea at 12.84% and those of Zambia at 13.16%.
Group 2 is composed of countries with a foreign trade coverage ratio below 1 and, in addition, with a greater growth in imports than in exports. This category includes 15 very heterogeneous countries, in terms of both their geographical size as well as their location in the African continent. These countries are Burundi, Central African Republic, Djibouti, Guinea, Chad, Ethiopia, Liberia, Mali, Mozambique, Niger, Senegal, Sierra Leone, Sudan, Togo and Uganda. For all of them, their participation in world trade has been followed by an increase in the net outflow of income, which has raised their level of foreign debt, limiting in the short term the development of their productive activity and the increase in GDP.
Group 3 is composed of economies with a negative balance of goods and services throughout the period analyzed, but with a greater increase in their exports than in their imports. There are 10 countries divided into two subgroups in this category. The first subgroup includes Benin, Gambia, Lesotho and the United Republic of Tanzania, in which exports show slightly higher growth than imports, indicating some improvement in the coverage rate. The second group is composed of Burkina Faso, the Democratic Republic of the Congo, Guinea Bissau, Malawi, Mauritania and Rwanda, all of which have increased export rates by more than one point above that of imports, enabling a reduction of their high external deficits, allowing export revenues to finance a larger volume of imports.
A fourth group would potentially include those countries in which income from exports over the entire period exceeded the income generated by imports and, furthermore, which registered greater growth in exports than in imports; however, there are no countries that fulfil these conditions.

4.2. Panel Data Analysis

Based on the statistical information provided by UNCTADSTAT and World Bank data, this paper explores the data related to the selected variables, which are detailed in Table A1 and Table A2 of the Appendix. The aim is to determine the impact of each independent or explanatory variable (exports and imports) on the dependent or explained variable (GDP) for the selected 28 countries during the 11 years under study. The combination of several variables measured for the same countries at different moments in time points to the use of panel data techniques [69], a combination of cross-sectional and time-series analysis, considering specific units and allowing observations to be monitored over time, while controlling unobservable individual heterogeneity [68].
The main results of the proposed models estimated with the xtabond2-GMM estimator are shown in Table 3 and Table 4. The validity of the instruments can be confirmed by checking that there is no second-order serial autocorrelation of the errors in the equation of first differences [66]. To this end, the Arellano-Bond AR(2) test presents values of 0.135 and 0.330 for models (1) and (2), respectively, justifying the suitability of the GMM by not rejecting the null hypothesis. Likewise, the proposed models pass the Hansen test of overidentifying restrictions, since the Hansen test yields values of 0.128 in model (1) and 0.416 in (2). The Sargan test is not applicable to estimations with two-step estimators. This data confirms that the model is not overidentified. According to the tests performed, time variables are included, while the effects varying by country disappear [68].
The estimation of the basic specification for the case of exports as an independent and endogenous variable, as well as for imports, support the initial hypothesis. Exports show a highly significant and positive relationship (coefficient = 1.294 ***) with the dependent variable, as has been found in other studies [31,32,33]. Conversely, the imports show an extremely significant and negative relationship (coefficient = −1.536 ***) with the dependent variable, a finding which represents one of the main contributions of this paper.
The models shows the positive relationship between exports of goods and services and GDP growth (1.294), as well as the negative effect that imports of goods and services have on GDP (−1.536). Moreover, the results show that imports have a greater marginal effect (negative) on GDP than exports do (positive). The reported coefficients reveal that exports have less of an effect on GDP than imports do.
The results confirm the positive connection between exports of goods and services and GDP growth, as well as the (greater) negative effect that imports have on GDP.
Based on the analysis carried out, it can be affirmed that in the group of LDCs, GDP is more sensitive to the variation in imports than in exports. In fact, an identical variation of 1% in both exports and imports produces a net negative effect on GDP.
Among the limitations of this research, mention should be made of the omission of certain variables due to their exploratory nature and the difficulty of finding a complete set of data to be comprehensively processed. The inclusion of this data would enable a more in-depth explanation of how the external trade flows of the African LDCs influence GDP growth. The results obtained should thus be viewed as an initial approach to the topic, calling for further study. Nevertheless, on the basis of the robust econometric analysis carried out, it can be stated that these countries’ active participation in global trade as suppliers of goods and services has a positive impact on GDP; that said, the effect is smaller than the corresponding negative impact stemming from their activity as buyers in these markets. Thus, when these activities are taken together, the LDCs’ greater integration in the global trading system between 2005 and 2015 contributed negatively to GDP growth and poverty reduction.
The results obtained coincide with those reported by other studies, in which the trade openness of national economies of LDCs is negatively related to poverty reduction, mainly due to growth in imports [70,71]. The negative effect of imports on the currency exchange rate and on the real exchange relationship, along with the difficulties in redirecting the resources of the production system to more competitive sectors—those that can take advantage of the opportunities linked to exportation—may explain the negative relationship between trade openness and economic growth, which, in turn, influences poverty reduction. The 2015 report published by the World Bank and the WTO about “The Role of Trade in Ending Poverty” states that countries in extreme poverty, especially in Sub-Saharan Africa, face numerous constraints that limit their capacity to benefit from the wider economic gains potentially stemming from their active participation in international trade [72]. In other studies, the results indicate that there is no linear relationship between an increase in foreign trade and economic growth; on the contrary, the relationship between these variables follows an inverted U-shaped curve, indicating that trade openness has a positive and notable effect on economic growth, but only up to a threshold, above which, the effect decreases [73].

5. Conclusions

There have been many empirical studies focused on analyzing the effects of countries’ exports on their economic growth. However, few analyses have compared the effects of exports and imports of goods and services on GDP. While exports generate income for the country, over the medium and long term they also enable greater productive specialization, the exploitation of comparative advantages and access to new technologies. In the short term, imports have an adverse effect on the balance of goods and services, GDP growth and poverty reduction. Moreover, difficulties in financing a long-running deficit in the balance of goods and services, linked to the dynamics of purchases from foreign suppliers, may condition the medium and long term evolution of the domestic economy.
The analysis carried out in this article confirms that African LDCs intensified their trade with trading partners between 2005 and 2015, with their participation as suppliers and demanders in the global market, rising to 0.56% and 0.83%, respectively, in 2015. Most national economies that manage to increase their participation in the global trading system register stronger growth in imports—particularly of commercial services—than in exports. This unequal development of exports and imports negatively affects the ability of these countries to use revenues from sales on the international market to finance purchases. In 25 of the 28 countries analyzed, the balance of goods and services shows a negative balance almost every year. Only three nations—Angola, Equatorial Guinea and Zambia—record a surplus, and in 2015, only Equatorial Guinea registered positive values in the balance of goods and services. Overall, the external trade flows of the African LDCs continue to show a high sectoral and geographical concentration, with a major role played by energy-exporting countries such as Angola and Equatorial Guinea. These two economies have significantly increased their imports of commercial services in recent years. The rest of the countries, which show a marked specialization in the export of primary products, have also significantly increased their imports of commercial services in these years.
The 2030 Agenda for Sustainable Development marks a commitment to eradicate poverty. It calls for actions to be taken at both national and international level to ensure that the foreign trade flows that drive national economies act as a tool that contributes to growth. There is no convincing empirical evidence that links open markets with economic growth and poverty reduction. Quite the contrary: the results of this research indicate that the growth of foreign trade flow contributes negatively to GDP. For the world trade system to be a driver of poverty reduction, especially in LDCs, committed action is required at international level to ensure better leadership, more resources and more intelligent solutions that overcome the weaknesses of the current WTO, in which the representation and negotiation capacity of developing African countries is very limited [74,75]. To that end, there is a need to complement, reinforce and significantly expand the WTO-led Aid for Trade initiative. Any such initiatives should comply with Target 17.10 of SDG-17, by seeking to “Promote a universal, rules-based, open, non-discriminatory and equitable multilateral trading system under the WTO, including through the conclusion of negotiations under its Doha Development Agenda”. The agreements adopted, to date, do not guarantee that LDCs’ products can access developed countries’ markets under more favorable conditions. Some proposals argue that it is necessary to undertake institutional changes that help bolster the importance of LDCs in negotiations and ensure a more determined commitment to these negotiations by all the WTO members [76,77,78]. These are difficult demands to meet in a macroeconomic environment of uncertainty and low growth, which, in recent years, has generated trade tension between countries [79,80]. This situation is likely to become even more complex due to the negative economic impacts caused by the COVID-19 pandemic.
The action at the national level needs to involve policies, institutions and national governments’ regulatory frameworks, in order to facilitate the exploitation of comparative advantages and achieve productivity increases linked to trade. Considering the different circumstances of each country, active policies must be developed that favor investment in physical and human capital, and facilitate the redirection of productive resources into new and more productive activities. Furthermore, investments in infrastructure are needed, to make it easier to reduce the costs of access to international trade, as well as improvements in institutions, which will reduce administrative costs [81]. All these actions require financing, which is scarce in these countries, and a maturation period to achieve results. The lack of such actions partly explains the characteristic features of LDCs’ process of integration in the world trade system between 2005 and 2015.
The reality of people’s lives in African LDCs and the commitments assumed by countries around the world, as set out in the 2030 Agenda, require effort and trade policy measures, developed both at national level and by international organizations. Such efforts help ensure that trade boosts growth, allowing countries to exploit their comparative advantages and achieve continuous development. In light of the results reported above, it can be seen that foreign openness and free trade—justified on the basis of the neoliberal thinking predominant since the 1980s [82], and still relevant between 2005 and 2015—will mean that the growth of trade flows from less developed African economies will be accompanied by a continuous outflow of income going overseas, negatively affecting GDP growth and, consequently, poverty reduction. On the other hand, the protectionist practices that have prevailed in recent years generate uncertainty and instability, negatively affecting investment growth worldwide and, by extension, productivity and poverty reduction. In an increasingly interdependent and connected world economy, developed countries need to understand that their future increasingly depends on what happens in the LDCs. How can we fight the over-exploitation of the forests of the Congo Basin—which is essential to tackling climate change—if the population in those countries needs to produce wood to survive? How can we persuade citizens in the Central African Republic to waive part of their income derived from timber exports and prevent forest cover loss if most of the developed countries earmark less than 0.20% of their gross national income to official development assistance? It is necessary to improve and reinforce cooperation worldwide, ensuring that the LDCs participate actively in the agreements, and by incorporating their demands in negotiations.

Author Contributions

E.M.-P. and R.M.N.-P. provided the idea and conceived the framework; E.M.-P. analyzed the data; C.M.-A. implemented the panel data model; and E.M.-P. and R.M.N.-P. wrote the paper. All authors have read and agreed to the published version of the manuscript.

Funding

Chair of Internationalization UGR-EXTENDA, University of Granada, funded this research (BOJA 222, 16–11–2018, 13–21).

Conflicts of Interest

The authors declare no conflict of interest.

Appendix A. Variables Analysis

Table A1 shows descriptive statistics of the variables under study. The GDP presents an overall average of 14,455.01 for the 308 observations, with a standard deviation of 21,549.50, a minimum value of 586.80 and a maximum value of 145,712.20. Without considering the time variable for the 28 countries, the standard deviation is 20,208.26 and the extreme values are between 855.34 and 94,324.11. It is noted that the previous deviations (overall and between) are quite close to the average.
For each country (within), the standard deviation is 8325.23, ranging between a minimum and a maximum (−42,898.22 and 65,843.07). These deviations show that over time, the GDP varies much more between countries than within each country. The same can be said of exports and imports, with average values of 4630.99 and 5126.35, respectively.
Table A1. Description of the variables.
VariableObservationsMeanStandard DeviationMinimumMaximum
Y30814,455.01021,549.500586.79614,5712.200
X3084630.98610,025.84077.56571,873.280
M3085126.3467484.587147.66453,537.920
Source: Own elaboration based on [59,60].
Table A2. Correlation matrix. (Correlation among variables is highly significant).
YitXitMit
Yit1.0000
Xit0.84781.0000
Mit−0.9271−0.93541.0000
Source: Own elaboration based on [59,60].

References

  1. Nhemachena, C.; Matchaya, G.; Nhemachena, C.; Karuaihe, S.; Muchara, B.; Nhlengethwa, S. Measuring Baseline Agriculture-Related Sustainable Development Goals Index for Southern Africa. Sustainability 2018, 10, 849. [Google Scholar] [CrossRef] [Green Version]
  2. Mainali, B.; Luukkanen, J.; Silveira, S.; Kaivo-Oja, J. Evaluating Synergies and Trade-Offs among Sustainable Development Goals (SDGs): Explorative Analyses of Development Paths in South Asia and Sub-Saharan Africa. Sustainability 2018, 10, 815. [Google Scholar] [CrossRef] [Green Version]
  3. World Trade Organization (WTO). Mainstreaming Trade to Attain the Sustainable Development Goals; WTO: Geneva, Switzerland, 2018; Available online: https://www.wto.org/english/res_e/publications_e/sdg_e.htm (accessed on 12 September 2019).
  4. World Bank World Development Report 2020: Trading for Development in the Age of Global Value Chains; World Bank: Washington, DC, USA, 2019.
  5. Unceta, K. Teoría y práctica del comercio internacional: Mitos y realidades. Boletín Económico de ICE 2002, 2730, 31–42. Available online: http://www.revistasice.com/index.php/BICE/article/view/2894/2894 (accessed on 12 September 2019).
  6. Le Goff, M.; Singh, R.J. Does trade reduce poverty? A view from Africa. J. Afr. Trade 2014, 1, 5–14. [Google Scholar] [CrossRef] [Green Version]
  7. Sakyi, D.; Villaverde, J.; Maza, A.; Bonuedi, I. The Effects of Trade and Trade Facilitation on Economic Growth in Africa. Afr. Dev. Rev. 2017, 29, 350–361. [Google Scholar] [CrossRef]
  8. Ramakrishna, G. The effect of trade liberalization on economic growth: The case of Ethiopia. Financ. India 2002, 16, 1295–1305. [Google Scholar]
  9. Yamazawa, I. Economic Development and International Trade: The Japanese Model; East-West Center: Tokyo, Japan, 1990. [Google Scholar]
  10. Agosin, M.R. Comercio y crecimiento en Chile. Revista de la CEPAL 1999, 1999, 79–100. [Google Scholar] [CrossRef]
  11. Reyes, G. Exportaciones y crecimiento económico en América Latina: La evidencia empírica. Comercio Exterior 2002, 51, 977–984. Available online: http://revistas.bancomext.gob.mx/rce/magazines/30/3/RCE.pdf (accessed on 12 September 2019).
  12. Moreno-Brid, J.C.; Perez, E. Liberalización comercial y crecimiento económico en Centroamérica. Revista de la CEPAL 2004, 2003, 157–174. [Google Scholar] [CrossRef]
  13. Krugman, P. La nueva teoría del comercio internacional y los países menos desarrollados. El Trimestre Económico 1988, 55, 41–66. Available online: https://tinyurl.com/rhyu36a (accessed on 12 September 2019).
  14. Cherniwchan, J. Trade liberalization and the environment: Evidence from NAFTA and U.S. manufacturing. J. Int. Econ. 2017, 105, 130–149. [Google Scholar] [CrossRef]
  15. Schaper, M. Impactos Ambientales de los Cambios en la Estructura Exportadora de Nueve Países de América Latina y el Caribe: 1980–1995; CEPAL: Santiago de Chile, Chile, 2000. [Google Scholar]
  16. Moran, D.; Lenzen, M.; Kanemoto, K.; Geschke, A. Does ecologically unequal exchange occur? Ecol. Econ. 2013, 89, 177–186. [Google Scholar] [CrossRef]
  17. Yü, Y.; Feng, K.; Hubacek, K. China’s unequal ecological exchange. Ecol. Indic. 2014, 47, 156–163. [Google Scholar] [CrossRef]
  18. Huo, J.; Tao, Y. An Empirical Study of the Impact of China’s Foreign Trade on the Ecological Environment. Ekoloji 2018, 27, 945–950. [Google Scholar]
  19. Infante-Amate, J.; Krausmann, F. Trade, Ecologically Unequal Exchange and Colonial Legacy: The Case of France and its Former Colonies (1962–2015). Ecol. Econ. 2019, 156, 98–109. [Google Scholar] [CrossRef]
  20. World Trade Organization. Trade and Environment in the WTO; WTO: Geneva, Switzerland, 2004; Available online: https://www.wto.org/english/tratop_e/envir_e/envir_wto2004_e.pdf (accessed on 10 September 2019).
  21. Schoenbaum, T.J. Free International Trade and Protection of the Environment: Irreconcilable Conflict? Am. J. Int. Law 1992, 86, 700–727. Available online: https://www.jstor.org/stable/2203788?origin=crossref (accessed on 10 September 2019). [CrossRef]
  22. Porter, M. America’s green strategy in Welford, R. & Starkey, R. In Business and the Environment: A Reader; Taylor y Francis: Washington, DC, USA, 1996; pp. 33–35. [Google Scholar]
  23. Porter, M.E.; Van Der Linde, C. Toward a New Conception of the Environment-Competitiveness Relationship. J. Econ. Perspect. 1995, 9, 97–118. [Google Scholar] [CrossRef]
  24. World Bank. Pro-Poor Growth in the 1990s: Lessons and Insights from 14 Countries; World Bank: Washington, DC, USA, 2005; Available online: https://tinyurl.com/y7y8poxs (accessed on 11 September 2019).
  25. Timmer, C.P. How Indonesia connected the poor to rapid economic growth, in Bestey, T (cord). In Delivering on the Promise of Pro-Poor Growth; World Bank: Washingtom, DC, USA, 2007. [Google Scholar]
  26. Reina, M.; Zuluaga, S. Comercio y Pobreza: Análisis Comparativo de la Evidencia Para América Latina; CEPAL: Santiago de Chile, Chile, 2008; Available online: https://repositorio.cepal.org/handle/11362/4431 (accessed on 11 September 2019).
  27. World Trade Organization. World Trade Report 2003; WTC: Geneva, Switzerland, 2003; Available online: https://www.wto.org/english/res_e/booksp_e/anrep_e/world_trade_report_2003_e.pdf (accessed on 11 September 2019).
  28. UNCTAD. Least Developed Countries Report 2015. In Transforming Rural Economies; UNCTAD: Geneva, Switzerland, 2005; Available online: https://unctad.org/en/PublicationsLibrary/ldc2015_en.pdf (accessed on 12 September 2019).
  29. Grossman, G.M.; Helpman, E. Innovation and Growth in the Global Economy; Massachusetts Institute of Technology Press: Cambridge, UK, 1991; Available online: https://tinyurl.com/y7yc2wtd (accessed on 12 September 2019).
  30. Edwards, S. Openness, trade liberalization, and growth in developing countries. J. Econ. Lit. 1993, 31, 1358–1393. Available online: https://www.jstor.org/stable/2728244?seq=1 (accessed on 12 September 2019).
  31. Balassa, B. Exports and economic growth. J. Dev. Econ. 1978, 5, 181–189. [Google Scholar] [CrossRef]
  32. Ram, R. Exports and Economic Growth: Some Additional Evidence. Econ. Dev. Cult. Chang. 1985, 33, 415–425. [Google Scholar] [CrossRef]
  33. Feder, G. On exports and economic growth. J. Dev. Econ. 1983, 12, 59–73. [Google Scholar] [CrossRef]
  34. Krugman, P.R.; Obstfeld, M. Economía Internacional; Pearson Educación: Madrid, Spain, 2006. [Google Scholar]
  35. Bajo, O. Teorías del Comercio Internacional; Antoni Bosch Editor: Barcelona, Spain, 1991. [Google Scholar]
  36. Krugman, P.R. Geografía y Comercio; Antoni Bosch Editor: Barcelona, Spain, 1992. [Google Scholar]
  37. Harrison, A.; Hanson, G. Who gains from trade reform? Some remaining puzzles. J. Dev. Econ. 1999, 59, 125–154. [Google Scholar] [CrossRef] [Green Version]
  38. Ravallion, M.; Lokshin, M. Gainers and Losers from Trade Reform in Morocco; World Bank Publications: Washington, DC, USA, 2004; Available online: https://tinyurl.com/y8jb6jfz (accessed on 12 September 2019).
  39. Winters, L.A.; McCulloch, N.; McKay, A. Trade Liberalization and Poverty: The Evidence So Far. J. Econ. Lit. 2004, 42, 72–115. [Google Scholar] [CrossRef]
  40. McCulloch, N. The Impact of Structural Reforms on Poverty; World Bank: Washington, DC, USA, 2003; p. 3124. Available online: https://tinyurl.com/v88f58j (accessed on 16 September 2019).
  41. Ulaşan, B. Trade openness and economic growth: Panel evidence. Appl. Econ. Lett. 2014, 22, 163–167. [Google Scholar] [CrossRef]
  42. Dollar, D.; Kraay, A. Institutions, trade, and growth. J. Monet. Econ. 2003, 50, 133–162. [Google Scholar] [CrossRef]
  43. Young, A. Learning by Doing and the Dynamic Effects of International Trade. Q. J. Econ. 1991, 2, 369–405. Available online: https://www.nber.org/papers/w3577.pdf (accessed on 16 September 2019). [CrossRef] [Green Version]
  44. Roemer, M.; Gugerty, M.K. Does Economic Growth Reduce Poverty? Bachelor’s Thesis, Harvard Institute for International Development, Cambridge, MA, USA, 1997. [Google Scholar]
  45. Sprout, R.V.A.; Weaver, J.H. Exports and Economic Growth in a Simultaneous-equations Model. J. Dev. Areas 1993, 3, 289–306. Available online: https://www.jstor.org/stable/4192227?seq=1 (accessed on 16 September 2019).
  46. Choudhri, E.U.; Hakura, D.S. International Trade and Productivity Growth: Exploring the Sectoral Effects for Developing Countries. Int. Monet. Fund Staff Pap. 2000, 1, 30–53. Available online: https://www.imf.org/external/pubs/ft/wp/2000/wp0017.pdf (accessed on 16 September 2019). [CrossRef]
  47. Lee, J.-W. Capital goods imports and long-run growth. J. Dev. Econ. 1995, 48, 91–110. [Google Scholar] [CrossRef] [Green Version]
  48. Maurer, R. Economic Growth and International Trade with Capital Goods; Institute of World Economics, Kiel University: Tubinga, Germany, 1988. [Google Scholar]
  49. Egwaikhide, F. Determinants of Import in Nigeria: A Dynamic Specification. Afr. Econ. Res. Consort. Res. Pap. 1999, 91, 1–30. Available online: https://tinyurl.com/wkg4rqy (accessed on 17 September 2019).
  50. Sáez, S.; Taglioni, D.; Van Der Marel, E.; Hollweg, C.H.; Zavacka, V. Valuing Services in Trade: A Toolkit for Competitiveness Diagnostics. In Valuing Services in Trade: A Toolkit for Competitiveness Diagnostics; World Bank: Washington, DC, USA, 2015. [Google Scholar]
  51. Sáez, S. Trade in Services Negotiations: A Guide for Developing Countries; World Bank: Washington, DC, USA, 2010. [Google Scholar] [CrossRef]
  52. Shingal, A. Identifying Good Practices in LDC/LIC Services Trade Statistics Collection; CUTS International Geneva and CARIS: Geneva, Switzerland, 2015; Available online: https://tinyurl.com/to3ra9o (accessed on 17 September 2019).
  53. Drake-Brockman, J.; Greenidge, A.; Lan, J.; Zhao, Q. Making the Most of the LDC Services Waiver; International Trade Centre: Geneva, Switzerland, 2015; Available online: https://tinyurl.com/vxjujqy (accessed on 17 September 2019).
  54. Taylor, I.; Smith, K. United Nations Conference on Trade and Development (UNCTAD); Routledge: New York, NJ, USA, 2007. [Google Scholar]
  55. Browne, S.; Laird, S. The International Trade Centre: Export Impact for Good; Taylor & Francis: Abingdon, UK, 2011. [Google Scholar]
  56. World Trade Organization. Los Textos de la Ronda Doha y Documentos Anexos; World Trade Organization: Geneva, Switzerland, 2009; Available online: https://www.wto.org/spanish/res_s/booksp_s/doha_round_texts_s.pdf (accessed on 17 September 2019).
  57. WTO. EIF Annual Report 2016; EIF Executive Secretariat at the WTO: Geneva, Switzerland, 2017; Available online: https://tinyurl.com/rbseqos (accessed on 17 September 2019).
  58. Dornbusch, R. La Macroeconomía de Una Economía Abierta; Antoni Bosch Editor: Barcelona, Spain, 1993. [Google Scholar]
  59. UNCTADSTAT. Available online: https://unctadstat.unctad.org/ (accessed on 5 September 2019).
  60. DataBank. Available online: https://databank.worldbank.org/databases (accessed on 26 September 2019).
  61. Rashid, A.I. Trade, growth, and liberalization: The Indian experience, 1977–1989. J. Dev. Areas 1995, 29, 355–370. Available online: https://www.jstor.org/stable/4192464 (accessed on 10 June 2019).
  62. Ju, J.; Wu, Y.; Zeng, L. The Impact of Trade Liberalization on the Trade Balance in Developing Countries. IMF Staff Pap. 2009, 57, 427–449. [Google Scholar] [CrossRef]
  63. Labra, R.; Torrecillas, C. Guía CERO para datos de panel. Un enfoque práctico. UAM Accent. Work. Pap. 2014, 16, 57. Available online: https://tinyurl.com/y7xccdb9 (accessed on 10 June 2019).
  64. Arellano, M.; Bover, O. La econometría de datos de panel. Investigaciones Económicas 1990, 1, 3–45. Available online: https://tinyurl.com/u3j4vng (accessed on 17 June 2019).
  65. Arellano, M.; Bond, S. Some Tests of Specification for Panel Data: Monte Carlo Evidence and an Application to Employment Equations. Rev. Econ. Stud. 1991, 58, 277. [Google Scholar] [CrossRef] [Green Version]
  66. Arellano, M.; Bover, O. Another look at the instrumental variable estimation of error-components models. J. Econom. 1995, 68, 29–51. [Google Scholar] [CrossRef] [Green Version]
  67. Roodman, D. How to do Xtabond2: An Introduction to Difference and System GMM in Stata. Stata J. Promot. Commun. Stat. Stata 2009, 9, 86–136. [Google Scholar] [CrossRef] [Green Version]
  68. Roodman, D. A Note on the Theme of Too Many Instruments. Oxf. Bull. Econ. Stat. 2009, 71, 135–158. [Google Scholar] [CrossRef]
  69. Windmeijer, F. A finite sample correction for the variance of linear efficient two-step GMM estimators. J. Econom. 2005, 126, 25–51. [Google Scholar] [CrossRef]
  70. Goldberg, P.K.; Pavcnik, N. Trade, Inequality, and Poverty: What Do We Know? Evidence from Recent Trade Liberalization Episodes in Developing Countries; National Bureau of Economic Research: Cambridge, MA, USA, 2004. [Google Scholar]
  71. Onakoya, A.B.; Johnson, B.; Ogundajo, G. Poverty and trade liberalization: Empirical evidence from 21 African countries. Econ. Res. Ekon. Istraživanja 2019, 32, 635–656. [Google Scholar] [CrossRef]
  72. World Bank Group and World Trade Organization. The Role of Trade in Ending Poverty; WTO: Geneva, Switzerland, 2015; Available online: https://www.wto.org/english/res_e/booksp_e/worldbankandwto15_e.pdf (accessed on 3 September 2019).
  73. Zahonogo, P. Trade and economic growth in developing countries: Evidence from sub-Saharan Africa. J. Afr. Trade 2017, 3, 41–56. [Google Scholar] [CrossRef]
  74. Alavi, A. African countries and the WTO’s Dispute Settlement Mechanism. Dev. Policy Rev. 2007, 25, 25–42. [Google Scholar] [CrossRef]
  75. Gallagher, K.P. Understanding developing country resistance to the Doha Round. Rev. Int. Political Econ. 2007, 15, 62–85. [Google Scholar] [CrossRef]
  76. Stiglitz, J.E.; Charlton, A. The Development Round of Trade Negotiations in the Aftermath of Cancun; Commonwealth Secretariat: London, UK, 2004. [Google Scholar]
  77. Charlton, A.H.; Stiglitz, J.E. A Development-friendly Prioritisation of Doha Round Proposals. World Econ. 2005, 28, 293–312. [Google Scholar] [CrossRef]
  78. Scott, J.; Wilkinson, R. The Poverty of the Doha Round and the Least Developed Countries. Third World Q. 2011, 32, 611–627. [Google Scholar] [CrossRef]
  79. World Trade Organization. World Trade Statistical Review 2019; WTO: Geneva, Switzerland, 2019; Available online: https://www.wto.org/english/res_e/statis_e/wts2019_e/wts19_toc_e.htm (accessed on 10 September 2019).
  80. Evenett, S.J.; Fritz, J. The Tide Turns? Trade Protectionism, and Slowing Global Growth. In The 18th GTA Report; CEPR Press: London, UK, 2015; Available online: https://www.alexandria.unisg.ch/253015/1/GTA18.pdf (accessed on 18 September 2019).
  81. UNCTAD. Achieving the Sustainable Development Goals; UNCTAD: Geneva, Switzerland, 2018; Available online: https://unctad.org/en/PublicationsLibrary/aldc2018d4_en.pdf (accessed on 11 September 2019).
  82. Unceta, K.; Gutiérrez-Goiria, J. International Cooperation and the development debate. Revista de Economía Mundial 2018, 50, 107–126. [Google Scholar] [CrossRef]
Figure 1. LDCs’ (Least Developed Countries) exports and imports of goods and services as a share of the world total, and LDC GDP as a share of world GDP between 2005 and 2015. Source: Own elaboration based on [59].
Sustainability 12 04470 g001
Figure 2. Group of countries according to the process of trade internationalization between 2005 and 2015. Source: Own elaboration based on [59].
Sustainability 12 04470 g002
Table 1. Share of exports and imports of goods and services in the total foreign trade of African LDCs in 2005, 2015 and accumulated in the period 2005–2015 (%).
Variables20052015Accumulated 2005–2015
Xgoods-LDCs/X goods and services-LDCs88.8483.2389.15
Mgoods-LDCs/Mgoods and services-LDCs68.1570.5368.42
Xservices-LDCs/Xgoods and services-LDCs11.1616.7711.65
Mservices-LDCs/Mgoods and services-LDCs31.8529.4732.45
Source: Own elaboration based on [59].
Table 2. Countries’ exports and imports of goods and services as a share of the total for African LDCs, accumulated in the period 2005–2015, and Hirschman index of concentration (%).
CountryExport of GoodsImport of GoodsExport of ServicesImport of Services
Angola43.619.55.339.7
Benin1.21.92.51.2
Burkina Faso1.42.01.91.9
Burundi0.10.50.50.5
C. African Rep.0.10.30.60.4
Chap3.22.52.45.0
D. Rep. Congo6.67.83.14.7
Djibouti0.10.62.30.3
Equatorial Guinea11.24.60.54.6
Ethiopia2.08.715.45.3
Gambia0.10.30.60.2
Guinea1.21.60.61.1
Guinea-Bissau0.10.20.20.2
Lesotho0.71.80.30.9
Liberia0.31.02.82.5
Malawi1.02.10.60.5
Mali1.92.52.72.7
Mauritanian1.62.11.11.5
Mozambique2.55.13.84.6
Niger0.91.70.91.6
Rwanda0.31.33.11.2
Senegal2.04.88.02.7
Sierra Leone0.51.10.60.9
Sudan5.47.45.24.5
Togo0.91.52.50.8
Uganda1.94.110.04.0
U. Rep. Tanzania3.57.716.84.3
Zambia5.85.64.92.3
Total100.0100.0100.0100.0
Hirschman Index46.227.527.941.3
Source: Own elaboration based on [59].
Table 3. Dynamic panel data estimates (1).
VariablesCoefficient
ΔYit−10.993 ***
(0.077)
ΔXit1.294 ***
(0.081)
ΔXit−1−0.915 ***
(0.081)
Arellano-Bond test for AR(1)0.032
Arellano-Bond test for AR(2)0.135
Hansen test0.128
Number of instruments19
Observations280
Number of countries28
*** Significant at 1%. Standard errors in parentheses. Source: Own elaboration based on [59,60].
Table 4. Dynamic panel data estimates (2).
VariablesCoefficient
ΔYit−10.934 ***
(0.101)
ΔMit−1.536 ***
(0.402)
ΔMit−11.090 ***
(0.286)
Arellano-Bond test for AR(1)0.070
Arellano-Bond test for AR(2)0.330
Hansen test0.416
Number of instruments22
Observations280
Number of countries28
*** Significant at 1%. Standard errors in parentheses. Source: Own elaboration based on [59,60].

