Study on the Spatial Pattern of an Extreme Heat Event by Remote Sensing: A Case Study of the 2013 Extreme Heat Event in the Yangtze River Delta, China
Abstract
1. Introduction
2. Study Area
3. Data and Methods
3.1. Data Collection and Processing
3.1.1. Land Surface Temperature
3.1.2. Normalized Difference Vegetation Index
3.1.3. Global Human Settlement Layer
3.1.4. Digital Elevation Model (DEM)
3.1.5. Observation Data
3.2. Methodology
3.2.1. Temperature Estimation by Remote Sensing
3.2.2. Indicators of Extreme Heat
4. Results and Discussion
4.1. Validation of Remotely Sensed Air Temperature
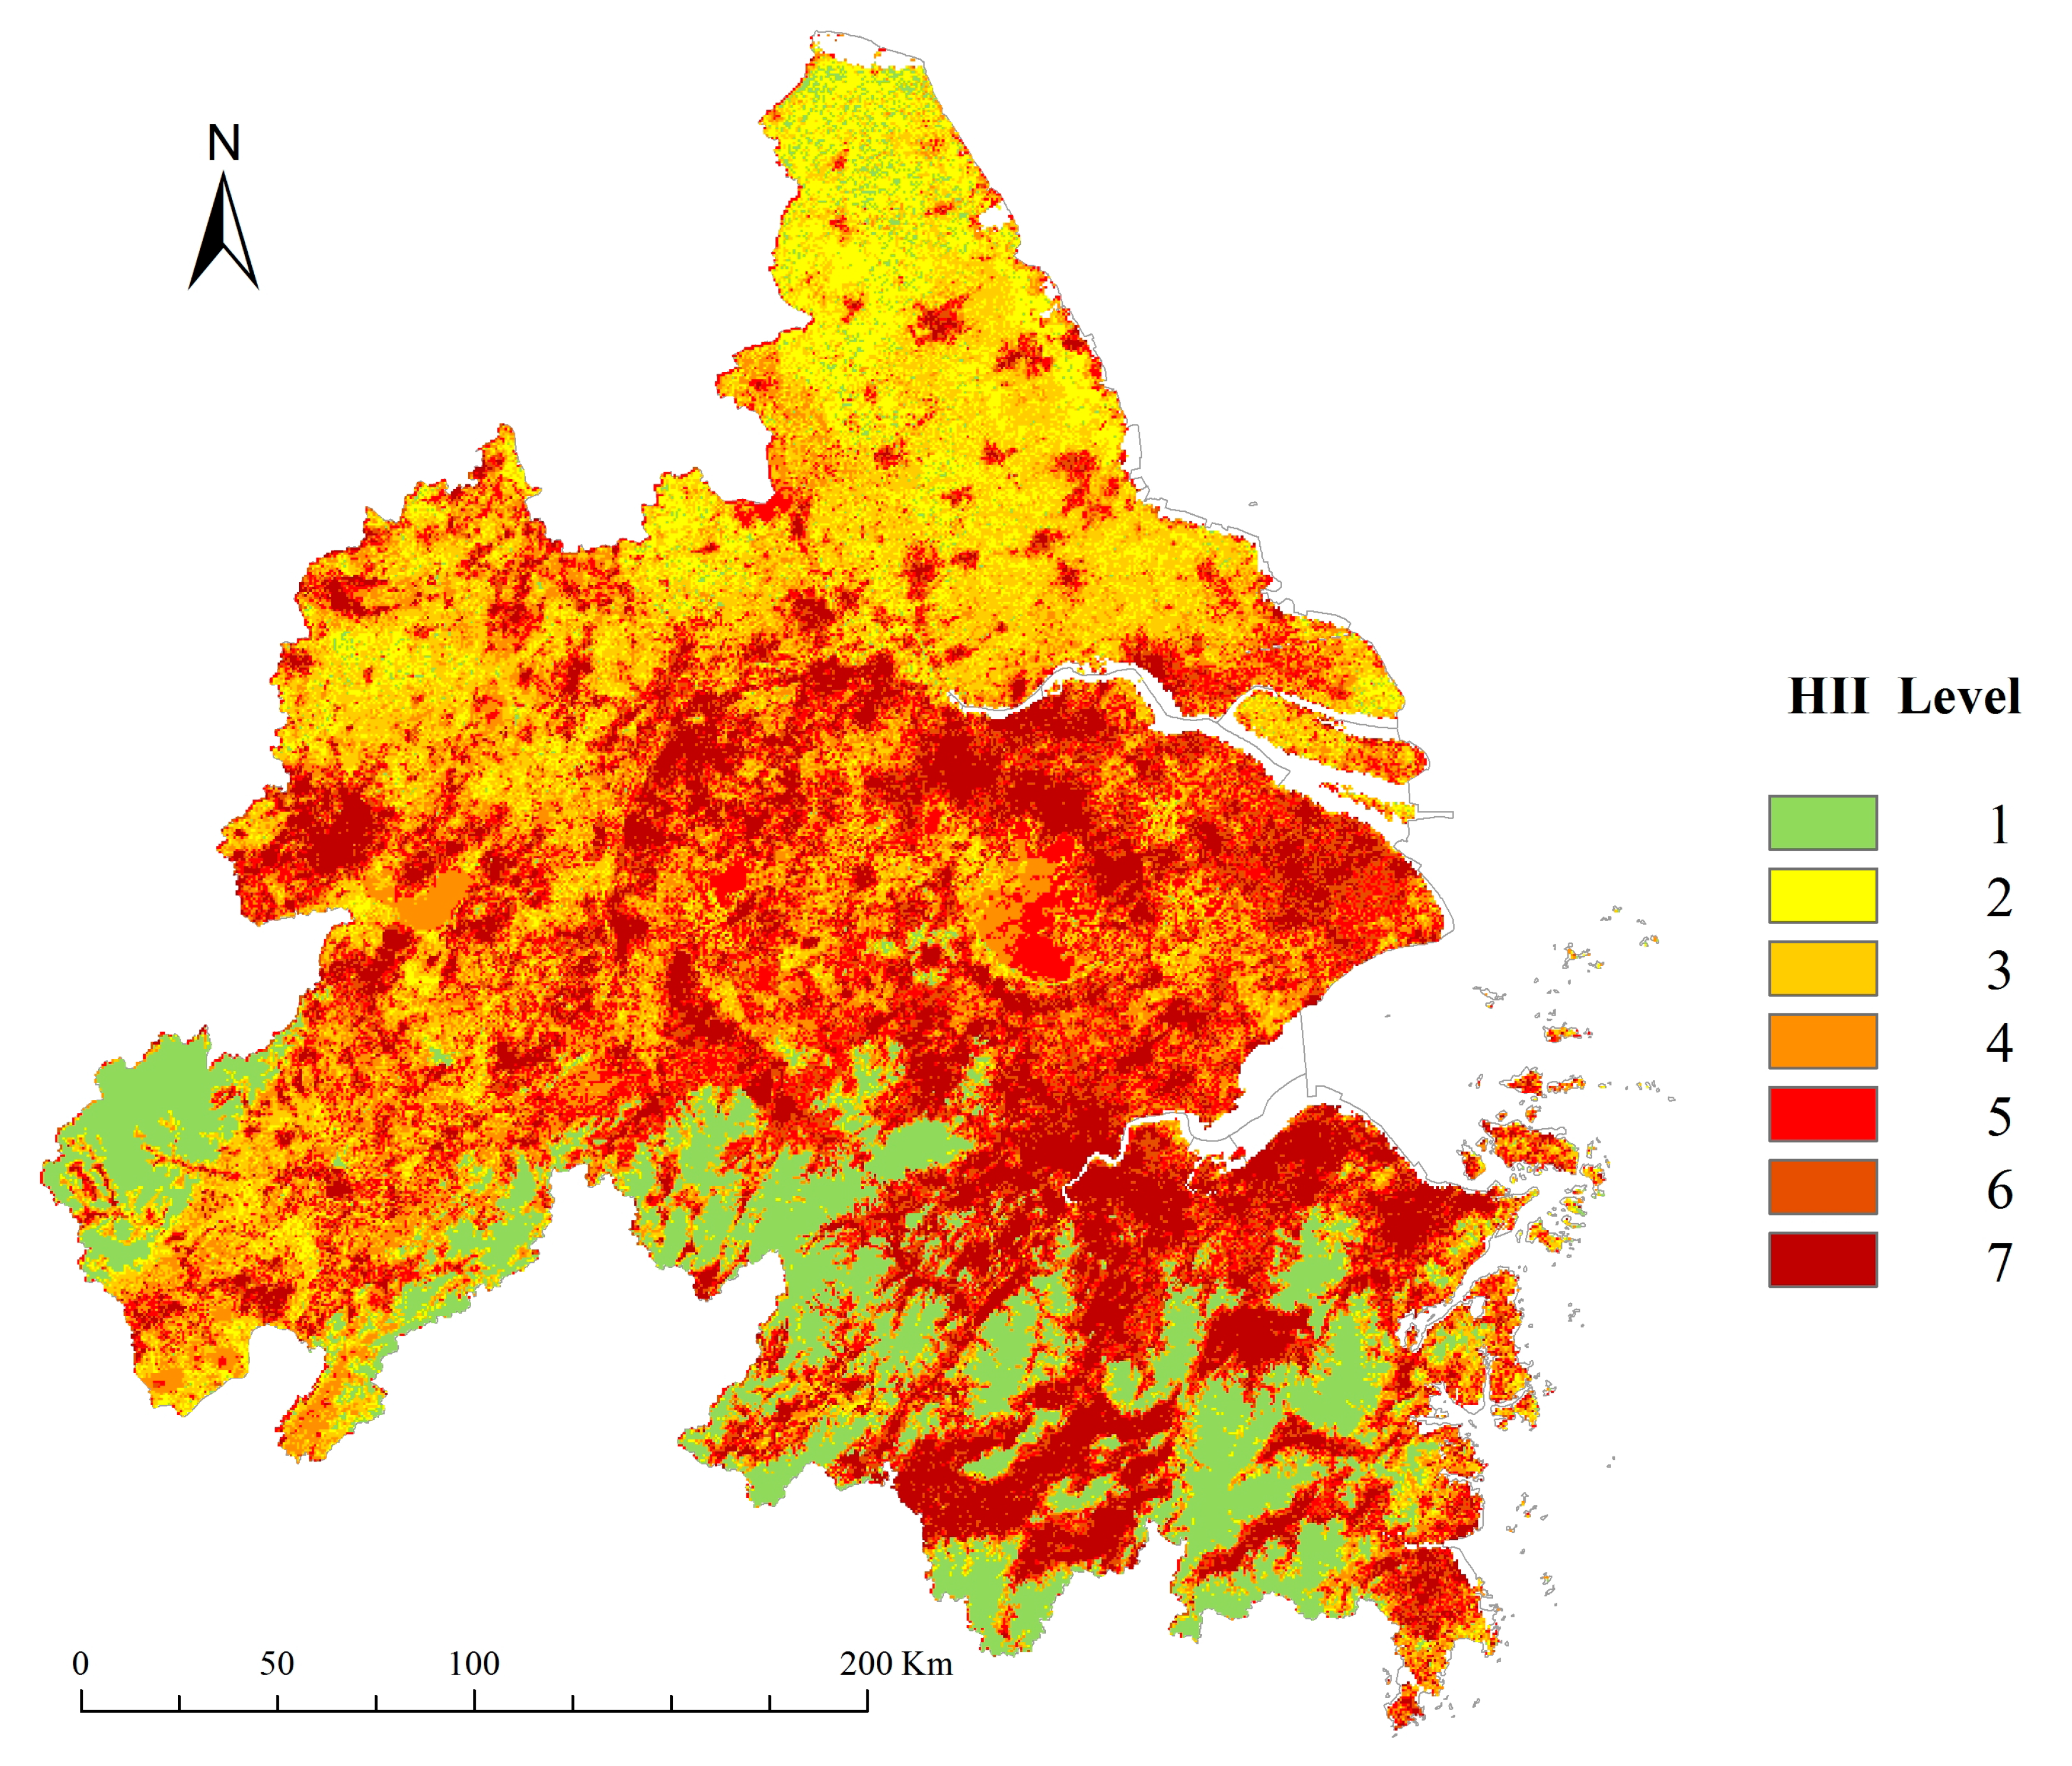
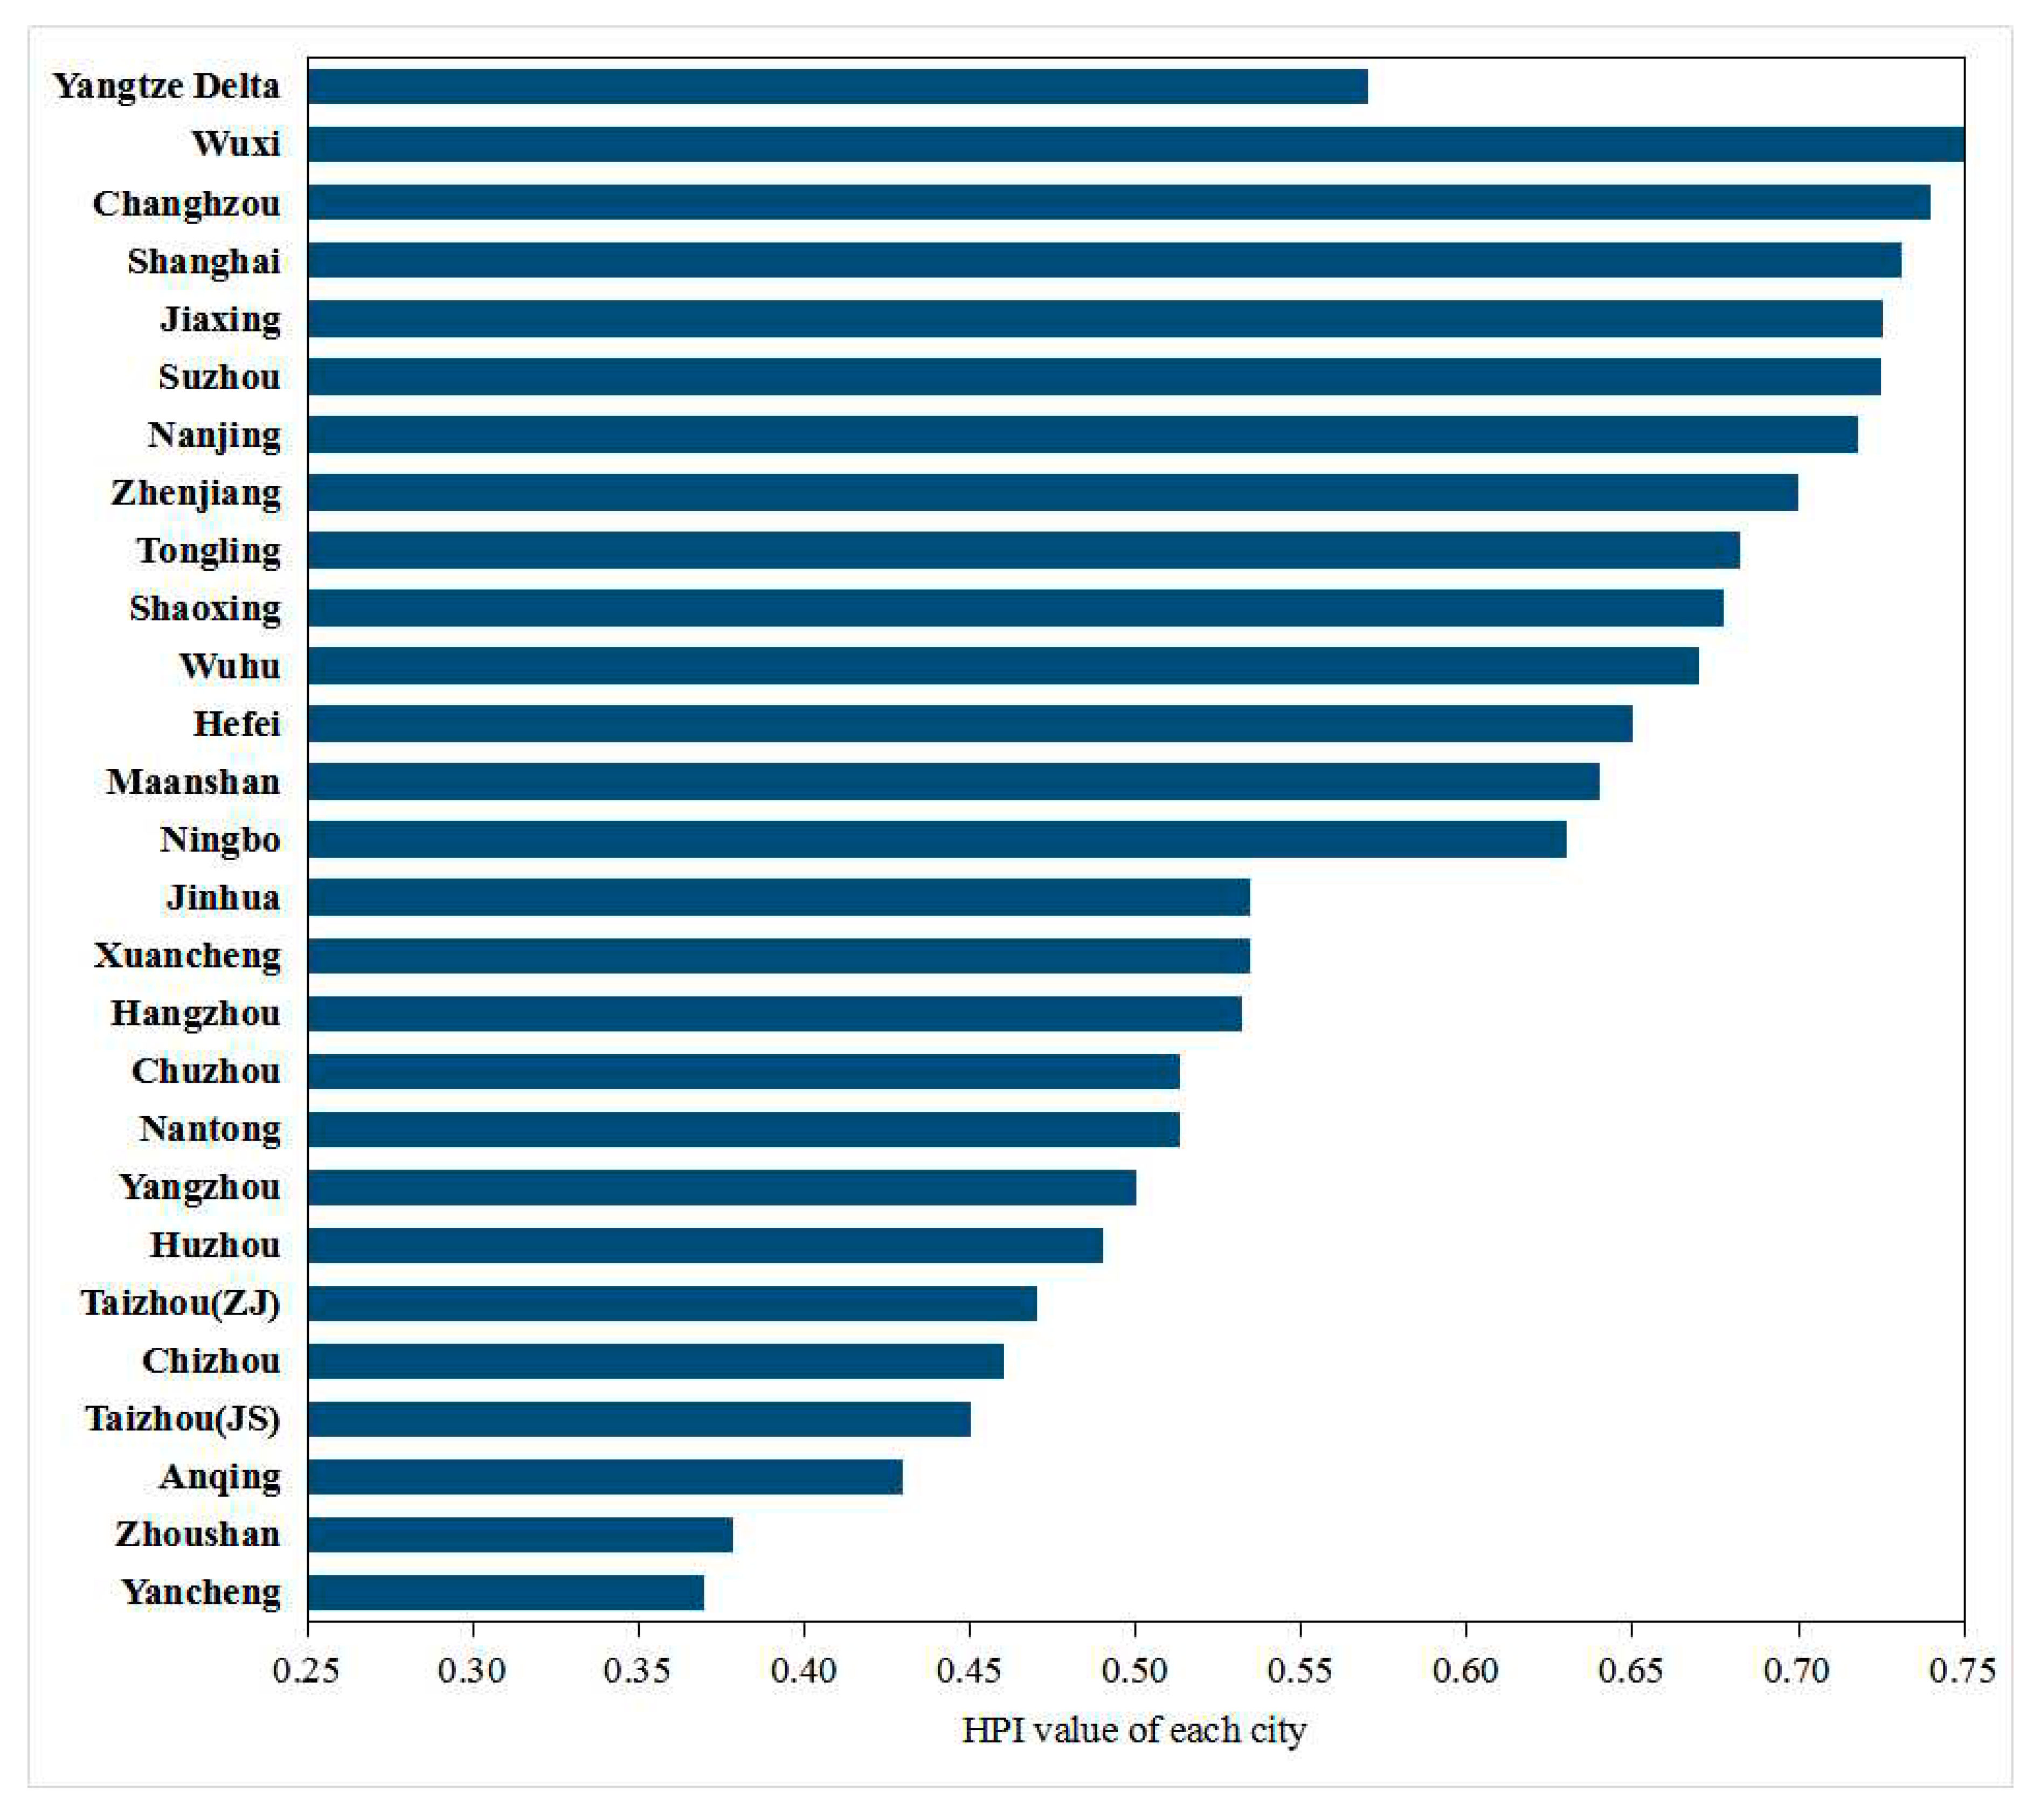
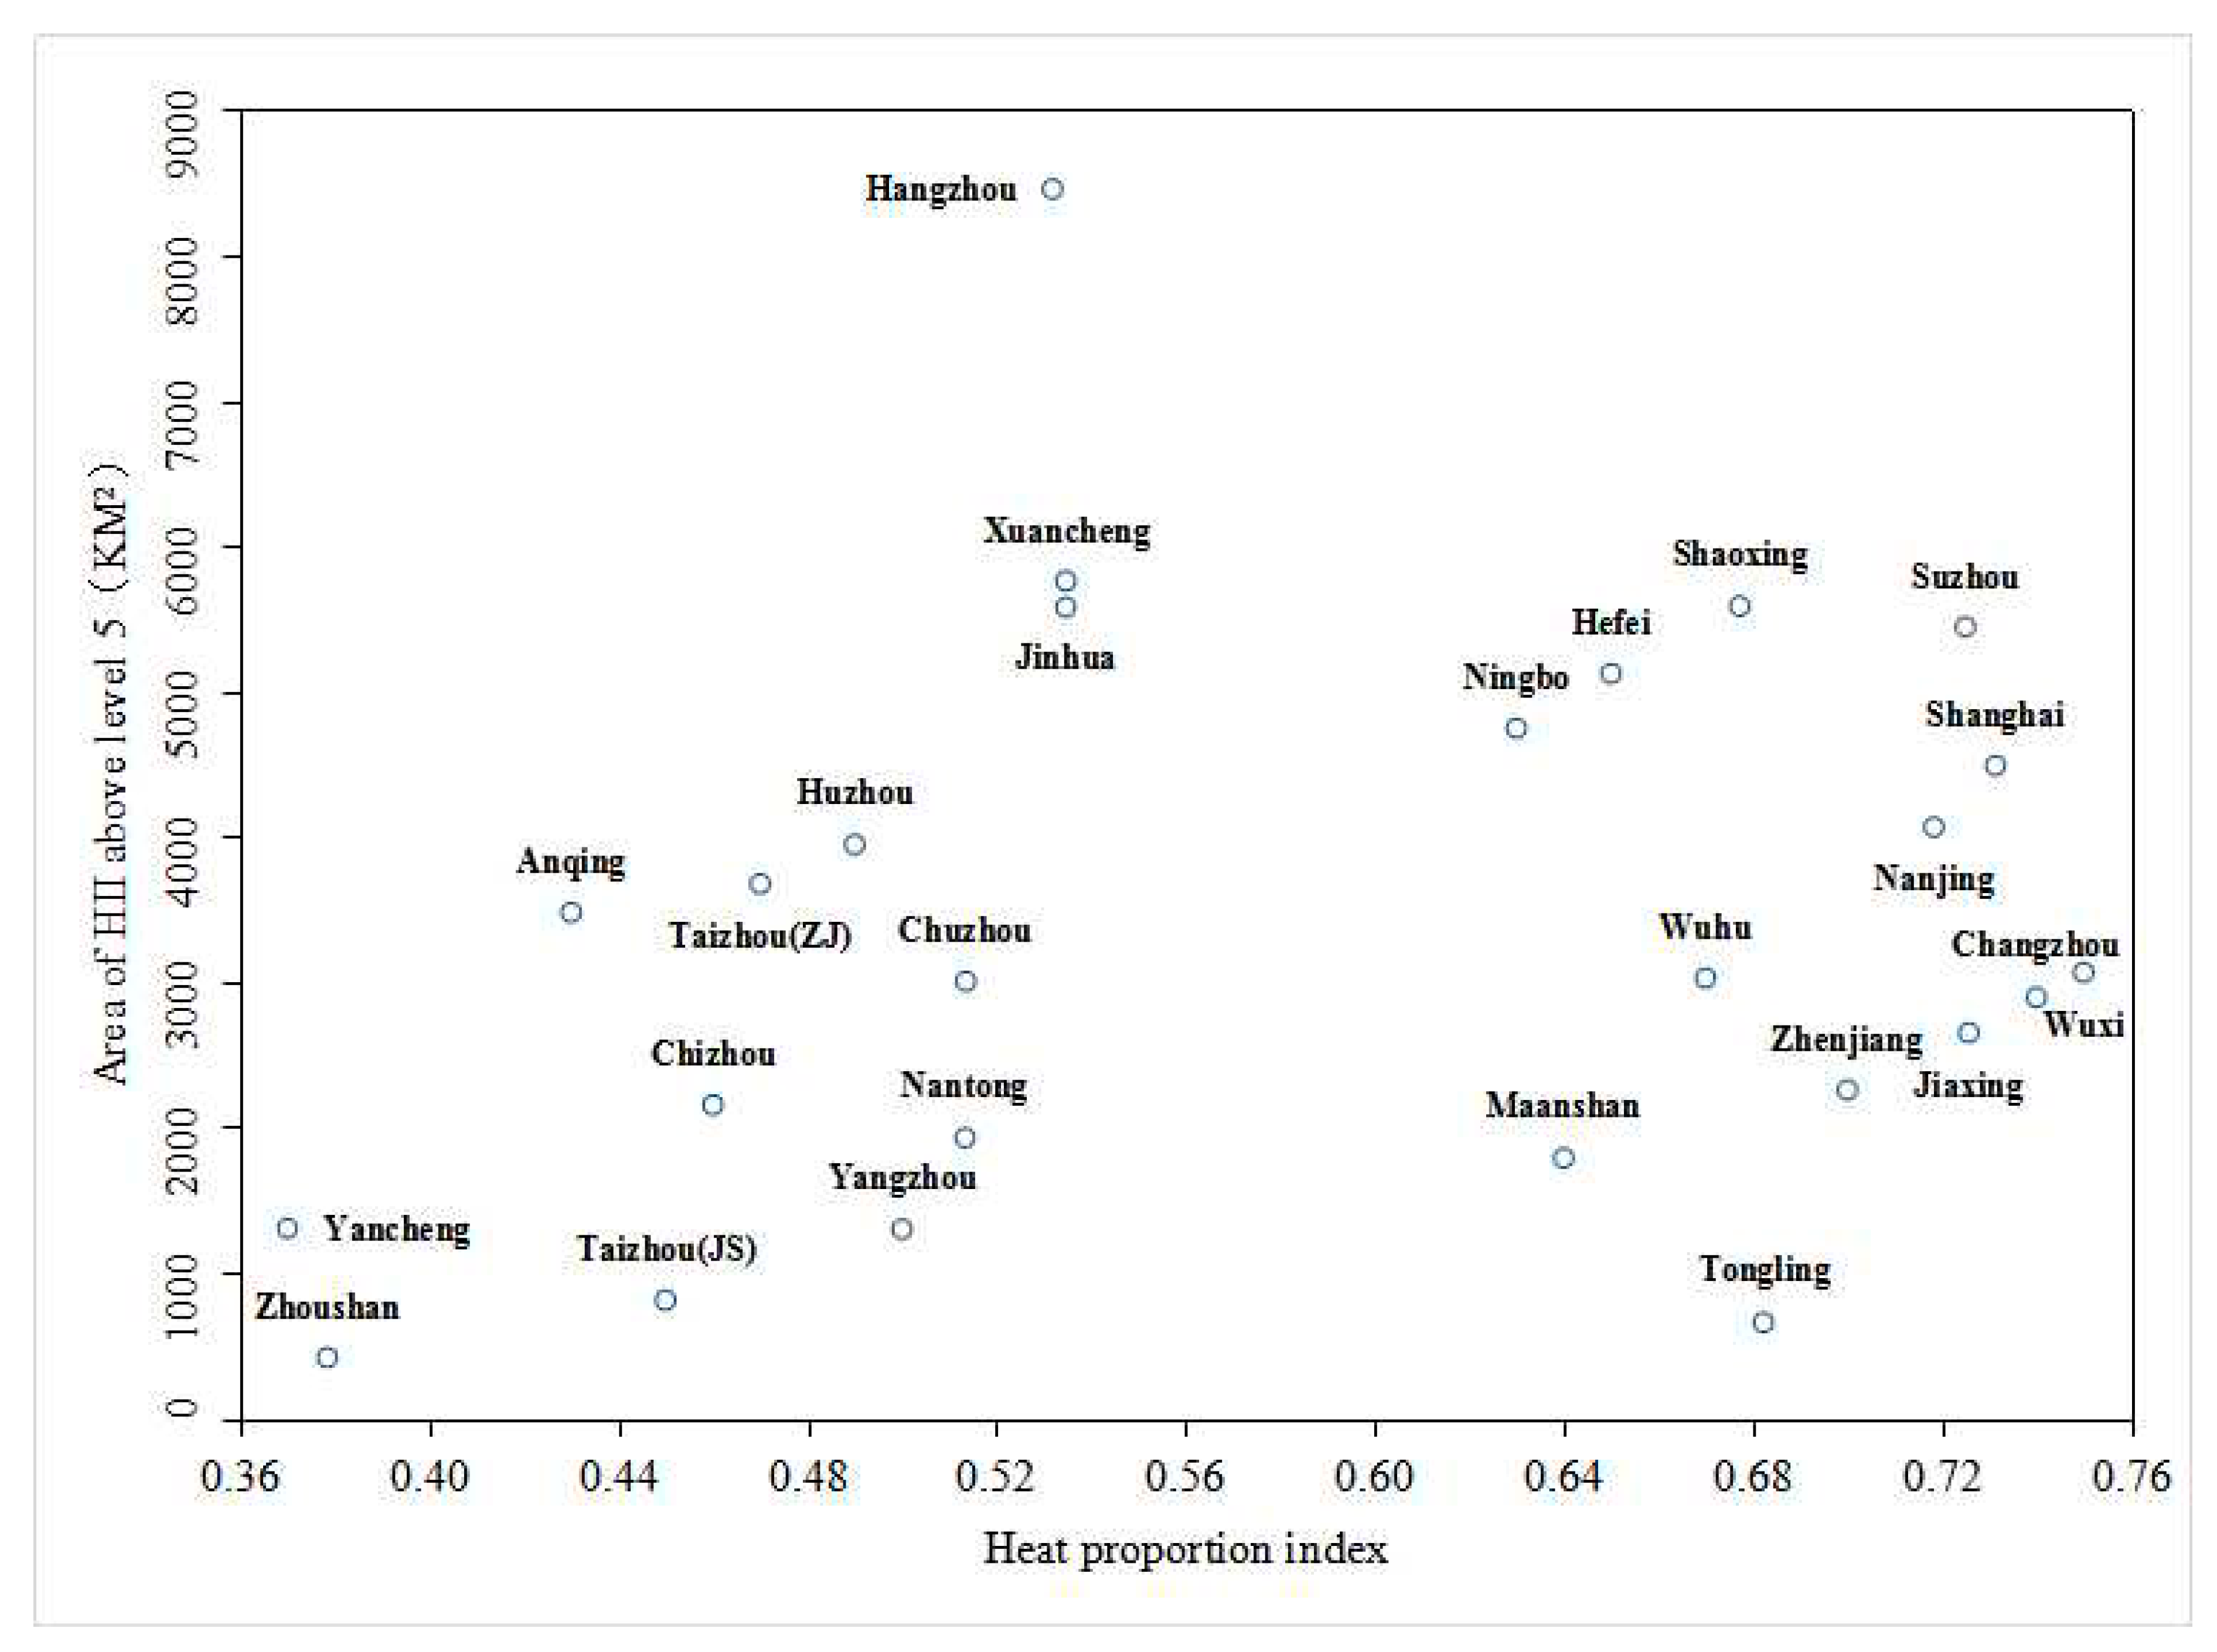
4.2. Spatial Pattern of the Extreme Heat Event
4.3. Discussions
5. Conclusions
Author Contributions
Funding
Conflicts of Interest
References
- Intergovernmental Panel on Climate Change (IPCC). Climate Change, 2013: The physical science basis. In Contribution of Working Group I to the Fifth Assessment Report of the Intergovernmental Panel on Climate Change; Cambridge University Press: Cambridge, UK; New York, NY, USA, 2013. [Google Scholar]
- Zhu, S.; Liu, Y.; Hua, J.; Zhang, G.; Zhou, Y.; Xiang, J. Monitoring Spatio-temporal Variance of an Extreme Heat Event Using Multiple-source Remote Sensing Data. Chin. Geogr. Sci. 2018, 28, 744–757. [Google Scholar] [CrossRef]
- Zheng, J.; Fan, J.; Zhang, F. Spatiotemporal trends of temperature and precipitation extremes across contrasting climatic zones of China during 1956–2015. Theor. Appl. Climatol. 2019, 138, 1877–1897. [Google Scholar] [CrossRef]
- Anderson, G.B.; Bell, M.L. Heat waves in the United States: Mortality risk during heat waves and effect modification by heat wave characteristics in 43 US communities. Environ. Health Perspect. 2011, 119, 210–218. [Google Scholar] [CrossRef] [PubMed]
- Gong, P.; Liang, S.; Carlton, E.J.; Jiang, Q.; Wu, J.; Wang, L. Urbanisation and health in China. Lancet 2012, 379, 843–852. [Google Scholar] [CrossRef]
- McElroy, S.; Schwarz, L.; Green, H.; Corcos, I.; Guirguis, K.; Gershunov, A.; Benmarhnia, T. Defining heat waves and extreme heat events using sub-regional meteorological data to maximize benefits of early warning systems to population health. Sci. Total Environ. 2020, 721, 137678. [Google Scholar] [CrossRef]
- French, J.; Kokoszka, P.; Stoev, S.; Hall, L. Quantifying the risk of heat waves using extreme value theory and spatio-temporal functional data. Comput. Stat. Data Anal. 2019, 131, 176–193. [Google Scholar] [CrossRef]
- Lee, W.; Choi, H.M.; Kim, D.; Honda, Y.; Guo, Y.L.; Kim, H. Temporal changes in mortality attributed to heat extremes for 57 cities in Northeast Asia. Sci. Total Environ. 2018, 616–617, 703–709. [Google Scholar] [CrossRef]
- Liu, G.; Zhang, L.; He, B.; Jin, X.; Zhang, Q.; Razafindrabe, B.; You, H. Temporal changes in extreme high temperature, heat waves and relevant disasters in Nanjing metropolitan region, China. Nat. Hazards 2015, 76, 1415–1430. [Google Scholar] [CrossRef]
- Khan, N.; Shahid, S.; Juneng, L.; Ahmed, K.; Ismail, T.; Nawaz, N. Prediction of heat waves in Pakistan using quantile regression forests. Atmos. Res. 2019, 221, 1–11. [Google Scholar] [CrossRef]
- Clemesha, R.E.; Guirguis, K.; Gershunov, A.; Small, I.J.; Tardy, A. California heat waves: Their spatial evolution, variation, and coastal modulation by low clouds. Clim. Dyn. 2018, 50, 4285–4301. [Google Scholar] [CrossRef]
- Gómez, I.; Niclòs, R.; Estrela, M.J.; Casellesa, V.; Barberà, M.J. Simulation of extreme heat events over the Valencia coastal region: Sensitivity to initial conditions and boundary layer parameterizations. Atmos. Res. 2019, 218, 315–334. [Google Scholar] [CrossRef]
- Ramamurthy, P.; Sangobanwo, M. Inter-annual variability in urban heat island intensity over 10 major cities in the United States. Sustain. Cities Soc. 2016, 26, 65–75. [Google Scholar] [CrossRef]
- Shi, Y.; Ren, C.; Cai, M.; Lau, K.K.; Lee, T.; Wong, W. Assessing spatial variability of extreme hot weather conditions in Hong Kong: A land use regression approach. Environ. Res. 2019, 171, 403–415. [Google Scholar] [CrossRef] [PubMed]
- Habeeb, D.; Vargo, J.; Brian, S., Jr. Rising heat wave trends in large US cities. Nat. Hazards 2015, 76, 1651–1665. [Google Scholar] [CrossRef]
- Rizvi, S.H.; Alam, K.; Iqbal, M.J. Spatio-temporal variations in urban heat island and its interaction with heat wave. J. Atmos. Sol. Terr. Phys. 2019, 185, 50–57. [Google Scholar] [CrossRef]
- Sun, Y.; Wang, J.; Zhang, R.; Gillies, R.; Xue, Y.; Bo, Y. Air temperature retrieval from remote sensing data based on thermodynamics. Theor. Appl. Climatol. 2005, 80, 37–48. [Google Scholar] [CrossRef]
- Zhu, S.; Zhou, C.; Zhang, G.; Zhang, H.; Hua, J. Preliminary verification of instantaneous air temperature estimation for clear sky conditions based on SEBAL. Meteorol. Atmos. Phys. 2017, 129, 71–81. [Google Scholar] [CrossRef]
- Schwarz, N.; Lautenbach, S.; Seppelt, R. Exploring indicators for quantifying surface urban heat islands of European cities with MODIS land surface temperatures. Remote Sens. Environ. 2011, 115, 3175–3186. [Google Scholar] [CrossRef]
- Imhoff, M.L.; Zhang, P.; Wolfe, R.E.; Bounoua, L. Remote sensing of the urban heat island effect across biomes in the continental USA. Remote Sens. Environ. 2010, 114, 504–513. [Google Scholar] [CrossRef]
- Sheng, L.; Tang, X.; You, H.; Gu, Q.; Hu, H. Comparison of the urban heat island intensity quantified by using air temperature and Landsat land surface temperature in Hangzhou, China. Ecol. Indic. 2017, 72, 738–746. [Google Scholar] [CrossRef]
- Yu, Z.; Yao, Y.; Yang, G.; Wang, X.; Vejre, H. Spatiotemporal patterns and characteristics of remotely sensed region heat islands during the rapid urbanization (1995–2015) of Southern China. Sci. Total Environ. 2019, 674, 242–254. [Google Scholar] [CrossRef] [PubMed]
- Zhou, D.; Zhao, S.; Liu, S.; Zhang, L.; Zhu, C. Surface urban heat island in China's 32 major cities: Spatial patterns and drivers. Remote Sens. Environ. 2014, 152, 51–61. [Google Scholar] [CrossRef]
- Gunawardena, K.R.; Wells, M.J.; Kershaw, T. Utilising green and bluespace to mitigate urban heat island intensity. Sci. Total Environ. 2017, 584–585, 1040–1055. [Google Scholar] [CrossRef] [PubMed]
- Shirani-bidabadi, N.; Nasrabadi, T.; Faryadi, S.; Larijani, A.; Roodposhti, M.S. Evaluating the spatial distribution and the intensity of urban heat island using remote sensing, case study of Isfahan city in Iran. Sustain. Cities Soc. 2019, 45, 686–692. [Google Scholar] [CrossRef]
- Li, X.; Li, W.; Middel, A.; Harlan, S.L.; Brazel, A.J.; Turner, B.L., II. Remote sensing of the surface urban heat island and land architecture in Phoenix, Arizona: Combined effects of land composition and configuration and cadastral-demographic-economic factors. Remote Sens. Environ. 2016, 174, 233–243. [Google Scholar] [CrossRef]
- Yao, R.; Wang, L.; Huang, X.; Niu, Y.; Chen, Y.; Niu, Z. The influence of different data and method on estimating the surface urban heat island intensity. Ecol. Indic. 2018, 89, 45–55. [Google Scholar] [CrossRef]
- Liu, Y.; Fang, X.; Xu, Y.; Zhang, S.; Luan, Q. Assessment of surface urban heat island across China’s three main urban agglomerations. Theor. Appl. Climatol. 2018, 133, 473–488. [Google Scholar] [CrossRef]
- Peng, J.; Jia, J.; Liu, Y.; Li, H.; Wu, J. Seasonal contrast of the dominant factors for spatial distribution of land surface temperature in urban areas. Remote Sens. Environ. 2018, 215, 255–267. [Google Scholar] [CrossRef]
- Du, H.; Wang, D.; Wang, Y.; Zhao, X.; Qin, F.; Jiang, H.; Cai, Y. Influences of land cover types, meteorological conditions, anthropogenic heat and urban area on surface urban heat island in the Yangtze River Delta urban agglomeration. Sci. Total Environ. 2016, 571, 461–470. [Google Scholar] [CrossRef]
- Zhou, D.; Li, D.; Sun, G.; Zhang, L.; Liu, Y.; Hao, L. Contrasting effects of urbanization and agriculture on surface temperature in eastern China. J. Geophys. Res. Atmos. 2016, 121, 9597–9606. [Google Scholar] [CrossRef]
- Chapman, S.; Watson, J.E.; Salazar, A.; Thatcher, M.; McAlpine, C.A. The impact of urbanization and climate change on urban temperatures: A systematic review. Landsc. Ecol. 2017, 32, 1921–1935. [Google Scholar] [CrossRef]
- Li, X.; Zhou, Y.; Asrar, G.R.; Imhoff, M.; Li, X. The surface urban heat island response to urban expansion: A panel analysis for the conterminous United States. Sci. Total Environ. 2017, 605, 426–435. [Google Scholar] [CrossRef]
- Zhou, D.; Bonafoni, S.; Zhang, L.; Wang, R. Remote sensing of the urban heat island effect in a highly populated urban agglomeration area in East China. Sci. Total Environ. 2018, 628, 415–429. [Google Scholar] [CrossRef]
- Xu, Y.; Liu, Y. Monitoring the Near-surface Urban Heat Island in Beijing, China by Satellite Remote Sensing. Geophys. Res. 2015, 53, 16–25. [Google Scholar] [CrossRef]
- Xu, Y.; Qin, Z.; Shen, Y. Estimation of near surface air temperature from MODIS data in the Yangtze River Delta. Trans. Chin. Soc. Agric. Eng. 2011, 27, 63–68. [Google Scholar] [CrossRef]
- Zhu, W.; Lű, A.; Jia, S. Estimation of daily maximum and minimum air temperature using MODIS land surface temperature products. Remote Sens. Environ. 2013, 130, 62–73. [Google Scholar] [CrossRef]
- Zhang, R.; Rong, Y.; Tian, J.; Su, H.; Li, Z.; Liu, S. A remote sensing method for estimating surface air temperature and surface vapor pressure on a regional scale. Remote Sens. 2015, 7, 6005–6025. [Google Scholar] [CrossRef]
- Nichol, J.; Hang, T.; Ng, E. Temperature projection in a tropical city using remote sensing and dynamic modeling. Clim. Dyn. 2014, 42, 2921–2929. [Google Scholar] [CrossRef]
- Shi, Y.; Jiang, Z.; Dong, L.; Shen, S. Statistical estimation of high-resolution surface air temperature from MODIS over the Yangtze River Delta, China. J. Meteorol. Res. 2017, 31, 448–454. [Google Scholar] [CrossRef]
- Venter, Z.S.; Brousse, O.; Esau, I.; Meier, F. Hyperlocal mapping of urban air temperature using remote sensing and crowdsourced weather data. Remote Sens. Environ. 2020, 242, 111791. [Google Scholar] [CrossRef]
- Shen, H.; Jiang, Y.; Li, T.; Cheng, Q.; Zeng, C.; Zhang, L. Deep learning-based air temperature mapping by fusing remote sensing, station, simulation and socioeconomic data. Remote Sens. Environ. 2020, 240, 111692. [Google Scholar] [CrossRef]
- Yoo, C.; Im, J.; Park, S.; Quackenbush, L.J. Estimation of daily maximum and minimum air temperatures in urban landscapes using MODIS time series satellite data. ISPRS J. Photogramm. Remote Sens. 2018, 137, 149–162. [Google Scholar] [CrossRef]
- Li, L.; Zha, Y. Mapping relative humidity, average and extreme temperature in hot summer over China. Sci. Total Environ. 2018, 615, 875–881. [Google Scholar] [CrossRef] [PubMed]
- Noi, P.T.; Degener, J.; Kappas, M. Comparison of multiple linear regression, cubist regression, and random forest algorithms to estimate daily air surface temperature from dynamic combinations of MODIS LST data. Remote Sens. 2017, 9, 398. [Google Scholar] [CrossRef]
- Xu, Y.; Knudby, A.; Shen, Y.; Liu, Y. Mapping monthly air temperature in the Tibetan Plateau from MODIS data based on machine learning methods. IEEE J. Sel. Top. Appl. Earth Obs. Remote Sens. 2018, 11, 345–354. [Google Scholar] [CrossRef]
- Zhou, B.; Rybski, D.; Kropp, J.P. On the statistics of urban heat island intensity. Geophys. Res. Lett. 2013, 40, 5486–5491. [Google Scholar] [CrossRef]
- Wang, J.; Yan, Z.; Quan, X.; Feng, J. Urban warming in the 2013 summer heat wave in eastern China. Clim. Dyn. 2017, 48, 3015–3033. [Google Scholar] [CrossRef]
- Didan, K.; Munoz, A.B.; Solano, R.; Huete, A. MODIS Vegetation Index User’s Guide (MOD13 Series); Version 3.00; Vegetation Index and Phenology Lab, The University of Arizona: Tucson, AZ, USA, 2015; pp. 12–13. [Google Scholar]
- Pesaresi, M.; Ehrlich, D.; Ferri, S.; Florczyk, A.J.; Freire, S.; Halkia, S.; Julea, A.M.; Kemper, T.; Soille, P.; Syrris, V. Operating Procedure for the Production of the Global Human Settlement Layer from Landsat Data of the Epochs 1975, 1990, 2000, and 2014; Publications Office of the European Union: Luxembourg, 2016. [CrossRef]
- NASA/METI/AIST/Japan Spacesystems; U.S./Japan ASTER Science Team. ASTER Global Digital Elevation Model V003; NASA EOSDIS Land Processes DAAC: Sioux Falls, SD, USA, 2018. [CrossRef]
- Wang, Z.; Peng, B.; Shi, J.; Wang, T. Estimating high resolution daily air temperature based on remote sensing products and climate reanalysis datasets over Glacierized Basins: A case study in the Langtang Valley, Nepal. Remote Sens. 2017, 9, 959. [Google Scholar] [CrossRef]
- Breiman, L. Random forests. Mach. Learn. 2001, 45, 5–32. [Google Scholar] [CrossRef]
- Li, L.; Huang, X.; Li, J.; Wen, D. Quantifying the spatiotemporal trends of canopy layer heat island (CLHI) and its driving factors over Wuhan, China with satellite remote sensing. Remote Sens. 2017, 9, 536. [Google Scholar] [CrossRef]
- Liu, M.; Lang, R.; Cao, Y. Number of trees in random forest. Comput. Eng. Appl. 2015, 51, 126–131. [Google Scholar] [CrossRef]
- Oshiro, T.M.; Perez, P.S.; Baranauskas, J.A. How Many Trees in a Random Forest? Machine Learning and Data Mining in Pattern Recognition; Springer: Berlin/Heidelberg, Germany, 2012; pp. 154–168. [Google Scholar]
- Grossmann, E.; Ohmann, J.; Kagan, J.; May, H.; Gregory, M. Mapping ecological systems with a random forest model: Tradeoffs between errors and bias. Gap Anal. Bull. 2010, 7, 16–22. [Google Scholar]

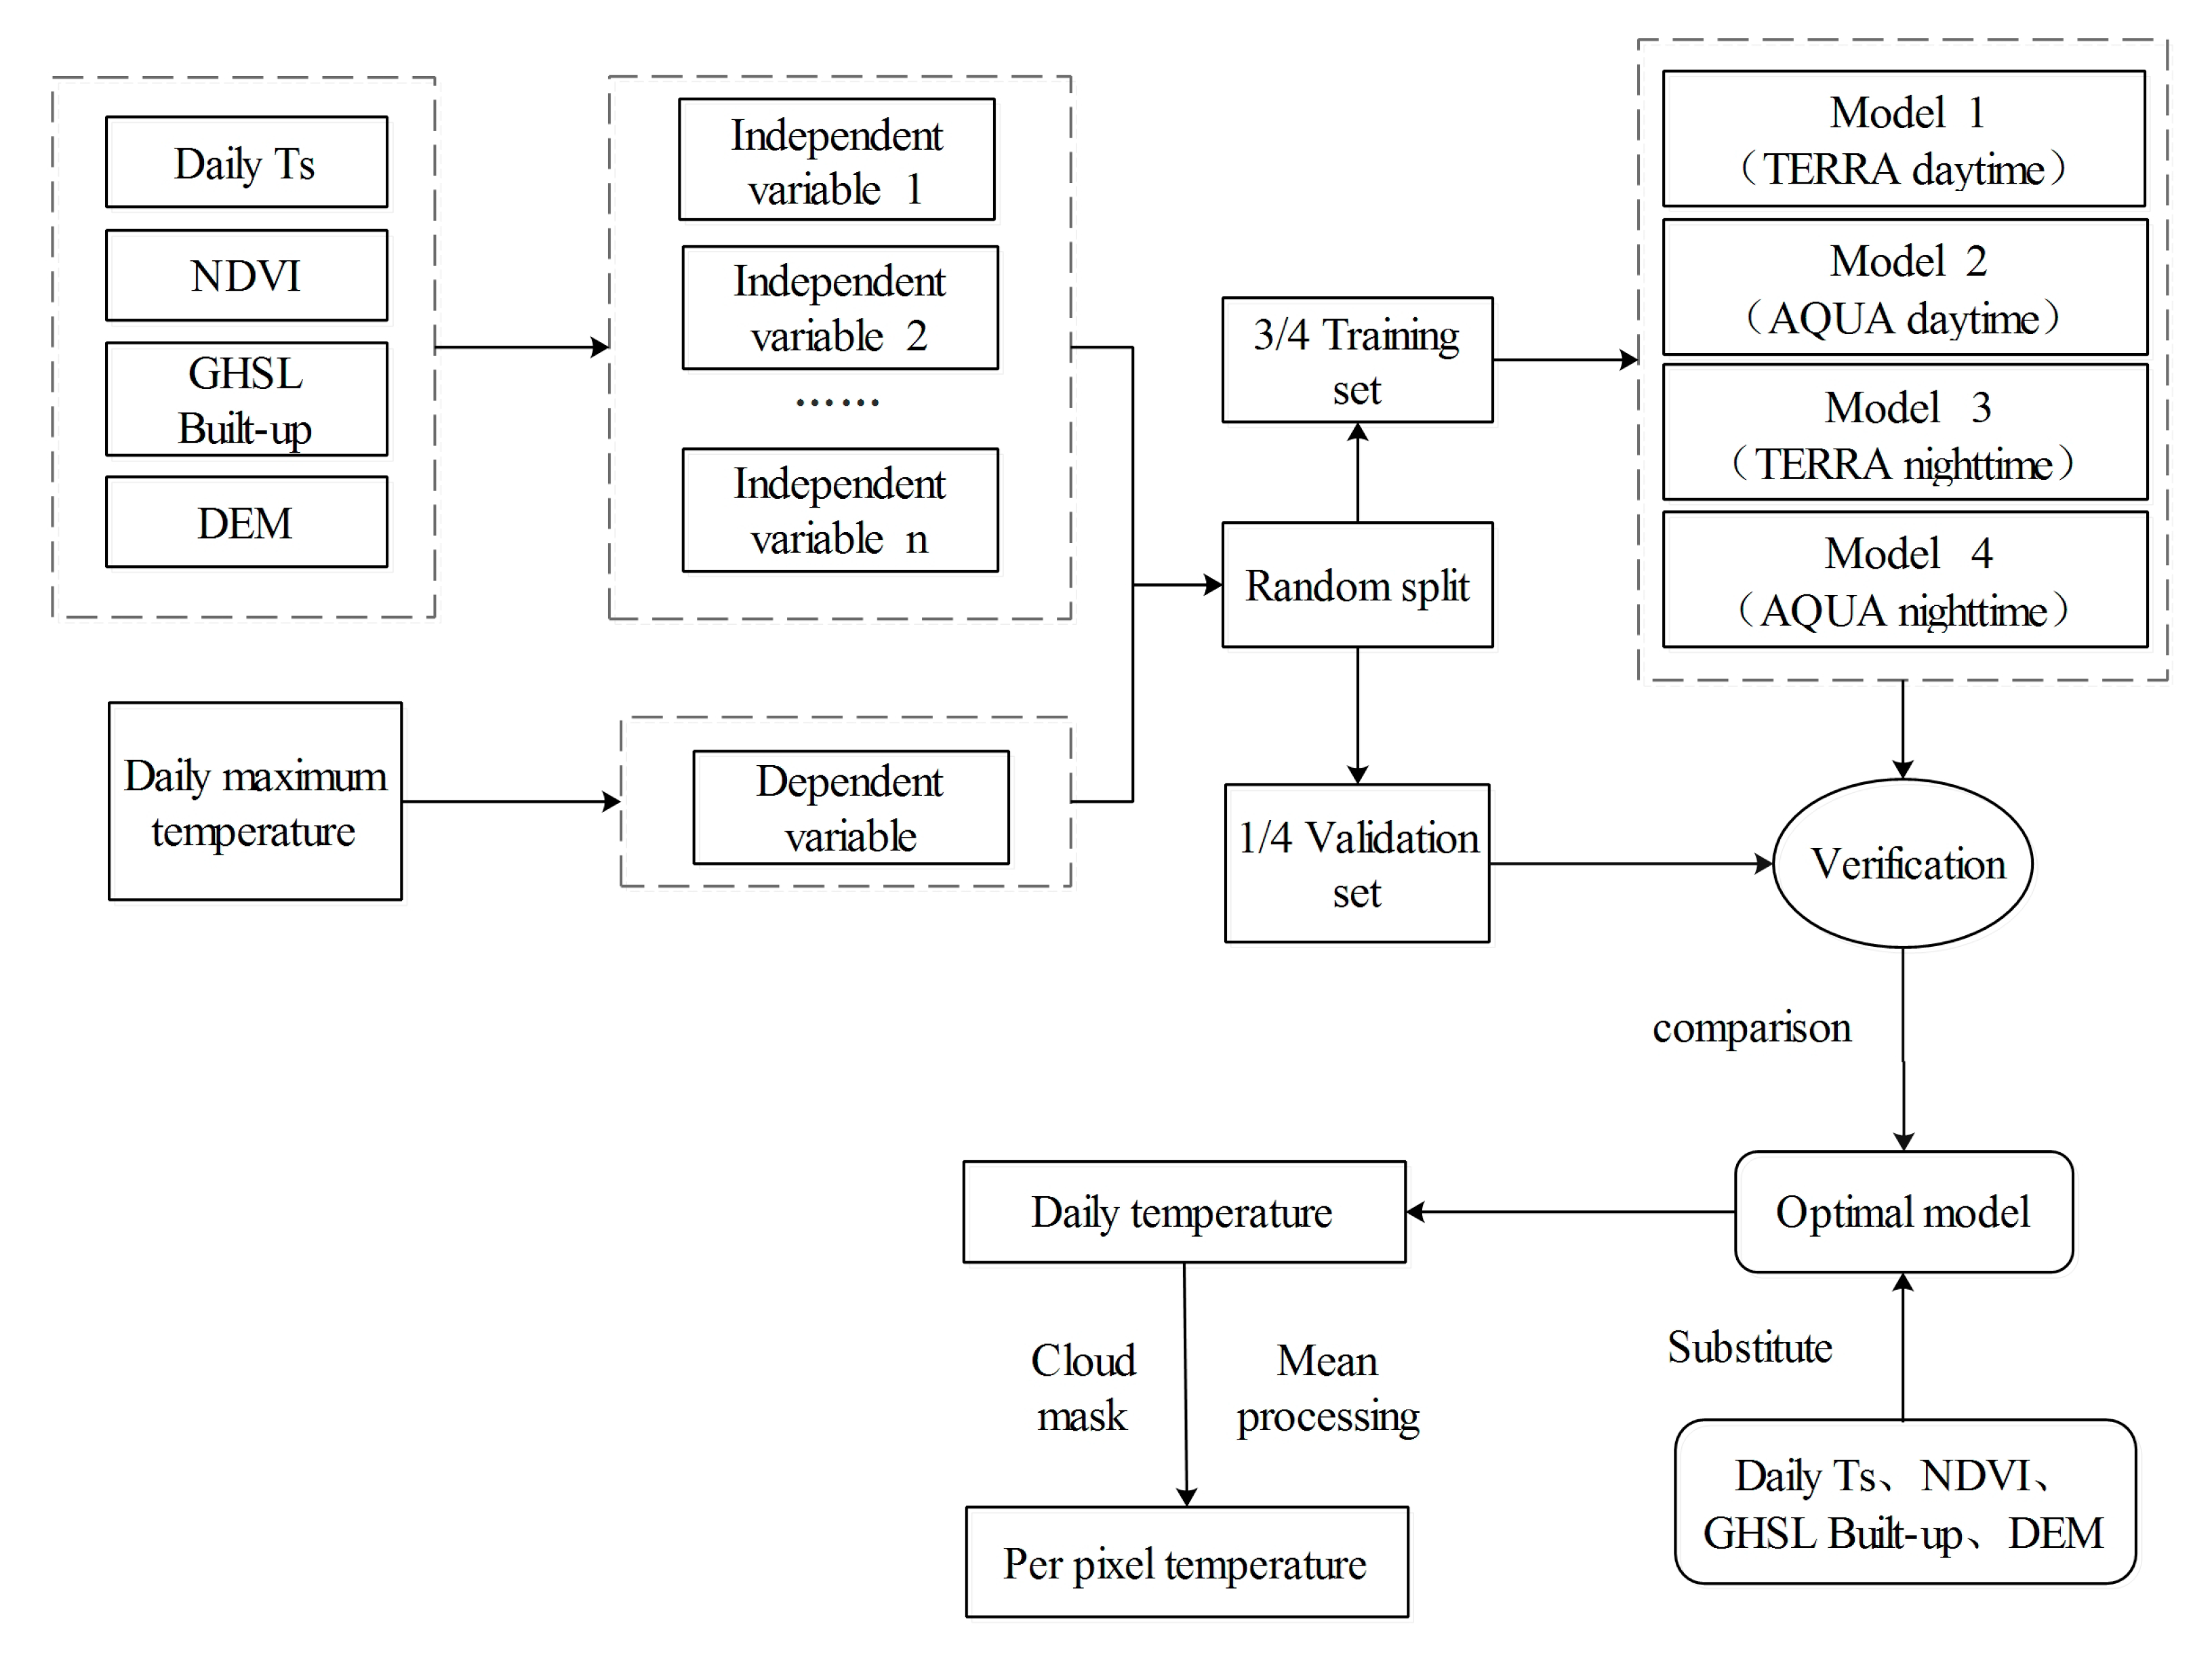
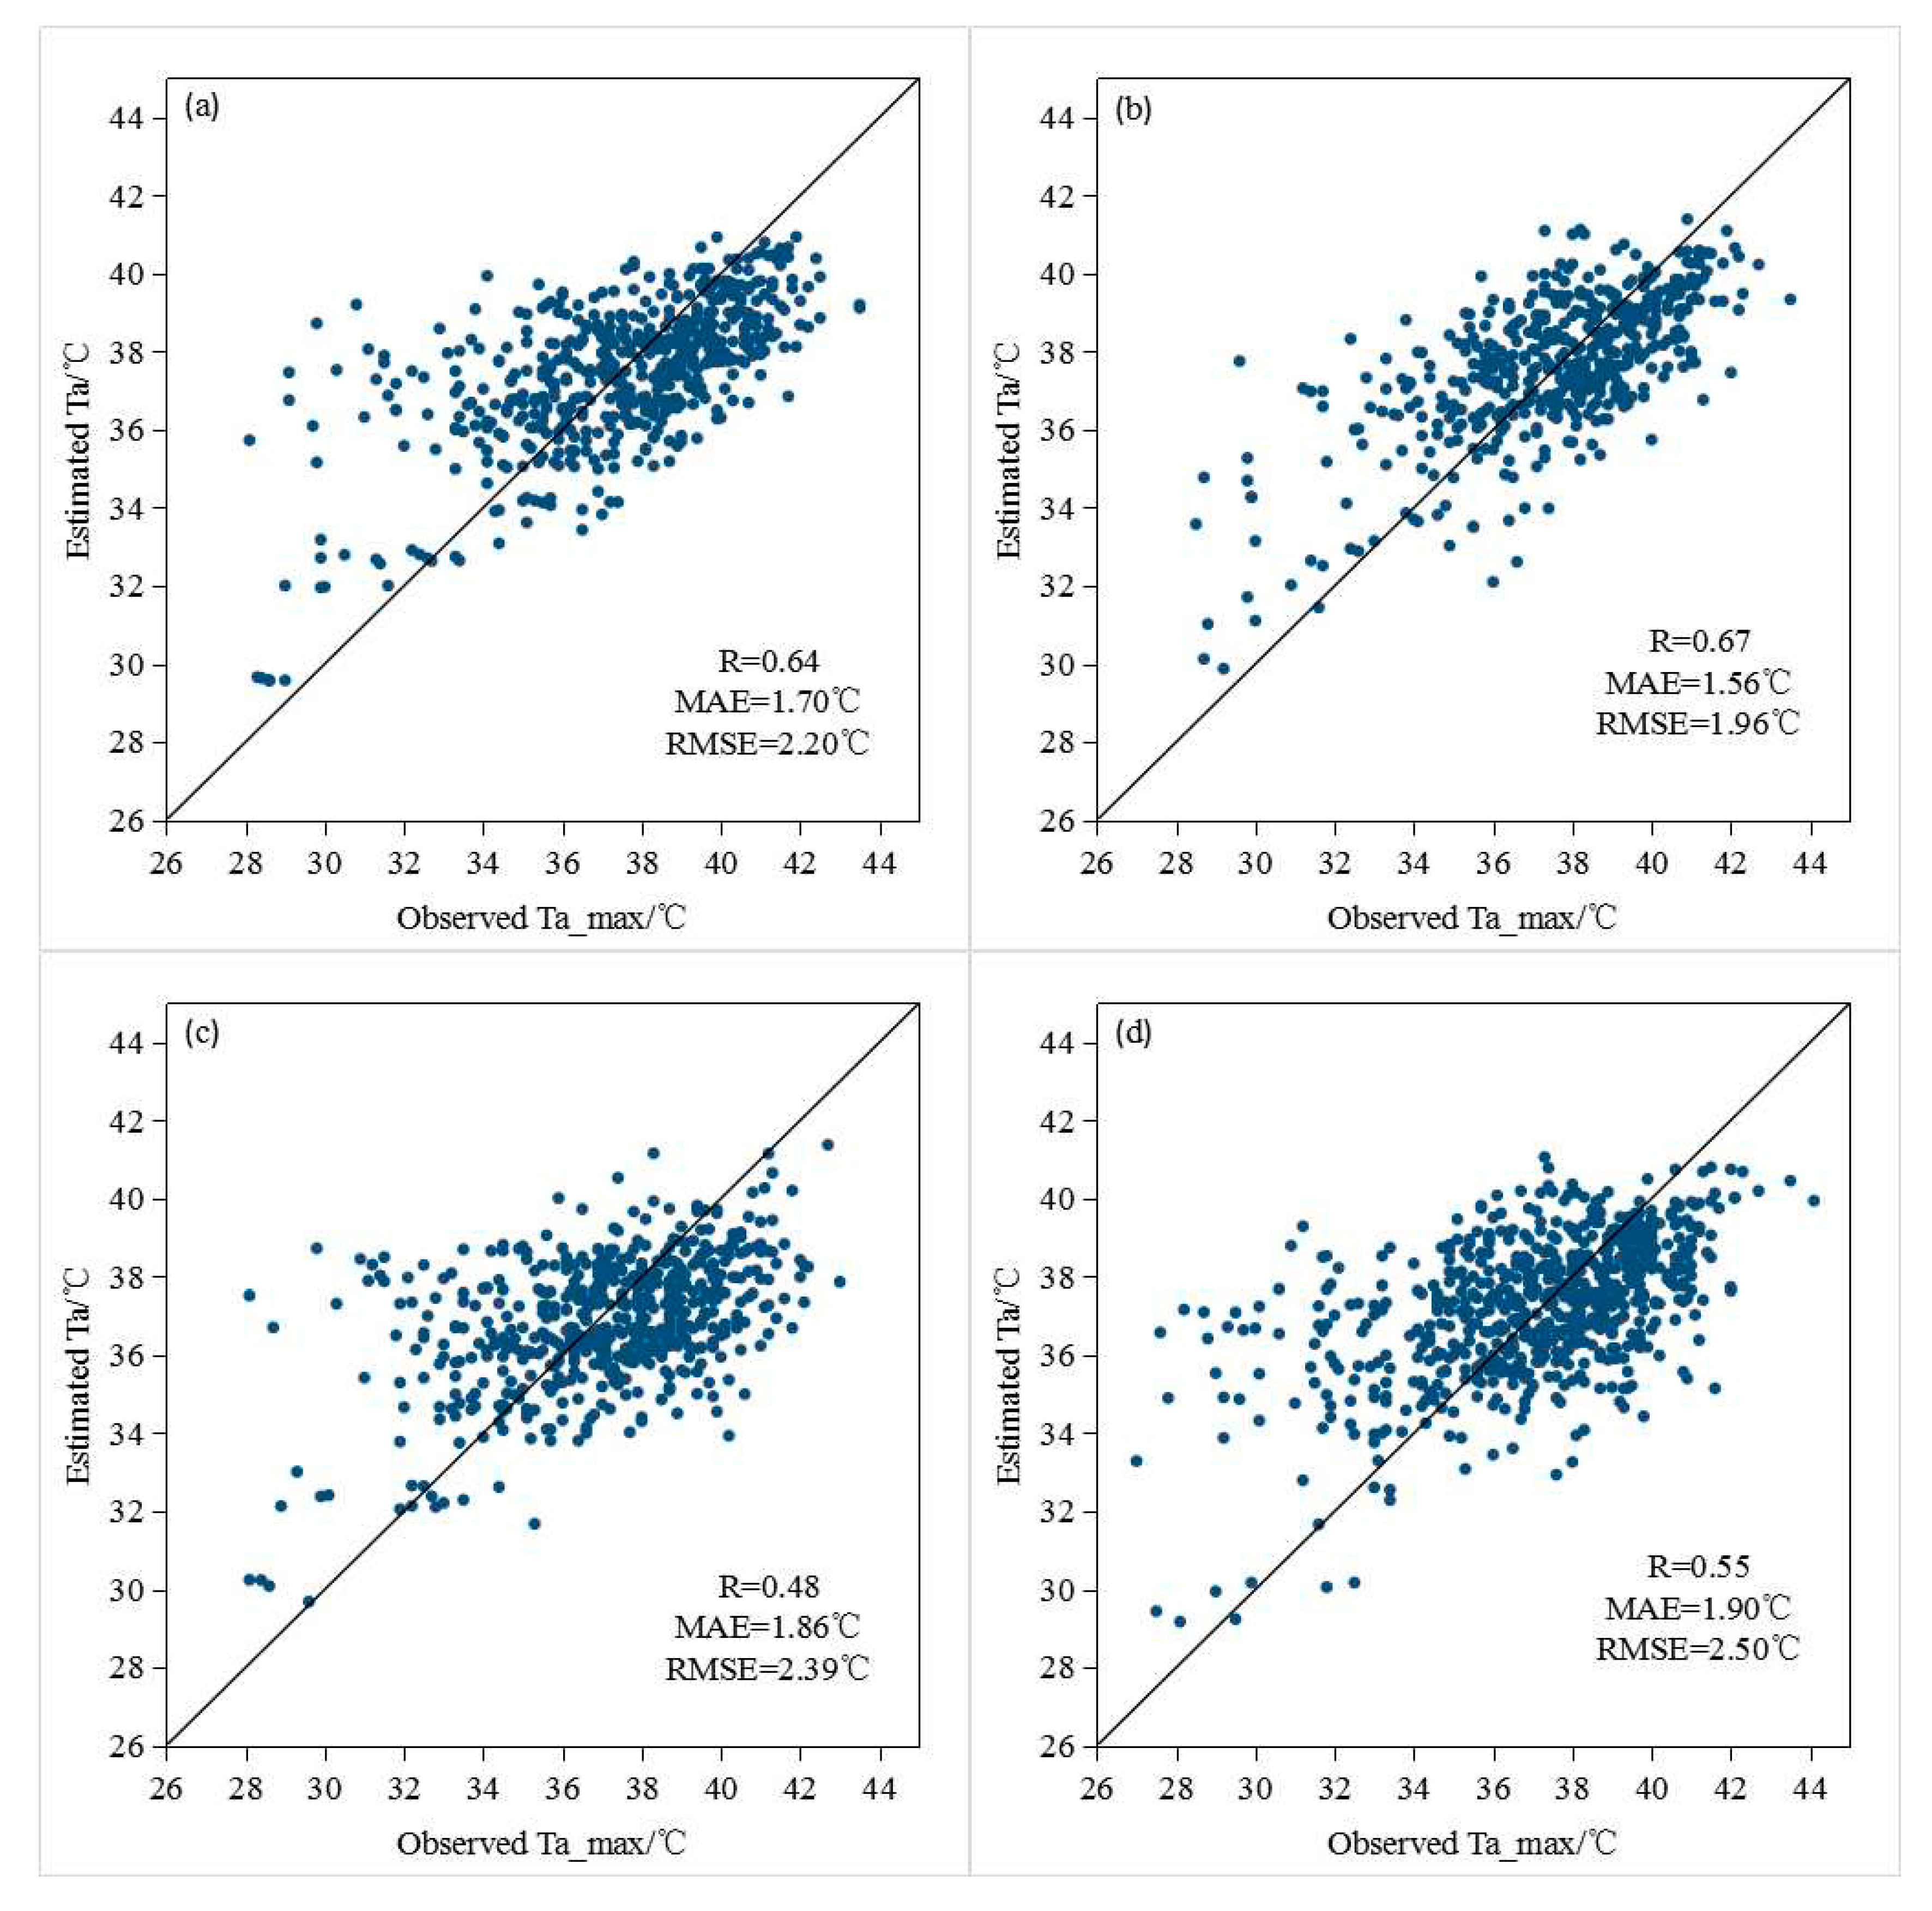
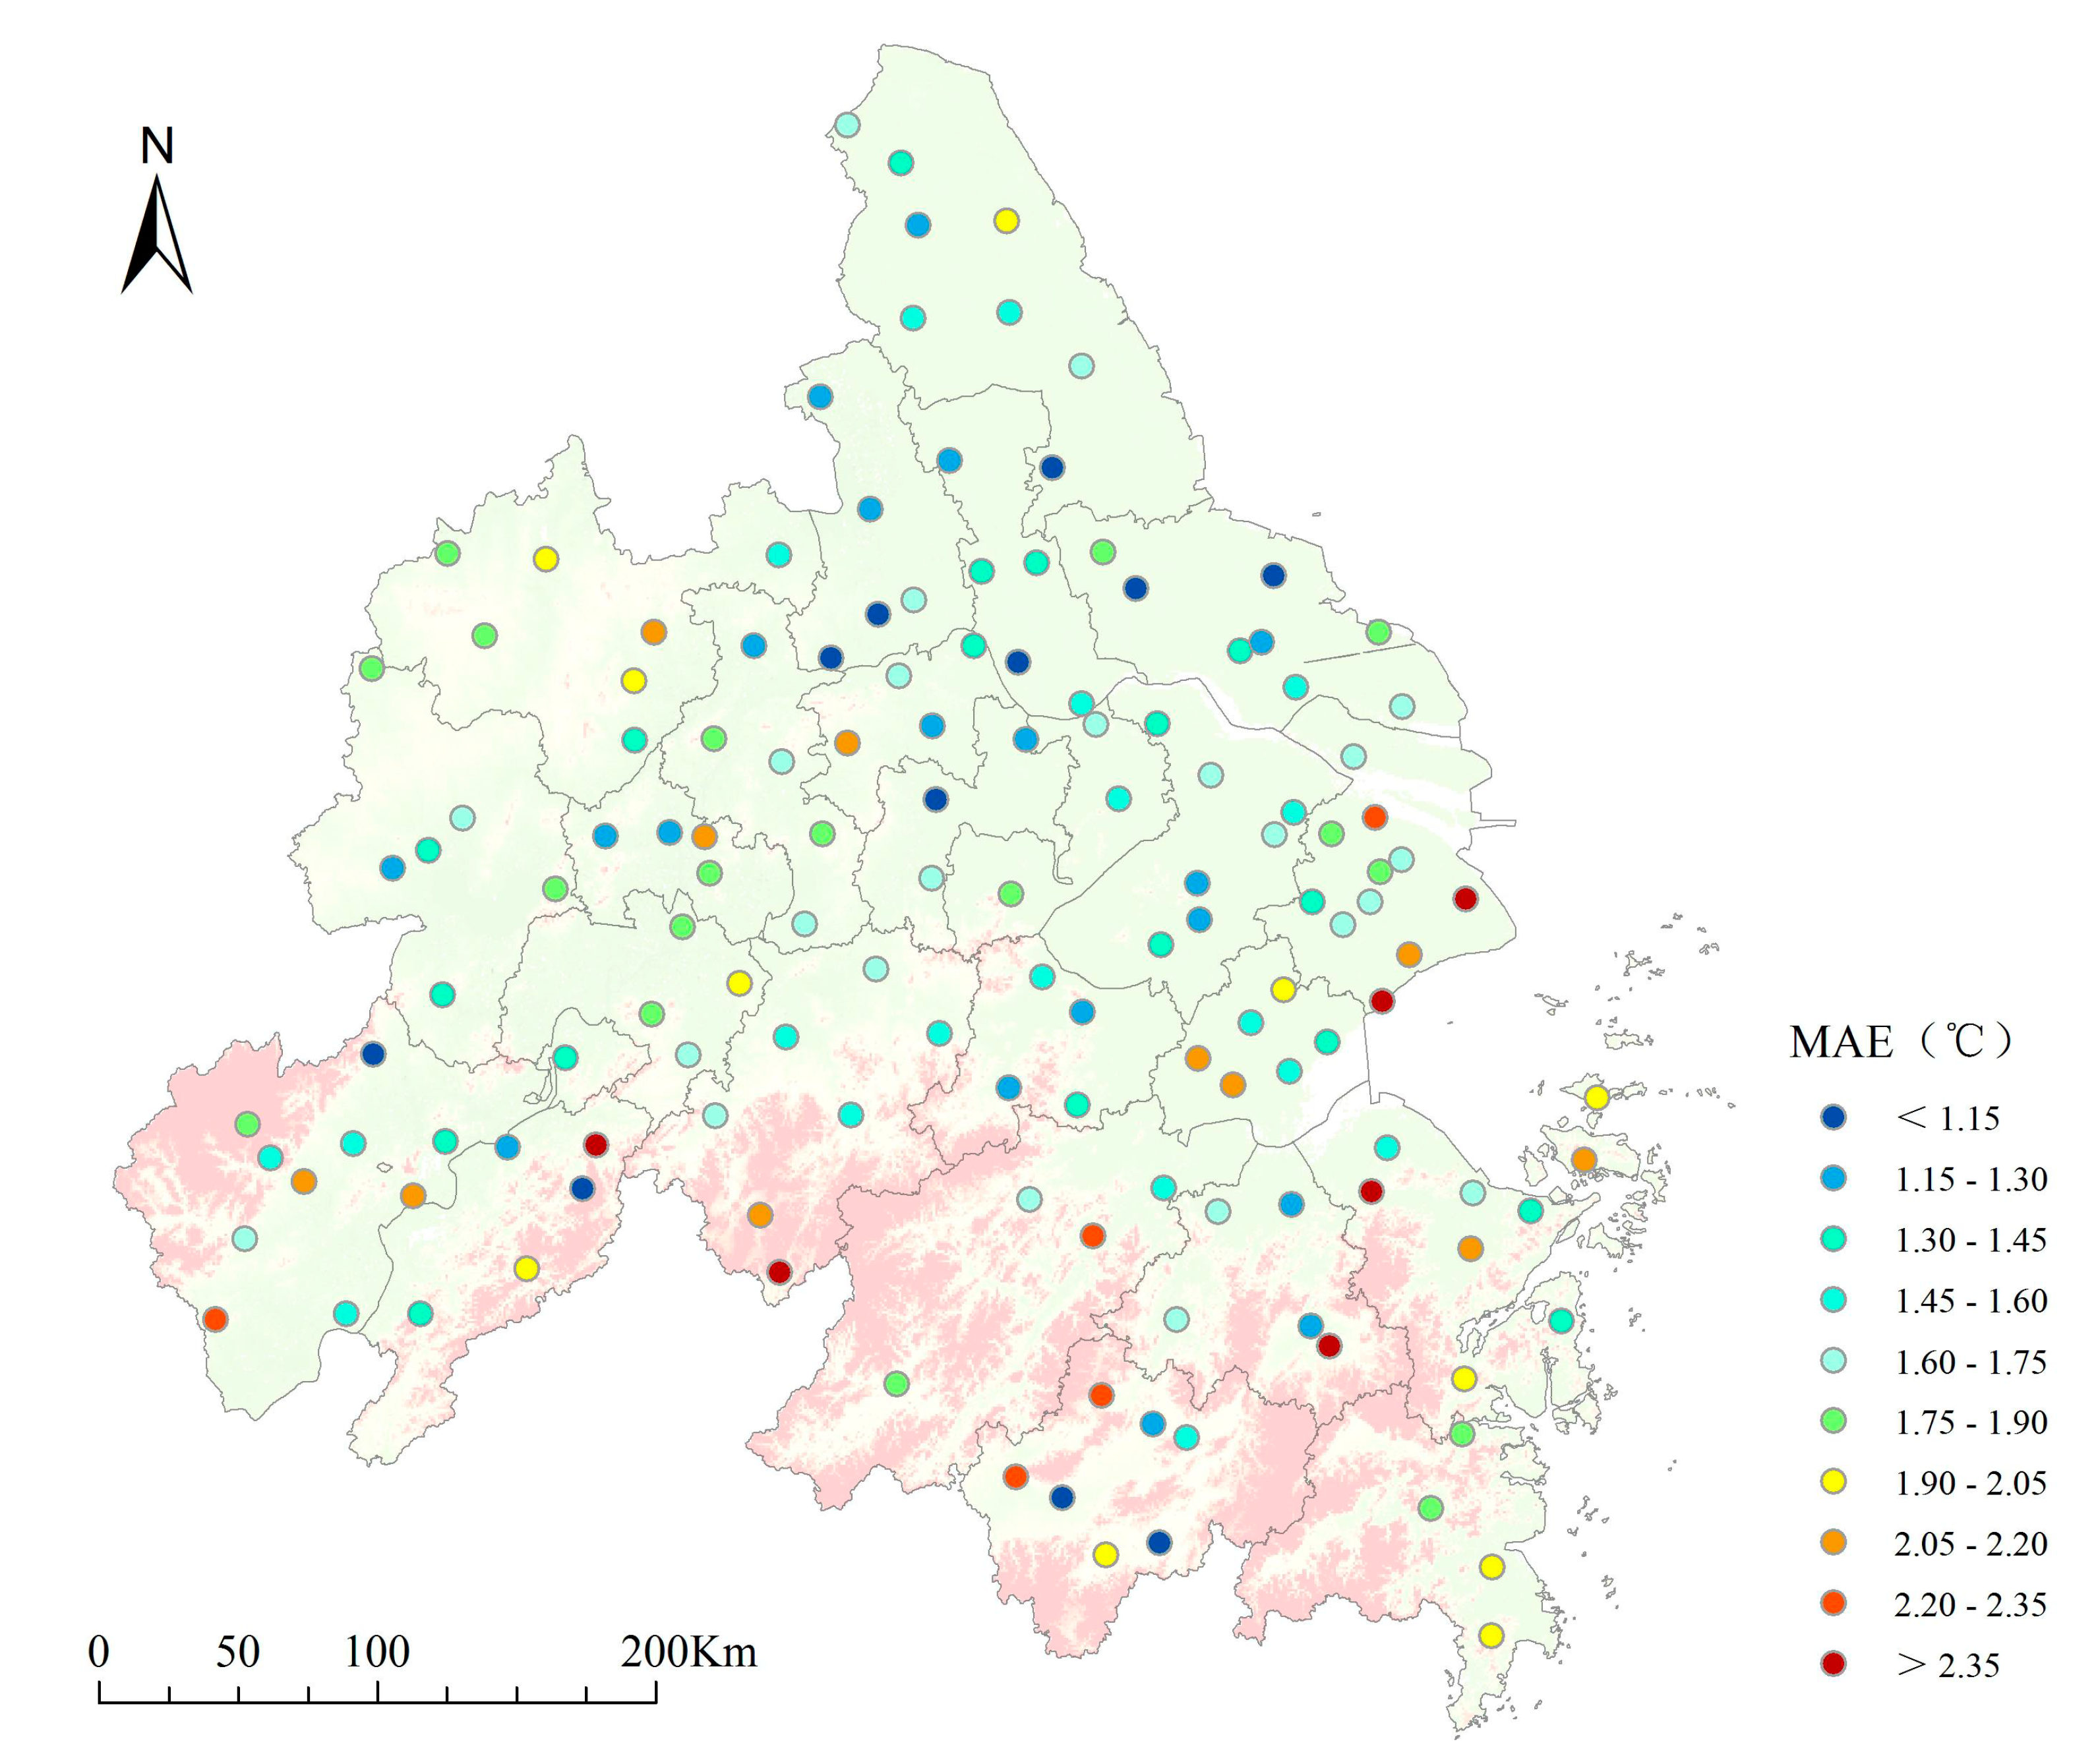
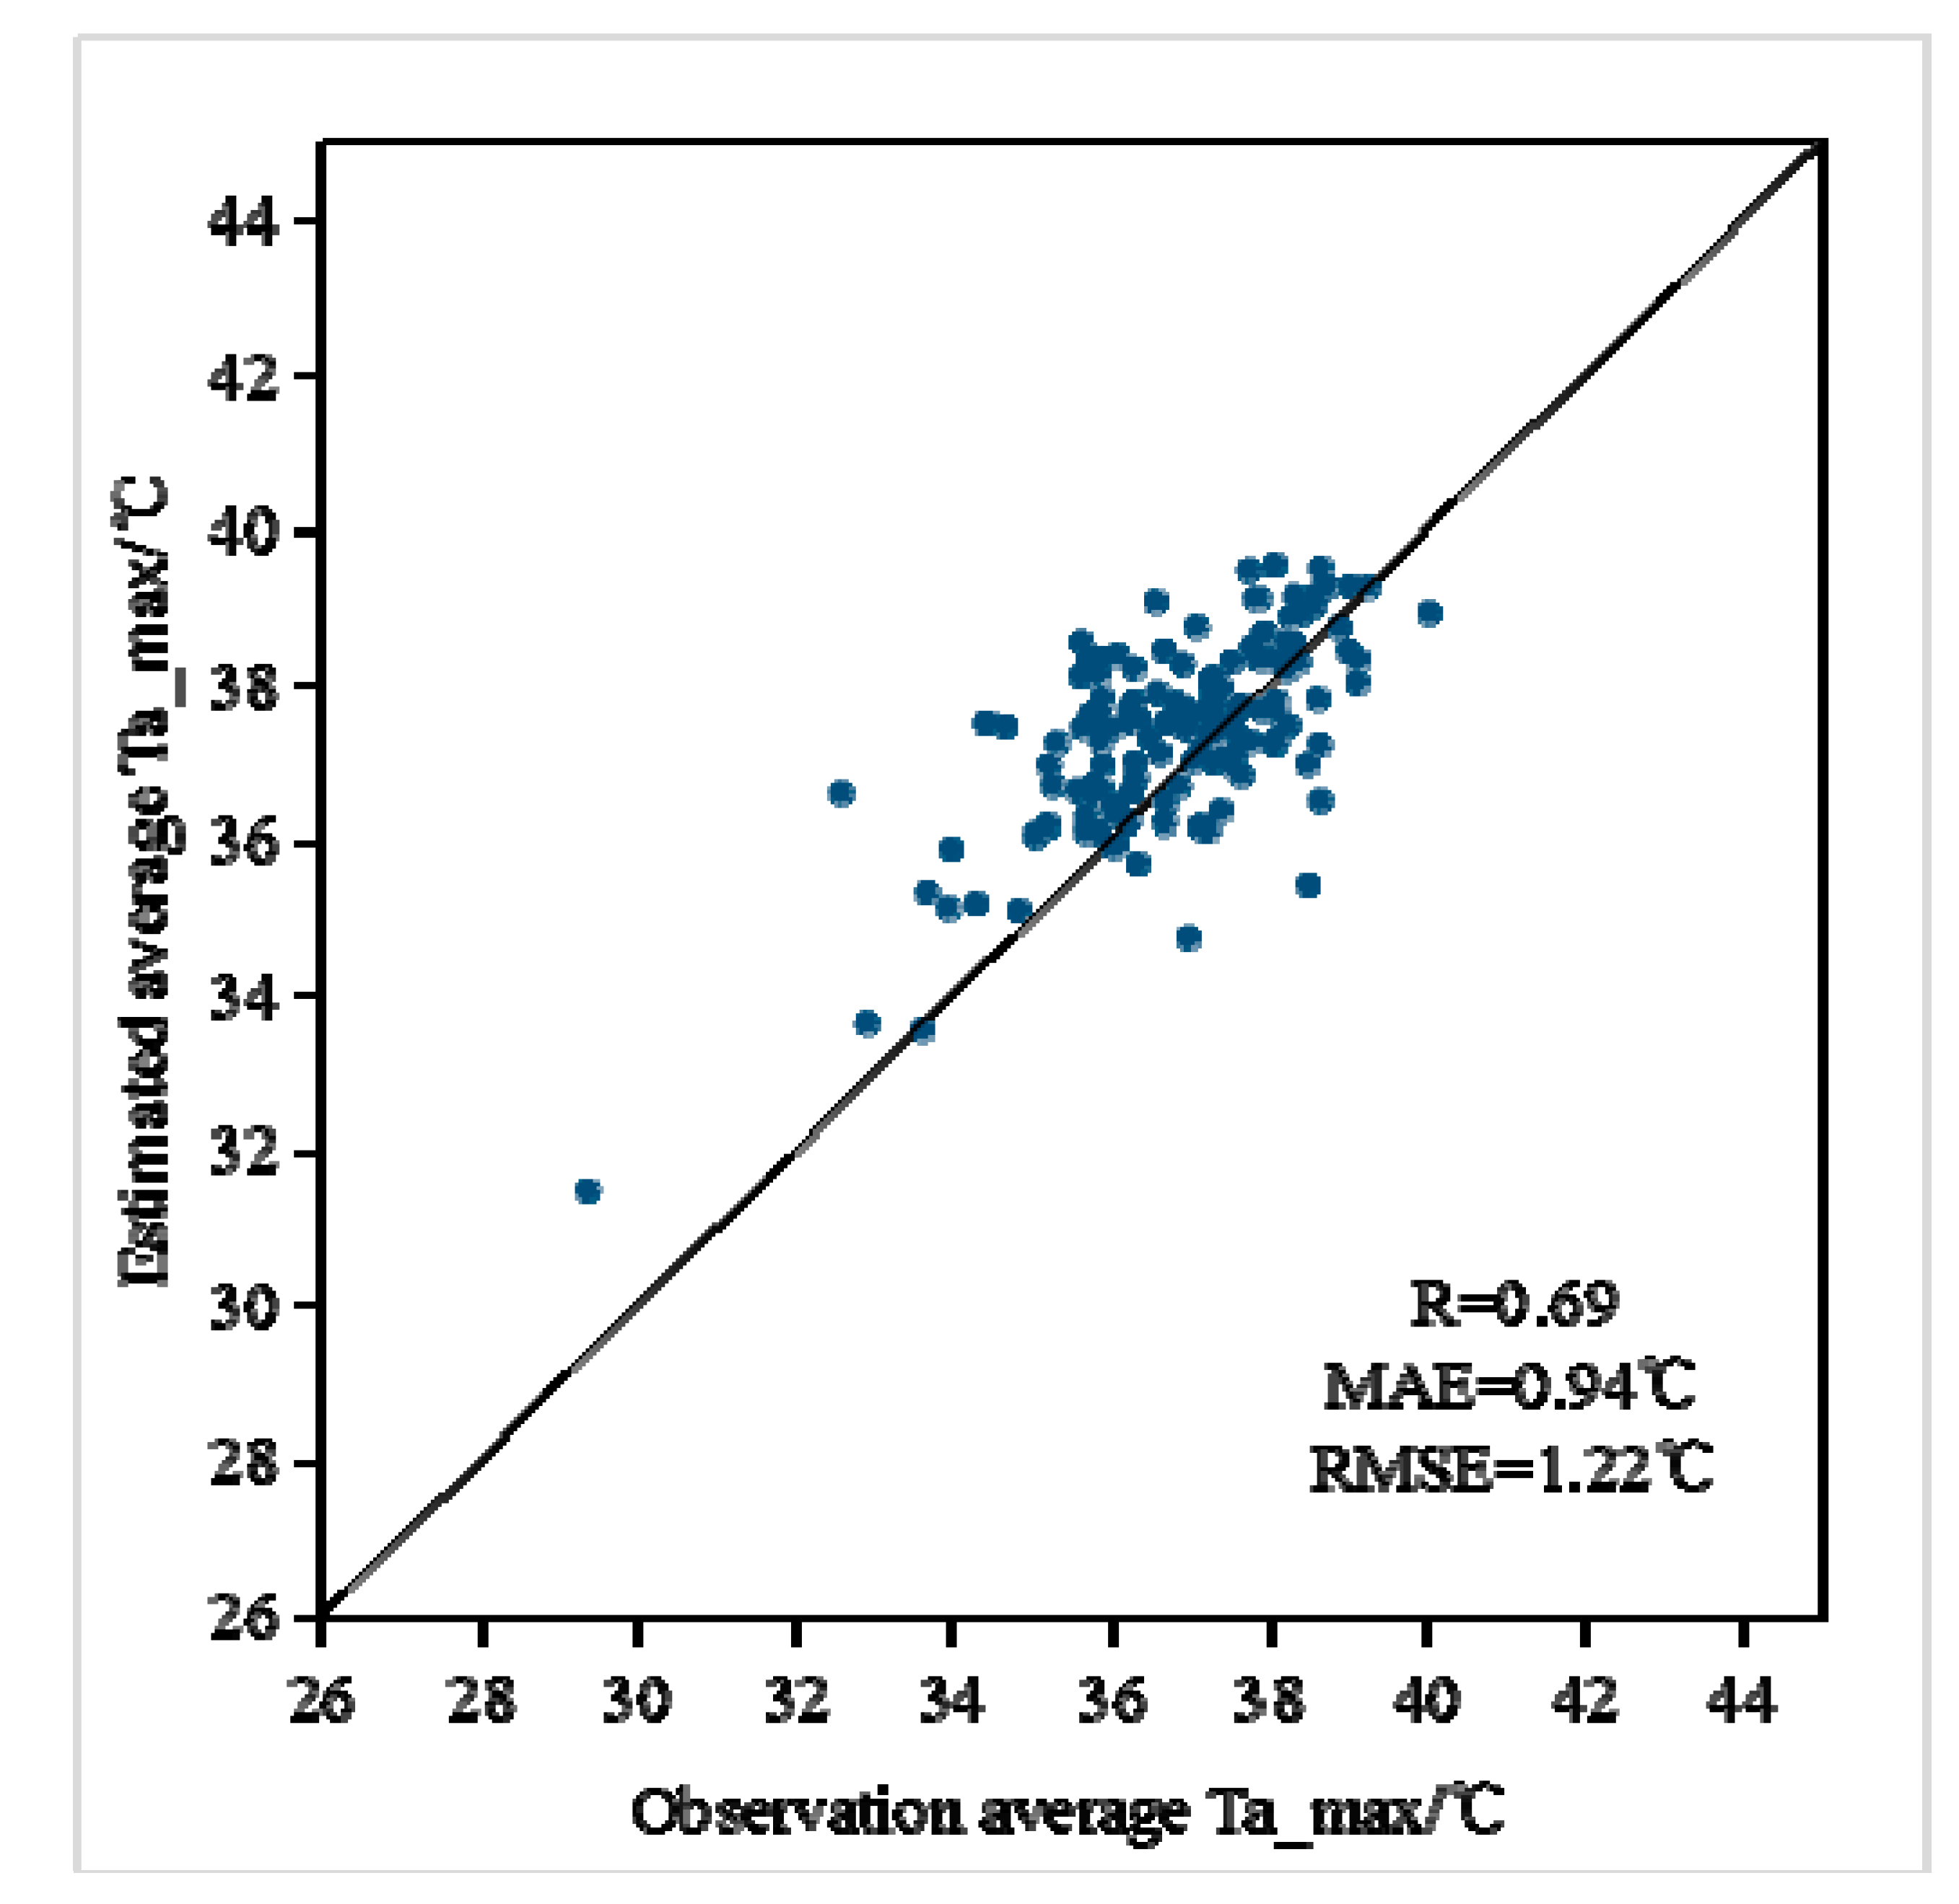
| Model | Independent Variables |
|---|---|
| Model 1 | TERRA daytime land surface temperature (Ts), normalized difference vegetation index (NDVI), built-up area, altitude |
| Model 2 | AQUA daytime Ts, NDVI, built-up area, altitude |
| Model 3 | TERRA nighttime Ts, NDVI, built-up area, altitude |
| Model 4 | AQUA nighttime Ts, NDVI, built-up area, altitude |
| Level | Heat Intensity Index/°C |
|---|---|
| 1 | ≤0 |
| 2 | 0–0.5 |
| 3 | 0.5–1.0 |
| 4 | 1.0–1.5 |
| 5 | 1.5–2.0 |
| 6 | 2.0–2.5 |
| 7 | ≥2.5 |
| Variable | %IncMSE |
|---|---|
| Ts | 49.48 |
| NDVI | 27.35 |
| built-up area | 26.12 |
| altitude | 25.22 |
© 2020 by the authors. Licensee MDPI, Basel, Switzerland. This article is an open access article distributed under the terms and conditions of the Creative Commons Attribution (CC BY) license (http://creativecommons.org/licenses/by/4.0/).
Share and Cite
Wu, X.; Xu, Y.; Chen, H. Study on the Spatial Pattern of an Extreme Heat Event by Remote Sensing: A Case Study of the 2013 Extreme Heat Event in the Yangtze River Delta, China. Sustainability 2020, 12, 4415. https://doi.org/10.3390/su12114415
Wu X, Xu Y, Chen H. Study on the Spatial Pattern of an Extreme Heat Event by Remote Sensing: A Case Study of the 2013 Extreme Heat Event in the Yangtze River Delta, China. Sustainability. 2020; 12(11):4415. https://doi.org/10.3390/su12114415
Chicago/Turabian StyleWu, Xiaohan, Yongming Xu, and Huijuan Chen. 2020. "Study on the Spatial Pattern of an Extreme Heat Event by Remote Sensing: A Case Study of the 2013 Extreme Heat Event in the Yangtze River Delta, China" Sustainability 12, no. 11: 4415. https://doi.org/10.3390/su12114415
APA StyleWu, X., Xu, Y., & Chen, H. (2020). Study on the Spatial Pattern of an Extreme Heat Event by Remote Sensing: A Case Study of the 2013 Extreme Heat Event in the Yangtze River Delta, China. Sustainability, 12(11), 4415. https://doi.org/10.3390/su12114415


