Method for Quantifying Supply and Demand of Construction Minerals in Urban Regions—A Case Study of Hanoi and Its Hinterland


Abstract
:
1. Introduction
2. Methodical Approach and Dataset
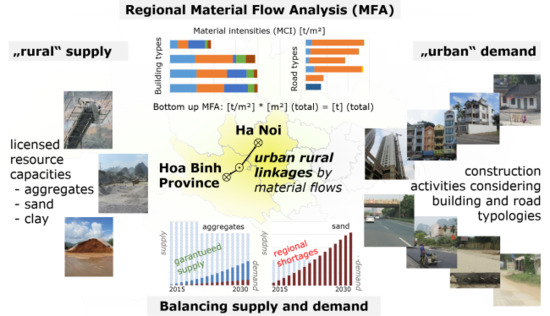
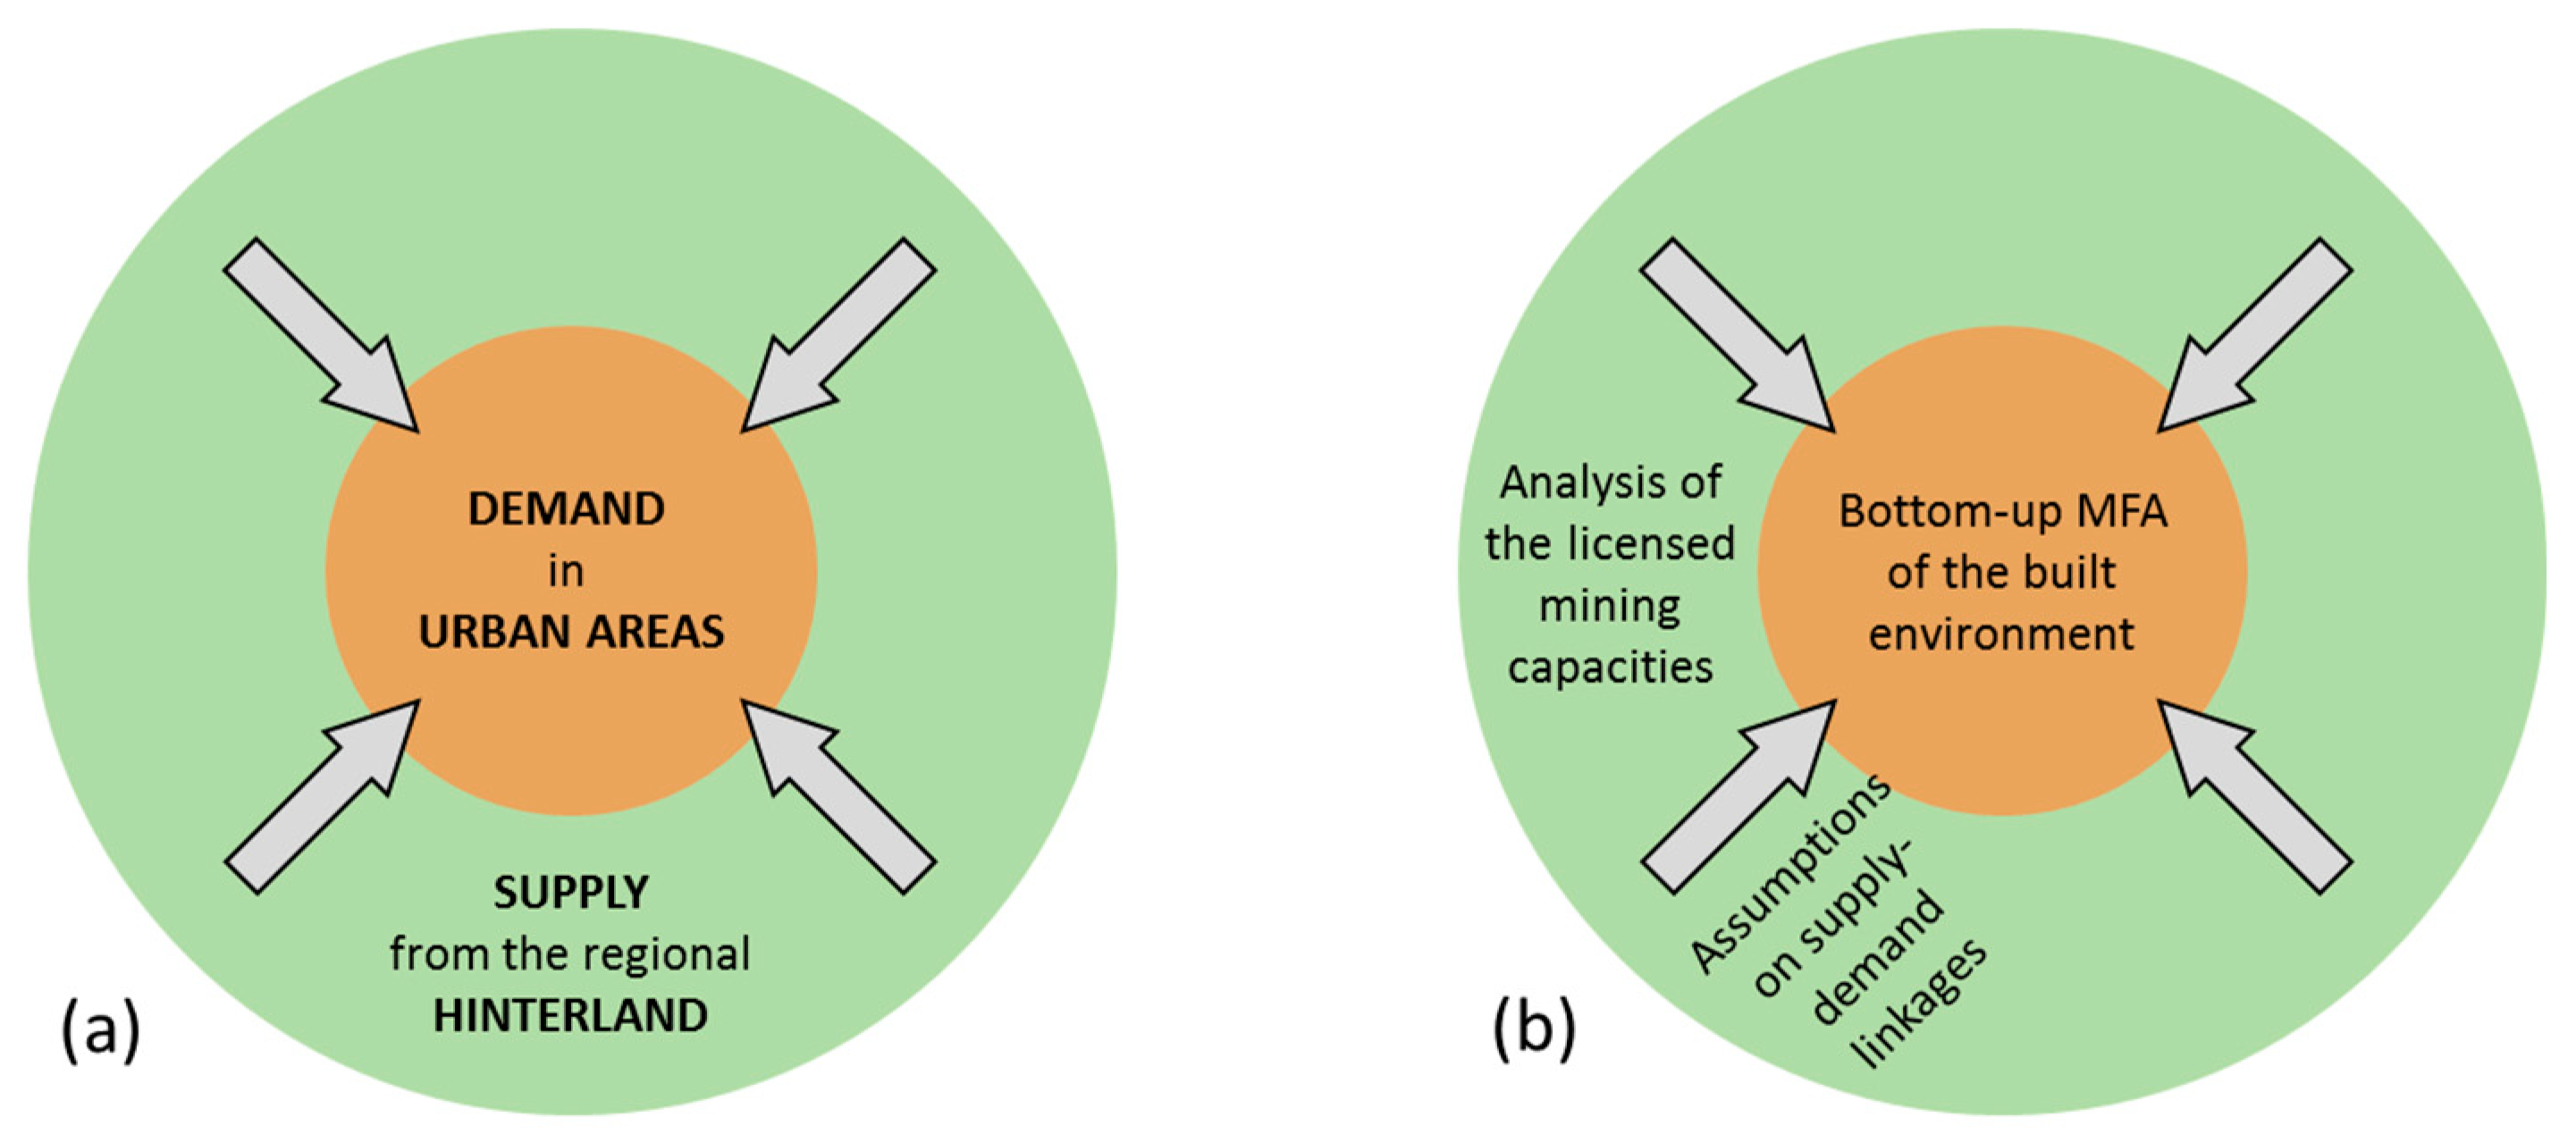
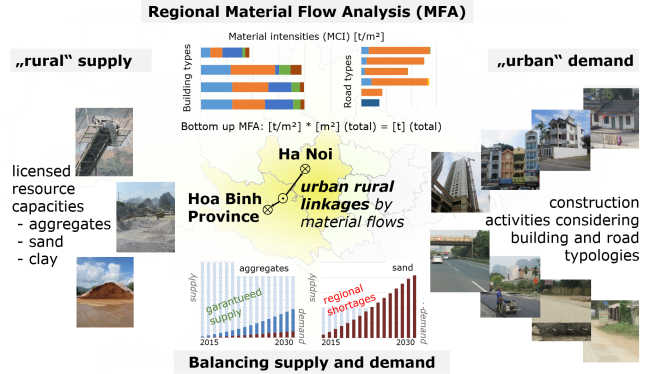
2.1. General Concept, Terms and Definitions
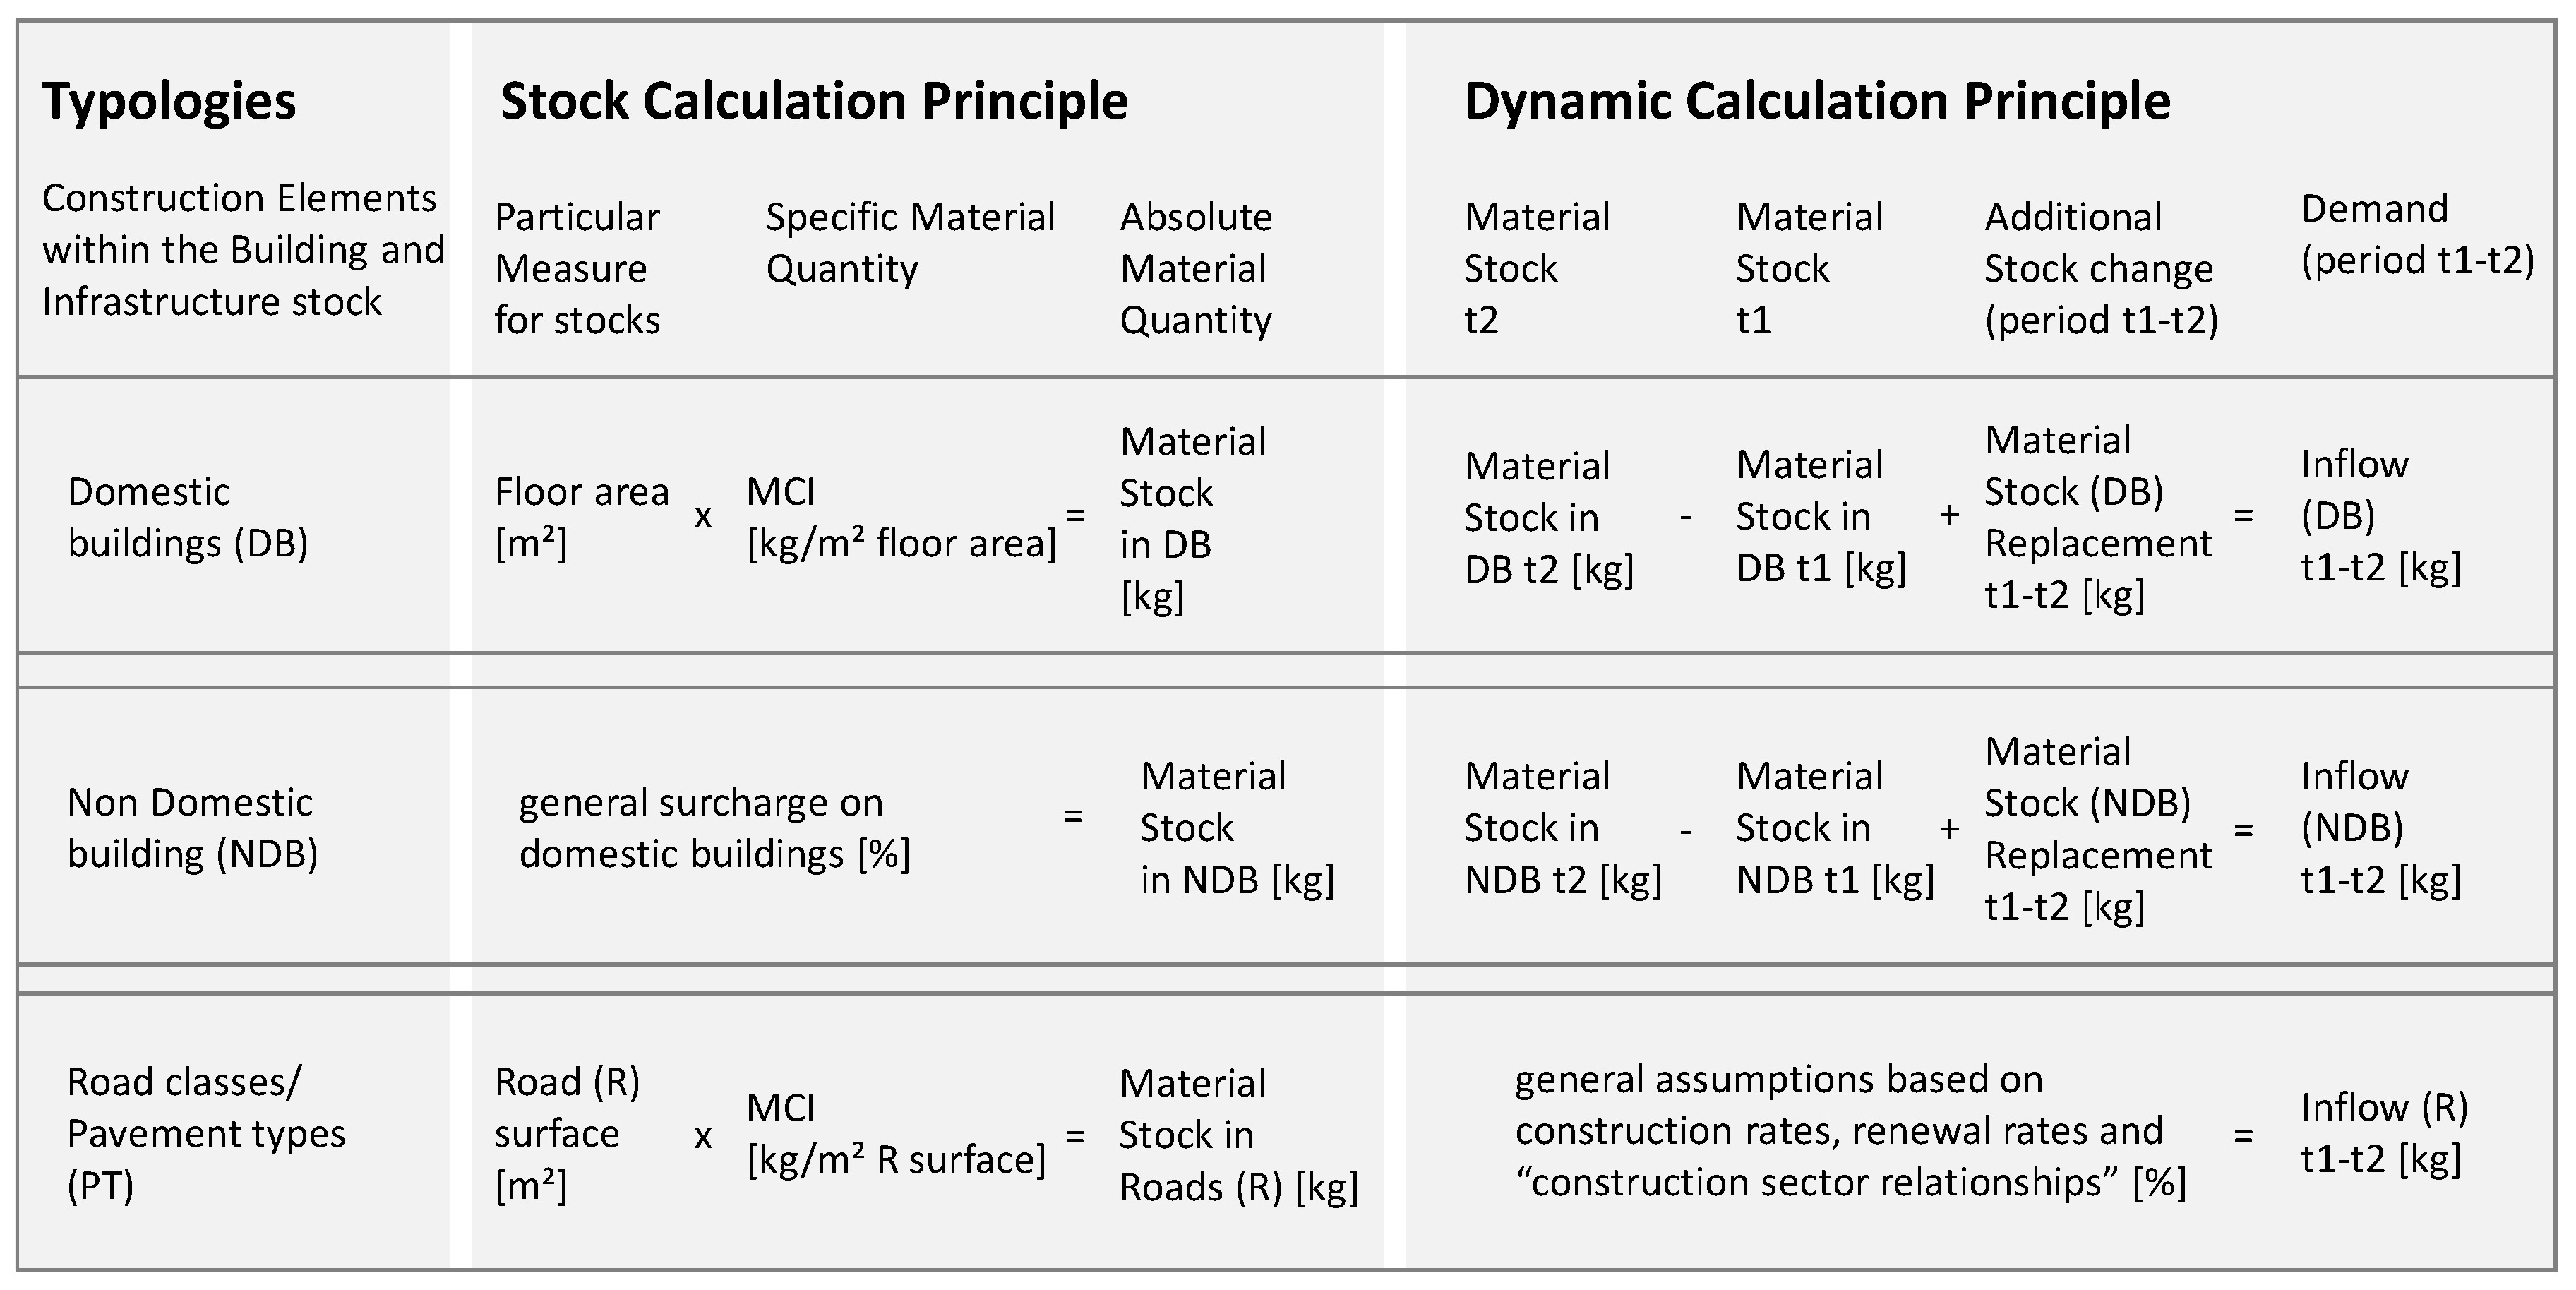
2.2. Material Flow Analysis to Calculate Material Demand for Buildings
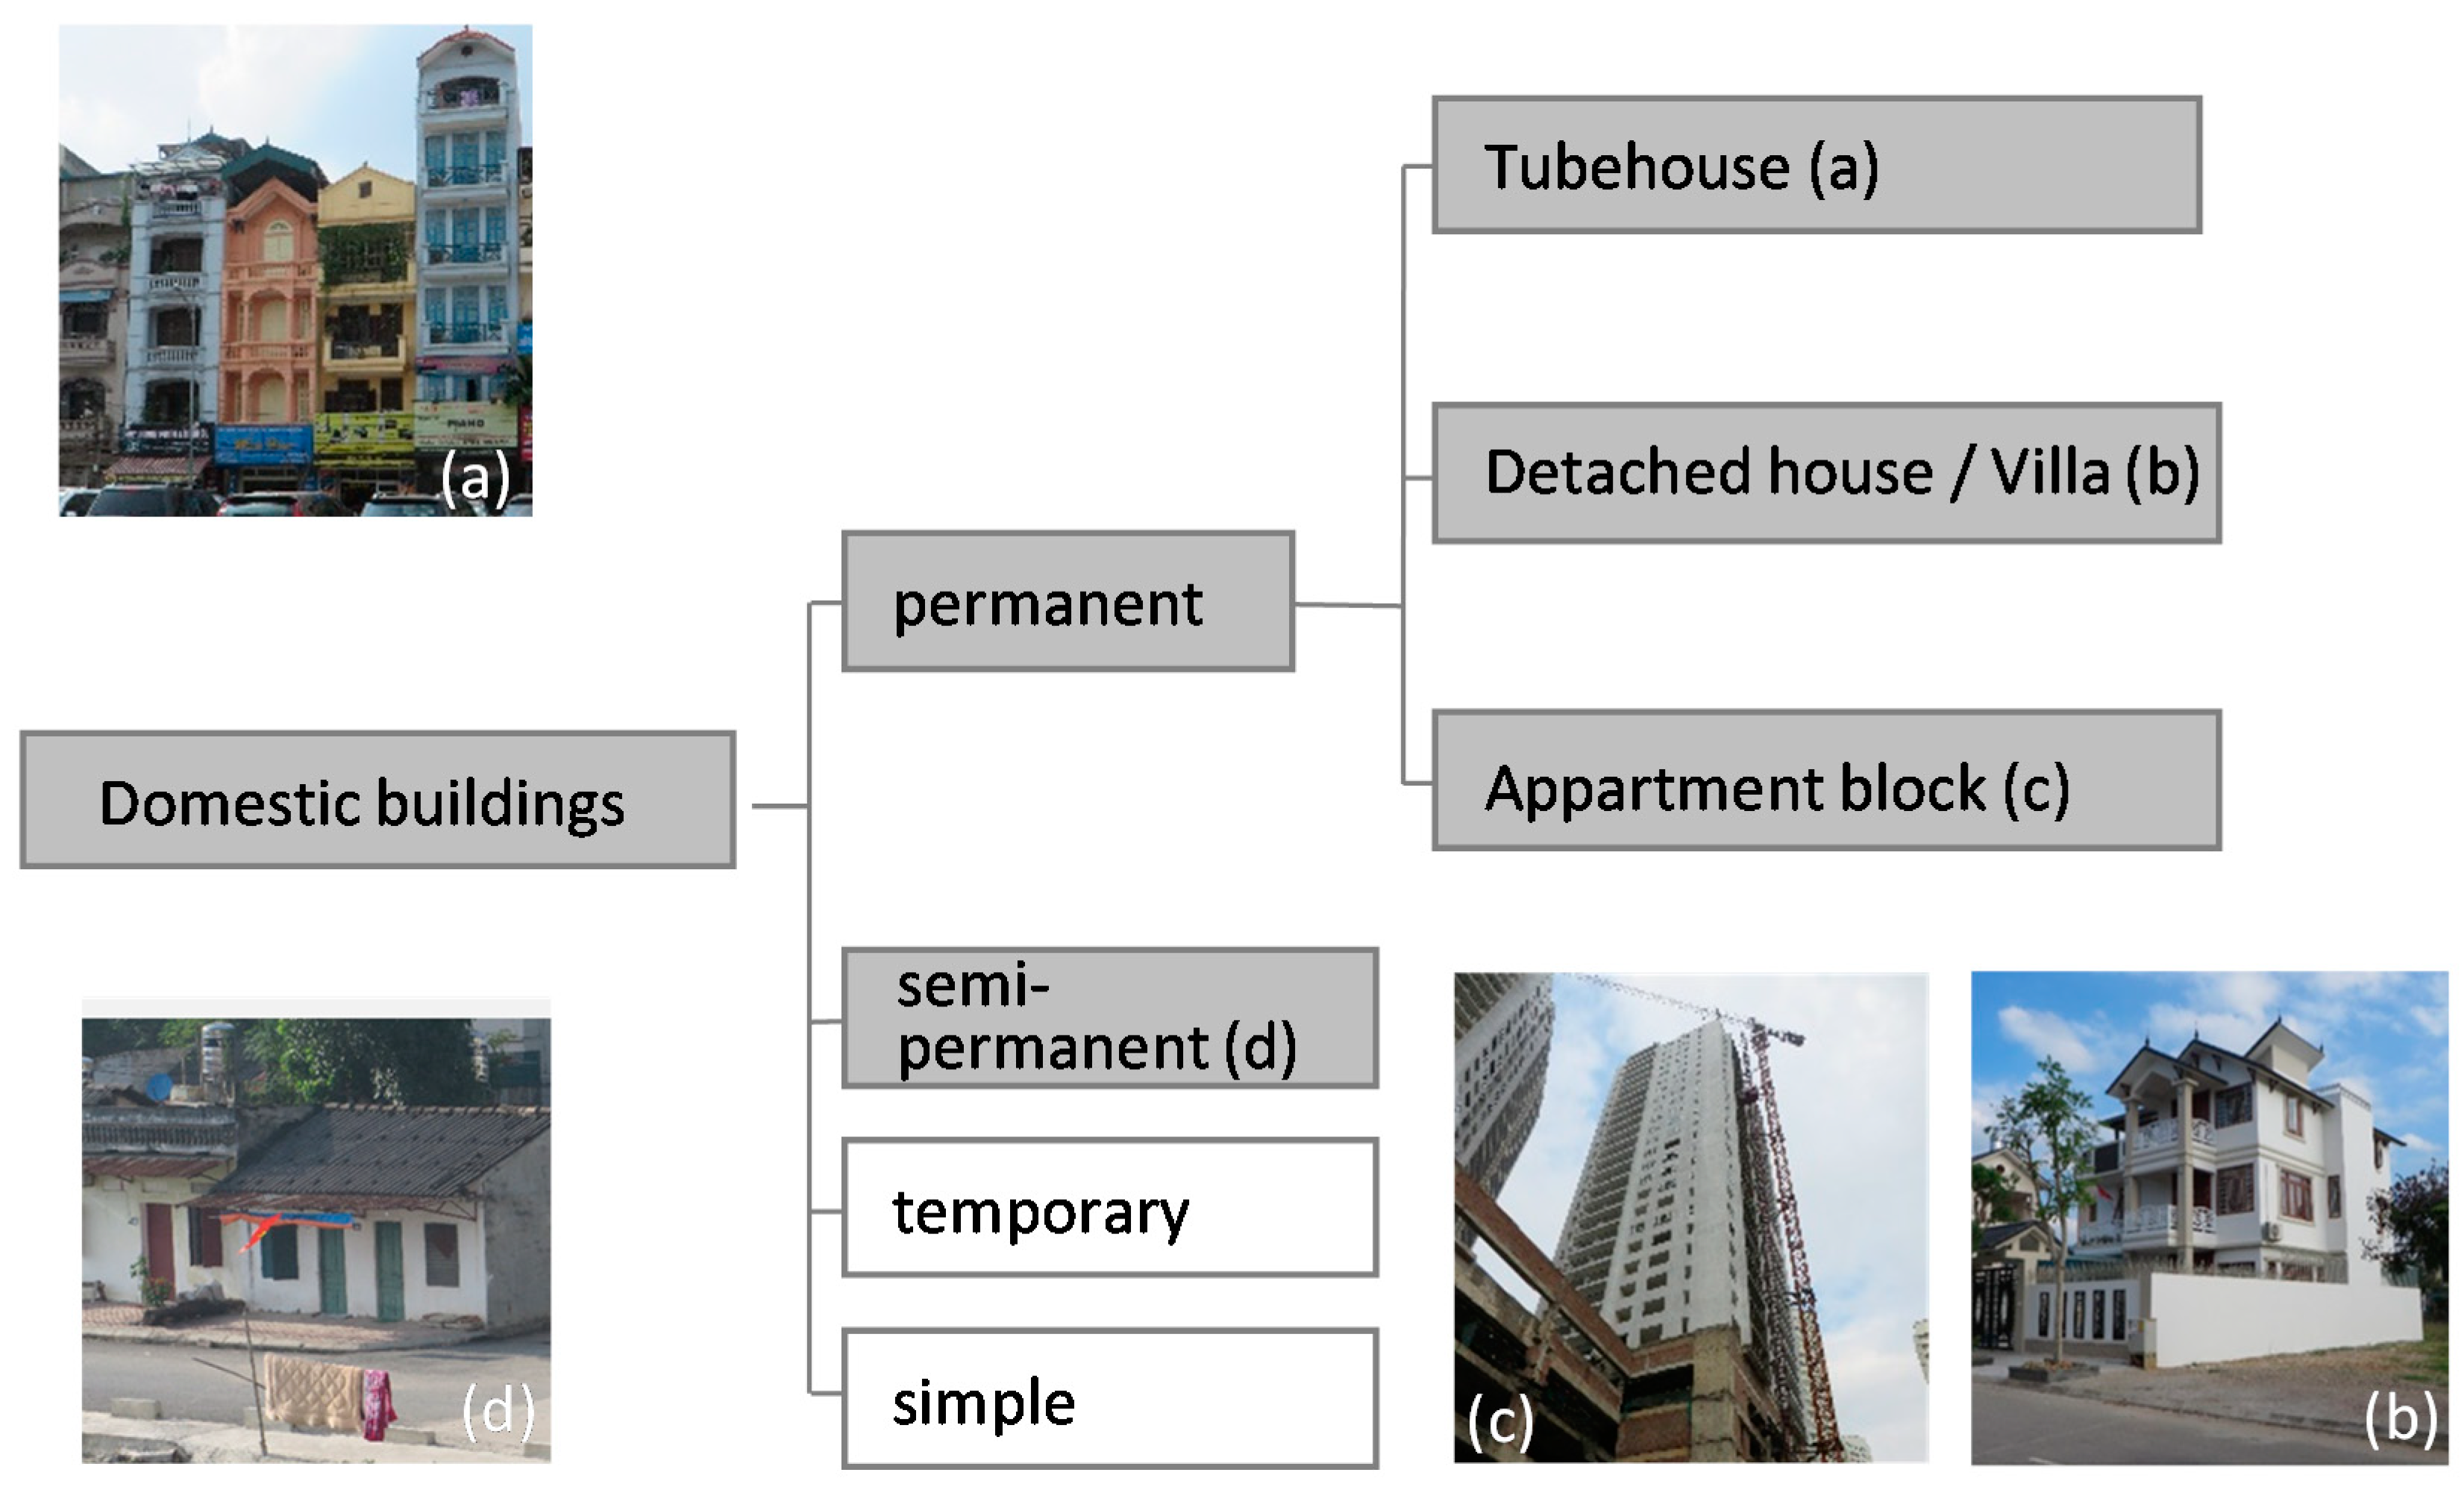
2.2.1. Typology of Domestic Buildings
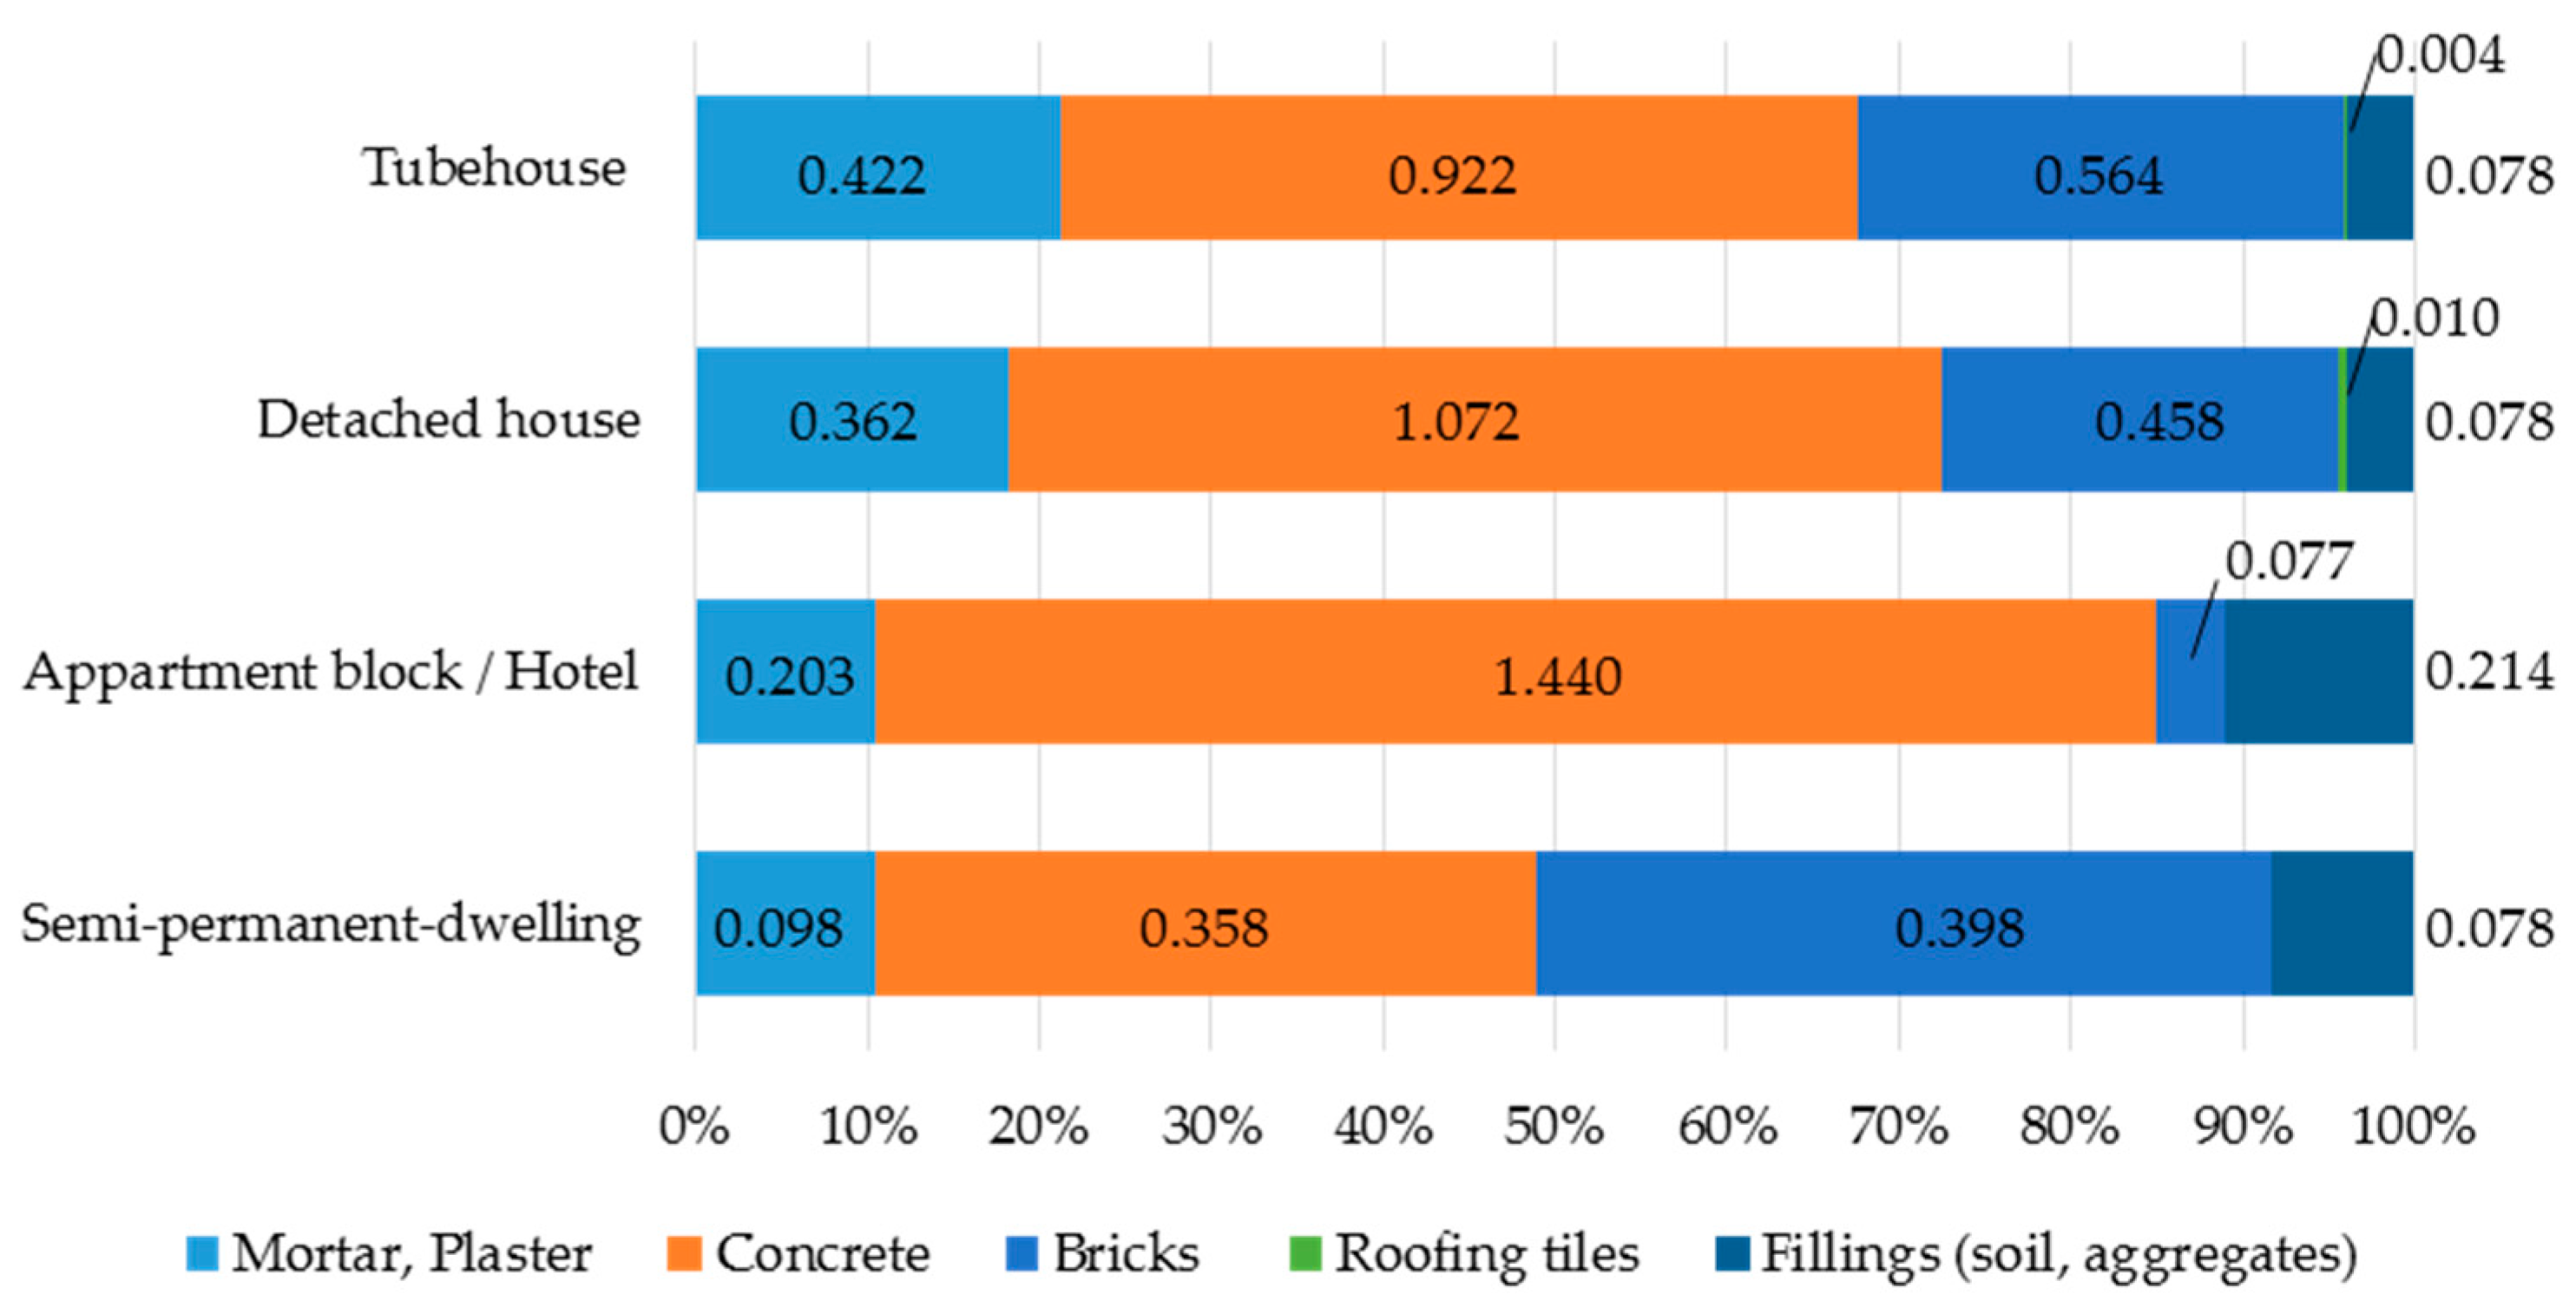
2.2.2. Material Composition Indicators for Domestic Buildings
2.2.3. Particular Measure for Domestic Building Stocks
2.2.4. Material Demand for Domestic Buildings
2.2.5. Material Demand for Non-Domestic Buildings
2.3. Material Flow Analysis to Calculate Material Demand for Roads
2.3.1. Typology of Roads
2.3.2. Material Composition Indicators for Roads
2.3.3. Particular Measure for Roadway-Stocks and Stock Dynamics
2.3.4. Material Demand for Roadways
2.4. Supply Calculation
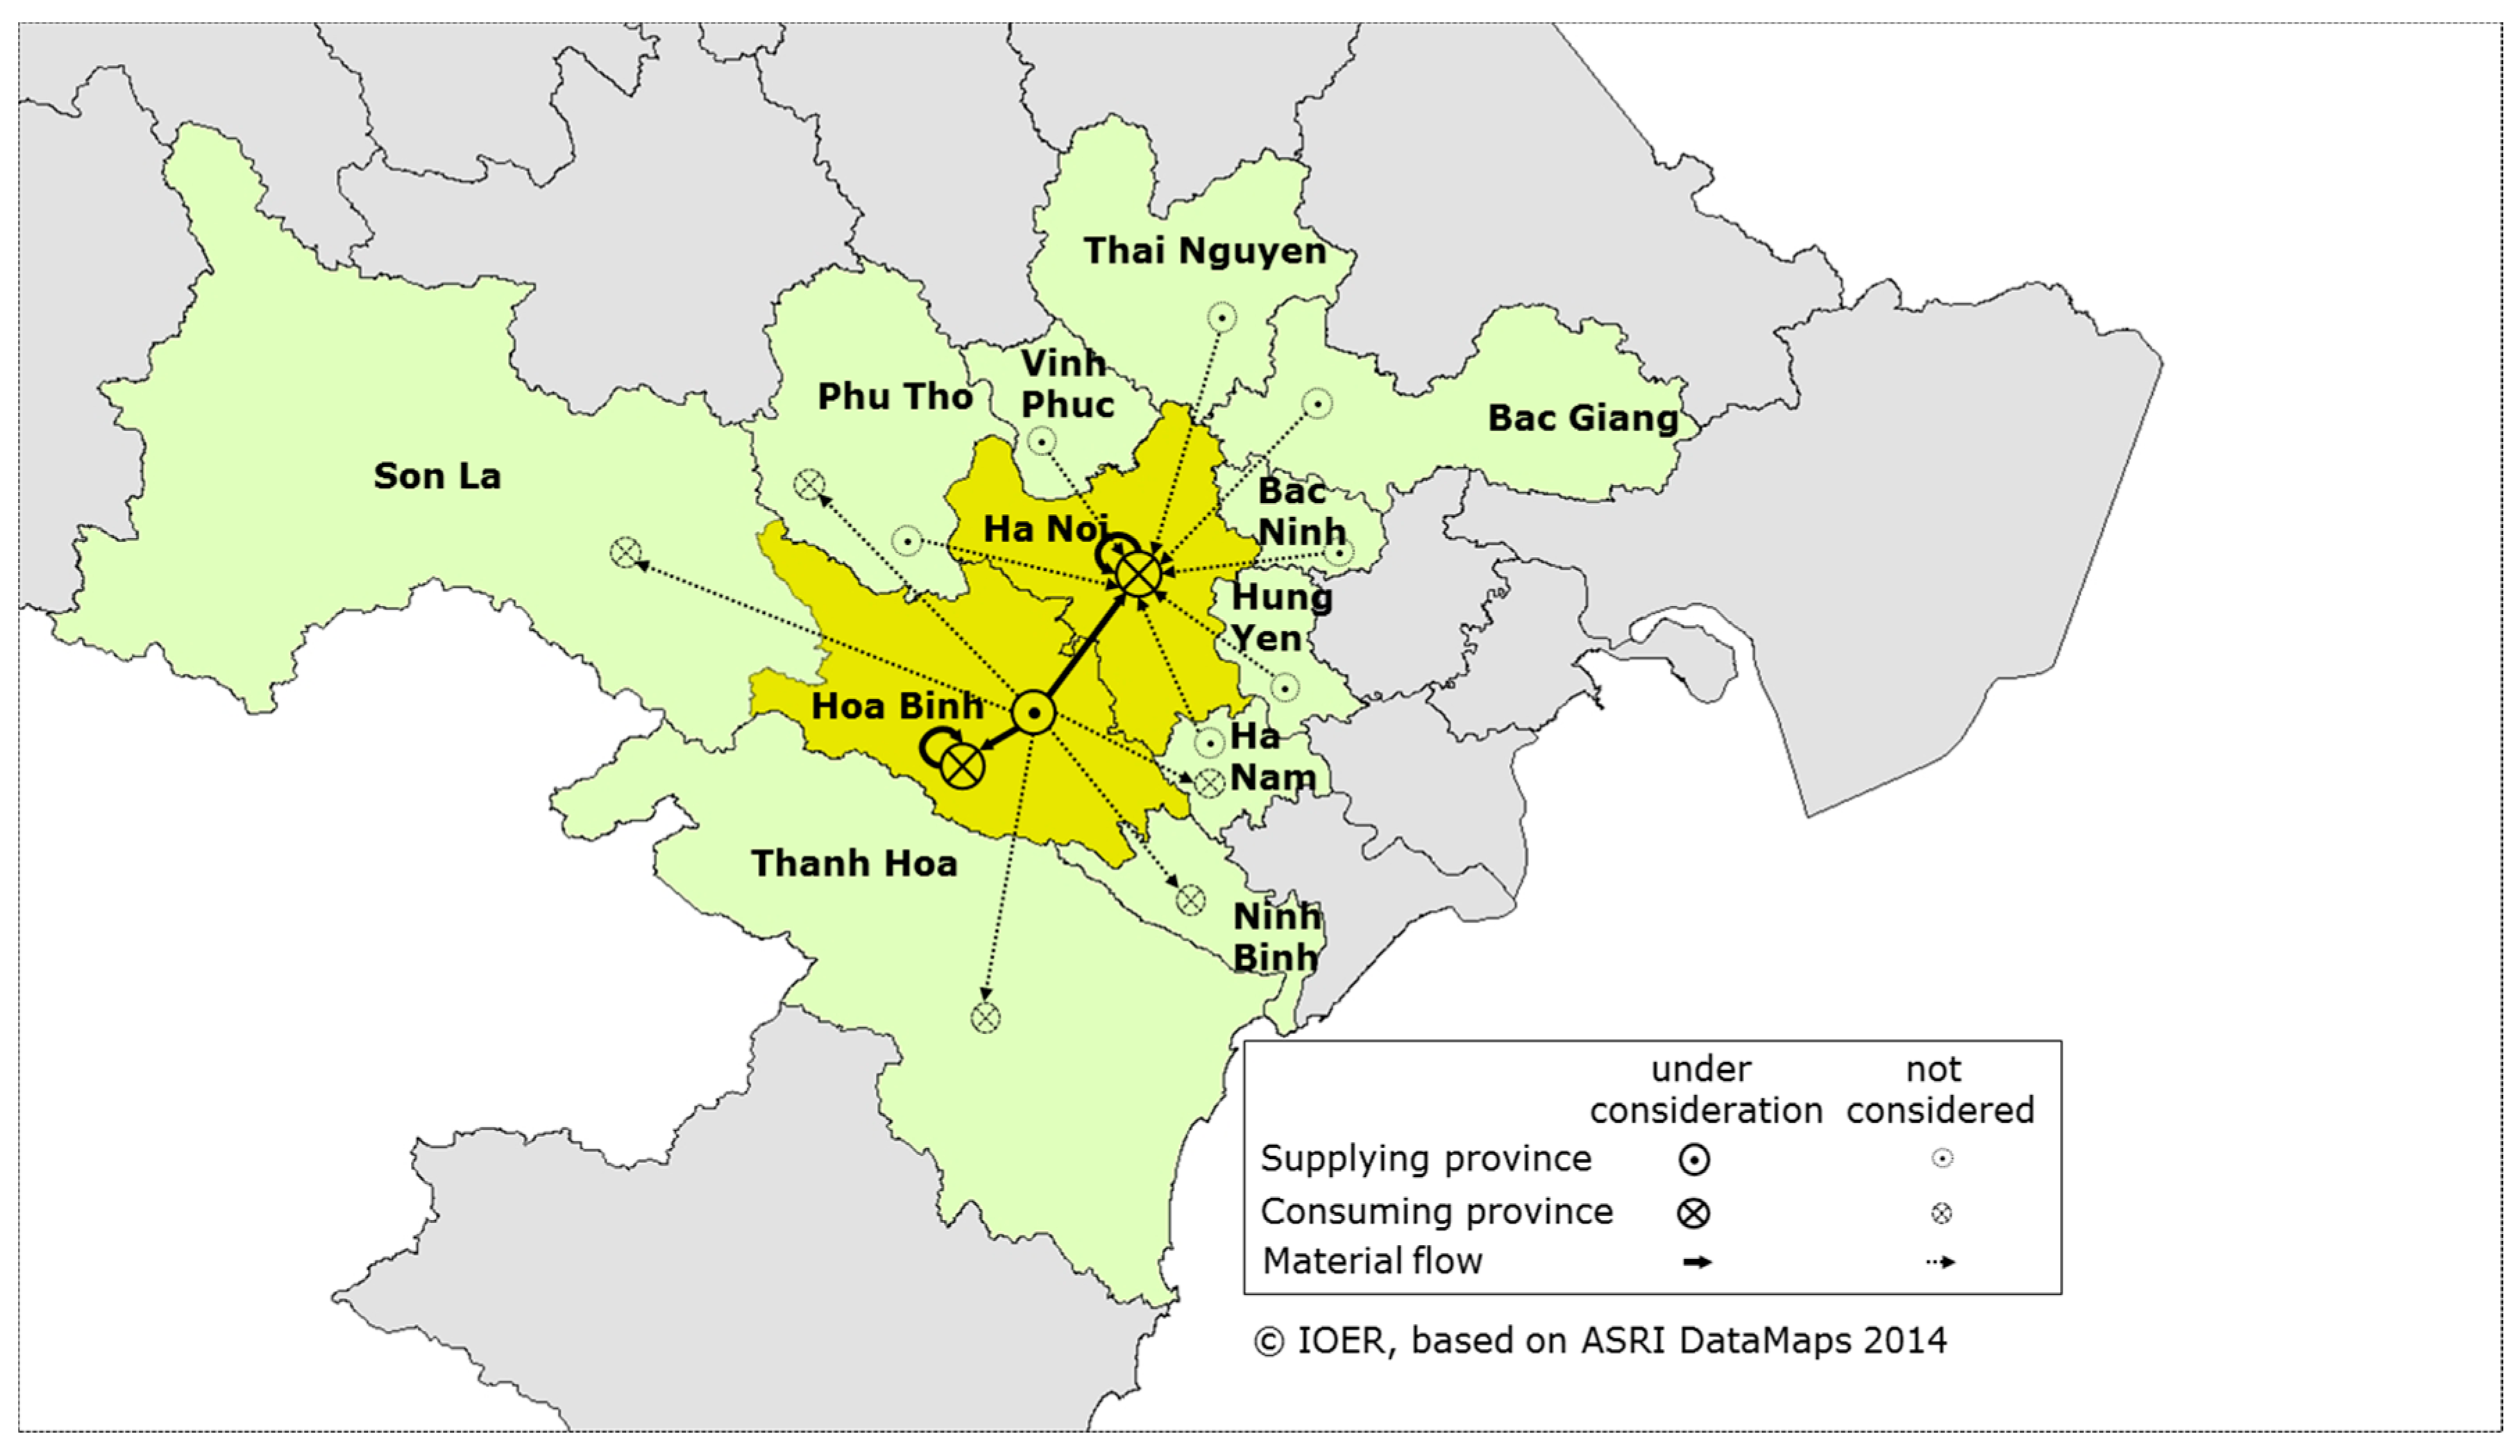
2.5. Case Study Area
3. Results
3.1. Defined Material Composition Indicators for Buildings
3.2. Defined Material Composition Indicators for Roads
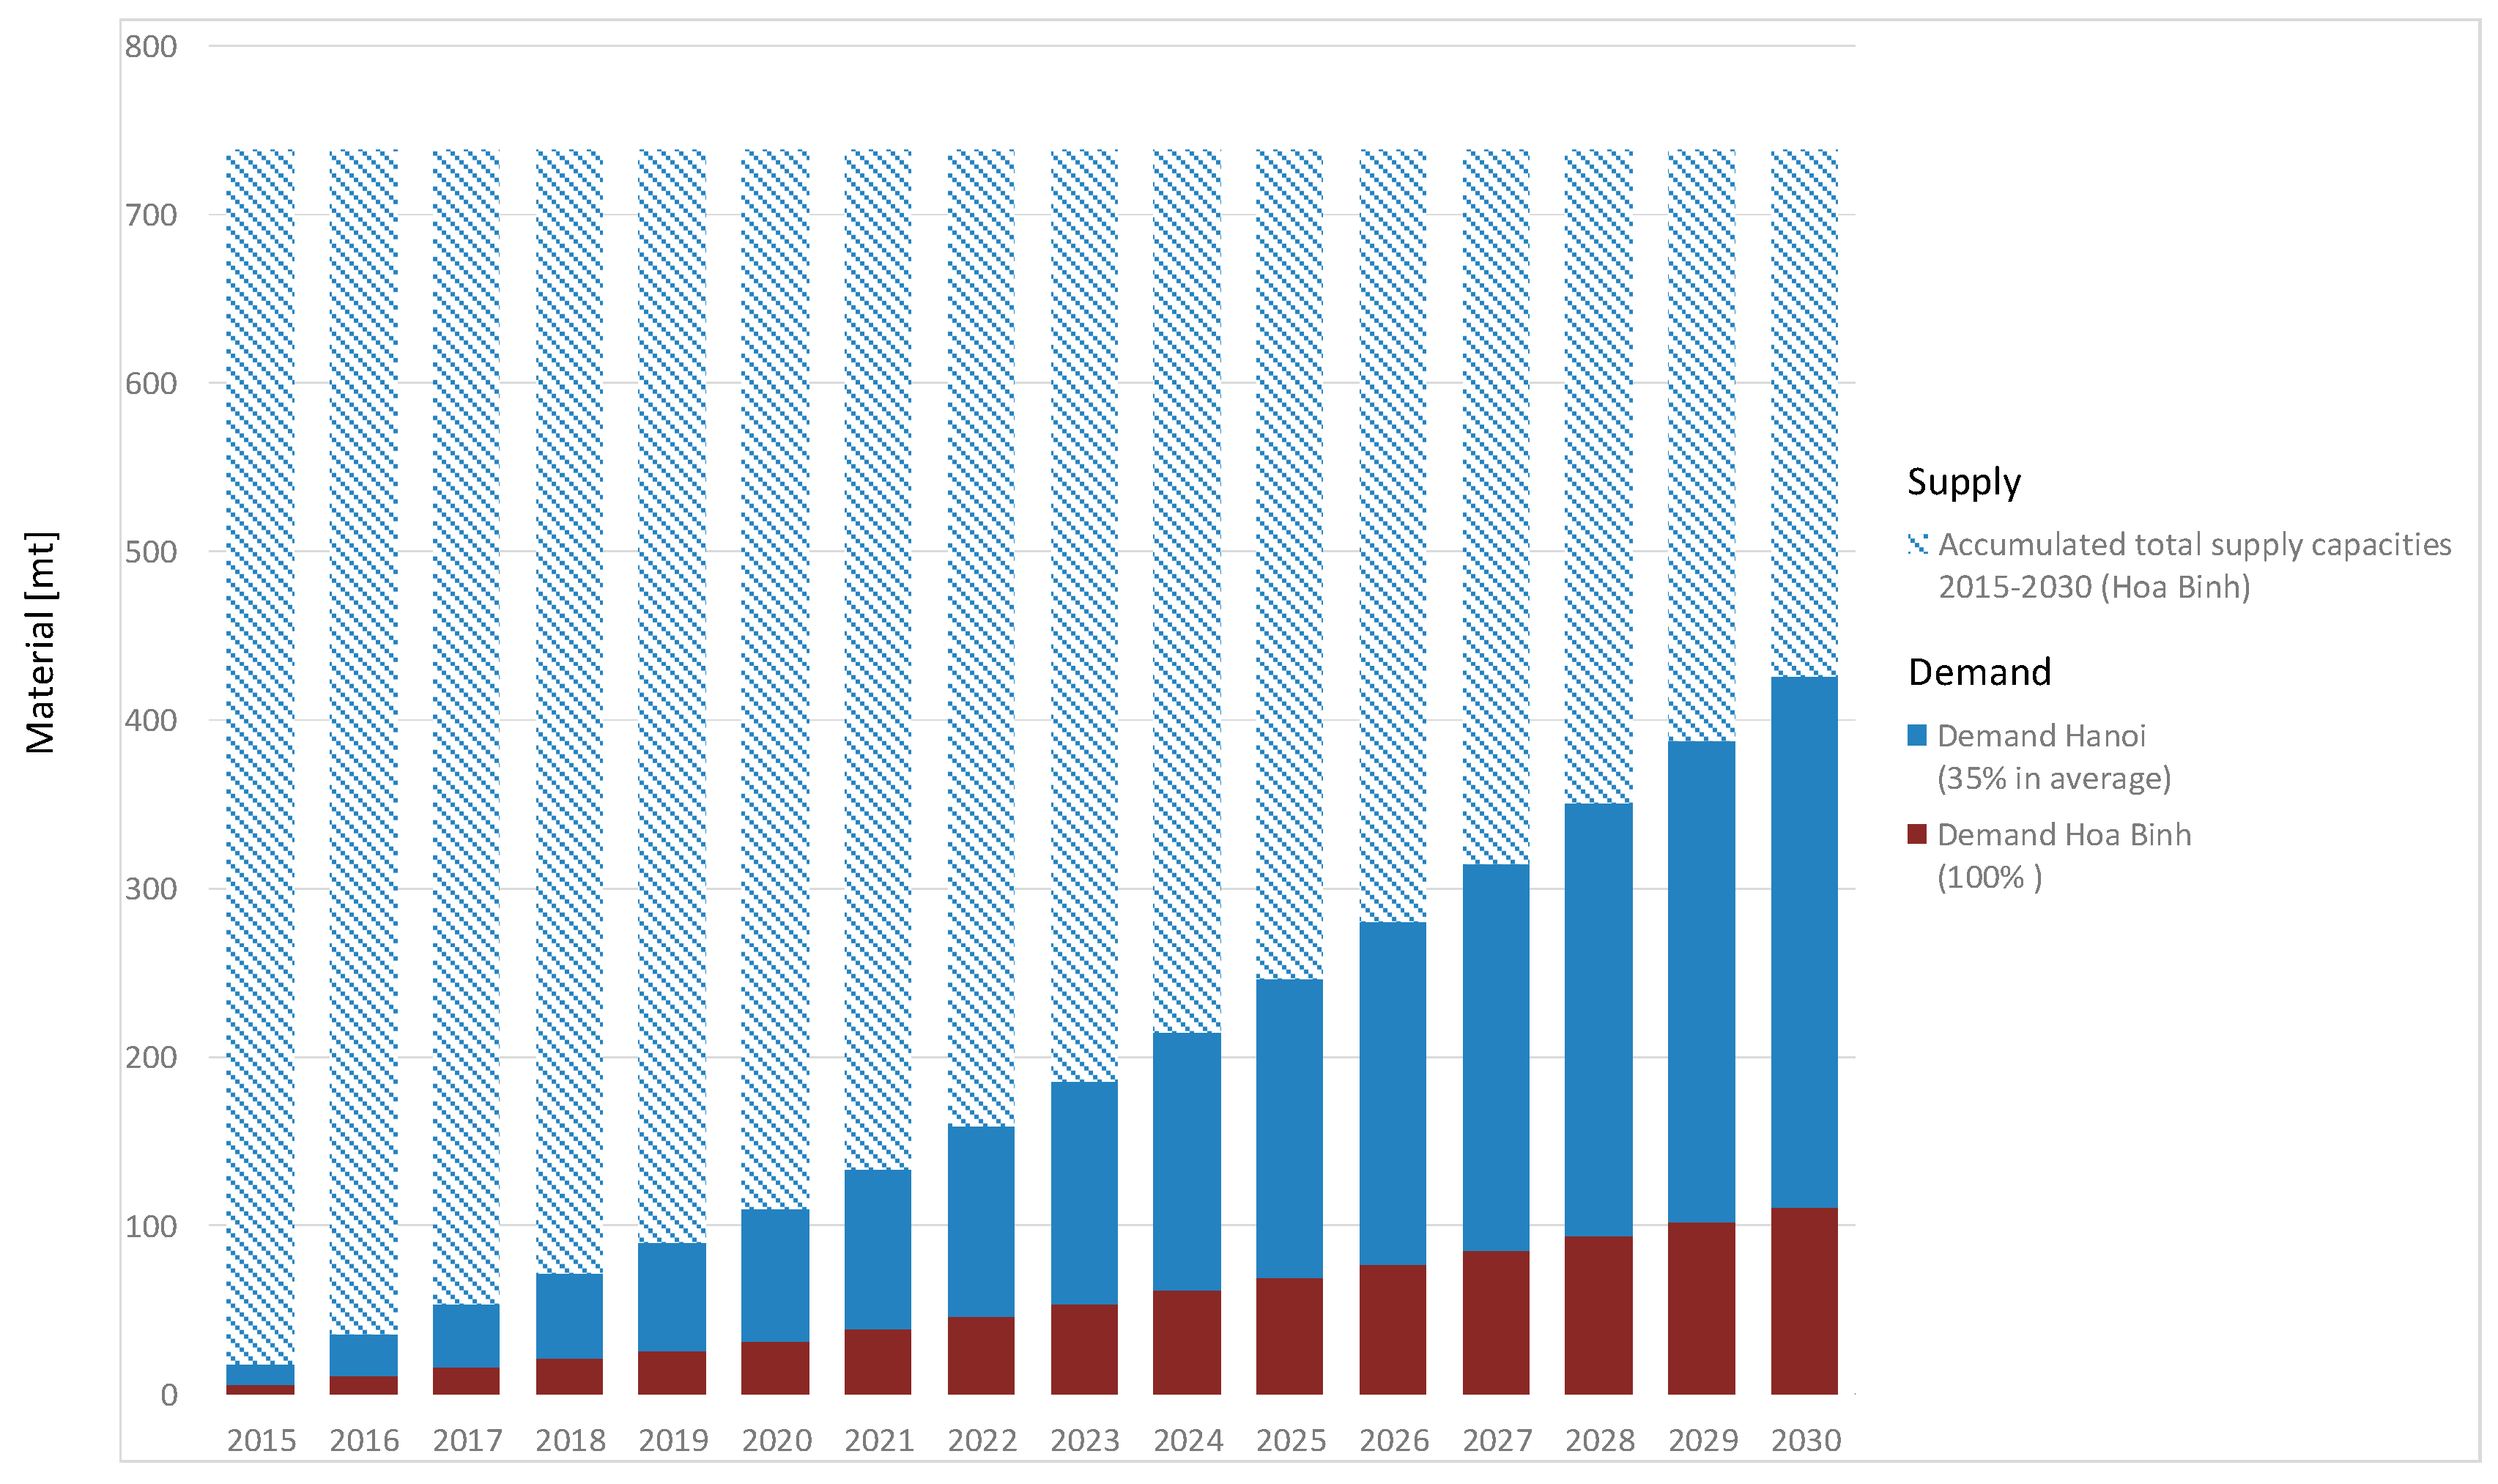
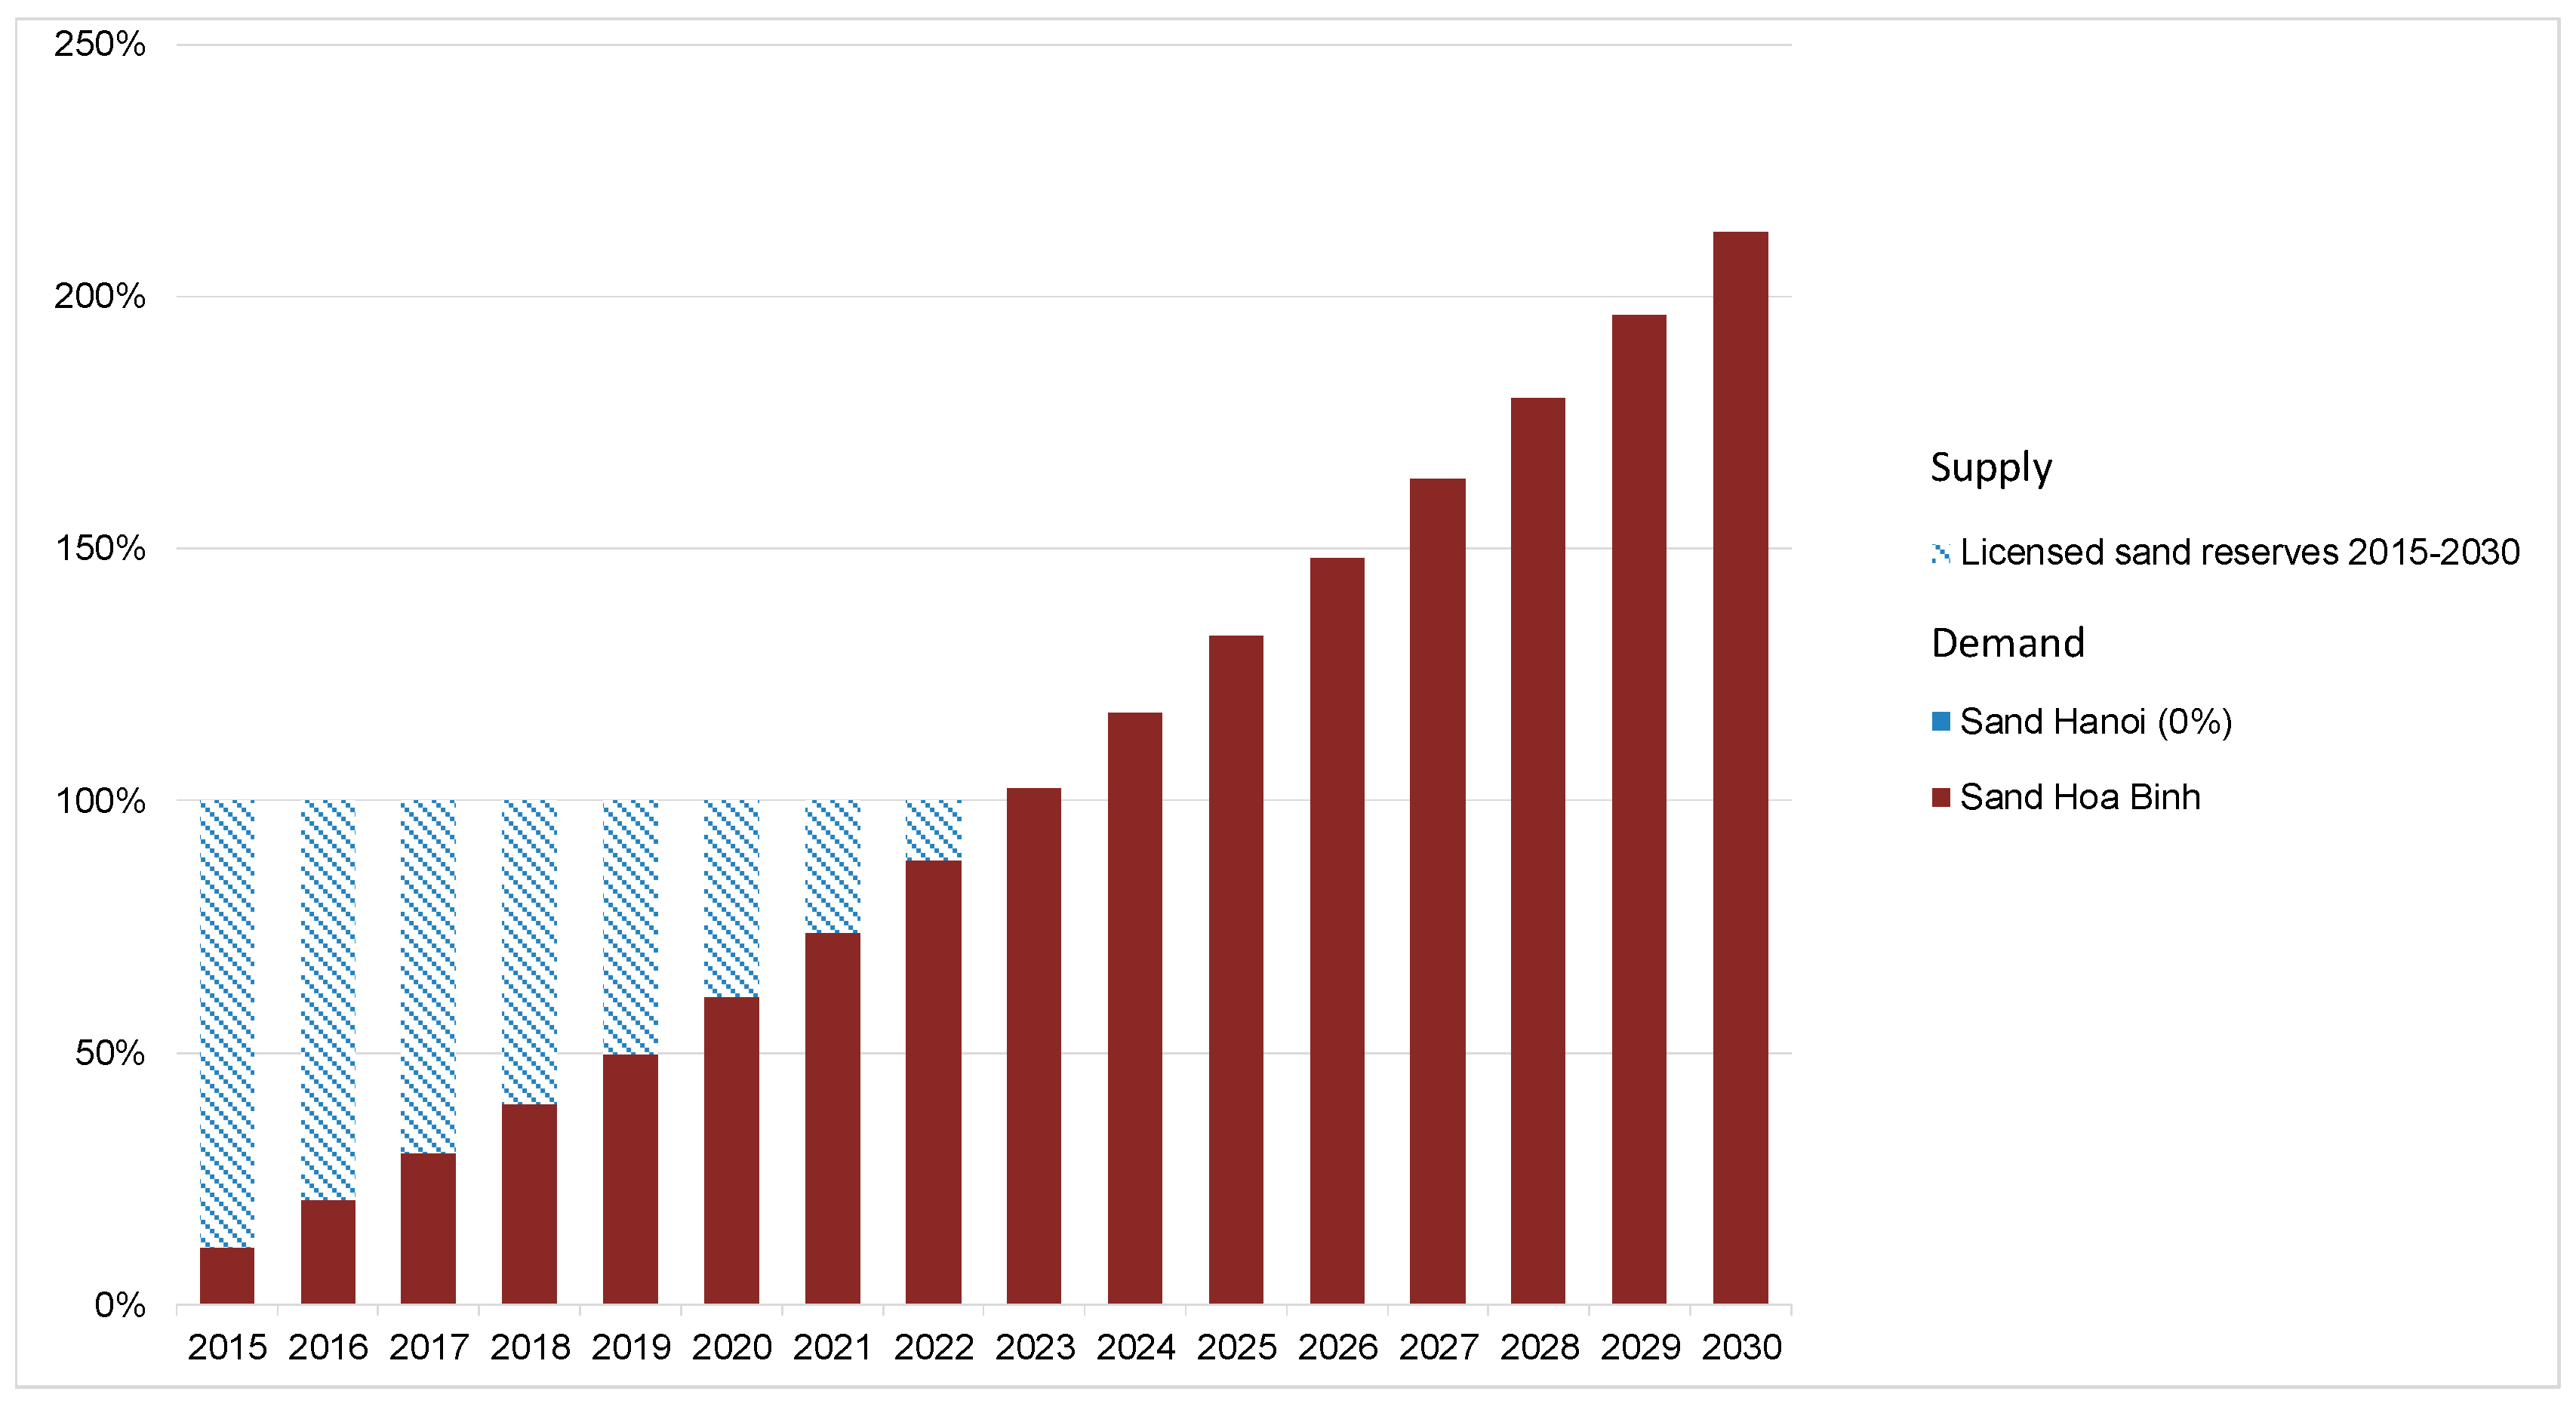
3.3. Demand and Supply for Construction Minerals
4. Discussion
4.1. Uncertainties and Plausibility
4.2. Potentials of the Approach
4.2.1. Securing Raw Materials
4.2.2. Support Sustainable Material Substitution Strategies
5. Conclusions
Supplementary Materials
Author Contributions
Funding
Acknowledgments
Conflicts of Interest
References
- United Nations Department of Economic and Social Affairs/Population Division. World Urbanization Prospects: The 2014 Revision, Highlights. 2014. Available online: https://read.un-ilibrary.org/human-settlements-and-urban-issues/world-urbanization-prospects_527e5125-en#page1 (accessed on 6 March 2020).
- Le, H.T.; Booth, A.L. Inequality in Vietnamese Urban-Rural Living Standards, 1993–2006; Discussion Paper No. 4987; Forschungsinstitut zur Zukunft der Arbeit: Bonn, Germany, 2010; Available online: http://repec.iza.org/dp4987.pdf (accessed on 18 October 2019).
- Augiseau, V.; Barles, S. Studying construction materials flows and stock: A review. Resour. Conserv. Recycl. 2017, 123, 153–164. [Google Scholar] [CrossRef]
- Fritsche, U.R.; Eppler, U.; Iriarte, L.; Laaks, S. Resource-Efficient Land Use—Towards a Global Sustainable Land Use Standard (GLOBALANDS). 2015. Available online: http://www.umweltbundesamt.de/publikationen/resource-efficient-land-use-towards-a-globa (accessed on 18 October 2019).
- Schiller, G.; Bimesmeier, T.; Tran, H. Bridging Urban Rural Dichotomy Following Construction Material Flows of Urbanization. Proceedings. 2018. Available online: http://regionalscience.org/images/PDF/Proceedings_RSAICongress2018.pdf (accessed on 18 October 2019).
- Krausmann, F.; Wiedenhofer, D.; Lauk, C.; Haas, W.; Tanikawa, H.; Fishman, T.; Miatto, A.; Schandl, H.; Haberl, H. Global socioeconomic material stocks rise 23-fold over the 20th century and require half of annual resource use. Proc. Natl. Acad. Sci. USA 2017, 114, 1880–1885. [Google Scholar] [CrossRef] [PubMed] [Green Version]
- Wilburn, D.R.; Goonan, T.G. Aggregates from natural and recycled sources—Economic assessments for construction applications: U.S. Geological Survey Circular 1176. 1998. Available online: http://greenwood.cr.usgs.gov/pub/circulars/c1176/c1176.html (accessed on 8 August 2018).
- Pacheco-Torgal, F.; Cabeza, L.; Labrincha, J.; de Magalhães, A. Eco Efficient Construction and Building Materials; Woodhead Publishing: Oxford, UK, 2013; Available online: https://www.elsevier.com/books/eco-efficient-construction-and-building-materials/pacheco-torgal/978-0-85709-767-5 (accessed on 18 October 2019).
- Schiller, G.; Gruhler, K.; Ortlepp, R. Continuous Material Flow Analysis Approach for Bulk Nonmetallic Mineral Construction materials Applied to the German Building Sector. J. Ind. Ecol. 2017, 21, 673–688. [Google Scholar] [CrossRef]
- Tuoi Tre News. Vietnam Forecast to Run Out of Construction Sand by 2020. 14:23 GMT+7. 3 August 2017. Available online: https://tuoitrenews.vn/news/society/20170803/vietnam-forecast-to-run-out-of-construction-sand-by-2020/40865.html (accessed on 18 October 2019).
- Sing MC, P.; Love, P.; Tam, C. Review and exploration of river sand substitutes for concrete production in Asian countries. CEBM 2012, 115–117. [Google Scholar] [CrossRef]
- Ortlepp, R.; Schiller, G.; Sebesvari, Z. Building Material Substitutes Contra Topsoil Harvesting—Technical Considerations with Focus on Developing Countries. 2015. Available online: http://sasbe2015.com/wp-content/uploads/2015/09/SASBE201574_OrtleppSchillerSebesvari.pdf (accessed on 10 March 2020).
- Kittipongvises, S. Assessment of Environmental Impacts of Limestone Quarrying Operations in Thailand. Environ. Clim. Technol. 2017, 20, 67–83. [Google Scholar] [CrossRef] [Green Version]
- Schneider, P.; Oswald, K.-D.; Riedel, W.; Meyer, A.; Schiller, G.; Bimesmeier, T.; Viet AP, T.; Nguyen, K.L. Engineering Perspectives and Environmental Life Cycle Optimization to Enhance Aggregate Mining in Vietnam. Sustainability 2018, 10, 525. [Google Scholar] [CrossRef] [Green Version]
- Binstock, M.; Carter-Whitney, M. Aggregate Extraction in Ontario: A Strategy for the Future. Executive Summary. Canadian Institute for Environmental Law and Policy [WWW Document]. 2011. Available online: http://cielap.org/pdf/AggregatesStrategyExecSumm.pdf (accessed on 18 October 2019).
- Müller, E.; Hilty, L.M.; Widmer, R.; Schluep, M.; Faulstich, M. Modeling metal stocks and flows: A review of dynamic material analysis methods. Environ. Sci. Technol. 2014, 48, 2102–2113. [Google Scholar] [CrossRef]
- Kennedy, C.A. Industrial Ecology and Cities. In Taking Stock of Industrial Ecology; Clift, R., Druckman, A., Eds.; Springer International Publishing: Cham, Switzerland, 2016; pp. 69–86. Available online: https://link.springer.com/chapter/10.1007/978-3-319-20571-7_4 (accessed on 10 March 2020).
- Schiller, G.; Müller, F.; Ortlepp, R. Mapping the anthropogenic stock in Germany: Metabolic evidence for a circular economy. Resour. Conserv. Recycl. 2017, 123, 93–107. [Google Scholar] [CrossRef]
- Müller, D.B. Stock dynamics for forecasting material flows: Case study for housing in The Netherlands. Ecol. Econ. 2006, 59, 142–156. [Google Scholar] [CrossRef]
- Ortlepp, R.; Gruhler, K.; Schiller, G. Materials in Germany’s domestic building stock: Calculation model and uncertainties. Build. Res. Inf. 2018, 46, 164–178. [Google Scholar] [CrossRef]
- Langer, W.H. An overview of aggregate resources in the United States. In Industrial Minerals and Extractive Industry Geology; Scott, P.W., Bristow, C.M., Eds.; Geological Society London: London, UK, 2010; Available online: http://www.gbv.de/dms/goettingen/354889346.pdf (accessed on 10 March 2020).
- Wilbrun, D.R.; Goonan, G.T. Aggregates from Natural Recycled Sources. Economic Assessment for Construction Applications—A Materials Flow Analysis. Denver: U.S. Department of the Interior. U.S. Geological Survey Circular no. 1176. Available online: http://pubs.usgs.gov/circ/1998/c1176/c1176.html (accessed on 25 April 2016).
- Miliutenko, S. Aggregate provision and sustainability issues in selected European cities around the Baltic Sea. Master’s Thesis, KTH Royal Institute of Technology, Stokholm, Sweden, 2009. [Google Scholar]
- Chisholm, G.G. Handbook of Commercial Geography; Longman, Green & Co.: London, UK, 1889. [Google Scholar]
- Suchet, A. Le concept d’arrière-pays en géographie: Une promenade dans la littérature. ERÍA 2017, 37, 125–130. [Google Scholar] [CrossRef] [Green Version]
- Britannica, E. Hinterland. Available online: https://www.britannica.com/science/hinterland (accessed on 10 March 2020).
- Kissinger, M.; Haim, A. Urban hinterlands - The case of an Israeli town ecological footprint. Environ. Dev. Sustain. 2008, 10, 391–405. [Google Scholar] [CrossRef]
- Department of Construction Hoa Binh. Resolution 76/2013/NQ-HDND: Master Plan for Exploitation and Use of Minerals for Construction Materials of Hoa Binh Province: Stones and Sand for Construction Materials, CLAY for Bricks in Hoa Binh Province, Period 2014–2019, with a Vision to 2024; Department of Construction: Hoa Binh, Vietnam, 2013. [Google Scholar]
- UN-Habitat 2013. Vietnam Housing Sector Profile. 2013. Available online: https://unhabitat.org/sites/default/files/download-manager-files/HousingEDIT-ENG%20%28PDF%29_low-Copy.pdf (accessed on 10 March 2020).
- Hanoi Statistical Office. Hanoi Statistical Yearbook 2015; Vietnam Statistical Publishing House: Hanoi, Vietnam, 2016. [Google Scholar]
- Hoa Binh Statistical Office. Hoa Binh Statistical Yearbook 2015; Vietnam Statistical Publishing House: Hanoi, Vietnam, 2016. [Google Scholar]
- General Statistical Office Viet Nam. Result of the Vietnam Household Living Standards Survey 2014; Statistical Publishing House: Hanoi, Vietnam, 2016. [Google Scholar]
- Ministry of Construction. Decision No. 1259/QD-TTg: Approving the General Planning on Construction of Hanoi Capital up to 2030, with a Vision toward 2050; Ministry of Construction: Hanoi, Vietnam, 2011.
- Department of Construction Hoa Binh. The Report of Housing Development Program in Hoa Binh Province till 2020 and Vision to 2030; Department of Construction: Hoa Binh, Vietnam, 2014.
- Department of Construction Hanoi. Decision 996/QD-TTg Approval of Housing Development Programme in Hanoi for the 2012–2020 Period with the Orientation by the Year 2030; Department of Construction: Hanoi, Vietnam, 2014.
- Huang, C.; Han, J.; Chen, W.Q. Changing patterns and determinants of infrastructures’ material stocks in Chinese cities. Resour. Conserv. Recycl. 2016, 123, 47–53. [Google Scholar] [CrossRef]
- Ortlepp, R.; Gruhler, K.; Schiller, G. Material stocks in Germany’s non-domestic buildings: A new quantification method. Build. Res. Inf. 2016, 44, 840–862. [Google Scholar] [CrossRef]
- Ortlepp, R.; Gruhler, K.; Schiller, G.; Deilmann, C. The other ‘half of the city’—Analysis of non-residential building stock and its material. In Proceedings of the Smart and Sustainable Built Environment (SASBE) Conference 2015, Pretoria, South Africa, 9–11 December 2015; Gibberd, J., Conradie, D.C.U., Eds.; University of Pretoria: Pretoria, South Africa, 2015; pp. 271–280. Available online: http://sasbe2015.com/wp-content/uploads/2015/09/SASBE201573_OrtleppGruhlerSchillerDeilmann.pdf (accessed on 10 March 2020).
- Ministry of Transport and Communications. TCVN 5729:2012: Expressway—Specifications for Design; Ministry of Transport and Communications: Hanoi, Vietnam, 2012.
- Ministry of Transport and Communications. TCVN 4054:2005: Highway—Specifications for Design; Ministry of Transport and Communications: Hanoi, Vietnam, 2005.
- Ministry of Transport and Communications. TCVN 10380:2014: Rural—Specifications for Design; Ministry of Transport and Communications: Hanoi, Vietnam, 2014.
- Ministry of Transport and Communications. TCVN 104:2007: Urban Road—Specifications for Design; Ministry of Transport and Communications: Hanoi, Vietnam, 2007.
- Ministry of Transport and Communications. TCVN 8857: 2011: Natural Aggregate for Road Pavement Layers Specification for Material, Construction and Acceptance; Ministry of Transport and Communications: Hanoi, Vietnam, 2011.
- Ministry of Transport and Communications. TCVN 8858: 2011: Cement Treated Aggregate Bases for Road Pavement—Specification for Construction and Acceptance; Ministry of Transport and Communications: Hanoi, Vietnam, 2011.
- Ministry of Transport and Communications. TCVN 8859: 2011: Graded Aggregate Bases and Subbases Pavement—Specification for Construction and Acceptance; Ministry of Transport and Communications: Hanoi, Vietnam, 2011.
- Ministry of Transport and Communications. TCVN 9504: 2012: Specification for Construction and Acceptance of Water Bound Macadam Layer; Ministry of Transport and Communications: Hanoi, Vietnam, 2012.
- Ministry of Transport and Communications. Circular No. 12/2013/TT-BGTVT: Circular of Prescribing the Use of Cement Concrete Road Surface Structure in Construction of Traffic Works; Ministry of Transport and Communications: Hanoi, Vietnam, 2013.
- Ministry of Construction. Circular No. 1776/BXD-VP: Descriptions and Guidance Manual of Construction Estimating Norms—Construction Phase; Ministry of Construction: Hanoi, Vietnam, 2007.
- Ministry of Construction. Circular No. 1784/BXD-VP: Descriptions and Guidance Manual of the Application of Construction Materials; Ministry of Construction: Hanoi, Vietnam, 2007.
- Department of Transportation Hanoi. Cung Cảp Nôi Dung Làm Viêc—Với Doàn Chuyên Gia Thực Hiên Án MAREX [Content Delivery–For the MAREX Project Experts Team]. 18 November 2016. [Google Scholar]
- Department of Transportation Hoa Binh. Quyết Đinh-Phê Duy Êt Danh Muc Ha Tầng Giao Thông Do Thàn Phố Quản Lý Sau Đầu Tư Theo Đinh Tai Quyết Đinh Số 14/2016 [Decision—Approval of the list of transport infrastructure managed by the City in accordance with Decision No 14/2016]. 20 December 2016. [Google Scholar]
- Miatto, A.; Schandl, H.; Wiedenhofer, D.; Krausmann, F.; Tanikawa, H. Modeling material flows and stocks of the road network in the United States 1905–2015. Resour. Conserv. Recycl. 2017, 127, 168–178. [Google Scholar] [CrossRef]
- Laner, D.; Rechberger, H.; Astrup, T. Systematic evaluation of uncertainty in material flow analysis. J. Ind. Ecol. 2014, 18, 859–870. [Google Scholar] [CrossRef]
- Kleemann, F.; Lederer, J.; Aschenbrenner, P.; Rechberger, H.; Fellner, J. A method for determining buildings’material composition prior to demolition. Build. Res. Inf. 2016, 44, 368–380. [Google Scholar] [CrossRef]
- Schiller, G.; Miatto, A.; Gruhler, K.; Ortlepp, R.; Deilmann, C.; Tanikawa, H. Transferability of material composition indicators for residential buildings: A conceptual approach based on a German-Japanese comparison. J. Ind. Ecol. 2019, 23, 796–807. [Google Scholar] [CrossRef]
- Nguyen, T.C.; Fishman, T.; Miatto, A.; Tanikawa, H. Estimating the Material Stock of Roads, The Vietnamese Case Study. J. Ind. Ecol. 2019, 23, 663–673. [Google Scholar] [CrossRef]
- Tanikawa, H.; Fishman, T.; Okuoka, K.; Sugimoto, K. The weight of society over time and space: A comprehensive account of the construction material stock of Japan, The construction material stock of Japan. J. Ind. Ecol. 2015, 19, 778–791. [Google Scholar] [CrossRef]
- United Nations; Department of Economic and Social Affairs; Statistics Division. SDG Goals, 12 Responsible Consumption and Production, Ensure Sustainable Consumption and Production Patterns. 2020. Available online: https://unstats.un.org/sdgs/report/2019/goal-12/ (accessed on 18 October 2019).
- Dittrich, M.; Giljum, S.; Lutter, S.; Polzin, C. Update of national and international resource use indicators, UBA, Texte, August 2013. Available online: https://www.umweltbundesamt.de/publikationen/update-of-national-international-resource-use (accessed on 10 March 2020).
- Eurostat. Economy-wide Material Flow Accounts (EW-MFA). Compilation Guide; Eurostat: Luxembourg, 2013. Available online: ec.europa.eu/eurostat/documents/1798247/6191533/2013-EW-MFA-Guide-10Sep2013,pdf/54087dfb-1fb0-40f2-b1e4-64ed22ae3f4c (accessed on 18 October 2019).
- World Bank. Vietnam Urbanization Review. Technical Assistance Report. 2011. Available online: http://www.citiesalliance.org/sites/citiesalliance.org/files/CAFiles/Projects/Final_669160ESW0P1130Review000Full0report.pdf (accessed on 8 August 2018).
- Prime Minister of Vietnam. Decision No. 1081/QD-TTg of Juiy 6, 2011: Approving the Master Plan on Socio-Economic Development of Hanoi City through 2020, with Orientations toward 2030; Prime Minister of Vietnam: Hanoi, Vietnam, 2011. [Google Scholar]
- Prime Minister of Vietnam. Decision No. 917/QD-TTg of June 11, 2013, Approving the Master Plan on Socio-Economic Development of Hoa Binh Province through 2020; Prime Minister of Vietnam: Hanoi, Vietnam, 2013. [Google Scholar]
- Müller, B.; Wirth, P.; Schiller, G.; Bimesmeier, T.; Vu, A.M.; Albrecht, J.; Thinh, N.X.; Ebrahimi-Salari, H.; Schiappacasse, P.; Oswald, K.-D.; et al. Management of Mineral Resource Extraction in Hoa Binh Province, Vietnam. Seven Recommendations for Responsible Construction Aggregates Mining and Contributions to Sustainable Urban and Regional Development, MAREX Publication Series 1. 2019. Available online: http://www.marex-project.de/publications/final/MAREX_Issue1_WEB.pdf (accessed on 10 March 2020).
- Östensson, O. Players in the Mineral Industry. In International and Comparative Mineral Law and Policy: Trends and Prospects; Bastida, E., Waelde, T.W., War-den-Fernández, J., Eds.; Kluwer Law International: The Hague, The Netherlands, 2005; pp. 429–449. [Google Scholar]
- Joel, M. Use of Crushed Granite Fine as Replacement to River Sand in Concrete Production; 2010; Volume 9. Available online: http://lejpt.academicdirect.org/A17/085_096.pdf (accessed on 20 February 2020).


| Building Type | Analysis Based on * | ||
|---|---|---|---|
| Floor Plans | Bill of Quantities | Expert Interviews | |
| Tubehouse | x (4) | x (1) | x (2) |
| Detached house/villa | x (2) | ||
| Apartment block | x (2) | x (1) | x (2) |
| Semi-permanent house | x (2) | ||
| Standard | Class/Type (Design Speed) | Average Width [m] | |||
|---|---|---|---|---|---|
| Pavement | Roadbed | ||||
| Expressways | TCVN 5729:2012 [39] | Class 1 (60 km/h) | 14 | 22 | |
| Class 2 (80 km/h) | 14 | 22 | |||
| Class 3 (100 km/h) | 15 | 24.75 | |||
| Class 4 (120 km/h) | 15 | 24.75 | |||
| Highways | Plain/hilly terrain | TCVN 4045:2005 [40] | Class I (120 km/h) | 22.5 | 32.5 |
| Class II (100 km/h) | 15 | 22.5 | |||
| Class III (80 km/h) | 7 | 12 | |||
| Class IV (60 km/h) | 7 | 9 | |||
| Class V (40 km/h) | 5.5 | 7.5 | |||
| Class VI (20 km/h) | 3.5 | 6.5 | |||
| National Roads | Mountainous terrain | TCVN 4045:2005 [40] | Class III (60 km/h) | 6 | 9 |
| Class IV (40 km/h) | 5.5 | 7.5 | |||
| Class V (30 km/h) | 3.5 | 6.5 | |||
| Class VI (20 km/h) | 3.5 | 6 | |||
| Rural Roads District Road | TCVN 10380:2014 [41] | Type A | 3.5 | ||
| TCVN 4054:2005 [40] | Class IV | 5.5 | 7.5 | ||
| Class V | 3.5 | 6.5 | |||
| Class VI | 3.5 | 6 | |||
| Rural Roads Municipal Road | TCVN 10380:2014 [41] | Type B | 3.5 | 5 | |
| Type C | 3 | 4 | |||
| Urban Roads | TCVN 104:2007 [42] | Class 2: Major urban main roads | 30 | 30 | |
| Class 3: Main secondary urban roads | 27 | 27 | |||
| Class 4: Side roads | 12 | 12 | |||
| Class 5: Internal roads | 7 | 7 | |||
| Asphalt Concrete (High Class) | Asphalt Concrete (Low Class) | Cement Concrete | Bitumen-treated Crushed Stone | Crushed Stone | Soil | |
|---|---|---|---|---|---|---|
| Average lifespan | ≥10 years | ≥10 years | ≥10 years | 4–7 years | 3–4 years | 3–4 years |
| Population | Administrative Area (km2) | Population Density (Inhabitants/km2) | Per Capita Living Space (m²/capita) | ||
|---|---|---|---|---|---|
| Hanoi | 2015 | 7,390,900 | 3349 | 2207 | 25 |
| 2030 | 9,100,000 | 3349 | 2718 | 32 | |
| Hoa Binh | 2015 | 824,325 | 4662 | 177 | 17 |
| 2030 | 1,021,331 | 4662 | 219 | 25 |
| MCI [t/m² Floor Area] | ||||||||||
|---|---|---|---|---|---|---|---|---|---|---|
| Building Material | Raw Material | Total | ||||||||
| Mortar, Plaster | Concrete | Bricks | Roof tiles | Fillings (soil/aggregates) | Sand | Limestone/ Basalt | Clay | Soil/aggregates (Fillings) | ||
| Tubehouse | 0.42 | 0.92 | 0.56 | 0.00 | 0.08 | 0.60 | 0.72 | 0.59 | 0.08 | 1.99 |
| Detached house | 0.36 | 1.07 | 0.46 | 0.01 | 0.08 | 0.60 | 0.81 | 0.49 | 0.08 | 1.98 |
| Apartment block | 0.203 | 1.440 | 0.08 | - | 0.21 | 0.58 | 1.01 | 0.14 | 0.21 | 1.93 |
| Semi-permanent houses | 0.10 | 0.36 | 0.40 | - | 0.08 | 0.19 | 0.27 | 0.99 | 0.08 | 0.93 |
| MCI [t/m² Road Area] | ||||||||||
|---|---|---|---|---|---|---|---|---|---|---|
| Building Material | Raw Material | Total | ||||||||
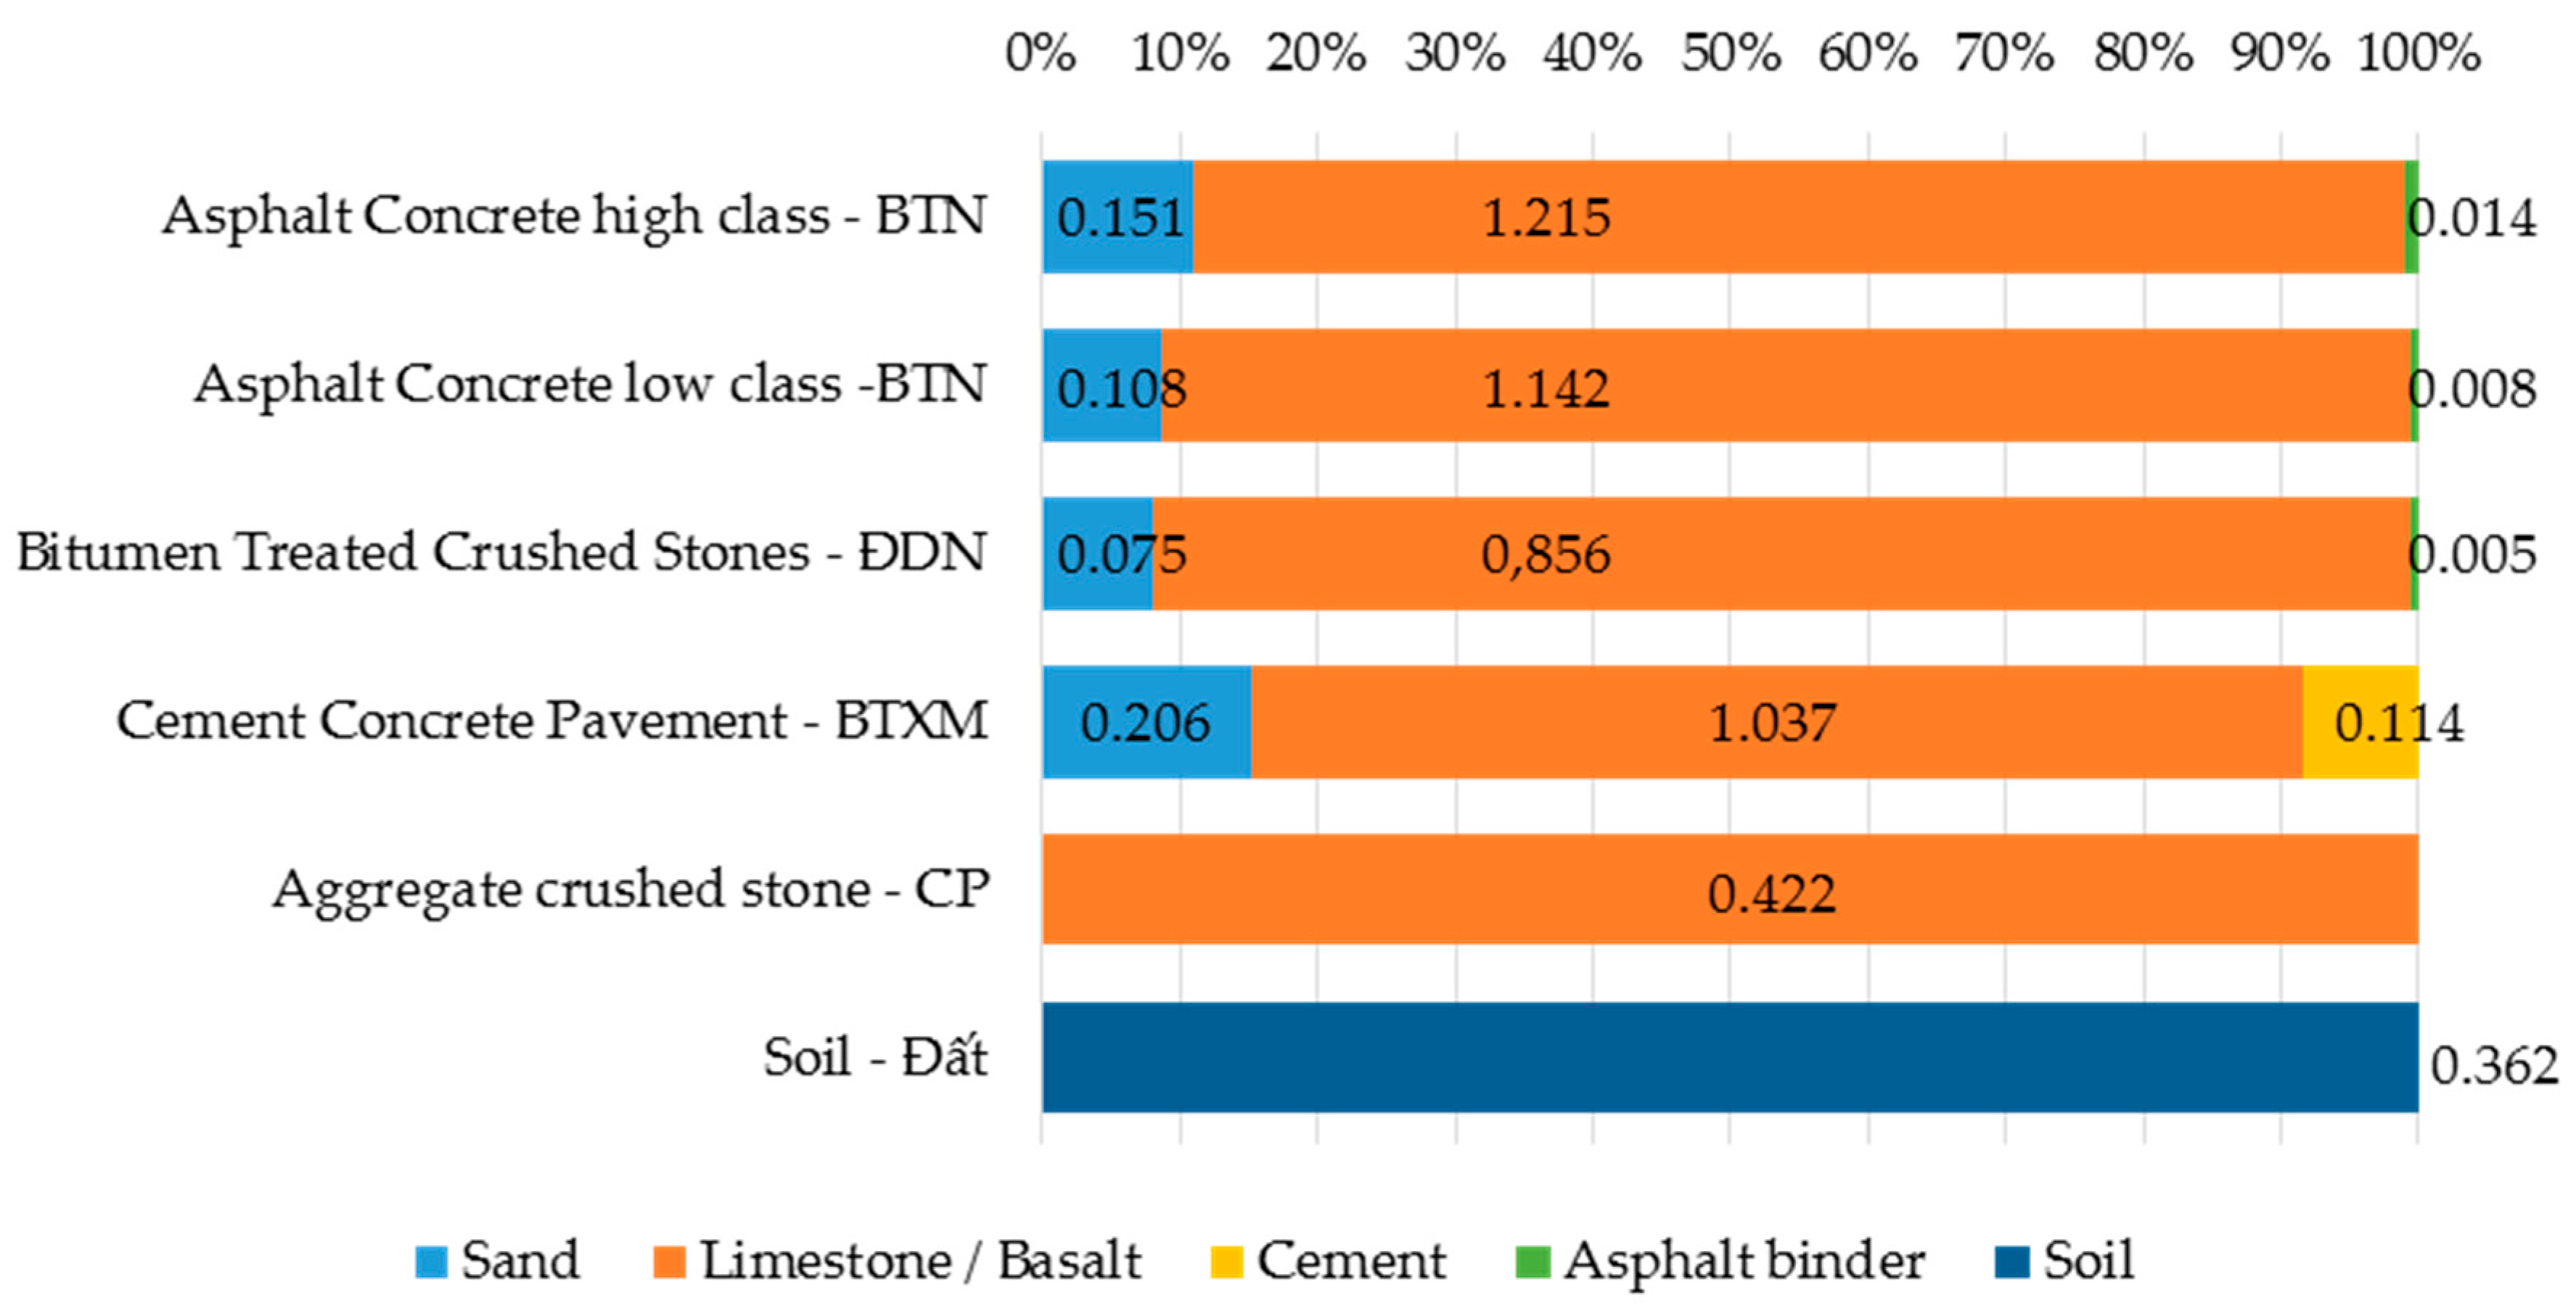
| Sand | Aggregates (Limestone/Basalt) | Cement | Asphalt binder | Soil | Sand | Aggregates (Limestone/Basalt) | Clay | Soil, others ** | ||
| Asphalt Concrete (hc) | 0.151 | 1.215 | - | 0.014 | - | 0.151 | 1.215 | - | 0.014 ** | 1.380 |
| Asphalt Concrete (lc) | 0.108 | 1.142 | - | 0.008 | - | 0.108 | 1.142 | - | 0.008 ** | 1.258 |
| Bitumen | 0.075 | 0.856 | - | 0.005 | - | 0.075 | 0.856 | - | 0.005 ** | 0.936 |
| Cement | 0.206 | 1.037 | 0.114 | - | - | 0.206 | 1.232 | 0.034 | - | 1.357 |
| Aggregates | - | 0.422 | - | - | - | - | 0.422 | - | - | 0.422 |
| Soil | - | - | - | - | 0.362 | - | - | - | 0.362 | 0.362 |
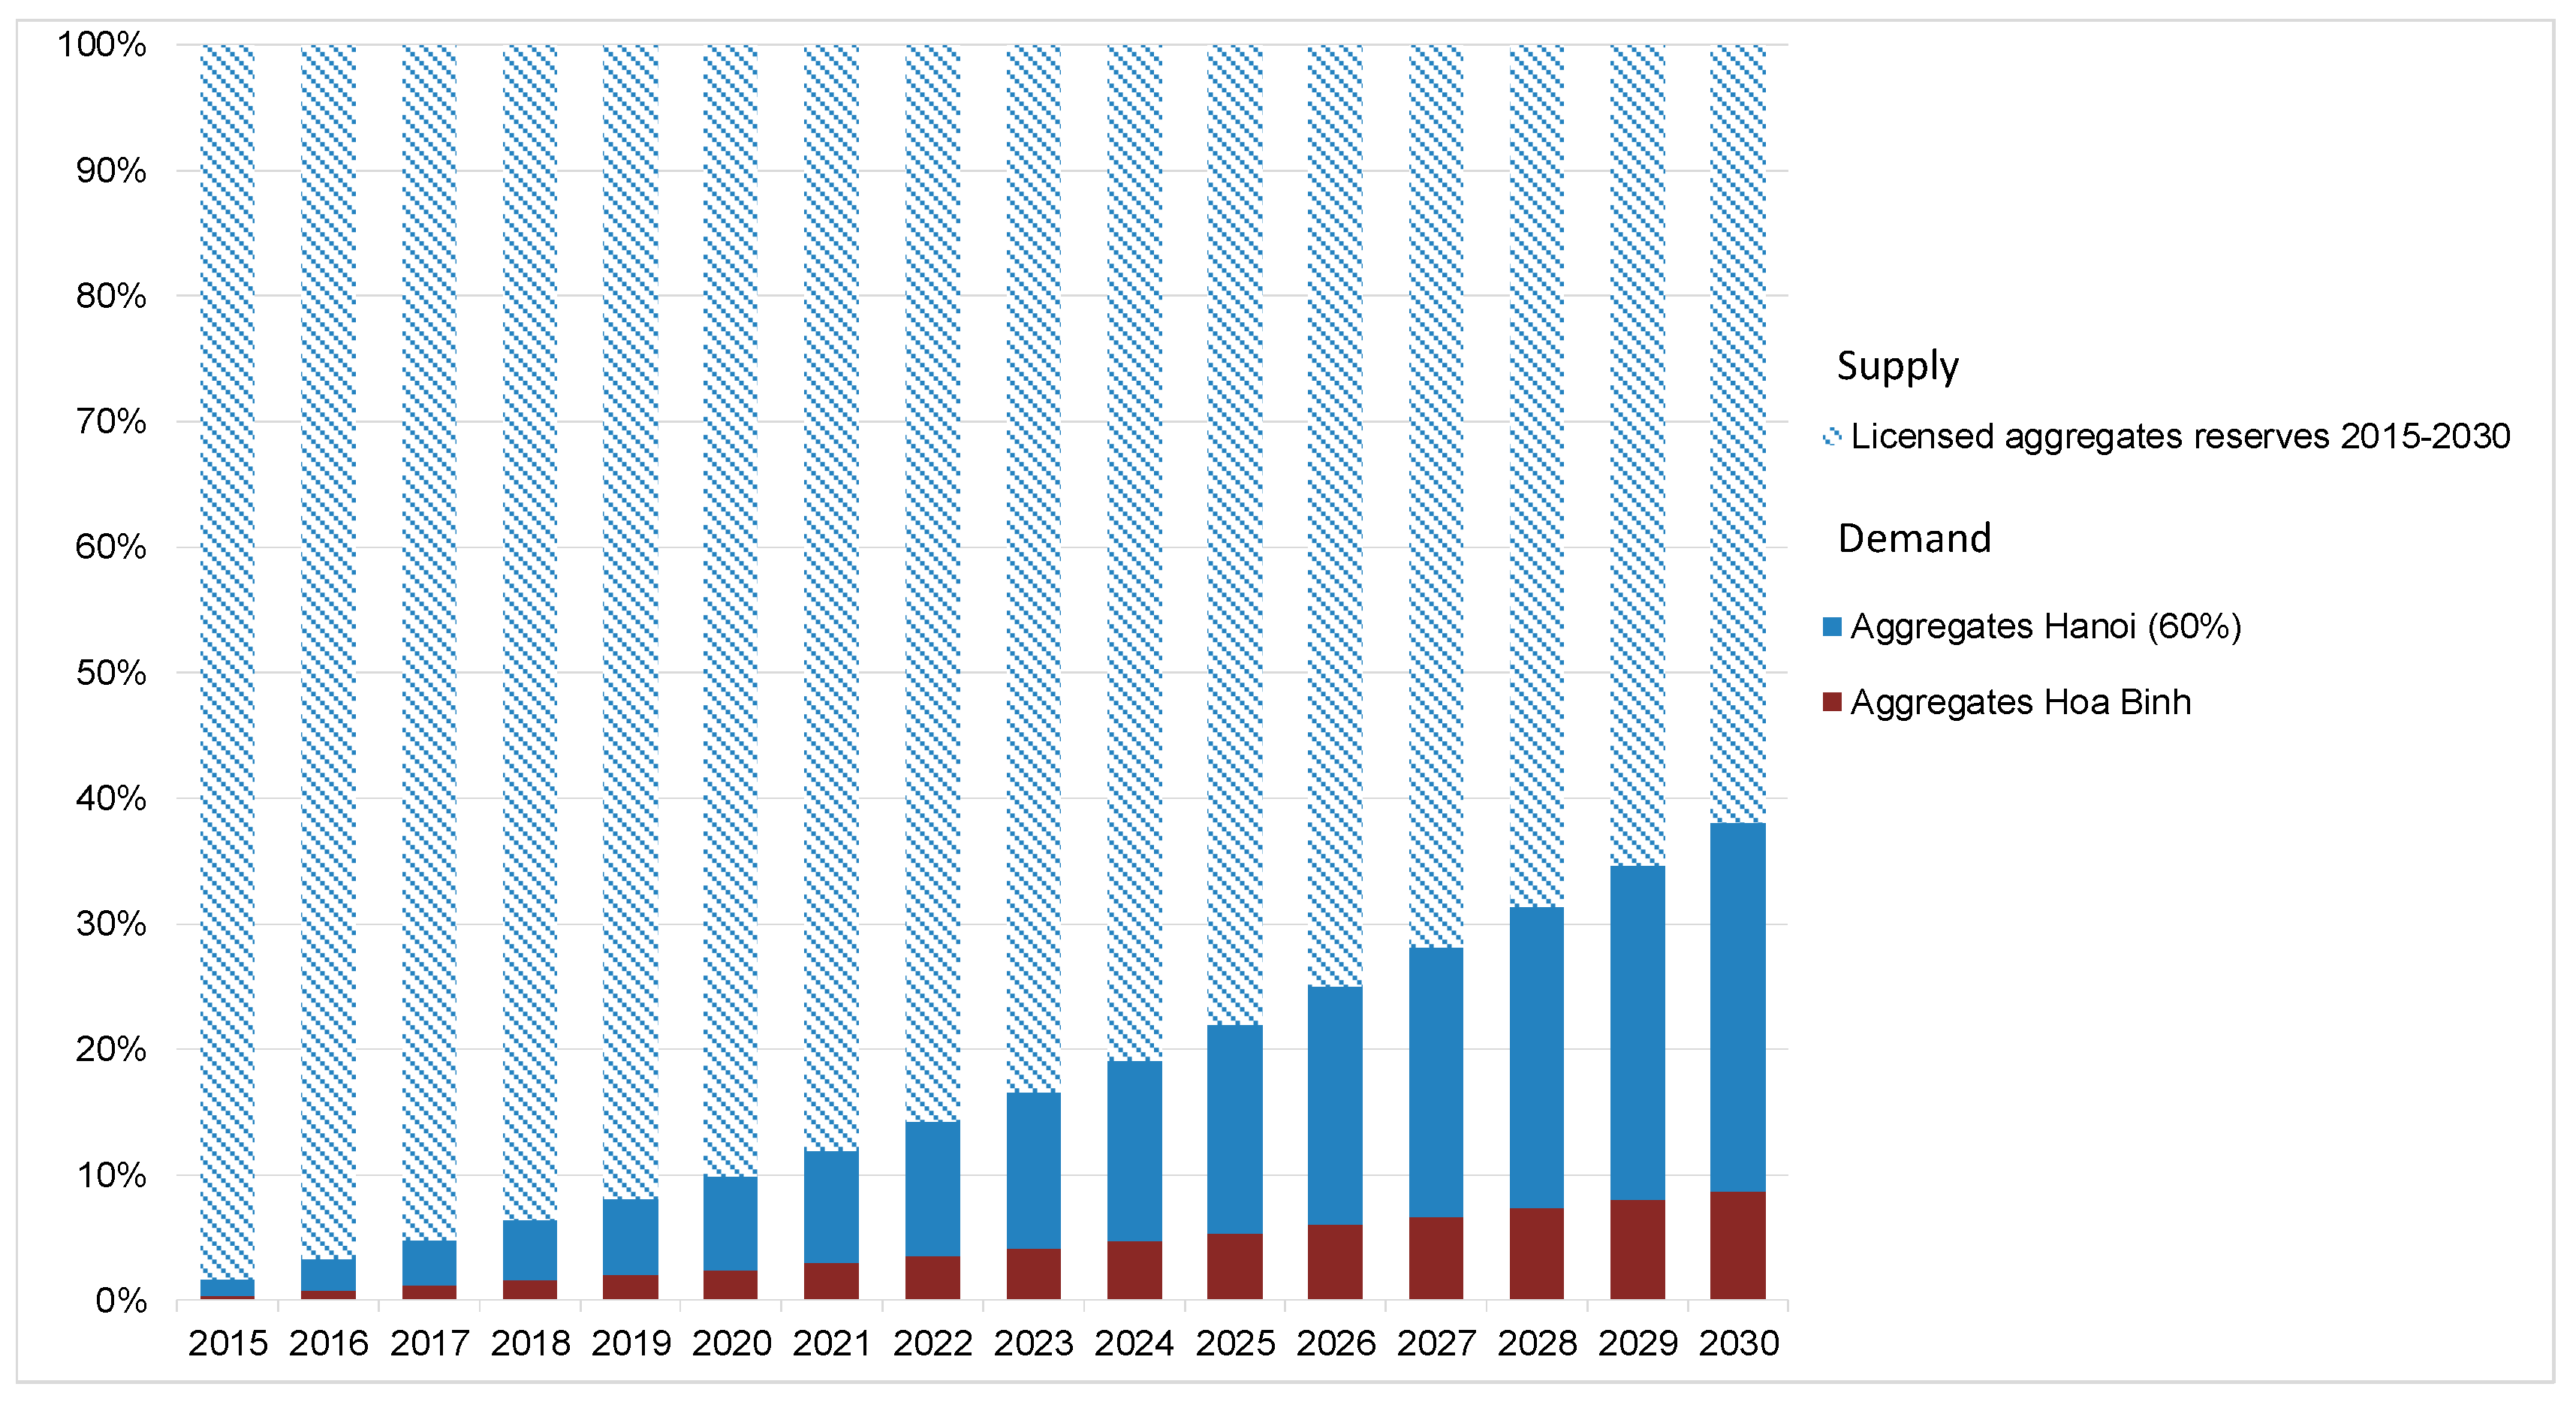
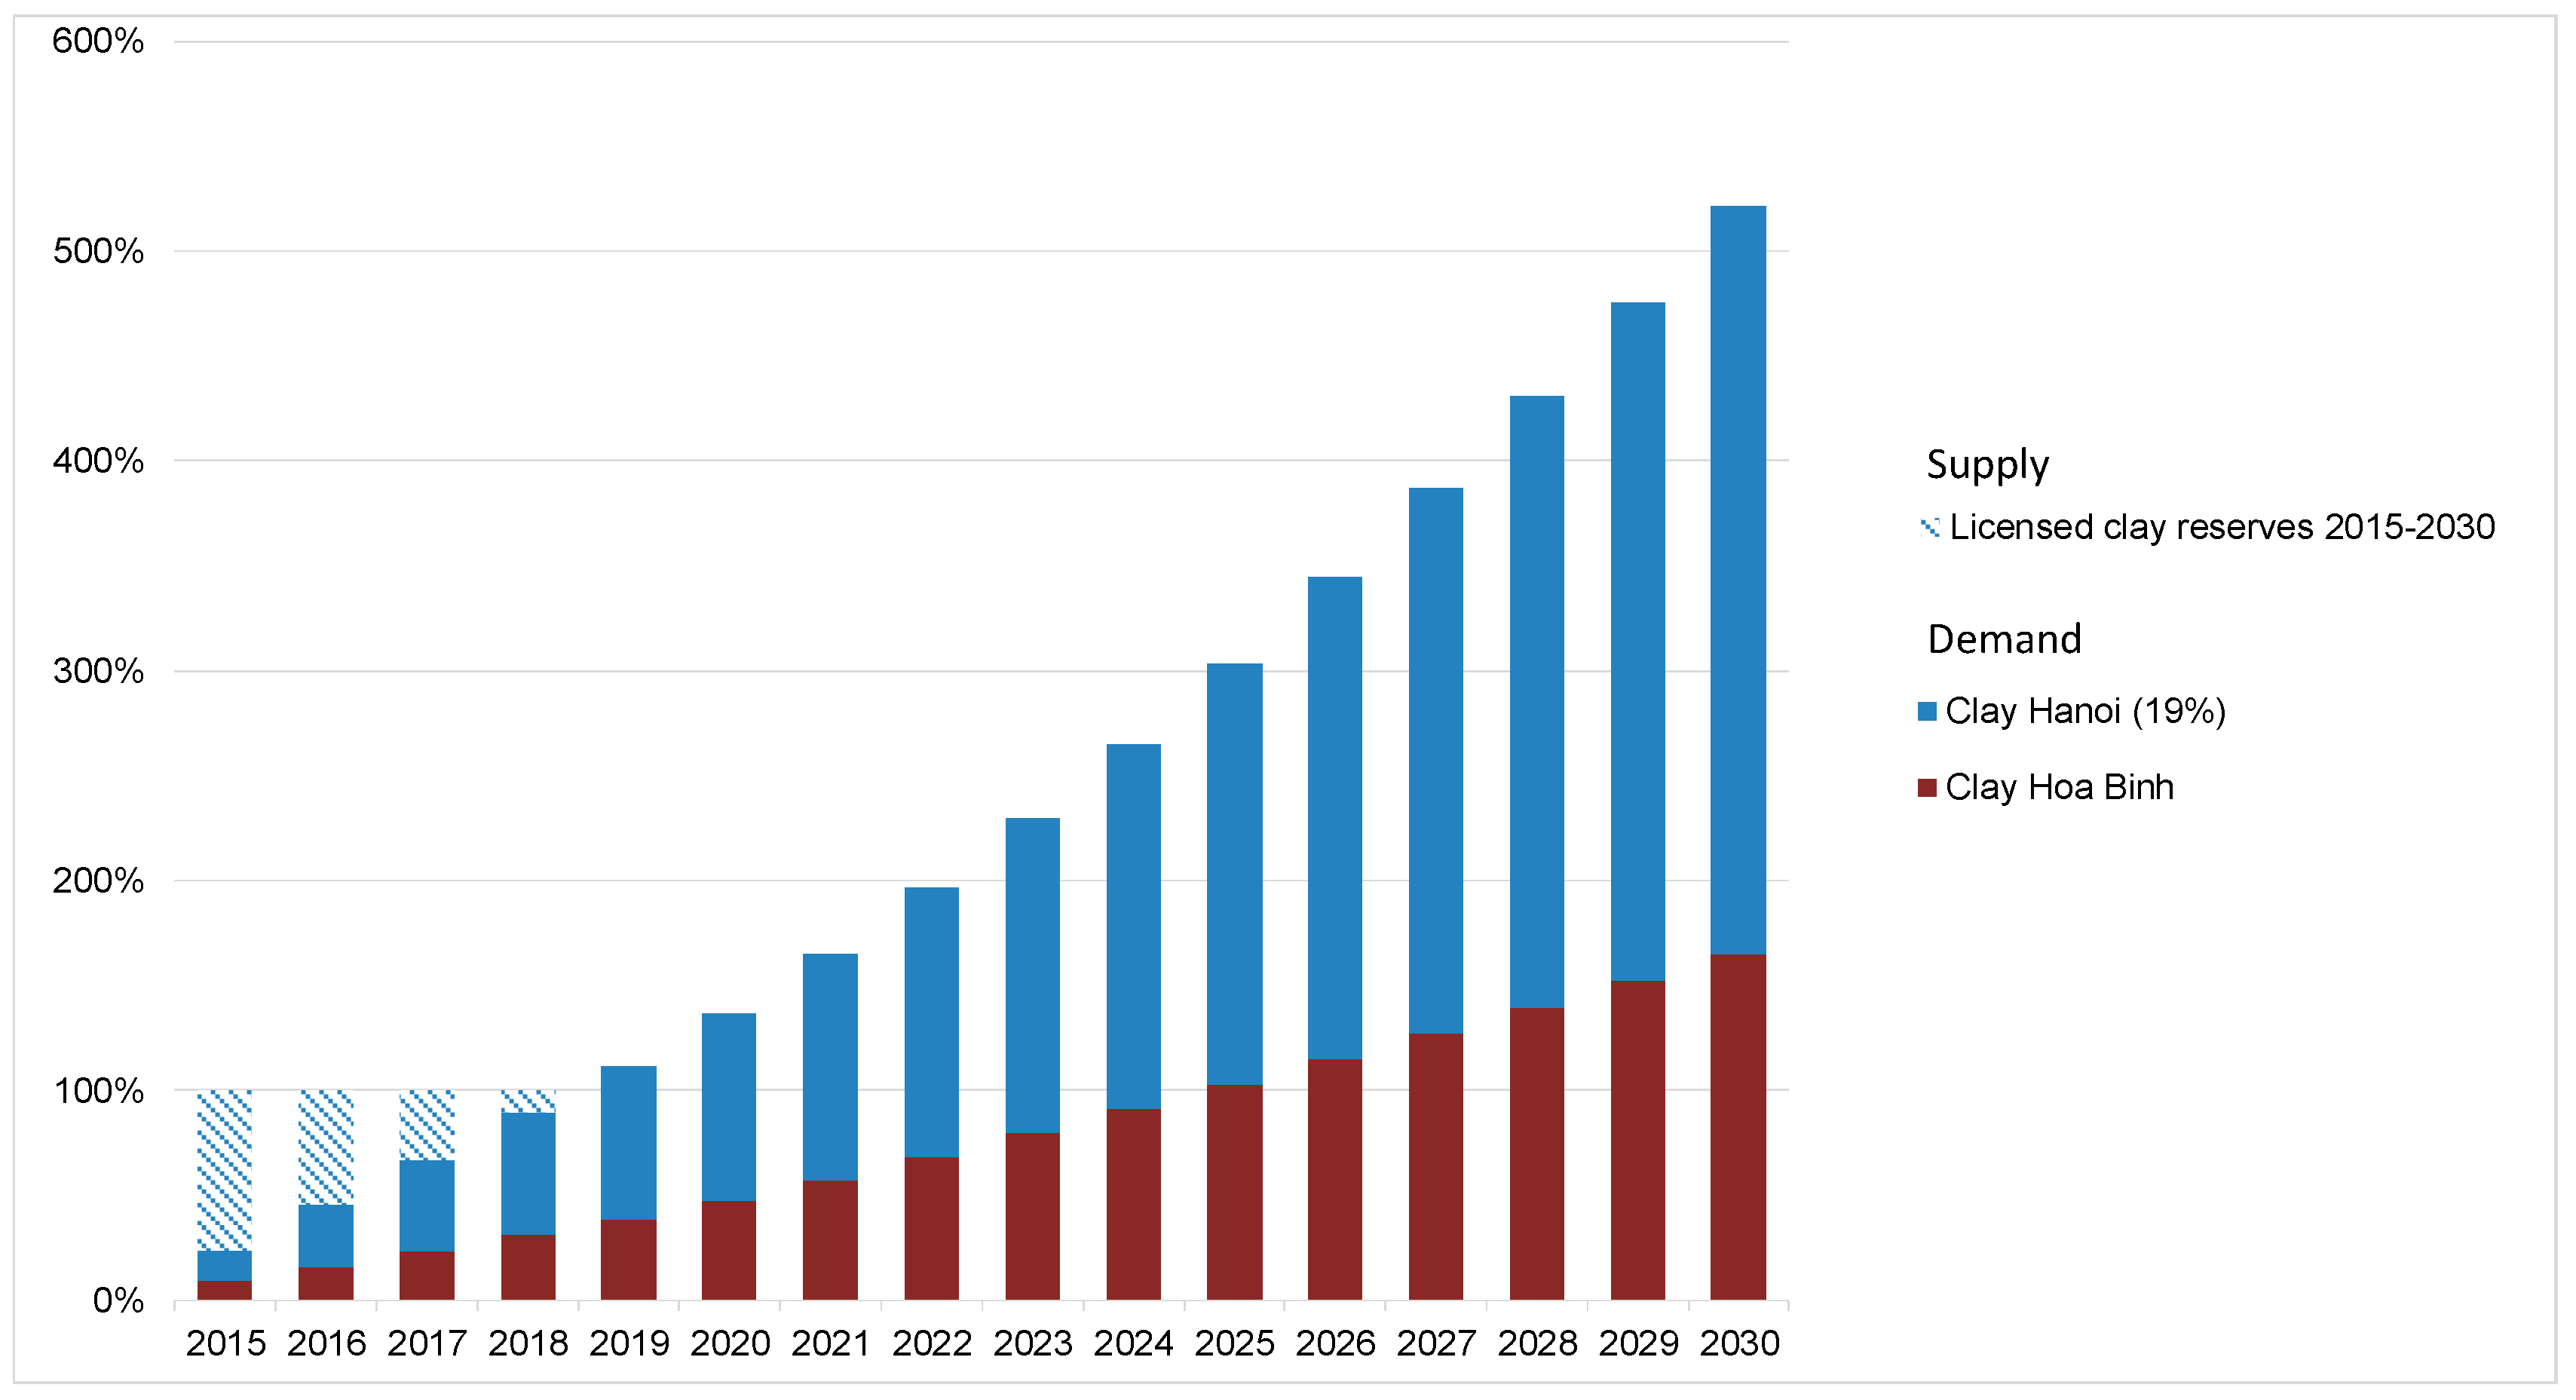
| Reserves in 2015 [mt] | Consumption in 2015 [mt] | Accumulated Demand 2015–2030 [mt] | |||
|---|---|---|---|---|---|
| Already licensed or in the licensing process | Hanoi (100%) | Hoa Binh (100%) | Hanoi (100%) | Hoa Binh (100%) | |
| Clay | 12.13 | 9.88 | 0.90 | 245.54 | 21.25 |
| Sand | 11.14 | 10.54 | 1.02 | 262.13 | 26.46 |
| Aggregates | 715.26 | 15.75 | 3.23 | 391.58 | 65.54 |
© 2020 by the authors. Licensee MDPI, Basel, Switzerland. This article is an open access article distributed under the terms and conditions of the Creative Commons Attribution (CC BY) license (http://creativecommons.org/licenses/by/4.0/).
Share and Cite
Schiller, G.; Bimesmeier, T.; Pham, A.T.V. Method for Quantifying Supply and Demand of Construction Minerals in Urban Regions—A Case Study of Hanoi and Its Hinterland. Sustainability 2020, 12, 4358. https://doi.org/10.3390/su12114358
Schiller G, Bimesmeier T, Pham ATV. Method for Quantifying Supply and Demand of Construction Minerals in Urban Regions—A Case Study of Hanoi and Its Hinterland. Sustainability. 2020; 12(11):4358. https://doi.org/10.3390/su12114358
Chicago/Turabian StyleSchiller, Georg, Tamara Bimesmeier, and Anh T.V. Pham. 2020. "Method for Quantifying Supply and Demand of Construction Minerals in Urban Regions—A Case Study of Hanoi and Its Hinterland" Sustainability 12, no. 11: 4358. https://doi.org/10.3390/su12114358
APA StyleSchiller, G., Bimesmeier, T., & Pham, A. T. V. (2020). Method for Quantifying Supply and Demand of Construction Minerals in Urban Regions—A Case Study of Hanoi and Its Hinterland. Sustainability, 12(11), 4358. https://doi.org/10.3390/su12114358