Trends of Research on Supply Chain Resilience: A Systematic Review Using Network Analysis


Abstract
1. Introduction
2. SC Resilience
3. Analyzing Research Trends with Network Analysis
4. Analysis
4.1. Subjects
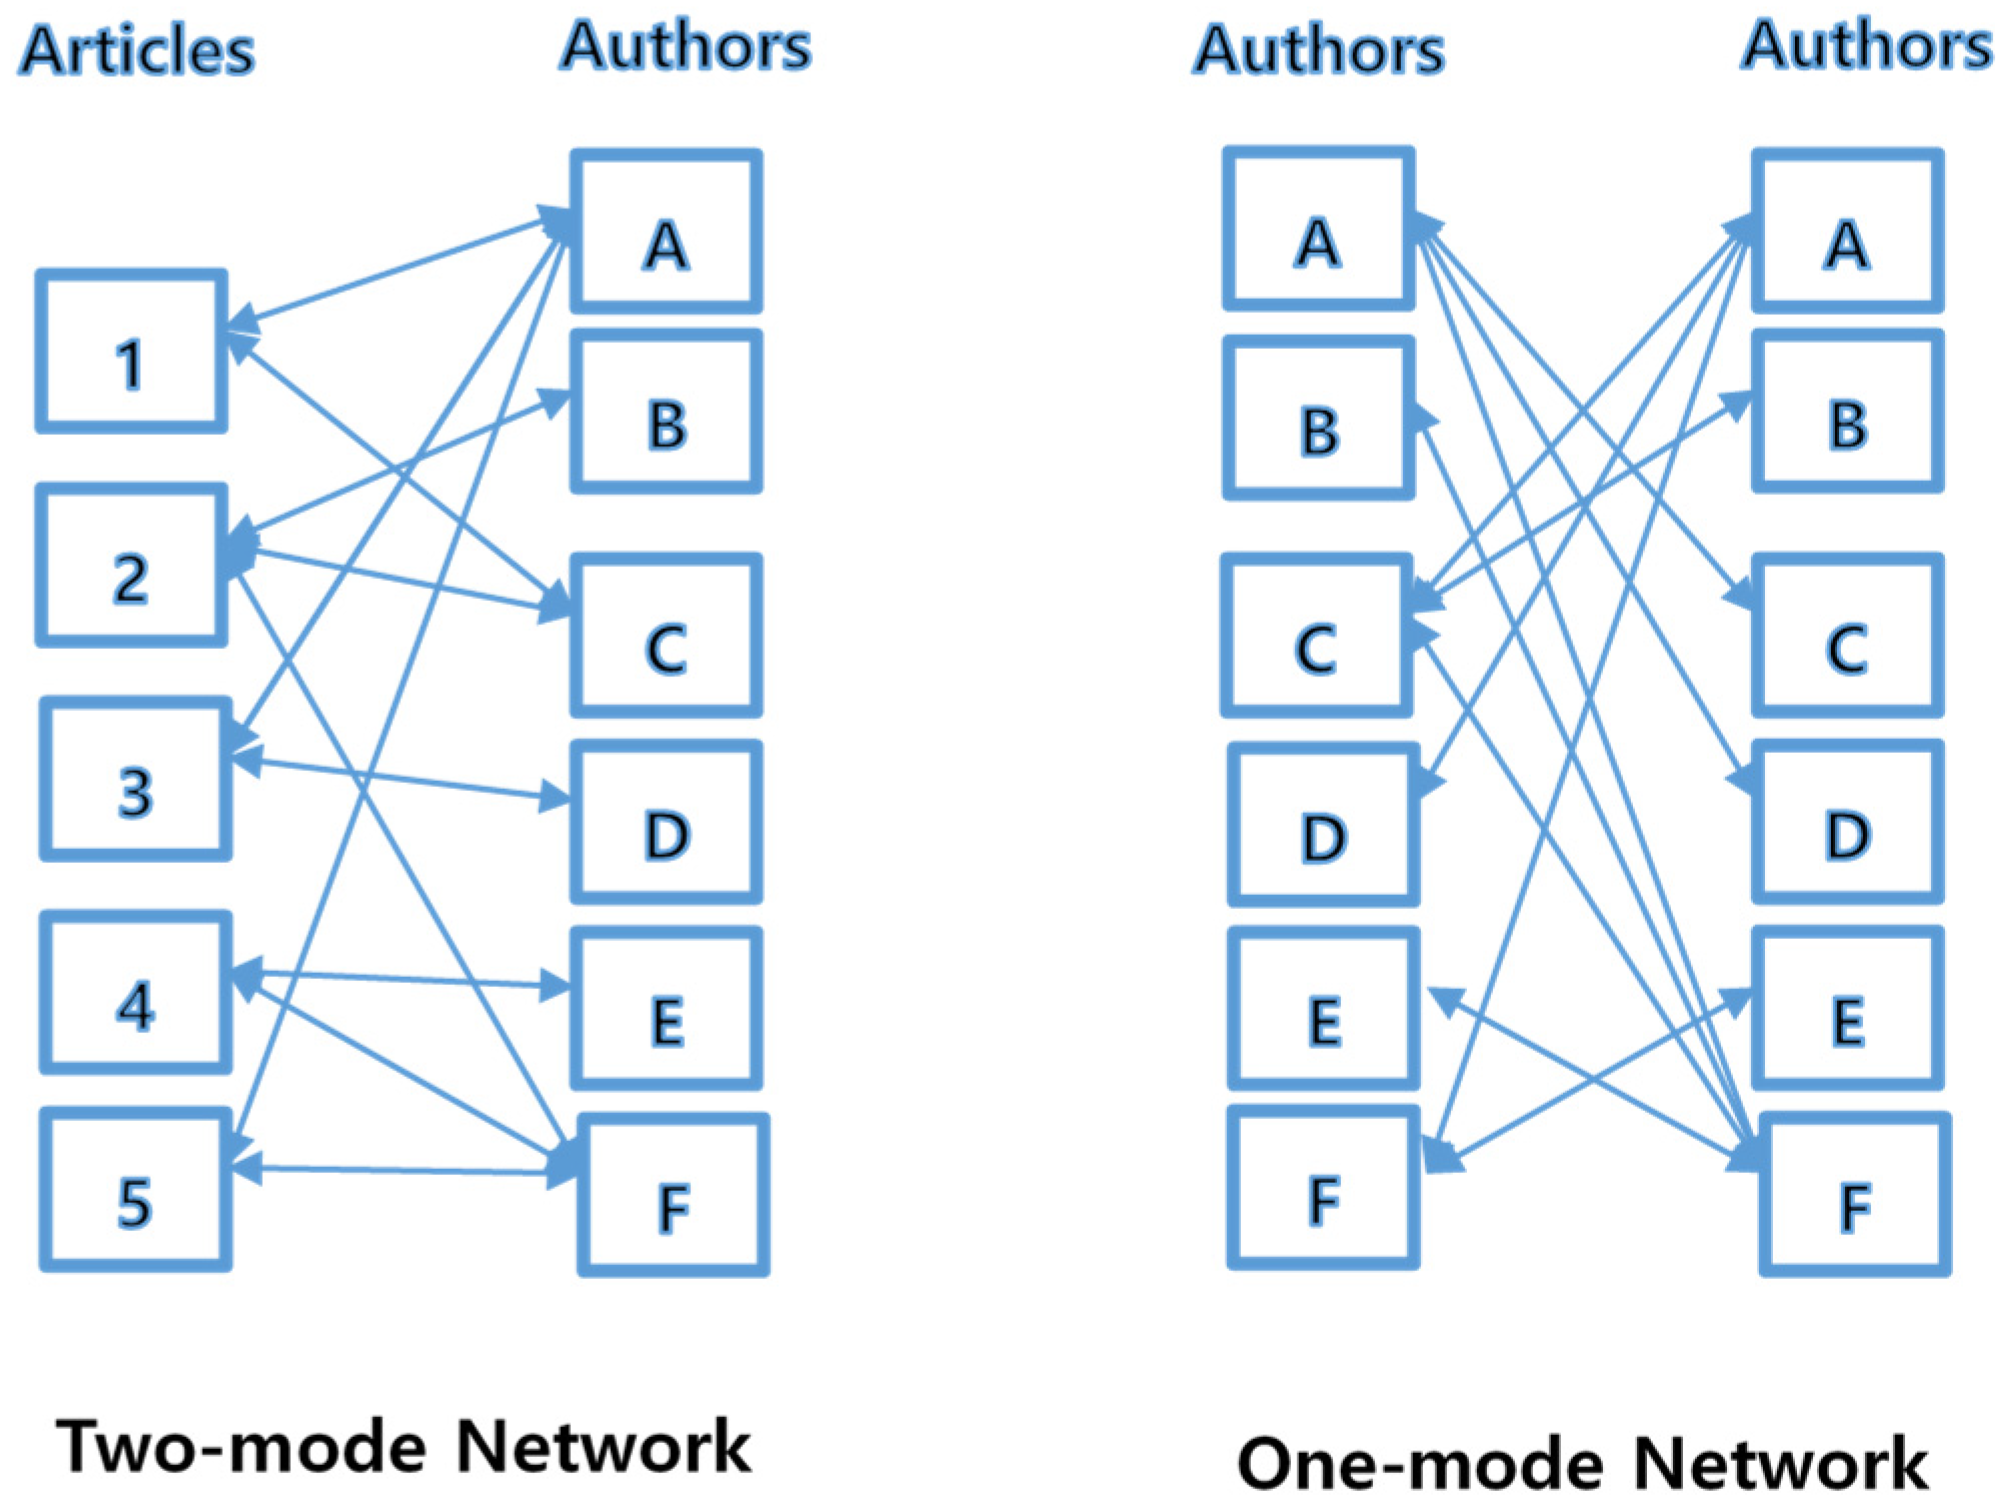
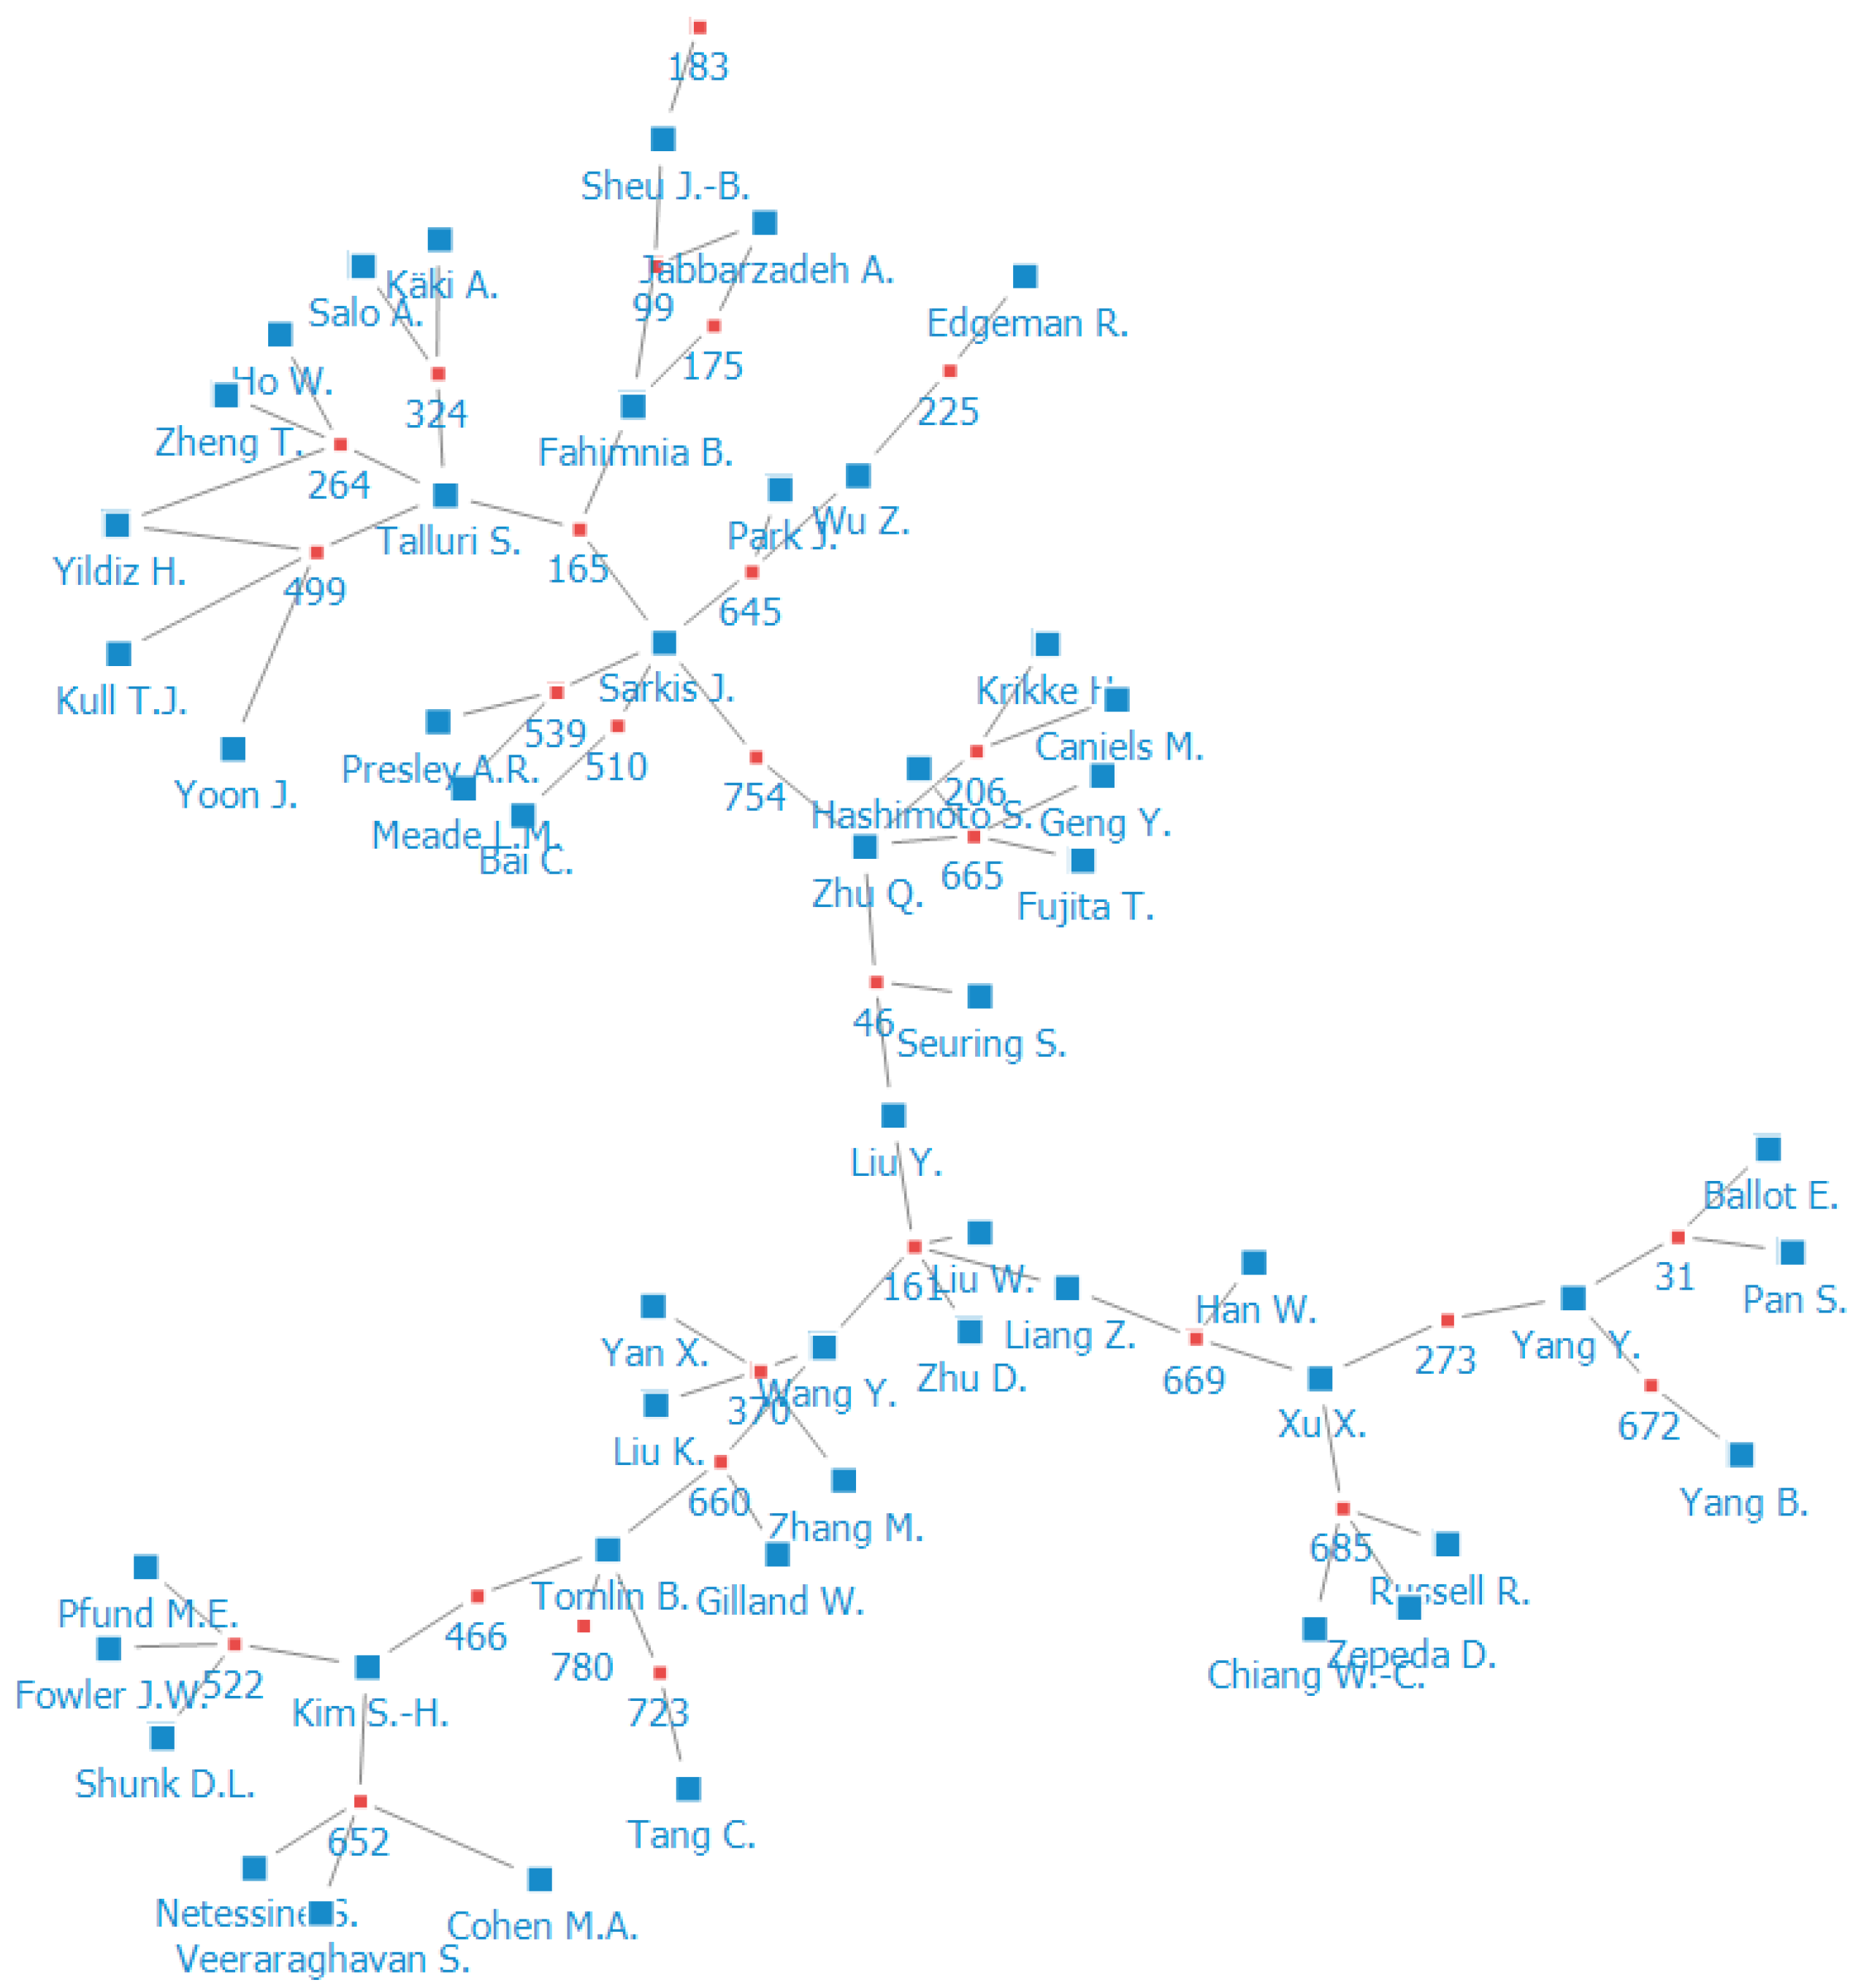
4.2. Coauthorship
4.3. PageRank Analysis
4.4. Cocitation Analysis
4.5. Keyword Analysis
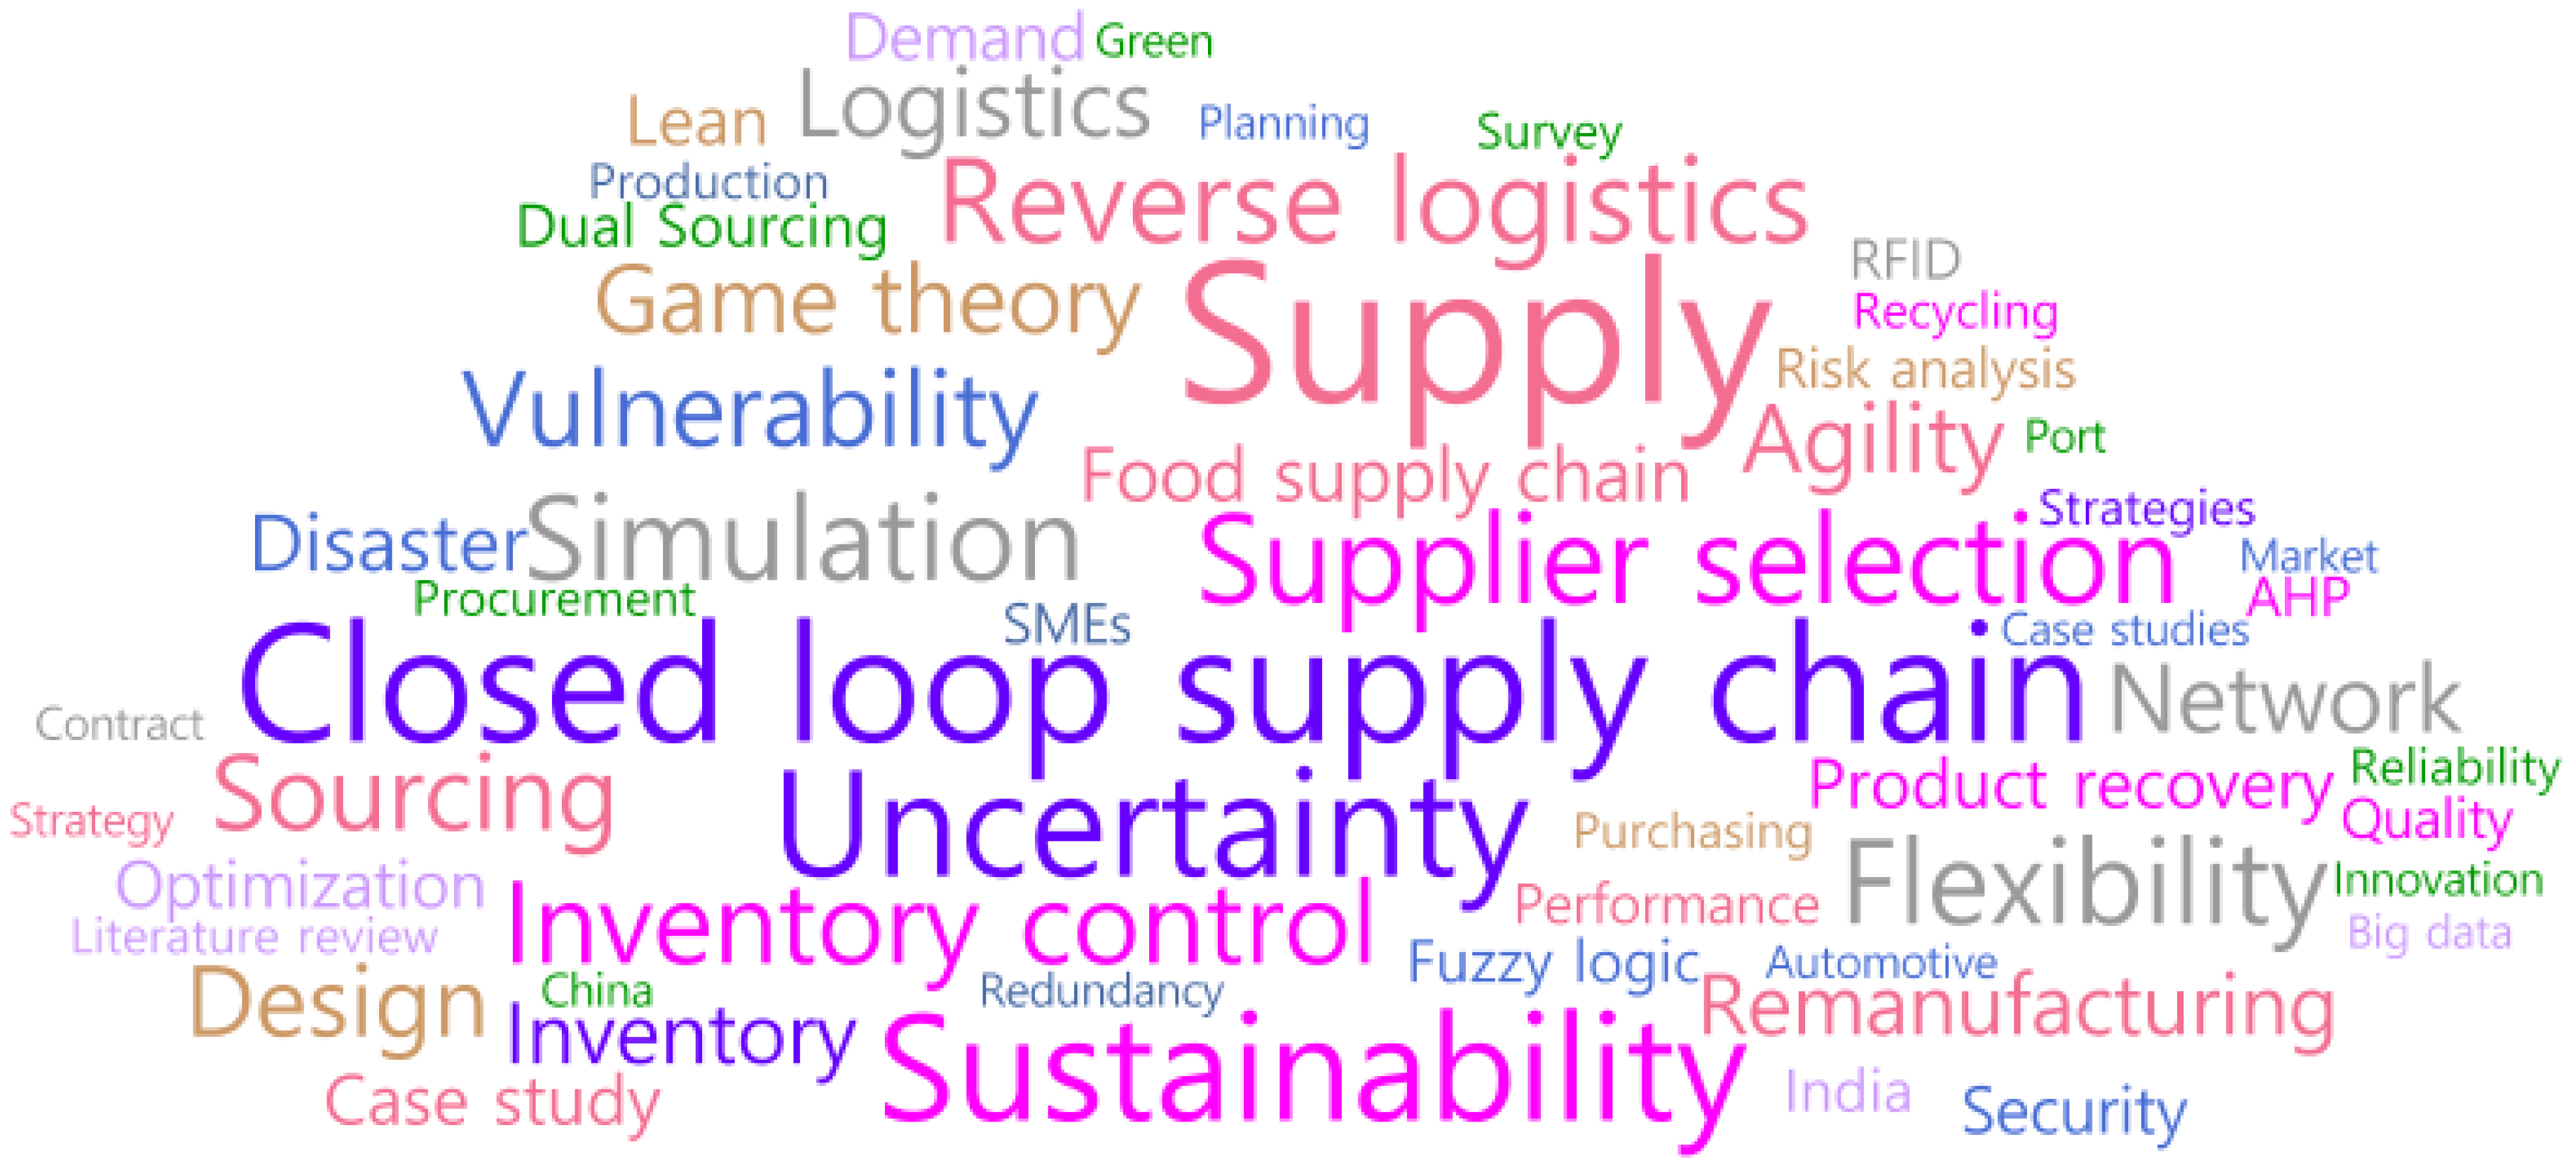
4.5.1. Analysis of Papers Published by 2012
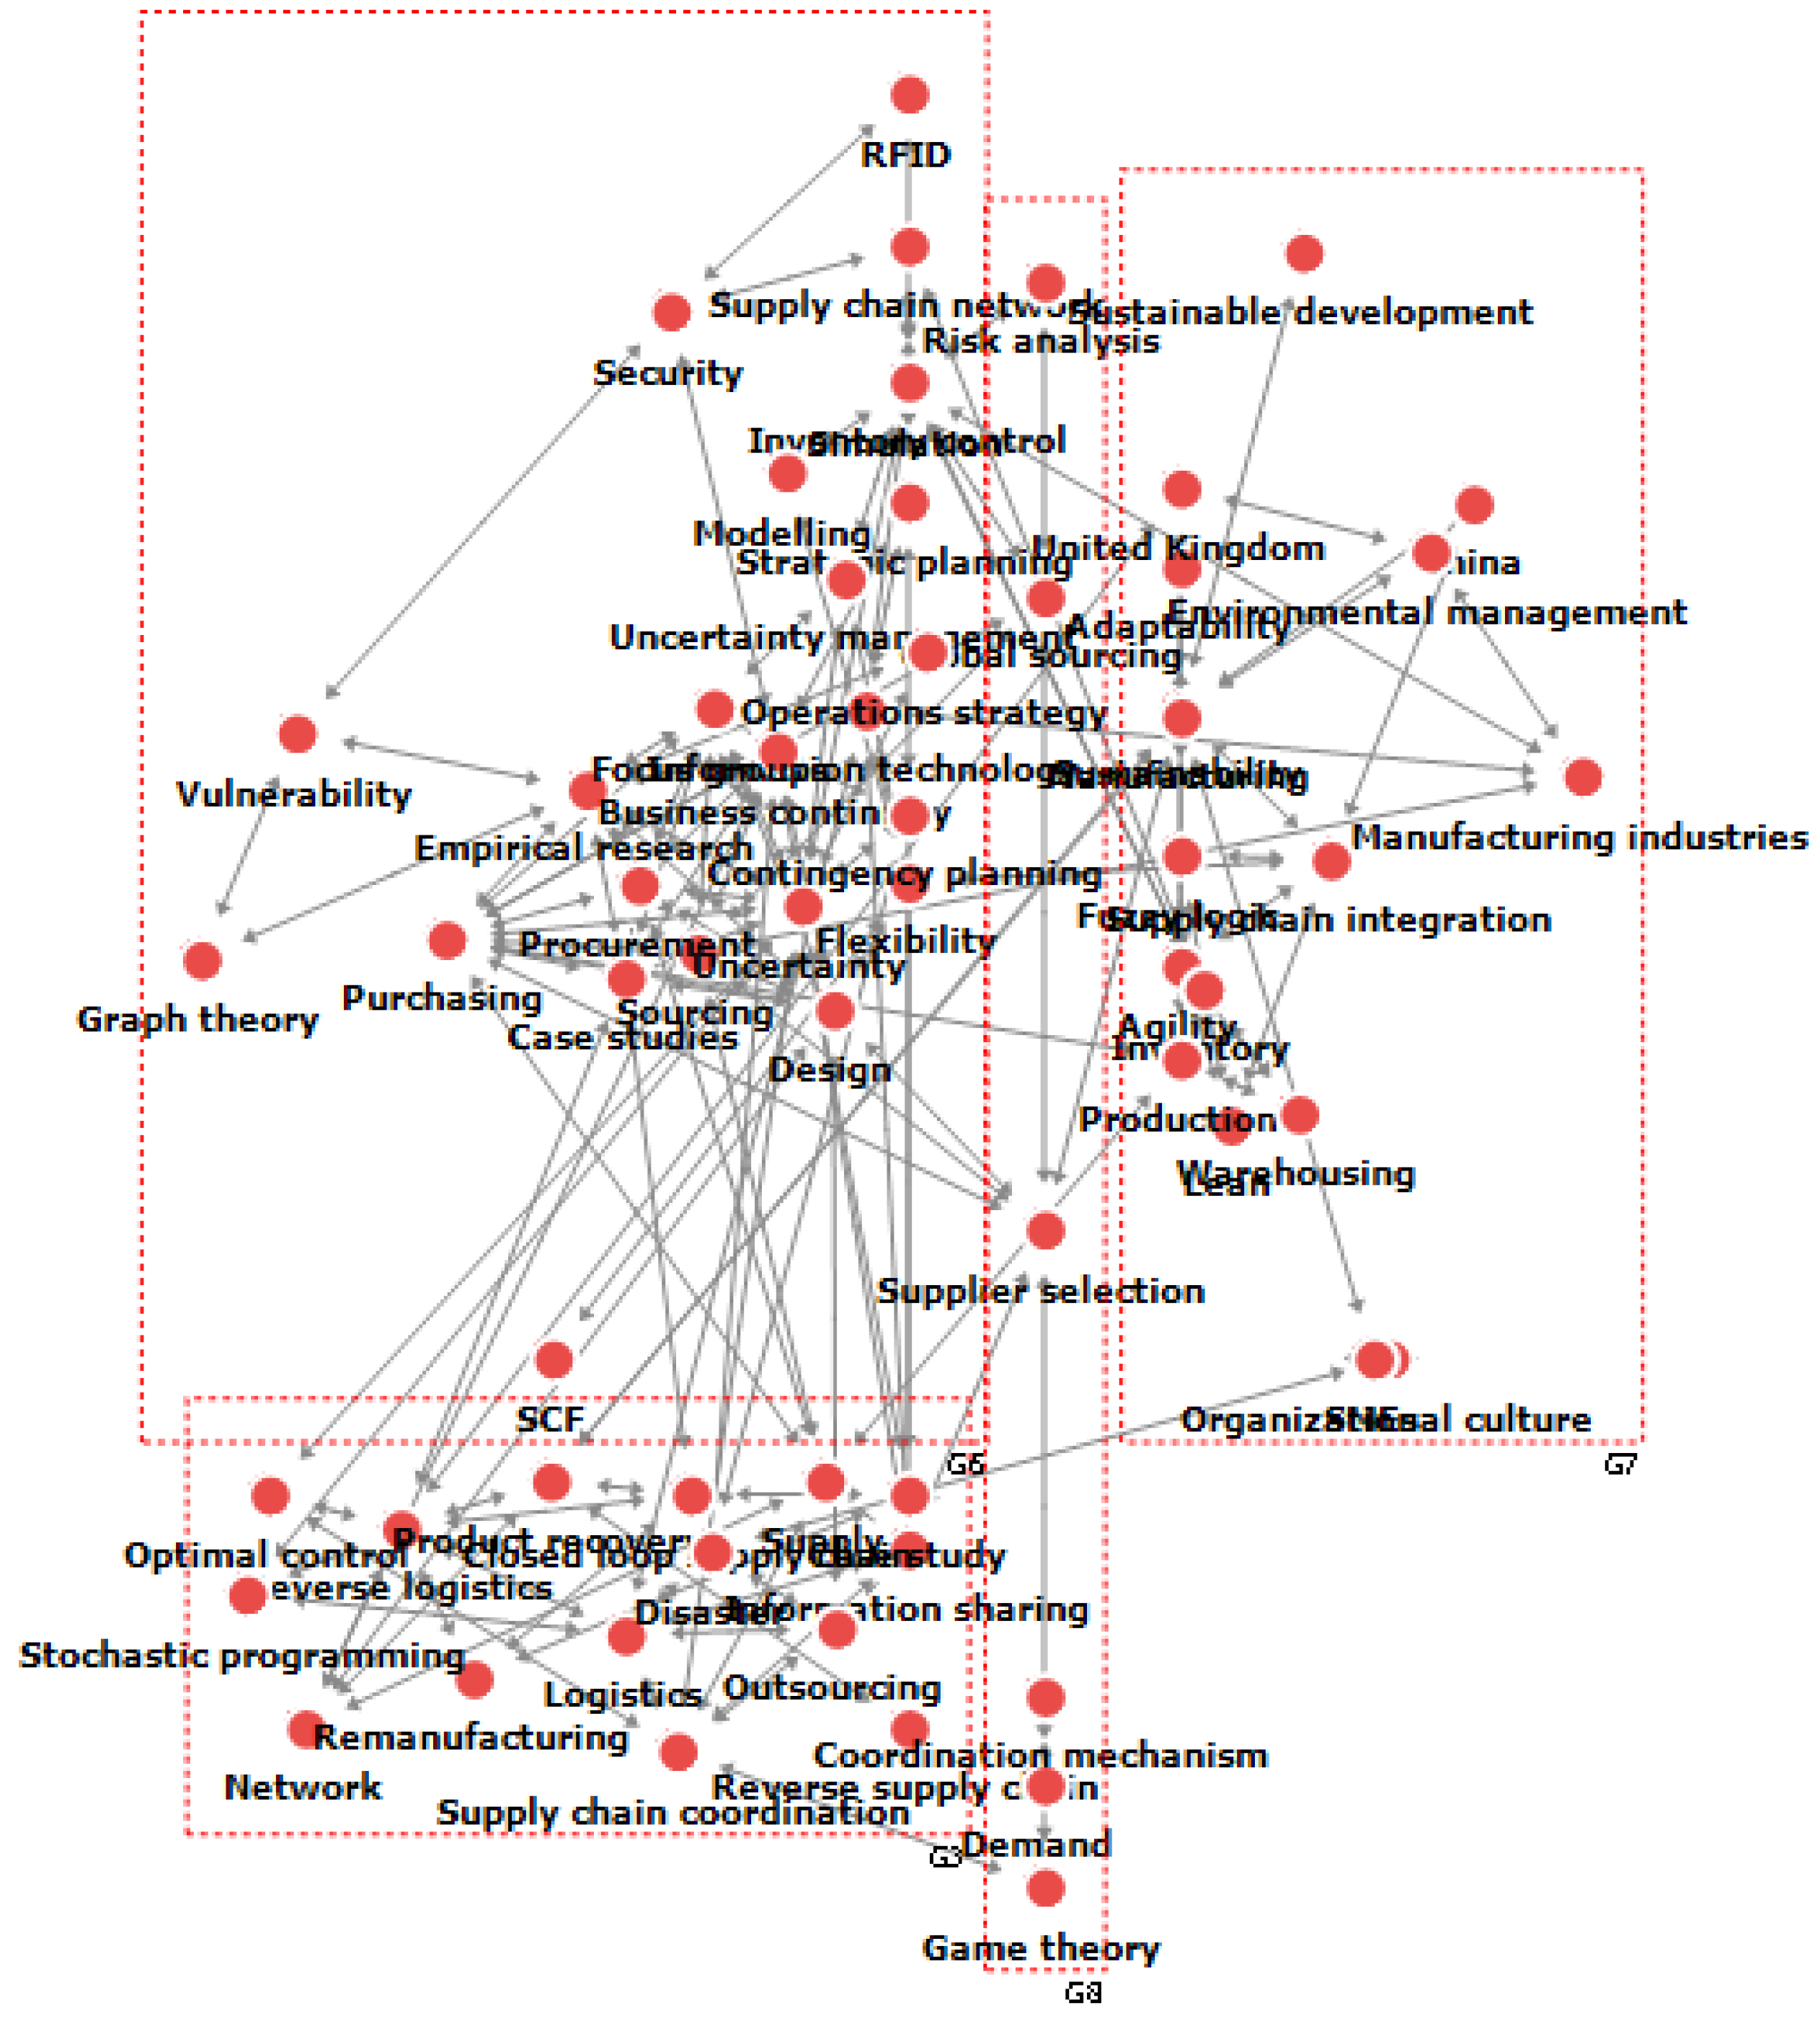
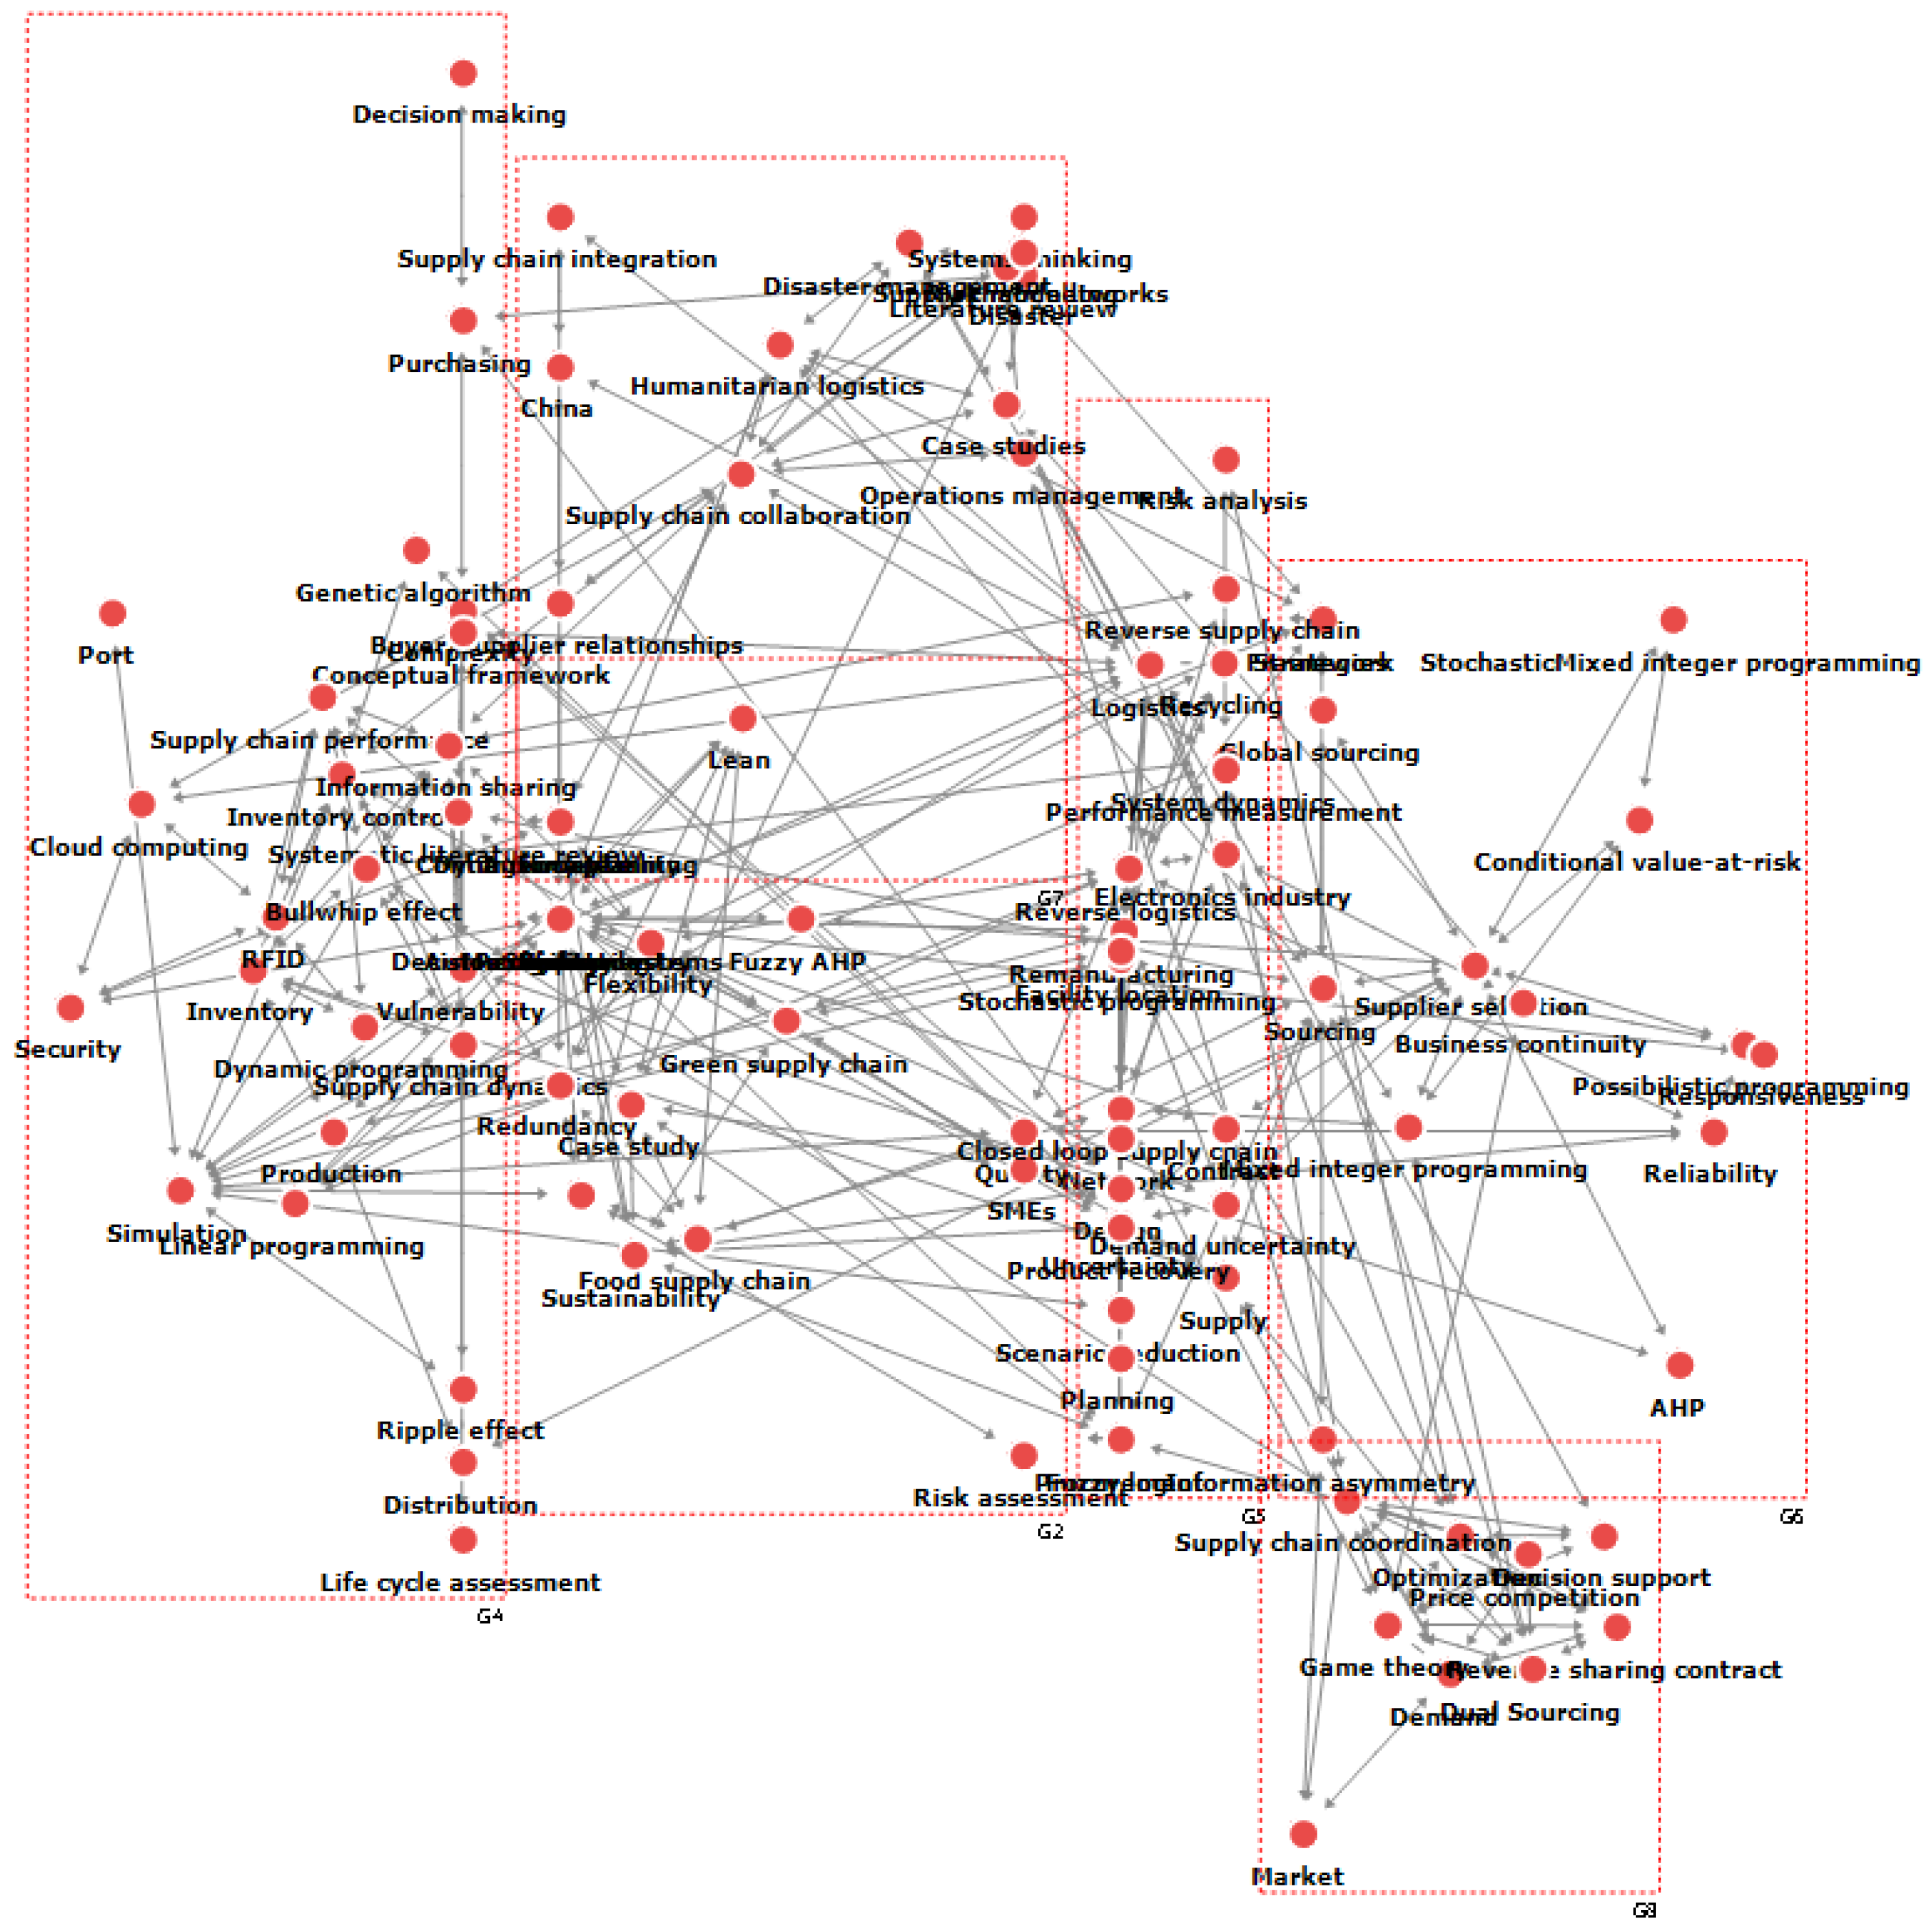
4.5.2. Analysis of Papers Published in 2013–2017
5. Conclusions
Funding
Conflicts of Interest
References
- Tang, C.S.; Zimmerman, J.D.; Nelson, J.I. Managing new product development and supply chain risks: The Boeing 787 case. Supply Chain Forum Int. J. 2009, 10, 74–86. [Google Scholar] [CrossRef]
- MacKenzie, C.A.; Barker, K.; Santos, J.R. Modeling a severe supply chain disruption and post-disaster decision making with application to the Japanese earthquake and tsunami. IIE Trans. 2014, 46, 1243–1260. [Google Scholar] [CrossRef]
- Fahimnia, B.; Tang, C.S.; Davarzani, H.; Sarkis, J. Quantitative models for managing supply chain risks: A review. Eur. J. Oper. Res. 2015, 247, 1–15. [Google Scholar] [CrossRef]
- Perrow, C. The organizational context of human factors engineering. Adm. Sci. Q. 1983, 28, 521–541. [Google Scholar] [CrossRef]
- Perrow, C. Normal accident at Three Mile Island. Society 1981, 18, 17–26. [Google Scholar] [CrossRef]
- Carter, C.R.; Rogers, D.S. A framework of sustainable supply chain management: Moving toward new theory. Int. J. Phys. Distrib. Logist. Manag. 2008, 38, 360–387. [Google Scholar] [CrossRef]
- Singh, A.; Trivedi, A. Sustainable green supply chain management: Trends and current practices. Compet. Rev. 2016, 25, 265–288. [Google Scholar] [CrossRef]
- Papadopoulos, T.; Gunasekaran, A.; Dubey, R.; Altay, N.; Childe, S.J.; Fosso-Wamba, S. The role of Big Data in explaining disaster resilience in supply chains for sustainability. J. Clean. Prod. 2017, 142, 1108–1118. [Google Scholar] [CrossRef]
- Ivanov, D. Revealing interfaces of supply chain resilience and sustainability: A simulation study. Int. J. Prod. Res. 2018, 56, 3507–3523. [Google Scholar] [CrossRef]
- Holling, C.S. Resilience and stability of ecological systems. Annu. Rev. Ecol. Syst. 1973, 4, 1–23. [Google Scholar] [CrossRef]
- Hamel, G.; Välikangas, L. Why resilience matters. Harv. Bus. Rev. 2003, 81, 56–57. [Google Scholar]
- Sheffi, Y. The Resilient Enterprise: Overcoming Vulnerability for Competitive Advantage; MIT Press Books: Boston, MA, USA, 2005. [Google Scholar]
- Sutcliffe, K.M.; Vogus, T.J. Organizing for resilience. Posit. Organ. Scholarsh. Found. A New Discip. 2003, 94, 110. [Google Scholar]
- Colicchia, C.; Dallari, F.; Melacini, M. Increasing supply chain resilience in a global sourcing context. Prod. Plan. Control 2010, 21, 680–694. [Google Scholar] [CrossRef]
- Jüttner, U.; Maklan, S. Supply chain resilience in the global financial crisis: An empirical study. Supply Chain Manag. 2011, 16, 246–259. [Google Scholar] [CrossRef]
- Datta, S.; Granger, C.W.J.; Barari, M.; Gibbs, T. Management of supply chain: An alternative modelling technique for forecasting. J. Oper. Res. Soc. 2007, 58, 1459–1469. [Google Scholar] [CrossRef]
- Brandon-Jones, E.; Squire, B.; Autry, C.W.; Petersen, K.J. A contingent resource-based perspective of supply chain resilience and robustness. J. Supply Chain Manag. 2014, 50, 55–73. [Google Scholar] [CrossRef]
- Blackhurst, J.; Craighead, C.W.; Elkins, D.; Handfield, R.B. An empirically derived agenda of critical research issues for managing supply-chain disruptions. Int. J. Prod. Res. 2005, 43, 4067–4081. [Google Scholar] [CrossRef]
- Lee, H.L. The triple-A supply chain. Harv. Bus. Rev. 2004, 82, 102–113. [Google Scholar]
- Christopher, M.; Peck, H. Building the resilient supply chain. Int. J. Logist. Manag. 2004, 15, 1–13. [Google Scholar] [CrossRef]
- Pettit, T.J.; Fiksel, J.; Croxton, K.L. Ensuring supply chain resilience: Development of a conceptual framework. J. Bus. Logist. 2010, 31, 1–21. [Google Scholar] [CrossRef]
- Maria Jesus Saenz, P.; Xenophon Koufteros, D.; Hohenstein, N.; Feisel, E.; Hartmann, E.; Giunipero, L. Research on the phenomenon of supply chain resilience: A systematic review and paths for further investigation. Int. J. Phys. Distrib. Logist. Manag. 2015, 45, 90–117. [Google Scholar]
- Sreedevi, R.; Saranga, H. Uncertainty and supply chain risk: The moderating role of supply chain flexibility in risk mitigation. Int. J. Prod. Econ. 2017, 193, 332–342. [Google Scholar] [CrossRef]
- Lee, S.M.; Rha, J.S. Ambidextrous supply chain as a dynamic capability: Building a resilient supply chain. Manag. Decis. 2016, 54, 2–23. [Google Scholar] [CrossRef]
- Kim, M.; Chai, S. The impact of supplier innovativeness, information sharing and strategic sourcing on improving supply chain agility: Global supply chain perspective. Int. J. Prod. Econ. 2017, 187, 42–52. [Google Scholar] [CrossRef]
- Scholten, K.; Schilder, S. The role of collaboration in supply chain resilience. Supply Chain Manag. 2015, 20, 471–484. [Google Scholar] [CrossRef]
- Cao, M.; Vonderembse, M.A.; Zhang, Q.; Ragu-Nathan, T.S. Supply chain collaboration: Conceptualisation and instrument development. Int. J. Prod. Res. 2010, 48, 6613–6635. [Google Scholar] [CrossRef]
- Pettit, T.J.; Croxton, K.L.; Fiksel, J. Ensuring supply chain resilience: Development and implementation of an assessment tool. J. Bus. Logist. 2013, 34, 46–76. [Google Scholar] [CrossRef]
- Blackhurst, J.; Dunn, K.S.; Craighead, C.W. An empirically derived framework of global supply resiliency. J. Bus. Logist. 2011, 32, 374–391. [Google Scholar] [CrossRef]
- Kern, D.; Moser, R.; Hartmann, E.; Moder, M. Supply risk management: Model development and empirical analysis. Int. J. Phys. Distrib. Logist. Manag. 2012, 42, 60–82. [Google Scholar] [CrossRef]
- Scholten, K.; Scott, P.S.; Fynes, B. Mitigation processes—Antecedents for building supply chain resilience. Supply Chain Manag. Int. J. 2014, 19, 211–228. [Google Scholar] [CrossRef]
- Fahimnia, B.; Sarkis, J.; Davarzani, H. Green supply chain management: A review and bibliometric analysis. Int. J. Prod. Econ. 2015, 162, 101–114. [Google Scholar] [CrossRef]
- Feng, Y.; Zhu, Q.; Lai, K.H. Corporate social responsibility for supply chain management: A literature review and bibliometric analysis. J. Clean. Prod. 2017, 158, 296–307. [Google Scholar] [CrossRef]
- Mishra, D.; Gunasekaran, A.; Papadopoulos, T.; Hazen, B. Green supply chain performance measures: A review and bibliometric analysis. Sustain. Prod. Consum. 2017, 10, 85–99. [Google Scholar] [CrossRef]
- Lee, S.M.; Rha, J.S. A network text analysis of published papers in service business, 2007–2017: Research trends in the service sector. Serv. Bus. 2018, 12, 809–831. [Google Scholar] [CrossRef]
- Brin, S.; Page, L. The anatomy of a large-scale hypertextual Websearch engine. Comput. Netw. 1998, 30, 107–117. [Google Scholar]
- Ding, Y. Applying weighted PageRank to author citation networks. J. Am. Soc. Inf. Sci. Technol. 2011, 62, 236–245. [Google Scholar] [CrossRef]
- Jüttner, U.; Peck, H.; Christopher, M. Supply chain risk management: Outlining an agenda for future research. Int. J. Logist. Res. Appl. 2003, 6, 197–210. [Google Scholar] [CrossRef]
- Kleindorfer, P.R.; Saad, G.H. Managing disruption risks in supply chains. Prod. Oper. Manag. 2005, 14, 53–68. [Google Scholar] [CrossRef]
- Christopher, M.; Lee, H. Mitigating supply chain risk through improved confidence. Int. J. Phys. Distrib. Logist. Manag. 2004, 34, 388–396. [Google Scholar] [CrossRef]
- Craighead, C.W.; Blackhurst, J.; Rungtusanatham, M.J.; Handfield, R.B. The severity of supply chain disruptions: Design characteristics and mitigation capabilities. Decis. Sci. 2007, 38, 131–156. [Google Scholar] [CrossRef]
- Tomlin, B. On the value of mitigation and contingency strategies for managing supply chain disruption risks. Manag. Sci. 2006, 52, 639–657. [Google Scholar] [CrossRef]
- Hendricks, K.B.; Singhal, V.R. An empirical analysis of the effect of supply chain disruptions on long-run stock price performance and equity risk of the firm. Prod. Oper. Manag. 2005, 14, 35–52. [Google Scholar] [CrossRef]
- Tang, C.S. Perspectives in supply chain risk management. Int. J. Prod. Econ. 2006, 103, 451–488. [Google Scholar] [CrossRef]
- Sheffi, Y.; Rice, J.B., Jr. A supply chain view of the resilient enterprise. Mit Sloan Manag. Rev. 2005, 47, 41. [Google Scholar]
- Peck, H. Drivers of supply chain vulnerability: An integrated framework. Int. J. Phys. Distrib. Logist. Manag. 2005, 35, 210–232. [Google Scholar] [CrossRef]
- Fleischmann, M.; Beullens, P.; Bloemhof-Ruwaard, J.M.; Van Wassenhove, L.N. The impact of product recovery on logistics network design. Prod. Oper. Manag. 2001, 10, 156–173. [Google Scholar] [CrossRef]
- Tang, C.S. Robust strategies for mitigating supply chain disruptions. Int. J. Logist. Res. Appl. 2006, 9, 33–45. [Google Scholar] [CrossRef]
- Babich, V.; Burnetas, A.N.; Ritchken, P.H. Competition and diversification effects in supply chains with supplier default risk. Manuf. Serv. Oper. Manag. 2007, 9, 123–146. [Google Scholar] [CrossRef]
- Nishat Faisal, M.; Banwet, D.; Shankar, R. Information risks management in supply chains: An assessment and mitigation framework. J. Enterp. Inf. Manag. 2007, 20, 677–699. [Google Scholar] [CrossRef]
- Zsidisin, G.; Ellram, L.; Carter, J.; Cavinato, J. An analysis of supply risk assessment techniques. Int. J. Phys. Distrib. Logist. Manag. 2004, 34, 397–413. [Google Scholar] [CrossRef]
- Knemeyer, A.M.; Zinn, W.; Eroglu, C. Proactive planning for catastrophic events in supply chains. J. Oper. Manag. 2009, 27, 141–153. [Google Scholar] [CrossRef]
- Manuj, I.; Mentzer, J.T. Global supply chain risk management strategies. Int. J. Phys. Distrib. Logist. Manag. 2008, 38, 192–223. [Google Scholar] [CrossRef]
- Jüttner, U. Supply chain risk management: Understanding the business requirements from a practitioner perspective. Int. J. Logist. Manag. 2005, 16, 120–141. [Google Scholar] [CrossRef]
- Braunscheidel, M.J.; Suresh, N.C. The organizational antecedents of a firm’s supply chain agility for risk mitigation and response. J. Oper. Manag. 2009, 27, 119–140. [Google Scholar] [CrossRef]
- Beamon, B.M.; Fernandes, C. Supply-chain network configuration for product recovery. Prod. Plan. Control 2004, 15, 270–281. [Google Scholar] [CrossRef]
- Xiao, T.; Qi, X.; Yu, G. Coordination of supply chain after demand disruptions when retailers compete. Int. J. Prod. Econ. 2007, 109, 162–179. [Google Scholar] [CrossRef]
- Blondel, V.D.; Guillaume, J.L.; Lambiotte, R.; Lefebvre, E. Fast unfolding of communities in large networks. J. Stat. Mech. Theory Exp. 2008, 2008, P10008. [Google Scholar] [CrossRef]
- Diabat, A.; Abdallah, T.; Al-Refaie, A.; Svetinovic, D.; Govindan, K. Strategic closed-loop facility location problem with carbon market trading. IEEE Trans. Eng. Manag. 2012, 60, 398–408. [Google Scholar] [CrossRef]
- Qi, X.; Bard, J.F.; Yu, G. Supply chain coordination with demand disruptions. Omega 2004, 32, 301–312. [Google Scholar] [CrossRef]
- Ramos, J. Using TF-IDF to determine word relevance in document queries. In Proceedings of the First Instructional Conference on Machine Learning, Piscataway, NJ, USA, 3–8 December 2003; Volume 242, pp. 133–142. [Google Scholar]
- Li, J.; Wang, S.; Cheng, T.E. Competition and cooperation in a single-retailer two-supplier supply chain with supply disruption. Int. J. Prod. Econ. 2010, 124, 137–150. [Google Scholar] [CrossRef]
- Tang, C.; Tomlin, B. The power of flexibility for mitigating supply chain risks. Int. J. Prod. Econ. 2008, 116, 12–27. [Google Scholar] [CrossRef]
- Kocabasoglu, C.; Prahinski, C.; Klassen, R.D. Linking forward and reverse supply chain investments: The role of business uncertainty. J. Oper. Manag. 2007, 25, 1141–1160. [Google Scholar] [CrossRef]
- Seitz, M.A. A critical assessment of motives for product recovery: The case of engine remanufacturing. J. Clean. Prod. 2007, 15, 1147–1157. [Google Scholar] [CrossRef]
- Ravindran, A.R.; Ufuk Bilsel, R.; Wadhwa, V.; Yang, T. Risk adjusted multicriteria supplier selection models with applications. Int. J. Prod. Res. 2010, 48, 405–424. [Google Scholar] [CrossRef]
- Meena, P.L.; Sarmah, S.P.; Sarkar, A. Sourcing decisions under risks of catastrophic event disruptions. Transp. Res. Part E Logist. Transp. Rev. 2011, 47, 1058–1074. [Google Scholar] [CrossRef]
- Chen, J.; Sohal, A.S.; Prajogo, D.I. Supply chain operational risk mitigation: A collaborative approach. Int. J. Prod. Res. 2013, 51, 2186–2199. [Google Scholar] [CrossRef]
- Schmitt, A.J.; Sun, S.A.; Snyder, L.V.; Shen, Z.J.M. Centralization versus decentralization: Risk pooling, risk diversification, and supply chain disruptions. Omega 2015, 52, 201–212. [Google Scholar] [CrossRef]
- Kim, S.H.; Tomlin, B. Guilt by association: Strategic failure prevention and recovery capacity investments. Manag. Sci. 2013, 59, 1631–1649. [Google Scholar] [CrossRef]
- Torabi, S.A.; Baghersad, M.; Mansouri, S.A. Resilient supplier selection and order allocation under operational and disruption risks. Transp. Res. Part E Logist. Transp. Rev. 2015, 79, 22–48. [Google Scholar] [CrossRef]
- Rajesh, R.; Ravi, V. Supplier selection in resilient supply chains: A grey relational analysis approach. J. Clean. Prod. 2015, 86, 343–359. [Google Scholar] [CrossRef]
- Sawik, T. Joint supplier selection and scheduling of customer orders under disruption risks: Single vs. dual sourcing. Omega 2014, 43, 83–95. [Google Scholar] [CrossRef]
- Sawik, T. Selection of resilient supply portfolio under disruption risks. Omega 2013, 41, 259–269. [Google Scholar] [CrossRef]
- Heckmann, I.; Comes, T.; Nickel, S. A critical review on supply chain risk—Definition, measure and modeling. Omega 2015, 52, 119–132. [Google Scholar] [CrossRef]
- Töyli, H.L.; Lauri Ojala, J.; Wieland, A.; Marcus Wallenburg, C. The influence of relational competencies on supply chain resilience: A relational view. Int. J. Phys. Distrib. Logist. Manag. 2013, 43, 300–320. [Google Scholar]
- Bai, C.; Sarkis, J. Flexibility in reverse logistics: A framework and evaluation approach. J. Clean. Prod. 2013, 47, 306–318. [Google Scholar] [CrossRef]
- Bode, C.; Wagner, S.M. Structural drivers of upstream supply chain complexity and the frequency of supply chain disruptions. J. Oper. Manag. 2015, 36, 215–228. [Google Scholar] [CrossRef]
- Min, H. Blockchain technology for enhancing supply chain resilience. Bus. Horiz. 2019, 62, 35–45. [Google Scholar] [CrossRef]
- Choi, T.Y.; Dooley, K.J.; Rungtusanatham, M. Supply networks and complex adaptive systems: Control versus emergence. J. Oper. Manag. 2001, 19, 351–366. [Google Scholar] [CrossRef]
- Kim, Y.; Chen, Y.S.; Linderman, K. Supply network disruption and resilience: A network structural perspective. J. Oper. Manag. 2015, 33–34, 43–59. [Google Scholar] [CrossRef]
- Blackhurst, J.; Rungtusanatham, M.J.; Scheibe, K.; Ambulkar, S. Supply chain vulnerability assessment: A network based visualization and clustering analysis approach. J. Purch. Supply Manag. 2018, 24, 21–30. [Google Scholar] [CrossRef]
- Wang, J.W.; Ip, W.H.; Muddada, R.R.; Huang, J.L.; Zhang, W.J. On Petri net implementation of proactive resilient holistic supply chain networks. Int. J. Adv. Manuf. Technol. 2013, 69, 427–437. [Google Scholar] [CrossRef]


| Types of Networks | Steps |
|---|---|
| Keywords or Authors Network |
|
| Citation Network |
|
| Source Title | Number of Papers |
|---|---|
| International Journal of Production Economics | 113 |
| International Journal of Production Research | 99 |
| Journal of Cleaner Production | 43 |
| Supply Chain Management | 37 |
| International Journal of Logistics Systems and Management | 27 |
| International Journal of Physical Distribution and Logistics Management | 26 |
| Production Planning and Control | 26 |
| International Journal of Logistics Management | 27 |
| Transportation Research Part E Logistics and Transportation Review | 25 |
| Omega United Kingdom | 17 |
| Journal of Manufacturing Technology Management | 15 |
| International Journal of Logistics Research and Applications | 15 |
| International Journal of Supply Chain Management | 12 |
| Journal of Operations Management | 13 |
| Management Science | 11 |
| Journal of Business Logistics | 12 |
| Production and Operations Management | 12 |
| Industrial Management and Data Systems | 9 |
| International Journal of Information Systems and Supply Chain Management | 9 |
| International Transactions in Operational Research | 9 |
| Journal of the Operational Research Society | 9 |
| Journal of Supply Chain Management | 9 |
| IEEE Transactions on Engineering Management | 8 |
| Manufacturing and Service Operations Management | 8 |
| International Journal of Operations and Production Management | 8 |
| Affiliation | Number of Papers |
|---|---|
| Cranfield University, UK | 21 |
| Michigan State University, US | 17 |
| Auburn University, US | 13 |
| Syddansk Universitet, DK | 12 |
| Pennsylvania State University, US | 11 |
| Hong Kong Polytechnic University, HK | 11 |
| Iowa State University, US | 10 |
| Cardiff University, UK | 10 |
| ETH Zurich, CH | 10 |
| Hochschule für Wirtschaft und Recht Berlin, DE | 10 |
| Arizona State University, US | 9 |
| Nanyang Technological University, SG | 9 |
| AGH University of Science and Technology, PL | 9 |
| University of Tehran, IR | 9 |
| Politecnico di Milano, IT | 9 |
| Indian Institute of Technology, Bombay, IN | 8 |
| University of Tennessee, Knoxville, US | 8 |
| Ohio State University, US | 7 |
| University of Massachusetts, Dartmouth, US | 7 |
| Iran University of Science and Technology, IR | 7 |
| East Carolina University, US | 7 |
| Chinese Academy of Sciences, CN | 7 |
| University of California, Berkeley, US | 7 |
| University Michigan, Ann Arbor, US | 7 |
| Indian Institute of Technology Delhi, IN | 7 |
| Universite Concordia, CA | 7 |
| St. Petersburg Institute for Informatics and Automation, Russian Academy of Sciences, RU | 7 |
| Article | Authors (A, B, C, D, E, and F) | ||
|---|---|---|---|
| 1 | A | C | |
| 2 | B | C | F |
| 3 | A | C | D |
| 4 | E | F | |
| 5 | A | F | |
| Author | Number of Articles |
|---|---|
| Wagner, S.M. | 11 |
| Kumar, S. | 11 |
| Govindan, K. | 11 |
| Ivanov, D. | 10 |
| Sawik, T. | 9 |
| Blackhurst, J. | 8 |
| Craighead, C.W. | 8 |
| Christopher, M. | 8 |
| Sokolov, B. | 7 |
| Li, J. | 6 |
| Zsidisin, G.A. | 6 |
| Gunasekaran, A. | 6 |
| Dolgui, A. | 6 |
| Hanna, J.B. | 5 |
| Autry, C.W. | 5 |
| Jain, V. | 5 |
| Xiao, T. | 5 |
| Cruz-Machado, V. | 5 |
| Sarkis, J. | 5 |
| Authors | PageRank Centrality | Local Citation | Global Citation |
|---|---|---|---|
| Sheffi [12] | 0.023343 | 32 | 765 |
| Jüttner et al. [38] | 0.013424 | 85 | 1180 |
| Kleindorfer and Saad [39] | 0.012898 | 142 | 1553 |
| Christopher and Peck [20] | 0.011997 | 153 | 1786 |
| Christopher and Lee [40] | 0.008174 | 91 | 973 |
| Craighead et al. [41] | 0.008068 | 121 | 878 |
| Tomlin B. [42] | 0.006055 | 72 | 1174 |
| Hendricks and Singhal [43] | 0.005662 | 71 | 952 |
| Tang [44] | 0.004845 | 70 | 1072 |
| Blackhurst et al. [18] | 0.004081 | 62 | 394 |
| Sheffi and Rice [45] | 0.004053 | 53 | 988 |
| Peck [46] | 0.003591 | 34 | 600 |
| Fleischmann et al. [47] | 0.003506 | 14 | 817 |
| Tang [48] | 0.0034 | 40 | 819 |
| Babich et al. [49] | 0.00281 | 27 | 305 |
| Faisal et al. [50] | 0.002589 | 35 | 507 |
| Zsidisin et al. [51] | 0.002465 | 14 | 516 |
| Knemeyer et al. [52] | 0.002379 | 50 | 363 |
| Manuj and Mentzer [53] | 0.002273 | 43 | 794 |
| Jüttner [54] | 0.001935 | 37 | 793 |
| Braunscheidel and Suresh [55] | 0.001905 | 33 | 648 |
| Beamon and Fernandes [56] | 0.001709 | 8 | 213 |
| Xiao et al. [57] | 0.001631 | 14 | 219 |
| Blackhurst et al. [29] | 0.001601 | 33 | 182 |
| Clusters | Contributing Articles | Description |
|---|---|---|
| 1 | Sheffi [12] Sheffi and Rice [45] Xiao et al. [57] Jüttner [54] | Studies that identify unavoidable risks, such as SC disruption due to natural disasters or accidents, and that are concerned with the need for cooperative relationships between partners in SCs |
| 2 | Beamon and Fernandes [56] Diabat et al. [59] Fleischmann et al. [47] | Studies on ensuring ongoing SC management by building a reverse logistics network that requires different approaches from those of forward logistics |
| 3 | Blackhurst et al. [29] Blackhurst et al. [18] Christopher and Peck [20] Christopher and Lee [40] Knemeyer et al. [52] Braunscheidel and Suresh [55] | Conceptual research to define the concept of SC resilience and other such concepts related to building a resilient SC |
| 4 | Faisal, et al. [50] Jüttner et al. [38] Peck [46] Tomlin [42] Zsidisin et al. [51] Manuj and Mentzer [53] | Studies on how to identify, manage, and eliminate risks for SCM |
| 5 | Hendricks and Singhal [43] Kleindorfer and Saad [39] Tang [48] Babich et al. [49] Qi et al. [60] | Studies on the negative consequences of SC disruption and countermeasures |
| Keyword | Degree Centrality |
|---|---|
| Logistics | 0.155963 |
| Closed-loop SC | 0.12844 |
| Flexibility | 0.12844 |
| Reverse logistics | 0.119266 |
| Sourcing | 0.119266 |
| Supplier selection | 0.119266 |
| Simulation | 0.110092 |
| SC coordination | 0.100917 |
| SC collaboration | 0.091743 |
| Design | 0.091743 |
| Remanufacturing | 0.091743 |
| Uncertainty | 0.091743 |
| Sustainability | 0.091743 |
| Vulnerability | 0.091743 |
| Information sharing | 0.082569 |
| Lean | 0.082569 |
| Game theory | 0.082569 |
| Inventory | 0.082569 |
| Agility | 0.082569 |
| Case study | 0.082569 |
| Case studies | 0.073394 |
| Dual Sourcing | 0.073394 |
| System dynamics | 0.073394 |
| Humanitarian logistics | 0.073394 |
| SC dynamics | 0.073394 |
| Inventory control | 0.073394 |
| Electronics industry | 0.06422 |
| Bullwhip effect | 0.06422 |
| SC performance | 0.06422 |
| Automotive industry | 0.06422 |
| Network | 0.06422 |
| Demand | 0.06422 |
| Optimization | 0.06422 |
| Supply | 0.06422 |
| Keyword | Betweenness Centrality |
|---|---|
| Logistics | 0.116057 |
| Closed-loop SC | 0.091598 |
| Sourcing | 0.086677 |
| Flexibility | 0.082875 |
| Supplier selection | 0.08269 |
| Simulation | 0.070481 |
| SC collaboration | 0.066229 |
| Reverse logistics | 0.061657 |
| Vulnerability | 0.061103 |
| Sustainability | 0.055651 |
| Disaster | 0.05108 |
| Remanufacturing | 0.046358 |
| Uncertainty | 0.044336 |
| Case studies | 0.043048 |
| Design | 0.041115 |
| System dynamics | 0.039986 |
| Case study | 0.039254 |
| SC coordination | 0.036294 |
| Information sharing | 0.035957 |
| Humanitarian logistics | 0.032933 |
| Inventory control | 0.032337 |
| Supply | 0.031901 |
| Complexity | 0.030222 |
| Agility | 0.025755 |
| Game theory | 0.025718 |
| Green SC | 0.022181 |
| Purchasing | 0.021193 |
| Network | 0.021127 |
| Optimization | 0.020887 |
| Cluster | Major Keyword | Major Paper |
|---|---|---|
| 1 | Logistics, Strategy, Business continuity, SC collaboration | Chen et al. [68] Scholten et al. [31] |
| 2 | Inventory control, Simulation, Inventory, Bullwhip effect | Schmitt et al. [69] |
| 3 | Supply, Game theory | Kim and Tomlin [70] |
| 4 | Supplier selection, Dual sourcing | Torabi et al. [71] Rajesh and Ravi [72] Sawik [73] Sawik [74] |
| 5 | Closed-loop SC, Demand uncertainty, Reverse logistics, Flexibility, Agility, SC integration | Heckmann et al. [75] Töyli et al. [76] Bai and Sarkis [77] |
| 6 | Global sourcing, Information asymmetry, Buyer/supplier relationships | Scholten and Schilder [26] |
| 7 | Disaster, Complexity, SC networks | Bode and Wagner [78] Heckmann et al. [75] |
| Authors | Degree Centrality |
|---|---|
| Govindan, K. | 0.03869 |
| Craighead, C.W. | 0.02381 |
| Wang, S. | 0.020833 |
| Blackhurst, J. | 0.020833 |
| Wagner, S.M. | 0.020833 |
| Kumar, S. | 0.020833 |
| Li, J. | 0.017857 |
| Autry, C.W. | 0.017857 |
| Diabat, A. | 0.017857 |
| Agarwal, A. | 0.017857 |
| Kumar, V. | 0.017857 |
| Jha, P.C. | 0.017857 |
| Hanna, J.B. | 0.014881 |
| Melnyk, S.A. | 0.014881 |
| Stankovski, S. | 0.014881 |
| Ostojić, G. | 0.014881 |
| Gošnik, D. | 0.014881 |
| Milisavljević, S. | 0.014881 |
| Delić, M. | 0.014881 |
| Beker, I. | 0.014881 |
| Kannan, D. | 0.014881 |
| Gunasekaran, A. | 0.014881 |
| Lai, K.K. | 0.014881 |
| Sonnemann, G. | 0.014881 |
| Tuma, A. | 0.014881 |
| Thorenz, A. | 0.014881 |
| Gemechu, E.D. | 0.014881 |
| Helbig, C. | 0.014881 |
| Young, S.B. | 0.014881 |
| Sokolov, B. | 0.014881 |
| Dolgui, A. | 0.014881 |
| Ivanov, D. | 0.014881 |
| Authors | Degree Centrality |
|---|---|
| Govindan, K. | 0.000622 |
| Wagner, S.M. | 0.000302 |
| Zsidisin, G.A. | 0.000178 |
| Diabat, A. | 0.00016 |
| Jha, P.C. | 0.00016 |
| Ivanov, D. | 0.000077 |
| Craighead, C.W. | 0.000071 |
| Kumar, S. | 0.000053 |
| Qi, X. | 0.000018 |
| Loh, H.S. | 0.000018 |
| Christopher, M. | 0.000018 |
| Jolai, F. | 0.000018 |
| Pavlov, A. | 0.000006 |
| Sokolov, B. | 0.000006 |
| Cluster | Authors |
|---|---|
| 1 | Govidan, K., Jha, P.C., Carvalho, H., Azevedo, S.G., Cruz-Machado, V., Agarwal, V., Darbari, J.D., Fattahi, M., Abdallah, T., and Garg, K. |
| 2 | Wagner, S.M., Zsidisin, G.A., Mizgier, K.J., Ragatz, G.L., Juttner, M.P., Bode, C., Neshat, N., and Melnyk, S.A. |
| 3 | Ivanov, D., Pavlov, A., Sokolov, B., Dolgui, A., and Ivanova, M. |
| 4 | Craighead, C.W., Handfield, R.B., Blackhurst, J., Wowak, K.D., and Ketchend, D.J. |
| 5 | Sonnemann, G., Tuma, A., Thorenz, A., Gemechu, E.D., Helbig, C., and Young, S.B. |
| 6 | Ostojic, G., Gonsnik, D., Milisavljevic, S., Delic, M., Beker, I., and Stankovski, S. |
| Keyword | Degree Centrality |
|---|---|
| Uncertainty | 0.261538 |
| Business continuity | 0.200000 |
| Purchasing | 0.184615 |
| Design | 0.184615 |
| Sourcing | 0.184615 |
| Empirical research | 0.169231 |
| Case studies | 0.153846 |
| Simulation | 0.153846 |
| Procurement | 0.138462 |
| Focus groups | 0.138462 |
| Sustainability | 0.138462 |
| Reverse logistics | 0.138462 |
| Contingency planning | 0.123077 |
| Information sharing | 0.123077 |
| Supplier selection | 0.107692 |
| Logistics | 0.107692 |
| SC coordination | 0.107692 |
| Flexibility | 0.107692 |
| Supply | 0.107692 |
| Information technology | 0.107692 |
| SC integration | 0.092308 |
| Product recovery | 0.092308 |
| Agility | 0.092308 |
| Global sourcing | 0.076923 |
| Inventory control | 0.076923 |
| Disaster | 0.076923 |
| Production | 0.076923 |
| Network | 0.076923 |
| Closed-loop SC | 0.076923 |
| Outsourcing | 0.076923 |
| Case study | 0.061538 |
| Environmental management | 0.061538 |
| Uncertainty management | 0.061538 |
| Security | 0.061538 |
| Strategic planning | 0.061538 |
| SC network | 0.061538 |
| Inventory | 0.061538 |
| Manufacturing industries | 0.061538 |
| Warehousing | 0.046154 |
| China | 0.046154 |
| United Kingdom | 0.046154 |
| Manufacturing | 0.046154 |
| Fuzzy logic | 0.046154 |
| Stochastic programming | 0.046154 |
| Optimal control | 0.046154 |
| Remanufacturing | 0.046154 |
| Vulnerability | 0.046154 |
| Game theory | 0.046154 |
| Lean | 0.046154 |
| Demand | 0.046154 |
| Keyword | Node Betweenness Centrality |
|---|---|
| Uncertainty | 0.124762 |
| Sustainability | 0.123655 |
| Flexibility | 0.095943 |
| Supplier selection | 0.094643 |
| SC integration | 0.080319 |
| Business continuity | 0.07667 |
| Purchasing | 0.071476 |
| Production | 0.066973 |
| Simulation | 0.065881 |
| Design | 0.064901 |
| Empirical research | 0.057637 |
| Product recovery | 0.053706 |
| Reverse logistics | 0.053526 |
| Agility | 0.050867 |
| Sourcing | 0.043434 |
| SC coordination | 0.041485 |
| Contingency planning | 0.038187 |
| Information technology | 0.035228 |
| Case studies | 0.033713 |
| Global sourcing | 0.030193 |
| Disaster | 0.028208 |
| Supply | 0.027276 |
| Logistics | 0.027178 |
| Information sharing | 0.027095 |
| Manufacturing industries | 0.026779 |
| Inventory control | 0.02674 |
| Network | 0.023993 |
| Demand | 0.02386 |
| Security | 0.021302 |
| Inventory | 0.017408 |
| Environmental management | 0.017215 |
| Warehousing | 0.016068 |
| Case study | 0.01572 |
| Game theory | 0.013227 |
| Closed-loop SC | 0.012568 |
| Cluster | Major Keyword | Major Paper |
|---|---|---|
| 1 | Information technology, Information sharing, SC coordination, Strategic planning | Li et al. [62] Qi et al. [60] |
| 2 | Inventory control, Simulation, Inventory, Vulnerability | Christopher and Lee [40] |
| 3 | Agility, SC integration, Adaptability, Flexibility | Braunscheidel and Suresh [55] Tomlin [42] Tang and Tomlin [63] |
| 4 | Reverse SC, Sustainability, Manufacturing | Kocabasoglu et al. [64] Seitz [65] |
| 5 | Supplier selection, Sourcing, Uncertainty, Supply, Procurement | Ravindran et al. [66] Meena et al. [67] |
© 2020 by the author. Licensee MDPI, Basel, Switzerland. This article is an open access article distributed under the terms and conditions of the Creative Commons Attribution (CC BY) license (http://creativecommons.org/licenses/by/4.0/).
Share and Cite
Rha, J.S. Trends of Research on Supply Chain Resilience: A Systematic Review Using Network Analysis. Sustainability 2020, 12, 4343. https://doi.org/10.3390/su12114343
Rha JS. Trends of Research on Supply Chain Resilience: A Systematic Review Using Network Analysis. Sustainability. 2020; 12(11):4343. https://doi.org/10.3390/su12114343
Chicago/Turabian StyleRha, Jin Sung. 2020. "Trends of Research on Supply Chain Resilience: A Systematic Review Using Network Analysis" Sustainability 12, no. 11: 4343. https://doi.org/10.3390/su12114343
APA StyleRha, J. S. (2020). Trends of Research on Supply Chain Resilience: A Systematic Review Using Network Analysis. Sustainability, 12(11), 4343. https://doi.org/10.3390/su12114343