Abstract
In many countries, advisory councils are the most common participatory institution in which public administration interacts with civil society around environmental issues. Nevertheless, our knowledge about them is quite limited. The main goal of this article is to show the differences they present with advisory councils in other policy areas in three main aspects: who participates, how they work, and which are their outputs. These differences are especially important because they emerge again regarding their participants’ opinions and satisfaction. We adopt a quantitative perspective in order to analyze this reality in Spain, a country where advisory councils are widespread and highly institutionalized at national, regional and local levels. After developing a mapping of 2013 existing advisory councils, we selected a sample of 55 in three policy areas. The data collected included their formal rules, composition, website characteristics and a survey to 501 participants. This set of evidence shows that environmental councils are more poorly designed, and that this is consequential since it is related with more negative opinions among their members and to a larger degree of polarization in their perceptions.
1. Introduction
How are environmental problems addressed in participatory institutions? In which aspects do they mirror or differ from how other policies are discussed? Research about what happens in institutions that are purely bottom-up (e.g., environmental movements) or top-down (i.e., government departments and public policies) has been subject to more detailed scrutiny, but far less is known about how environmental participatory institutions work. Significant research has dealt with environmental deliberative institutions [1,2,3] or with specific committees to address environmental issues [4]. Nevertheless, one of the most common participatory institutions, permanent environmental councils that include both civil society and public administrations, has received quite limited attention. In addition, existing research tends to adopt the case study approach, so a general picture is missing of how they work and what their results are.
The main goal of this paper is to describe how environmental councils work in three main dimensions: their participants, working procedures and outputs, which are the three main characteristics of any participatory process as defined by Fung [5]. Describing reality, especially when we lack a clear portrait of its main characteristics, is intrinsically valuable [6]. When this description provides a comparative picture, this is especially valuable since it allows establishing an external frame of reference to the reality under study, environmental councils in this case.
Environmental councils are the environmentally specific variant of a more general category of participatory institutions (for the sake of simplicity, we use participation and deliberation interchangeably throughout the paper): advisory councils. These institutions lack the attractiveness of other democratic innovations [7] that may involve thousands of participants or large economic resources (like participatory budgeting, for example). Nevertheless, the fact that they are relatively easy to organize, while allowing most of the crucial policy actors to be seated around the table, makes them particularly common in many countries and policy areas. Thus, they are common at the local level in countries ranging from North or South America [8,9,10,11] to many European countries [12], being also common at other administration levels [9,13,14] and for many policy areas ranging from traditional social and economic policies to newer ones like the environment [9,13,15]. In most cases, their advisory character makes it clear that their policy influence may be limited, but some of them have been analyzed as best practices of participatory institutions [10]. How do environmental councils fit into this picture? Up to which point are they similar or different to how these institutions work in other policy areas?
Participatory institutions are not only important in what they do but also on how they are perceived. This is the second issue addressed in this paper: we compare the degree of satisfaction of participants in environmental councils and the rest. We show this is lower than in other policy areas and argue that this may be related to the previous organizing characteristics examined, as it has been shown for other cases [16,17].
With these goals in mind, we will focus on one country that gives a reasonably complete picture of the reality of environmental councils: Spain. Spain has environmental councils at all levels of its public administrations, from local to the national. This paper is based on different types of data, including quite a comprehensive list of more than 2000 councils from all policy areas, plus two other datasets which include the organizational characteristics of 55 advisory councils in three policy areas (including environmental ones) and a survey of participants in these same councils.
The next section develops the theoretical argument about which aspects of environmental councils are crucial to analyze, and it details the expectations regarding how those councils may differ from other policy areas. In the methodological section we justify the selection of the Spanish case and present details of the data collection and variables to be used. The empirical section starts with a description and comparison of the main characteristics of environmental councils, showing that in many organizational aspects they are more dominated by public administrations, less resourceful and less willing to make their outputs well-known compared to similar institutions in other policy areas. Then, we show why it matters. That is, how this is related to more limited satisfaction of the participants in these environmental institutions, even when controlling for alternative explanations. They also show a higher degree of conflict and more diversity amongst the opinions of their participants. We conclude the text with a discussion of the main findings and their implications for the broader area of participatory environmental institutions.
2. Theory
The last few decades have witnessed the creation of institutions oriented towards sustainability policies from the perspective of a more participatory and inclusive governance [15,18]. In this article, we focus on advisory councils, since they are one of the most common types of participatory institutions in many countries, not only in environmental policies but also in a wide range of policy areas. Advisory councils seek to articulate a variety of social interests and demands in order to complement state policy-making, through associational bodies or deliberative councils [9,19]. In this article we define our universe of analysis to those advisory councils that meet the following characteristics: collective bodies composed of associations and/or citizens (versus those exclusively composed of politicians and/or experts); those which have a permanent character (not only for specific issues for a given time); and those which are recognized by public administrations as legitimate interlocutors and formal bodies.
2.1. How to Assess Advisory Councils: Fung’s Three Dimensions
One of the most common theoretical frameworks used for the analysis of participatory institutions is the democracy cube provided by Fung [5]. According to him, three main groups of criteria should be used in these assessments related to the participants (who), the internal dynamics (how) and the power and authority of the institution (what for).
“One primary feature of any decision-making device is the character of its franchise, who is eligible to participate and how do individuals become participants?” [5] (p. 67). This criterion brings him to build a dimension going from a more inclusive scenario, where most of the public would be effectively allowed to participate, to the most restrictive one, where only experts and elected representatives would have a voice. Other influential theoretical frameworks (e.g., [7,20]) use different labels (inclusiveness), but also refer to the types and distribution of participants as one of the crucial defining characteristics.
The second central dimension deals with how participants interact with each other, from achieving information to the capacity to establish a deliberative dialogue or a more aggregative or bargaining strategy. For development of the most intense communication modes, different conditions may have to be created, from having enough information and resources provided [21] to having the appropriate deliberative settings created. Again, Smith [7] uses a different concept (“considered judgment”), but he is also referring to the existence of these conditions for a horizontal informed discussion to emerge.
Third, whether it is referred to as policy influence, outputs or results, almost any research about participatory institutions includes their capacity to have specific objectives, that is, to end up with a set of outputs, ideas or recommendations that potentially could be translated into policies [7,10,11,20]. These objectives go beyond specific policy results and also include cultural changes among participants or the overall society, which requires that the activities of the participatory institution are visible to non-participants. As a result, this “what for” idea can be approached from several types of evidence, ranging from their official objectives to the material products they generate or the internal and external communication channels [22].
2.2. From Defining Characteristics to Perceptions
This set of three criteria may provide a framework for judging objective procedures and results. However, the fate of these institutions has always been related to their legitimacy [5,17,23], which suggests a concern for participants’ satisfaction with their functioning. Previous studies have shown that this satisfaction cannot be taken for granted, and may even result in participatory frustration [24,25]. Thus, it is necessary to incorporate participants’ satisfaction into the analysis, since all these aspects influence whether participants have a more or less troubling view of these participatory institutions and the role conflict plays in them.
Most of this research has made these claims without establishing a clear empirical relationship between objective procedures and participants’ satisfaction. However, there are a few exceptions to this rule. For example, Gastil et al. [21], using a diverse dataset of participatory experiences, showed that participants’ satisfaction is the product of different organizational characteristics, including something similar to our how (“democratic participant relations”) and what for (“decision quality”) dimensions. Newig et al. [16] analyzed this relationship in a more homogeneous set of participatory institutions dealing with environmental conflicts, showing also that the acceptance of the output is related to factors connected to our who (stakeholder involvement) and how (procedural fairness). López García [17] analyzed it in consultative councils, also showing the relationship between their working dynamics and perception of success.
In our case, we developed a direct test of whether these three types of characteristics explained participants’ satisfaction. In order to test this idea, we controlled for alternative explanations, including institutional design [26], as well as individual characteristics. The theoretical argument that institutional design precedes satisfaction, as well as the existence of previous empirical evidence and causal claims regarding this causal relationship in other universes, makes its existence quite likely.
2.3. The Specifics of Environmental Participatory Governance
The article does not test explanations about why environmental participatory institutions are different to those in other policy areas, nor does it develop specific hypotheses about it. In any case, two main scenarios emerge about this relationship. One possibility is to expect that if differences with a traditional policy area like education existed, they would be mostly the result of the more recent emergence of the environmental policy area, resulting in weaker institutionalization. The obvious consequence would be to expect that, in the long run, the existing differences would tend to disappear.
The second scenario would point to the existence of particular characteristics of the environmental conflict leading to long standing differences that would not tend to vanish. For example, these would point to conflict as a reality most often present in environmental debates [3,27,28]. The creation in 1994 of the State Environmental Advisory Council in Spain was one instance clearly motivated by the desire of the public authorities to reduce the conflict and, thus, put an end to the blocking of some important environmental plans [27]. Many of the infrastructure programs with environmental consequences have been the object of polarized struggles that would fit into what Bobbio [29] called “hot” issues, often addressed through participatory arrangements in countries like France or Italy [30]. The network of political actors involved in environmental issues is also different to the one we find in more traditional socio-economic policies. In those cases, unions and business interests represent crucial actors to be involved [31], and their degree of representativeness is often easily measured. However, in other policy issues like the environment, the diversity of actors is larger, and their strength and ability to represent different societal interests is less easily weighted. If these differences are consequential, environmental participatory institutions are likely to continue having a harder job in providing acceptable solutions for all in the long run.
3. Materials and Methods
Advisory councils are one of the most common participatory institutions in many countries [8,9,13], including Spain [12]. While many recent democratic innovations have aimed to incorporate individual citizens as participants, organized interests continue to be a central force in any participatory ecosystem. As a result, almost all of them have tried to incorporate institutions to provide a voice for these organized sectors [32].
The Spanish case is also especially interesting for analyzing advisory councils, since they have been used at every territorial level, allowing potential differences to be seen in how they are used from local to national levels. Even if advisory councils are not mandated by law, except in a few exceptional cases, they are extended over the three levels of administration (national, regional and local). As their name indicates, they cannot make decisions, they may only provide advice to public administrations. At the national and regional levels there is a substantial number of cases where the administration is obliged to consult the councils before adopting new regulations, but they do not need to follow their recommendations or provide formal answers to their proposals. Advisory councils are normally linked to one of the government departments and their level of formal and real autonomy (through having their own web page or their own personnel) varies widely from case to case.
In the case of environmental councils, their development over the last few years of the 20th century [33] was made more extensive within the framework of Agenda 21 and achieved a richer network of policy actors [34]. Spain represents an especially rich setting where their existence can be analyzed and compared to similar institutions working in other policy areas.
The results presented in this article belong to three datasets: General, Thematic and Satisfaction. The most general overview comes from the General dataset, which aimed to capture all the existing advisory councils at three territorial levels of the Spanish public administration: national level, the 17 existing regions and the 25 largest cities. The latter includes all those with more than 250,000 inhabitants, as well as those with more than 175,000 inhabitants and which are provincial capitals. These mixed criteria allowed a more diverse set of cities to be captured, since using only population would have resulted in a sample which included mostly metropolitan cities, concentrated in a few areas of the country. The search that was developed to build this General dataset was carried out mostly through web scraping. In a few cases, when information was not available on the internet, we contacted the administrations to ask for a list of councils. This procedure resulted in the collection of information of 2013 advisory councils (14% of which dealt with environmental issues). The information collected on all these councils included their name, main policy areas, administrative distribution and contact details.
The second step involved building a sample of these councils to obtain more detailed information about them. In order to do this, we selected three types of sectorial councils: one traditional social policy such as education; one new type of policy such as the environment (with a comparatively lower presence of traditional actors, like unions or business); and one identity-related policy, such as immigration. (The data collection process also included the territorial council representing the central district of each city. However, to enable a comparison of more similar designs, we exclude territorial councils from the analysis developed in this article.) For each of these policies, we selected all advisory councils at national and regional levels for one specific type of council (e.g., general environmental council). We also singled out the same advisory council in a maximum of one (randomly selected) municipality per policy area in each of the 17 regions. Data collection resulted in a sample of 55 advisory councils: 23 education, 20 environment and 12 immigration. Five of these councils were at national level, 35 at regional and 15 at local.
For each of these councils, we aimed to collect two types of data. Firstly, we coded their functioning documents and rules to capture information about their aims, composition and organization. We then added some additional codes of their web pages, their media presence and their social networks in 2018. In this way, we could capture their visibility and transparency policies (Thematic dataset). This work was developed by three coders from the research team that met weekly during the process to discuss difficult cases and homogenize coding criteria. Table 1 summarizes the operationalization of these 17 variables featuring the composition of advisory councils, their internal dynamics, their objectives and outputs, as well as the year of creation and their presence in the media and on social networks. When the variables addressing the “who”, “how” and “what for” dimensions originally had more than two categories of response, they were dichotomized to simplify the presentation of results in the bivariate analyses. Therefore, Table 1 and Table 2 show, when necessary, the original quantitative version of the variables included in the multivariate regression analyses and the qualitative recodification.

Table 1.
Variables of the thematic dataset and their operationalization.
Table 2.
Variables of the Satisfaction dataset and their operationalization.
Secondly, in November 2017 we sent an online questionnaire to the members of the same sample of advisory councils (Satisfaction dataset). It included questions about council dynamics and their satisfaction with them, following a similar instrument developed by Fobé et al [14]. After five months and several follow-up messages, we collected information from 501 participants from sectorial councils (141 of whom were participants in environmental councils), belonging to 55 advisory councils (20 environmental councils). For further details of the data collection procedure, see [35]. We used two different methods to contact participants. In some cases (less than half of the initial sample), we were able to obtain the full contact details of participants and sent them a direct link to the survey. In these cases, we reached a response rate of 30.3% of participants. In other cases, we sent the survey to an intermediary (normally, the council Secretary) who distributed it to the participants. In these cases, we achieved a lower response rate of 12.5%. In a few cases, we were not able to gather any responses. These councils probably include non-active councils, as well as some of the most poorly functioning ones, meaning that our results show a slightly more optimistic reality than the full universe.
Table 2 shows operationalization of the 20 variables taken from the Satisfaction dataset. They represent a wide array of perceptions regarding different aspects of the participatory process, including some more general views and specific evaluations of several of the crucial steps. The variables are organized in Figures 5–8 depending on whether they referred to satisfaction. There were four categories that summarized some of the main dimensions of all participatory institutions: (1) a general assessment of the overall participatory process (5 variables); (2) the information received (5 variables); (3) the advice generated (5 variables); and (4) perceptions regarding conflict (4 variables). All these items in the questionnaire provided scales of six or seven categories of response. We grouped the positive responses (strongly satisfied, quite satisfied and somewhat satisfied) in one category. The figures only show this category as a means of simplifying the presentation of the results. Nevertheless, in all cases the statistical analyses have been tested with both a three-category codification and the original full scales in order to check the robustness of the results.
The information provided by these three datasets does not necessarily represent a perfect picture of the full universe of advisory councils and their participants, but it is one of the most complete existing pictures of these institutions and their diversity in any country.
Using these three sets of information, we began by describing how environmental councils worked, using the General and Thematic datasets, by comparing them to other sectorial councils. We focused on the three main aspects described previously: who makes up the council, how the internal dynamics work and what are their objectives and outputs. We developed a bivariate analysis with the type of councils as the independent variable for showing that environmental councils are actually different to the rest (testing if the differences are statistically significant according to Cramer’s V).
The second step of the results section is to explore the perceptions of the participants in environmental councils and compare them to the perceptions of participants from other sectorial councils. The bivariate analysis also shows that environmental councils were more polarized in their responses to the questionnaire, by comparing the standard deviations of each of these variables through the three policy areas. Finally, through multiple regression analysis, we checked that the differences of perceptions between environmental councils and the rest were significant once controlling for several relevant variables: territorial level, council board autonomy, presence of public administration, total number of individual members in plenary and type of members.
4. Results
Where do we find environmental councils? In the General dataset of advisory councils, there were 285 environmental councils, the second largest sectorial presence after the economy (399), followed quite far behind by education (123) and health (119).This relatively large presence is mostly because of councils related to the governing boards of each of the Natural Parks. Environmental councils existed at the national level and in each of the 17 regions (with varying presence ranging from 2 to 40), but the situation was even more diverse at the local level, with 8 cities having no environmental councils and other cities such as Barcelona having 6.
The Thematic dataset shows when these advisory councils were created. A comparison with the other two sectors covered (education and immigration) shows how these issues were incorporated into the public agenda with different timings. The first environmental councils were created at the beginning of the 1990s (see Figure 1), while almost half of them appeared between 1994 and 1998, and the rest emerged at different times between 2001 and 2008 (the information of one environmental council is missing). They are newer than the education councils (40% created in the 1980s), but older than the immigration councils (mostly created between 2001 and 2016). The different timings may be related to the results we find in the varying degree of resources they have: advisory councils were still quite exceptional institutions during the 1980s, and their creation was accompanied by greater autonomy and human and budgetary resources, whereas their expansion in more recent times has probably resulted in more limited resources.
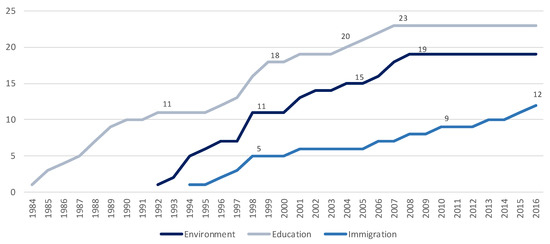
Figure 1.
Number of advisory councils according to the years of creation by policy area (N = 55).
We described and compared characteristics following the three main dimensions proposed by Fung [5] concerning the participants, functioning and outputs. For each of them, we selected the four available variables that better contributed to capture the ideas included in the definition of these dimensions. In 13 of the 14 variables, the differences between the three types of councils were statistically significant.
Concerning the participants’ composition, one of the clearest differences between environmental and other advisory councils was related to the public administration’s degree of control over the crucial power structures of the council. Thus, environmental councils almost always (95%) had no autonomy of the council board; that means, the President and Vice President belong to the public administration. Furthermore, they never had a Second Vice President, the figure often created in other councils to provide a presence of civil society in the advisory council’s direction, when President and Vice President belong to the administration. In contrast, this lack of autonomy was present in 35% of educational councils and one-fourth of the immigration councils (see Figure 2).
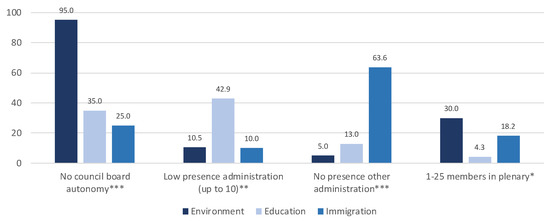
Figure 2.
Who: Composition by policy area (N = 55). *** Differences are statistically significant at 0.01 level; ** 0.05 level; * 0.1 level. When the original variables shown in Figures 2–4 had more than two categories, Cramer’s V analyses have been reproduced with a 3-category coding, obtaining very similar results.
This greater degree of control by the public administration was also enhanced through another crucial rule: the council’s composition. Only in around 10% of the environmental (and immigration) councils did the administration constitute a small part, up to 10% of the members. This figure is enlarged particularly in environmental councils since their multilevel character means that there is also a significant presence of other public administrations (only absent in 5% of the cases). Environmental councils were also the smallest in size: almost one-third of them counted up to 25 members in the plenary sessions.
When we focused on the internal dynamics (how), environmental councils were also less complex and active (see Figure 3). They held fewer yearly plenary meetings (if we focus on the average number of meetings per year, environmental councils had 2.1 meetings, immigration councils had 2.3 and school councils had 2.6), and they less frequently had a standing committee and working groups with more deliberative small group dynamics. In contrast, all educational councils and most immigration councils had these collegiate bodies. In terms of resources that allow a more independent functioning, environmental councils were provided with an independent budget or with their own staff less frequently than the others, especially when compared to educational councils.
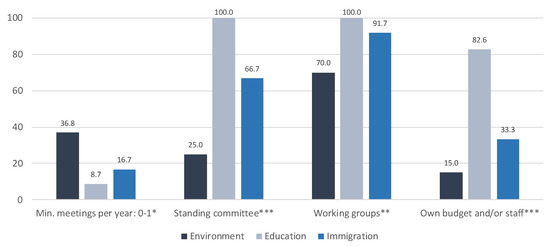
Figure 3.
How: Internal dynamics by policy area (N = 55). *** Differences are statistically significant at 0.01 level; ** 0.05 level; * 0.1 level.
The third main group of characteristics analyzed deals with the outputs and activities of the councils (what for). Again, in this field, environmental councils presented some relevant differences (see Figure 4). Two main types of results appeared. Firstly, the council was expected to develop activities, with environmental councils devoted to producing fewer outputs. Secondly, the fate of these outputs was less formalized in terms of communication, follow-up and publicity, especially compared with educational councils. Thus, the communication channels with political authorities were formally established in fewer cases. Mechanisms to carry out a follow-up of the ideas approved in advisory councils are rare in all sectorial councils, but they were present in 22% of the educational councils, compared to only 5% in environmental councils. Regarding visibility, reports were publicly available online for 87% of the educational councils and only for 15% of environmental councils.
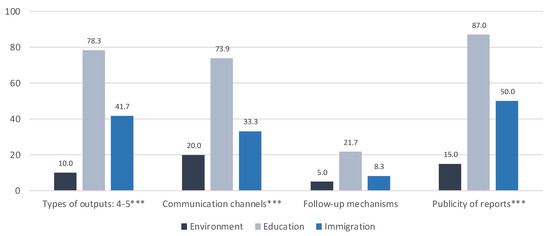
Figure 4.
What for: Objectives and outputs by policy area (N = 55). *** Differences are statistically significant at 0.01 level.
The presence of advisory councils on social networks and the media was often limited. Only 14.5% of councils had a Twitter or Facebook account, and all of these were educational councils. In terms of activity, almost one-third (30.4%) of educational councils generated 50 or more tweets mentioning them in 2018, but this was the case for only one immigration and one environmental council. In the printed press, 17.4% of educational councils appeared in 10 or more articles in El País, compared to, again, only one immigration and environmental council.
Do all these differences matter? The online survey of participants allowed us to explore the participants’ opinions regarding several aspects of their activity, including satisfaction towards the participatory process, information, advice and conflict, comparing the members of environmental councils to the others. In all 19 analyzed variables, the differences of opinions between the three types of councils were statistically significant.
Participants in environmental councils were less satisfied with the participatory process (see Figure 5). More than 50% thought that the decision-making process was fair and transparent, that the scope of debates was substantive, and they felt involved with the generated advice. However, this percentage was significantly higher among participants in other councils. In addition, more than two-thirds of environmental council participants considered that the plenary was politically diverse and that all important stakeholders were represented, but again the members of other councils showed greater levels of satisfaction.
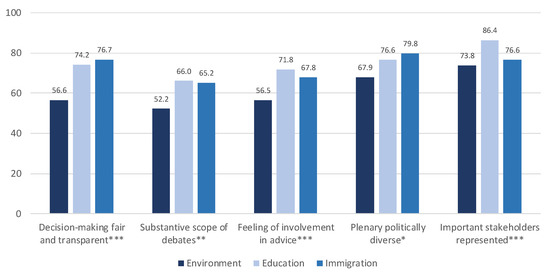
Figure 5.
Satisfaction with the participatory process by policy area (N=501). *** Differences are statistically significant at 0.01 level; ** 0.05 level; * 0.1 level.
A similar picture appeared when we focused on the information process of advisory councils (see Figure 6). Members of the environmental councils were less satisfied with the information provided compared to the others: the quantity, the diversity and impartiality, the provision when requested and the role of politicians in keeping the council informed. Curiously, the perception of the level of attention paid by the media on the issue of advice was higher among environmental council members, although in this case the indicator points to the external interest towards the issues at stake.
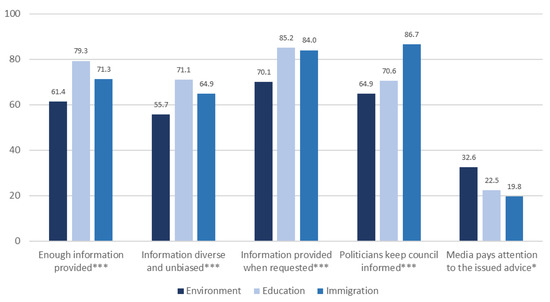
Figure 6.
Satisfaction with information by policy area (N=501). *** Differences are statistically significant at 0.01 level; * 0.1 level.
Environmental council participants were also the least satisfied with the advice produced by the council (see Figure 7). They perceived that the advice was of a lower quality, it was not as clear, it had less social support and was less representative of the existing diversity. Also, the administration was perceived as somewhat less receptive towards the advice provided by the councils.
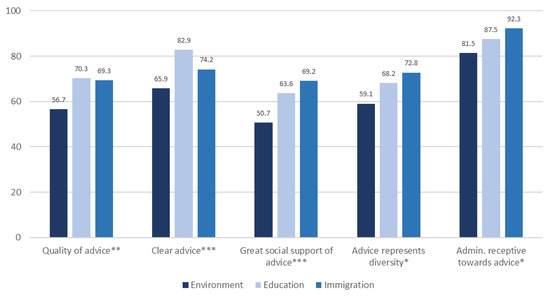
Figure 7.
Satisfaction with advice by policy area (N=501). *** Differences are statistically significant at 0.01 level; ** 0.05 level; * 0.1 level.
Finally, we analyzed the perceptions of participants regarding conflict (see Figure 8). The differences were significant again: participants in environmental councils considered, to a lower extent, that the interaction in the plenary was constructive, that it supported the generation of a consensus, that the members reached a consensus and that there was good communication in the plenaries. All these variables support the idea that conflict is a stronger reality in the environmental councils.
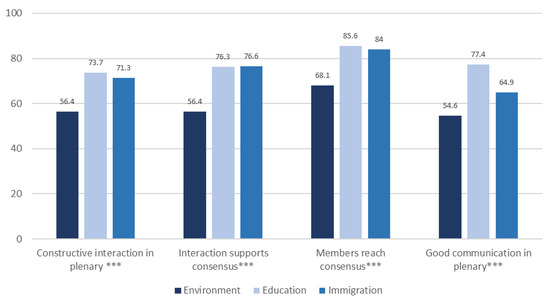
Figure 8.
Perceptions regarding conflict by policy area (N=501). *** Differences are statistically significant at 0.01 level.
In order to check the robustness of the analysis shown in the previous figures, Table A1 in the annex summarizes the results of complementary statistical analyses. Using different strategies for measuring the items that captured participants’ opinions, the results are almost identical.
This perceived conflict can also be detected in other results: the members of environmental councils expressed more diverse and polarized opinions. If we compare the standard deviation (as a measure of dispersion in the responses), it was higher in the case of environmental councils in 17 of the 19 satisfaction-related variables (see Table 3). These differences of variances were statistically significant in 16 out of the 19 variables. This fact reinforces the idea that the level of agreement and shared perceptions were less prominent in environmental councils, which translates into more polarized perceptions regarding a broad set of issues.
Table 3.
Standard deviations of satisfaction variables by policy area.
The final step consisted of developing multivariate regression analyses in order to corroborate that the observed differences of perceptions between the participants in environmental councils and the rest were still significant once we controlled for several variables. Table 4 summarizes the results of the 19 regressions (one for each item that captured the participants’ opinions as the dependent variable, with the type of council as independent variable), showing that immigration, and especially educational councils, tended to generate higher satisfaction levels than environmental councils.
Table 4.
Summary of multiple linear regression analysis results: explanatory coefficients of education and immigration councils (category of reference: environmental councils).
In 14 out of 19 satisfaction indicators there was a statistically significant effect of the policy area: in seven cases the educational councils generated higher satisfaction (the environmental councils are the category of reference in the regression models), in four cases the immigration councils generated higher satisfaction, and in the remaining three cases both kinds of councils produced higher levels of satisfaction compared with the environmental councils. The positive sign of almost every coefficient was consistent with the previous bivariate analysis: environmental councils generated lower satisfaction. The only exception was the case of the attention that media paid to the issued advice, but the relationship was not statistically significant.
Table A2 in the annex shows the control variables that are statistically significant. Territorial level (with higher degrees of satisfaction in regional and especially local councils) mattered in many cases, civil society members had more critical views in many cases, and other institutional design characteristics (mainly the degree of council autonomy) were also often important.
5. Discussion
This paper has two crucial objectives. Firstly, we provided a systematic picture of how environmental councils work, using one of the most complete existing datasets on them in a single country, covering their local, regional and national levels of existence. Secondly, in building this picture through the comparison of environmental participatory institutions with those in other policy areas, we explored how they differ (in the who, how and what for dimensions) and why it matters (as reflected in participants’ satisfaction).
With these objectives in mind, we focused on what in many countries are the most common participatory institutions: advisory councils. This is also the case in Spain where environmental councils are quite common (285 of them, in the three territorial levels covered). Compared to the other two policy areas that were analyzed in more detail here (education and immigration), the headline is clear: environmental councils send worse signals in almost any of the indicators reviewed. First, regarding the voices being heard, the public administration has a larger presence in their governing bodies, and this is especially important since they often lack a plural standing committee where other voices could be heard. Second, they have more limited resources and activity. Third, they have fewer outputs and accountability mechanisms, which are also less visible to society (beyond participants) since they have very limited transparency policies. Thus, even if our data are clearly partial and do not incorporate important aspects like the content of environmental decisions, it tends to show more of the perils (e.g., the limits of inclusion) of participatory institutions presented by Baber and Bartlett [20] than of their promises.
The contrast is especially strong with educational councils, where almost the opposite characteristics are found (with immigration councils somewhat in between the two). This weaker institutional design of environmental councils is likely to be related to the other important characteristic: they have systematically worse perceptions of their members. Thus, their members are less satisfied with the participatory process, the information provided and the advice generated. Also, conflict and polarization appear as a stronger reality in environmental councils.
Using different datasets and types of analyses has contributed to more robust results, especially because, in spite of their diversity, all of them point in the same direction. Statistically significant differences appeared in a considerable number of variables, with information which builds quite a coherent picture, despite belonging to different data collection strategies (from official documents to websites and an online questionnaire) and types of information (both objective and subjective).
The lower levels of satisfaction found in environmental councils continued to hold even when we controlled for other relevant explanations. Once these controls were introduced, environmental councils continued to have less satisfied participants in many cases, but not all coefficients were significant. This means that part of these lower levels likely is due to the other explanatory variables considered: local and regional level councils have more satisfied participants, who are also over-represented among administration participants. Advisory councils with lower degrees of autonomy also have negative effects on satisfaction. This lower level of autonomy is a characteristic that is more prevalent among environmental councils, showing that part of the satisfaction differential found among these councils is due to the institutional design they adopted, with an administration which does not want to lose control over their functioning and decisions. However, even after controlling for institutional design, environmental councils do worse than education (in many cases) and immigration councils (in some cases).
Why do these differences continue to exist? In the future, comparison of our results with similar research in other countries would be very fruitful. Now, our results cannot provide a definitive answer to this question, merely some provisional hypotheses which are to be tested in further research. In sum, two main scenarios emerge. One points to a structural difference that will not vanish easily; the issues being discussed (“hot” in nature, [29]) and the diversity of civil society actors (more diverse than in educational councils, for example) would mostly explain the differences. The most optimistic scenario would focus on the year of creation of the councils as a crucial explanation, and we would expect that, in the long run, environmental councils could evolve to become more similar to educational councils. However, the fact that immigration councils do better, even if they are newer than the environmental ones, points to the limits of this optimistic explanation.
One of the few deviant cases in the data could signify that these poor results are far from an inevitable pattern. In the Aragon environmental council, many of the patterns shown above are different: a President who pertains to the experts and not the public administration sector (and the Vice President to civil society), four plenary meetings a year and an intensive production of reports and documents that are fully available on their webpage. Even the story of its creation is different, since the law that regulates its functioning was the result of a bottom-up proposal (citizen’s initiative), which was finally approved by the Regional Parliament in 1992. All in all, even if there are factors that make environmental councils more difficult institutions, making them work is far from impossible.
Author Contributions
Conceptualization, P.A., J.L.F.-M. and J.F.; methodology, P.A., J.L.F.-M. and J.F.; software, P.A.; validation, P.A., J.L.F.-M. and J.F.; formal analysis, P.A. and J.F.; investigation, P.A., J.L.F.-M. and J.F.; resources, P.A., J.L.F.-M. and J.F.; data curation, P.A. and J.F.; writing—original draft preparation, P.A., J.L.F.-M. and J.F.; writing—review and editing, P.A.; visualization, P.A.; supervision, P.A., J.L.F.-M. and J.F.; project administration, J.F.; funding acquisition, J.F. All authors have read and agreed to the published version of the manuscript.
Funding
This research was funded by Spanish Ministry of Economy and Competitiveness, grant number CSO2015-66026-R.
Acknowledgments
We would like to thank the rest of the members of the Assodem research project for their careful reading of the paper and for their suggestions, Lucy Powell for her professional English editing, as well as the anonymous peer-reviewers and the editors of the Special Issue for their invaluable contributions.
Conflicts of Interest
The authors declare no conflict of interest.
Appendix A
In order to check the robustness of the analyses shown in Figure 5, Figure 6, Figure 7 and Figure 8, Table A1 summarizes the results of complementary statistical analyses. First, since the original satisfaction variables were scales with 6 or 7 response categories, we performed new tests with them coded into three-category variables (including mid-point neutral categories when they existed), which showed also statistically significant differences (Cramer’s V) in all cases except two. Second, the treatment of these scales as quantitative variables showed differences of means (ANOVA) that were also significant in all cases except one.
Table A1.
Satisfaction variables by policy area (Cramer’s V and difference of means) (N = 501).
Table A1.
Satisfaction variables by policy area (Cramer’s V and difference of means) (N = 501).
| Variables | Cramer’s V | Difference of Means | |||
|---|---|---|---|---|---|
| Environment | Education | Immigration | Sign. | ||
| The decision-making process in the council is fair and transparent | 0.155 *** | 4.42 | 5.35 | 5.39 | *** |
| Substantive scope of debates | 0.108 ** | 4.27 | 4.82 | 4.88 | *** |
| Feeling of being strongly involved with the process of advising | 0.108 ** | 4.65 | 5.08 | 5.02 | ** |
| The composition of the plenary is politically diverse | 0.077 | 4.99 | 5.40 | 5.54 | ** |
| All the important stakeholders are represented in the plenary | 0.124 *** | 5.18 | 5.75 | 5.43 | *** |
| Enough information is provided to make good decisions | 0.127 *** | 4.61 | 5.39 | 4.99 | *** |
| Information is diverse and unbiased | 0.131 *** | 4.37 | 5.14 | 4.90 | *** |
| Information is provided when requested | 0.130 *** | 5.12 | 5.85 | 5.52 | *** |
| Policy makers keep the council informed a | 0.122 *** | 3.25 | 3.45 | 3.91 | *** |
| The media pays attention to the issued advice a | 0.117 ** | 2.99 | 2.90 | 2.82 | - |
| Satisfaction with the quality of advice | 0.092 * | 4.51 | 4.96 | 4.91 | ** |
| The advice is clear | 0.129 *** | 4.91 | 5.51 | 5.28 | *** |
| The advice has great social support | 0.120 *** | 4.43 | 4.90 | 4.99 | *** |
| The advice represents the diversity | 0.094 * | 4.52 | 4.87 | 5.10 | ** |
| The administration is receptive towards the advice a | 0.088 | 3.56 | 3.70 | 4.00 | ** |
| Interaction between members proceeds constructively | 0.153 *** | 4.49 | 5.12 | 5.16 | *** |
| Interaction supports the development of consensus between members | 0.157 *** | 4.46 | 5.06 | 5.21 | *** |
| Members reach a consensus a | 0.145 *** | 3.25 | 3.67 | 3.67 | *** |
| There is good communication between members | 0.160 *** | 4.45 | 5.28 | 5.01 | *** |
*** Differences are statistically significant at 0.01 level; ** 0.05 level; * 0.1 level. a These original variables have 6 categories of response (all the others have 7 categories).
Table A2.
Summary of multiple linear regression analysis results: explanatory coefficients of control variables (sign of the B coefficient and statistical signification).
Table A2.
Summary of multiple linear regression analysis results: explanatory coefficients of control variables (sign of the B coefficient and statistical signification).
| Variables | Statistically Significant Effect of Control Variables |
|---|---|
| Participatory process | |
| The decision-making process in the council is fair and transparent | Local level+ ***; council autonomy+ **; type of member: administration+ *; type of member: civil society- ** |
| Substantive scope of debates | Regional level+ **; local level+ **; type of member: administration+ *; type of member: civil society- *** |
| Feeling of being strongly involved with the process of advising | Type of member: administration+ ** |
| The composition of the plenary is politically diverse | Type of member: administration+ **; type of member: civil society- * |
| All the important stakeholders are represented in the plenary | - |
| Information | |
| Enough information is provided to make good decisions | Regional level+ **; local level+ **; council autonomy+ *; type of member: civil society- *** |
| Information is diverse and unbiased | Regional level+ **; local level+ ***; council autonomy+ **; type of member: administration+ **; type of member: civil society- *** |
| Information is provided when requested | Regional level+ *; local level+ **; type of member: civil society- *** |
| Policy makers keep the council informed a | Local level+ **; number of members- *; type of member: administration+ *** |
| The media pays attention to the issued advice a | Presence of administration+ * |
| Advice | |
| Satisfaction with the quality of advice | Regional level+ *; local level+ ***; council autonomy+ **; number of members+ ***; type of member: administration+ **; type of member: civil society- ** |
| The advice is clear | Regional level+ **; local level+ ***; council autonomy+ ***; type of member: civil society- ** |
| The advice has great social support | Regional level+ **; local level+ **; type of member: civil society- *** |
| The advice represents the diversity | Local level+ **; Type of member: administration+ *; type of member: civil society- ** |
| The administration is receptive towards the advice a | Regional level+ ***; local level+ ***; council autonomy+ **; type of member: administration+ ***; type of member: civil society- ** |
| Conflict | |
| Interaction between members proceeds constructively | Local level+ **; council autonomy+ *; type of member: administration+ ** |
| Interaction supports the development of consensus between members | Regional level+ *; local level+ **; council autonomy+ *; number of members+ *; type of member: administration+ *; type of member: civil society- * |
| Members reach a consensus a | Local level+ **; council autonomy+ **; type of member: civil society- ** |
| There is good communication between members | Regional level+ *; local level+ **; council autonomy+ **; type of member: civil society- ** |
*** Differences are statistically significant at 0.01 level; ** 0.05 level; * 0.1 level. a These original variables have 6 categories of response (all the others have 7 categories).
References
- Eckersley, R. Deliberative democracy, ecological representation and risk: Towards a democracy of the affected. In Democratic Innovation: Deliberation, Association and Representation; Saward, M., Ed.; Routledge: London, UK; New York, NY, USA, 2000; pp. 117–145. [Google Scholar]
- Kuper, R. Deliberating waste: The hertfordshire citizens’ jury. Local Environ. 1997, 2, 139–153. [Google Scholar] [CrossRef]
- Smith, G. Deliberative Democracy and the Environment; Routledge: London, UK; New York, NY, USA, 2003. [Google Scholar]
- Abers, R.N. Organizing for governance: Building collaboration in Brazilian river basins. World Dev. 2007, 35, 1450–1463. [Google Scholar] [CrossRef]
- Fung, A. Varieties of Participation in Complex Governance. Public Adm. Rev. 2006, 66, 66–75. [Google Scholar] [CrossRef]
- Gerring, J. Mere description. Br. J. Political Sci. 2012, 42, 721–746. [Google Scholar] [CrossRef]
- Smith, G. Democratic Innovations: Designing Institutions for Citizen Participation; Cambridge University Press: Cambridge, UK, 2009. [Google Scholar]
- Cooper, T.; Musso, J. The potential for neighborhood council involvement in American metropolitan governance. Int. J. Organ. Theory Behav. 1999, 2, 199–232. [Google Scholar] [CrossRef]
- Schattan, V. Democratization of Brazilian health councils: The paradox of bringing the other side into the tent. Int. J. Urban Reg. Res. 2006, 30, 656–671. [Google Scholar]
- Fung, A. Empowered Participation: Reinventing Urban Democracy; Princeton University Press: Princeton, NJ, USA, 2004. [Google Scholar]
- Serdult, U.; Welp, Y. How Sustainable is Democratic Innovation? Tracking Neighborhood Councils in Montevideo. J. Politics Latin Am. 2015, 7, 131–148. [Google Scholar] [CrossRef]
- Navarro, C. Participatory democracy and political opportunism: Municipal experience in Italy and Spain (1960–93). Int. J. Urban Reg. Res. 2004, 28, 819–838. [Google Scholar]
- Christiansen, P.M.; Nørgaard, A.S.; Rommetvedt, H.; Svensson, T.; Thesen, G.; Öberg, P. Varieties of Democracy: Interest Groups and Corporatist Committees in Scandinavian Policy Making. Voluntas 2010, 21, 22–40. [Google Scholar] [CrossRef]
- Fobé, E.; Brans, M.; Vancoppenolle, D.; Van Damme, J. Institutionalized advisory systems: An analysis of member satisfaction of advice production and use across 9 strategic advisory councils in Flanders (Belgium). Policy Soc. 2013, 32, 225–240. [Google Scholar] [CrossRef]
- Reed, M.S. Stakeholder participation for environmental management: A literature review. Biol. Conserv. 2008, 141, 2417–2431. [Google Scholar] [CrossRef]
- Newig, J.; Challies, E.; Jager, N.; Kochskaemper, E.; Adzersen, A. The environmental performance of participatory and collaborative governance: A framework of causal analysis. Policy Stud. J. 2018, 46, 269–297. [Google Scholar] [CrossRef] [PubMed]
- López García, D. Mediation styles and participants’ perception of success in consultative councils: The case of Guadalajara, México. J. Public Delib. 2017, 13, 10. [Google Scholar] [CrossRef]
- Ward, H.; Norval, A.; Landman, T.; Pretty, J. Open citizens’ juries and the politics of sustainability. Political Stud. 2003, 51, 282–299. [Google Scholar] [CrossRef]
- Cornwall, A. Deliberating democracy: Scenes from a Brazilian municipal health council. Politics Soc. 2008, 36, 508–531. [Google Scholar] [CrossRef]
- Baber, W.F.; Bartlett, R.V. Deliberative democracy and the environment. In The Oxford Handbook of Deliberative Democracy; Bachtiger, A., Dryzek, J.S., Mansbridge, J., Warren, M.E., Eds.; Oxford University Press: Oxford, UK, 2018. [Google Scholar]
- Gastil, J.; Richards, R.C.; Ryan, M.; Smith, G. Testing Assumptions in Deliberative Democratic Design: A Preliminary Assessment of the Efficacy of the Participedia Data Archive as an Analytic Tool. J. Public Delib. 2017, 13. [Google Scholar] [CrossRef]
- Royo, S.; Yetano, A.; Acerete, B. E-participation and environmental protection: Are local governments really committed? Public Adm. Rev. 2014, 74, 87–98. [Google Scholar] [CrossRef]
- Font, J.; Blanco, I. Procedural legitimacy and political trust: The case of citizen juries in Spain. Eur. J. Political Res. 2007, 46, 557–589. [Google Scholar] [CrossRef]
- Font, J.; Navarro, C. Personal experience and the evaluation of participatory instruments in Spanish cities. Public Adm. 2013, 91, 616–631. [Google Scholar] [CrossRef]
- Fernández-Martínez, J.L.; García-Espín, P.; Jiménez-Sánchez, M. Participatory Frustration: The Unintended Cultural Effect of Local Democratic Innovations. Adm. Soc. 2019, 1–31. [Google Scholar] [CrossRef]
- Landwehr, C.; Holzinger, K. Institutional determinants of deliberative interaction. Eur. Political Sci. Rev. 2010, 2, 373–400. [Google Scholar] [CrossRef]
- Jiménez, S.M. El Impacto Político de los Movimientos Sociales: Un Estudio de la Protesta Ambiental en España; CIS, Colección Monografías: Madrid, Spain, 2005. [Google Scholar]
- Wironen, M.B.; Bartlett, R.V.; Erickson, J.D. Deliberation and the promise of a deeply democratic sustainability transition. Sustainability 2019, 11, 1023. [Google Scholar] [CrossRef]
- Bobbio, L. Designing effective public participation. Policy Soc. 2018, 38, 41–57. [Google Scholar] [CrossRef]
- Revel, M.; Blatrix, C.; Blondiaux, L.; Fourniau, J.M.; Hériard Dubreuil, B.; Lefebvre, R. Le Débat Public: Une Expérience Française de Démocratie Participative; La Decouverte: Paris, France, 2007. [Google Scholar]
- Fraussen, B.; Beyers, J.; Donas, T. The expanding core and varying degrees of insiderness: Institutionalised interests groups access to advisory councils. Political Stud. 2015, 63, 569–588. [Google Scholar] [CrossRef]
- Baiocchi, G.; Ganuza, E. Popular Democracy: The Paradox of Participation; Stanford University Press: Stanford, CA, USA, 2016. [Google Scholar]
- Jiménez, M. Sustainable Development and the Participation of Environmental NGOs in Spanish Environmental Policy. In Environmental Politics in Southern Europe; Eder, K., Kousis, M., Eds.; Environment & Policy, Springer: Dordrecht, The Netherlands, 2001; Volume 29, pp. 225–253. [Google Scholar]
- Font, N.; Subirats, J. Local y Sostenible. La Agenda 21 Local en España; Icaria: Barcelona, Spain, 2000. [Google Scholar]
- Font, J.; Pasadas, S.; Fernández-Martínez, J.L. Participatory Motivations in Advisory Councils: Exploring Different Reasons to Participate. Representation 2019, 1–19. [Google Scholar] [CrossRef]
© 2020 by the authors. Licensee MDPI, Basel, Switzerland. This article is an open access article distributed under the terms and conditions of the Creative Commons Attribution (CC BY) license (http://creativecommons.org/licenses/by/4.0/).