Article

Energy Management-Based Predictive Controller for a Smart Building Powered by Renewable Energy

1
Laboratory of Condensed Matter and Interdisciplinary Sciences, Faculty of Sciences, Mohammed V University in Rabat, 1014 RB Rabat, Morocco
2
Centre for Sustainable Development, Qatar University, Doha 2713, Qatar
*
Author to whom correspondence should be addressed.
Sustainability 2020, 12(10), 4264; https://doi.org/10.3390/su12104264
Submission received: 23 April 2020 / Revised: 9 May 2020 / Accepted: 10 May 2020 / Published: 22 May 2020

Abstract

:
This paper presents a smart building energy management system (BEMS), which is in charge of optimally controlling the sustainable operation of a building-integrated-microgrid (BIM). The main objective is to develop an advanced high-level centralized control approach-based model predictive control (MPC) considering variations of renewable sources and loads. A finite-horizon planning optimization problem is developed to control the operation of the BIM. The model can be implemented as a BEMS for the BIM to manipulate the indoor temperature and optimize the operation of the system’s units. A centralized MPC-based algorithm is implemented for the power management scheduling of all sub-systems as well as power exchanges with the electrical grid. The MPC algorithm is verified over case studies applied to two floors residential building considering the climate condition of a typical day of March, where the effects of both loads and thermal resistance of building shell on the operation of the BIM are analyzed via numerical simulations. The analysis shows that 96% of the total electrical load has been fulfilled by the local production where 23% represents the total electric output of the micro-CHP and 73% is the renewable energy production. The deficit, which represents only 4%, is purchased from the electrical distribution network (EDN).

1. Introduction

The integrated smart grids on a building’s energy production and management is, so far, a promising research field that will establish a strong platform from experimental and computational to a real, large utilization in buildings. Smart grids concept can be considered a revolutionary way on managing energy production sources in term of flexibility, efficiency, and being environmentally friendly [1], and responding to an energy demand instantly on active systems [2] by communication tools and procedures; especially in areas where renewable energies have a considerable and substantial potential and when the cost of the connection to the general power network may have technical and financial inconveniences. The implementation of the microgrid in a building may have numerous goals, especially reducing the energy cost and power consumption for less dependence to a general network. This paper aims to present the building-integrated-microgrid (BIM) as a new concept that may support the transition to intelligent buildings, which can be considered as energy efficient buildings. The BIM may play a vital task in the shift and upgrading of electric networks by enhancing the grid efficiency and allowing consumers to participate in managing their own consumption.
Considerable efforts have been dedicated to investigating the smart buildings operation. Wang et al. [3] proposed a control approach to manage the comfort in smart buildings. In [4], an optimization problem for a microgrid operation has been implemented. Reference [5] proposed a decision making model for building structures. Authors in [6] proposed a formulation minimizing daily energy cost. Reference [7] presented a framework to predict and manage building energy. In [8] an energy scheduling approach for houses and buildings is presented. Authors in [9] studied the consequences of selecting precise scheduling structures, preference methods and aggregation tools for residential demand-side aggregation, and identified the tensions that exist between various proposed model formulations. Reference [10] proposed a complete optimization framework for home energy management considering many classes of appliances. In [11], an autonomous scheduling algorithm is developed to shave the peak load by deferring the photovoltaic energy on peak demand side and reducing the reverse power flow of the photovoltaic upcoming from a rooftop of a residential building. In [12], a two-stage co-optimization framework for the planning and energy management of a customer with battery energy storage systems and demand response programs has been proposed. In [13], the energy storage management system is also enhanced by a modular design distributed on battery storage with integrated power electronics into battery cells as an integrated module to satisfy functional performance of the battery without extra equalizers. Reference [14] proposed an original formulation based on the Pontryagin’s Minimum Principle that may be viewed as a preliminary continuous time attempt to model and control the exchange of power in a network of microgrids. Authors in [15] proposed a problem formulation considering a team of cooperative microgrids and presenting a distributed control approach for energy exchanges. In [16], a predictive control scheme defining energy exchanges for networked microgrids is investigated. Reference [17] presented a stochastic optimization problem for day-ahead planning of energy storages. In [18], a model predictive climate control of a Swiss office building has been presented. In [19], a control framework for optimal operation of smart connected microgrids is designed. In [20], the reliability of the MPC is presented for global energy management and optimization in a cooperative network of smart residential buildings’ integrating loads, several distributed energy, energy storage and plug-in electric vehicles that allow sending and receiving the energy between the buildings in a predictive demand scheme. Reference [21] concentrated on investigating a comprehensive mechanism that integrates prediction technics, modelling, and data structure design to develop a demand side management approach. Reference [22] presented a consistent framework for setting net zero energy building definitions. An outline on life cycle approaches of nearly zero energy building is presented in [23]. Authors in [24] investigated a pilot case study regarding a nearly zero energy building renovation. Authors in [25] studied the green roofs in office building districts. Reference [26] discussed the restrictions to building information modelling applications. Authors in [27] assessed the effect of model simplifications on thermal comfort and energy performance. In addition, authors considered a case study of a residential building. An energy management framework for an islanded building microgrid in presented in [28,29].
Considering the above-mentioned discussion, prior works present complex frameworks, which are difficult to implement in practical cases, time-consuming, and require computation time requirement. The importance of the proposed study can be summarized in providing a reduced and efficient optimization and control framework embedded in model predictive control to account uncertainties of weather conditions and loads. The main contributions of this paper can be summarized in presenting and implementing a comprehensive predictive centralized control framework for a BIM, where the aim is to present an innovative control strategy-based MPC. The proposed framework is expressed as a constrained scheduling optimization problem embedded in a model predictive control scheme to optimally control the operation of BIM considering uncertainties and dynamics of loads as well as renewable energy sources. The microgrid is designed to feed the energy needs of the building as well as to ensure the welfare of the occupants. The main aim is to develop an efficient energy management-based predictive controller to manage the energy exchanges at the BIM level ensuring the consumer’s needs. The developed algorithm is implemented to proficiently control the operation of the BIM that considers both forecasts and newly updated data. This paper attempts to increase the application of smart grids by developing novel energy management approaches and control technics focusing on application to a BIM. These methodologies could enhance shifting from passive buildings to active ones playing a key role in an electrical grid. The challenging task is the formulation of a predictive constrained planning problem enabling an efficient energy management, precise control of the thermal power loads, and optimizing the operation of the energy storage device (ESD) and the micro-CHP unit. The challenge is the definition of the global problem, where diverse systems will be modeled and tested considering many conditions. The presented control strategy might be taken as a practical solution to mitigate and address the smart energy management challenges in buildings. Besides, it can be considered as a complete approach that can be effectively considered in real scenarios. The main advantage of the developed approach lies in its ability to mitigate the uncertainties and intermittent behavior of inputs.
The rest of the paper is organized as follows. In Section 2, the smart building-integrated-microgrid is modeled. The tracking control problem is formalized in Section 3, while the results and discussion are presented in Section 4. Finally, some concluding remarks are presented in Section 5.

2. The Smart Building-Integrated-Microgrid Modeling

Smart BIM is a novel concept integrating loads, distributed energy sources, storage systems and advanced metering infrastructure. The special feature of these buildings is their ability to perform demand response strategies as a set of programs, which allow the building manager or/and consumers to plan and manage activities connected to the energy usage. Specificallyit helps them to play a crucial task in shifting their own loads in peak intervals to reduce their consumption or/and shift to off-peak hours to smooth the power load curve. In the proposed paper, we suppose that the BIM integrates renewable distributed generations, micro-CHP, ESD, electric and thermal loads, BEMS and an advanced metering infrastructure.
The BEMS aims to optimally control the operation of the BIM in autonomous mode, otherwise, linking and connecting the BIM sub-systems and the global central controller (GCC). The BEMS is in charge of collecting data and implementing forecasts of energy production and power loads. Furthermore, it makes an interface of communication for sending/receiving control signals to the BIM components. The high level BIM central controller is managing energy exchanges by accurately consenting the optimal operation of the BIM. The main objective of the GCC is to provide a high-level control to generate optimal set points for all components as well as for the energy exchanges. The GCC is in charge of the smart energy management in the BIM. It decides about the state of the ESD (storing/discharging), the energy exchanges with the EDN (selling/purchasing) as well as the state of the micro-CHP.

2.1. The Solar PV Generators Modeling

The PV module is modeled according to the following Equations:
I p v ( t ) = I s c , r e f { 1 A [ e x p ( V m p , r e f B V o c , r e f ) 1 ] } + Δ I ( t )
V p v ( t ) = V m p , r e f [ 1 + 0.0539 l o g ( G i n ( t ) G s t ) ] + μ Δ T ( t ) .
where,
A = ( 1 I m p , r e f I s c , r e f ) e x p [ V m p , r e f B V o c , r e f ]
B = V m p , r e f V o c , r e f 1 l n ( 1 I m p , r e f I s c , r e f )
Δ I ( t ) = γ ( G i n ( t ) G s t ) Δ T ( t ) + ( G i n ( t ) G s t 1 ) I s c , r e f
Δ T ( t ) = T a m b + 0.02 G i n ( t )
where I s c , r e f and I m p , r e f are respectively the module short circuit and the maximum power currents. V m p , r e f and V o c , r e f are respectively the maximum power and open circuit voltages of the module. G i n and G s t are respectively the solar irradiation and the standard light intensity.
The total power and voltage output of the PV modules are given by:
V p v ,   o u t ( t ) = β p v ,   s V p v ( t )
u p v ( t ) = β p v ,   s β p v ,   p V p v ( t ) I p v ( t ) ξ l o s s
where β p v ,   s and β p v ,   p are respectively the serial and parallel number of modules.

2.2. Wind Turbine Generator

The power output of the wind turbine is given by:
u w t ( t ) = { 0 v ( t ) < v c P r ( a v 3 ( t ) b ) v c v ( t ) v r P r v r v ( t ) v f 0 v ( t ) > v f
{ a = ( 1 + b ) / v r 3 b = ( v c v r ) 3 / [ 1 ( v c v r ) 3 ]
where v ( t ) is the expected wind speed at the hub height of the wind turbine and P r is the rated power.

2.3. Energy Storage System Dynamics

It is worthwhile to mention that the energy storage system can be charged directly from the renewable generators or/and from the main grid. However, the energy storage system is discharged mainly to satisfy the needs of the BIM. The charging from the main grid is allowed only at periods of energy shortage. The charging state of the storage system in given as follows:
s ( t + Δ t ) = s ( t ) + β C h a r u C h a r ( t ) Δ t β d i s u d i s ( t ) Δ t
where u C h a r ( t ) and u d i s ( t ) are respectively the charged and discharged powers at the instant t, β C h a r is the charging efficiency, β d i s is the discharging efficiency.

2.4. Loads

The total load of the building is supposed to comprise controllable and non-controllable loads [30,31]. The controllable load is assumed to be delimited to the thermal load that is defined as the desired hot water and preferred building temperature. This will allow assessing the effects of the thermal loads on the operation of the BIM. It is assumed that the required thermal power is ensured by the micro-CHP. More details about users’ controllable appliances can be found in [32]. The main objectives can be summarized in controlling the consumption patterns while maximizing the use of the local available renewable energy production, smoothing the load profile and minimizing the cost of the energy purchased from the main grid. The temperature state of the water storage is given as follows [33]:
T s t ( t + Δ t ) = T s t ( t ) + q c o l d ( t ) q T ( T c o l d ( t ) T s t ( t ) ) + u c h p t h ( t ) u a i r t h ( t ) q T C w a t e r
where q T is the water storage volume, C w a t e r is the specific heat of water, and T c o l d ( t ) is the temperature of cold water.
The building temperature is defined by the following Equation:
T i n ( t + Δ t ) = T i n ( t ) e Δ t R B I M C a i r + ( R B I M u a i r t h ( t ) + T o u t ( t ) ) ( 1 e Δ t R B I M C a i r )
where C a i r is the inside air’s heat capacity, R B I M is the thermal resistance, T o u t ( t ) is the outside temperature.
The predictions of load are implemented by BEMS that supports the GCC in delivering control signals defining the optimal energy management strategy for the BIM. Advanced metering infrastructure is in charge of collecting weather and historical data of energy consumption in order to perform predictions for the MPC algorithm.

2.5. Energy Exchanged on the Building’s Envelope

The building construction shell material can be considered as a homogeneous one with special material characteristics. In our case, the material is concrete for structures and masonry of alveolar cement bricks. The outside window glasses represents 3% of the total envelope area, so the total energy exchanged on the building’s shell can be considered of the masonry ones. The energy exchanged on the building’s envelope is also a function of material density, inertia, exterior climate data such as solar rays, wind, air pressure, hygrometric data, etc. The global exchanged energy through building’s envelope can be written as:
u t h , m ( t ) = A w λ m e w ( T i n ( t ) T o u t ( t ) )
where A w is the total walls’ area, λ m is the material conductivity, and e w   is the thickness wall metering.

3. Building Energy Management Algorithm: The Tracking Control Problem

Many authors in the literature suggested the use of model predictive control for demand side management and scheduling of the operation of microgrids and buildings. Authors in [34] presented a robust model predictive control for real-time demand side management in residential smart grids. Furthermore, authors validated and demonstrated the effectiveness of their method. In this paper, the proposed scheduling framework works following a receding horizon approach. The optimal control state is determined for the energy storage system, micro-CHP, and all power flows at the microgrid level, while, just the first control state is considered. The procedure is then repeated under the receding horizon principle, i.e., at the next time step, new data are available, allowing computing the new control sequences. The optimization framework defined in Equation (15), subject to operational constraints, expressed as state, inequality and equality in Equations (16)–(30) is formulated as a mixed integer nonlinear programming problem, where the decision variables are the power flows exchange at the BIM level. The main advantage of this approach is its ability to anticipate future events while providing a clear constraints management.

3.1. Objective Function

The main objective is to track, as possible, the reference signals representing the optimal desired BIM temperature and the optimal non-controllable load as well as to maximize the stored energy in the ESD with a minimum interaction with the EDN. The reference signals define the ideal operations of the BIM that maximize this energy efficiency. The optimization problem is formulated as a multi-objective optimization problem subject to quadratic cost function where the objective function is defined as follows:
J = t = 1 T ( T i n ( t ) T i n ¯ ( t ) ) 2 + t = 1 T ( l n c ( t ) l n c ¯ ( t ) ) 2 t = 1 T ( s ( t ) ) 2 + t = 1 T ( ( u g , p ( t ) ) 2
where T i n ¯ ( t ) is dynamic reference state representing respectively the desired temperature of the BIM and l n c ¯ ( t ) are dynamic reference states representing the non-controllable load.

3.2. State Equations and Constraints

The predicted power balance Δ u ˜ b a l ( t ) of the BIM is given by the following Equation:
Δ u ˜ b a l ( t ) = u w t ( t ) + u p v ( t ) + u c h p e l c ( t ) l n c ( t ) = u g , s ( t ) + u C h a r ( t ) β d i s u d i s ( t ) u g , p ( t )
where u g , p ( t ) , and u g , s ( t ) are respectively the power purchased and sold from/to the EDN, and u c h p e l c ( t ) is the electric power output of the micro-CHP.
The energy storage system is constrained by capacity limits:
s m i n s ( t ) s m a x
u c h a r ,   m i n u c h a r ( t ) u c h a r ,   m a x
u d i s ,   m i n u d i s ( t ) u d i s ,   m a x
u d i s ( t ) u c h a r ( t ) = 0
The renewable power generation is limited between an upper and lower bound:
u w t ,   m i n u w t ( t + k ) u w t ,   m a x
u p v ,   m i n u p v ( t + k ) u p v ,   m a x
The electric power consumed in the BIM is constrained by upper and lower bounds:
l n c , m i n l n c ( t ) l n c , m a x
The preferred hot water and buildings’ temperature are constrained by preference limits:
T s t , m i n T s t ( t ) T s t , m a x
T i n , m i n T i n ( t ) T i n , m a x
The electrical and thermal power outputs of the micro-CHP are limited:
u c h p e l c ( t ) = η e l η t h u c h p t h ( t )
u c h p , m i n t h u c h p t h ( t ) u c h p , m a x t h
u c h p , m i n e l c u c h p e l c ( t ) u c h p , m a x e l c
The micro-CHP power output ramp rates are given by:
η t h η e l u r u c h p t h ( t ) u c h p t h ( t Δ t ) η t h η e l u r
u r u c h p e l c ( t ) u c h p e l c ( t Δ t ) u r

4. Application and Numerical Results

4.1. Case Study Description

The proposed control framework is applied to a case study to assess its performance and effectiveness. The considered BIM includes two floors of a residential building of 120 [m2] situated in Marrakech, Morocco. The total power load of the building represents the consumption of five occupants. Furthermore, the BIM comprises a wind generator of 5 [kW] and a PV system of 1 [kW] composed by 4 × 250 [W] high efficiency polycrystalline solar PV modules. The maximal capacity of the energy storage system is ranged between 1 and 24 [kWh]. The electric power output of the micro-CHP unit is ranged between 0.3 and 3 [kW], while thermal power output varies from 0.5 to 5 [kW]. In addition, the thermal and electrical efficiencies are respectively equal to 50% and 30%. The total volume of the water storage is equal to 150 L. The estimated total controllable electrical load is reported in Figure 1, whereas Figure 2 displays the projected hot water load in the BIM. The cold water temperature T c o l d ( t ) , is set to be equal to 10 [°C] from 9:00 to 21:00 and set to be 7 [°C] for the rest of the day. Furthermore, the outside temperature of the BIM T o u t ( t ) is equal to 10 [°C] from 1:00 to 6:00, and takes a value of 15 [°C] from 7:00 to 17:00. Whereas, it equals to 6 [°C] for the rest of the day. Furthermore, the water storage temperature is supposed to be comprised between 50 and 70 [°C] with a primary state equal to 60 [°C] (Tst(0) = 60), while, the building’s temperature is set to follow the reference desired temperature signal reported in Figure 3, with an initial state equal to 18 [°C] (Tin(0) = 18).

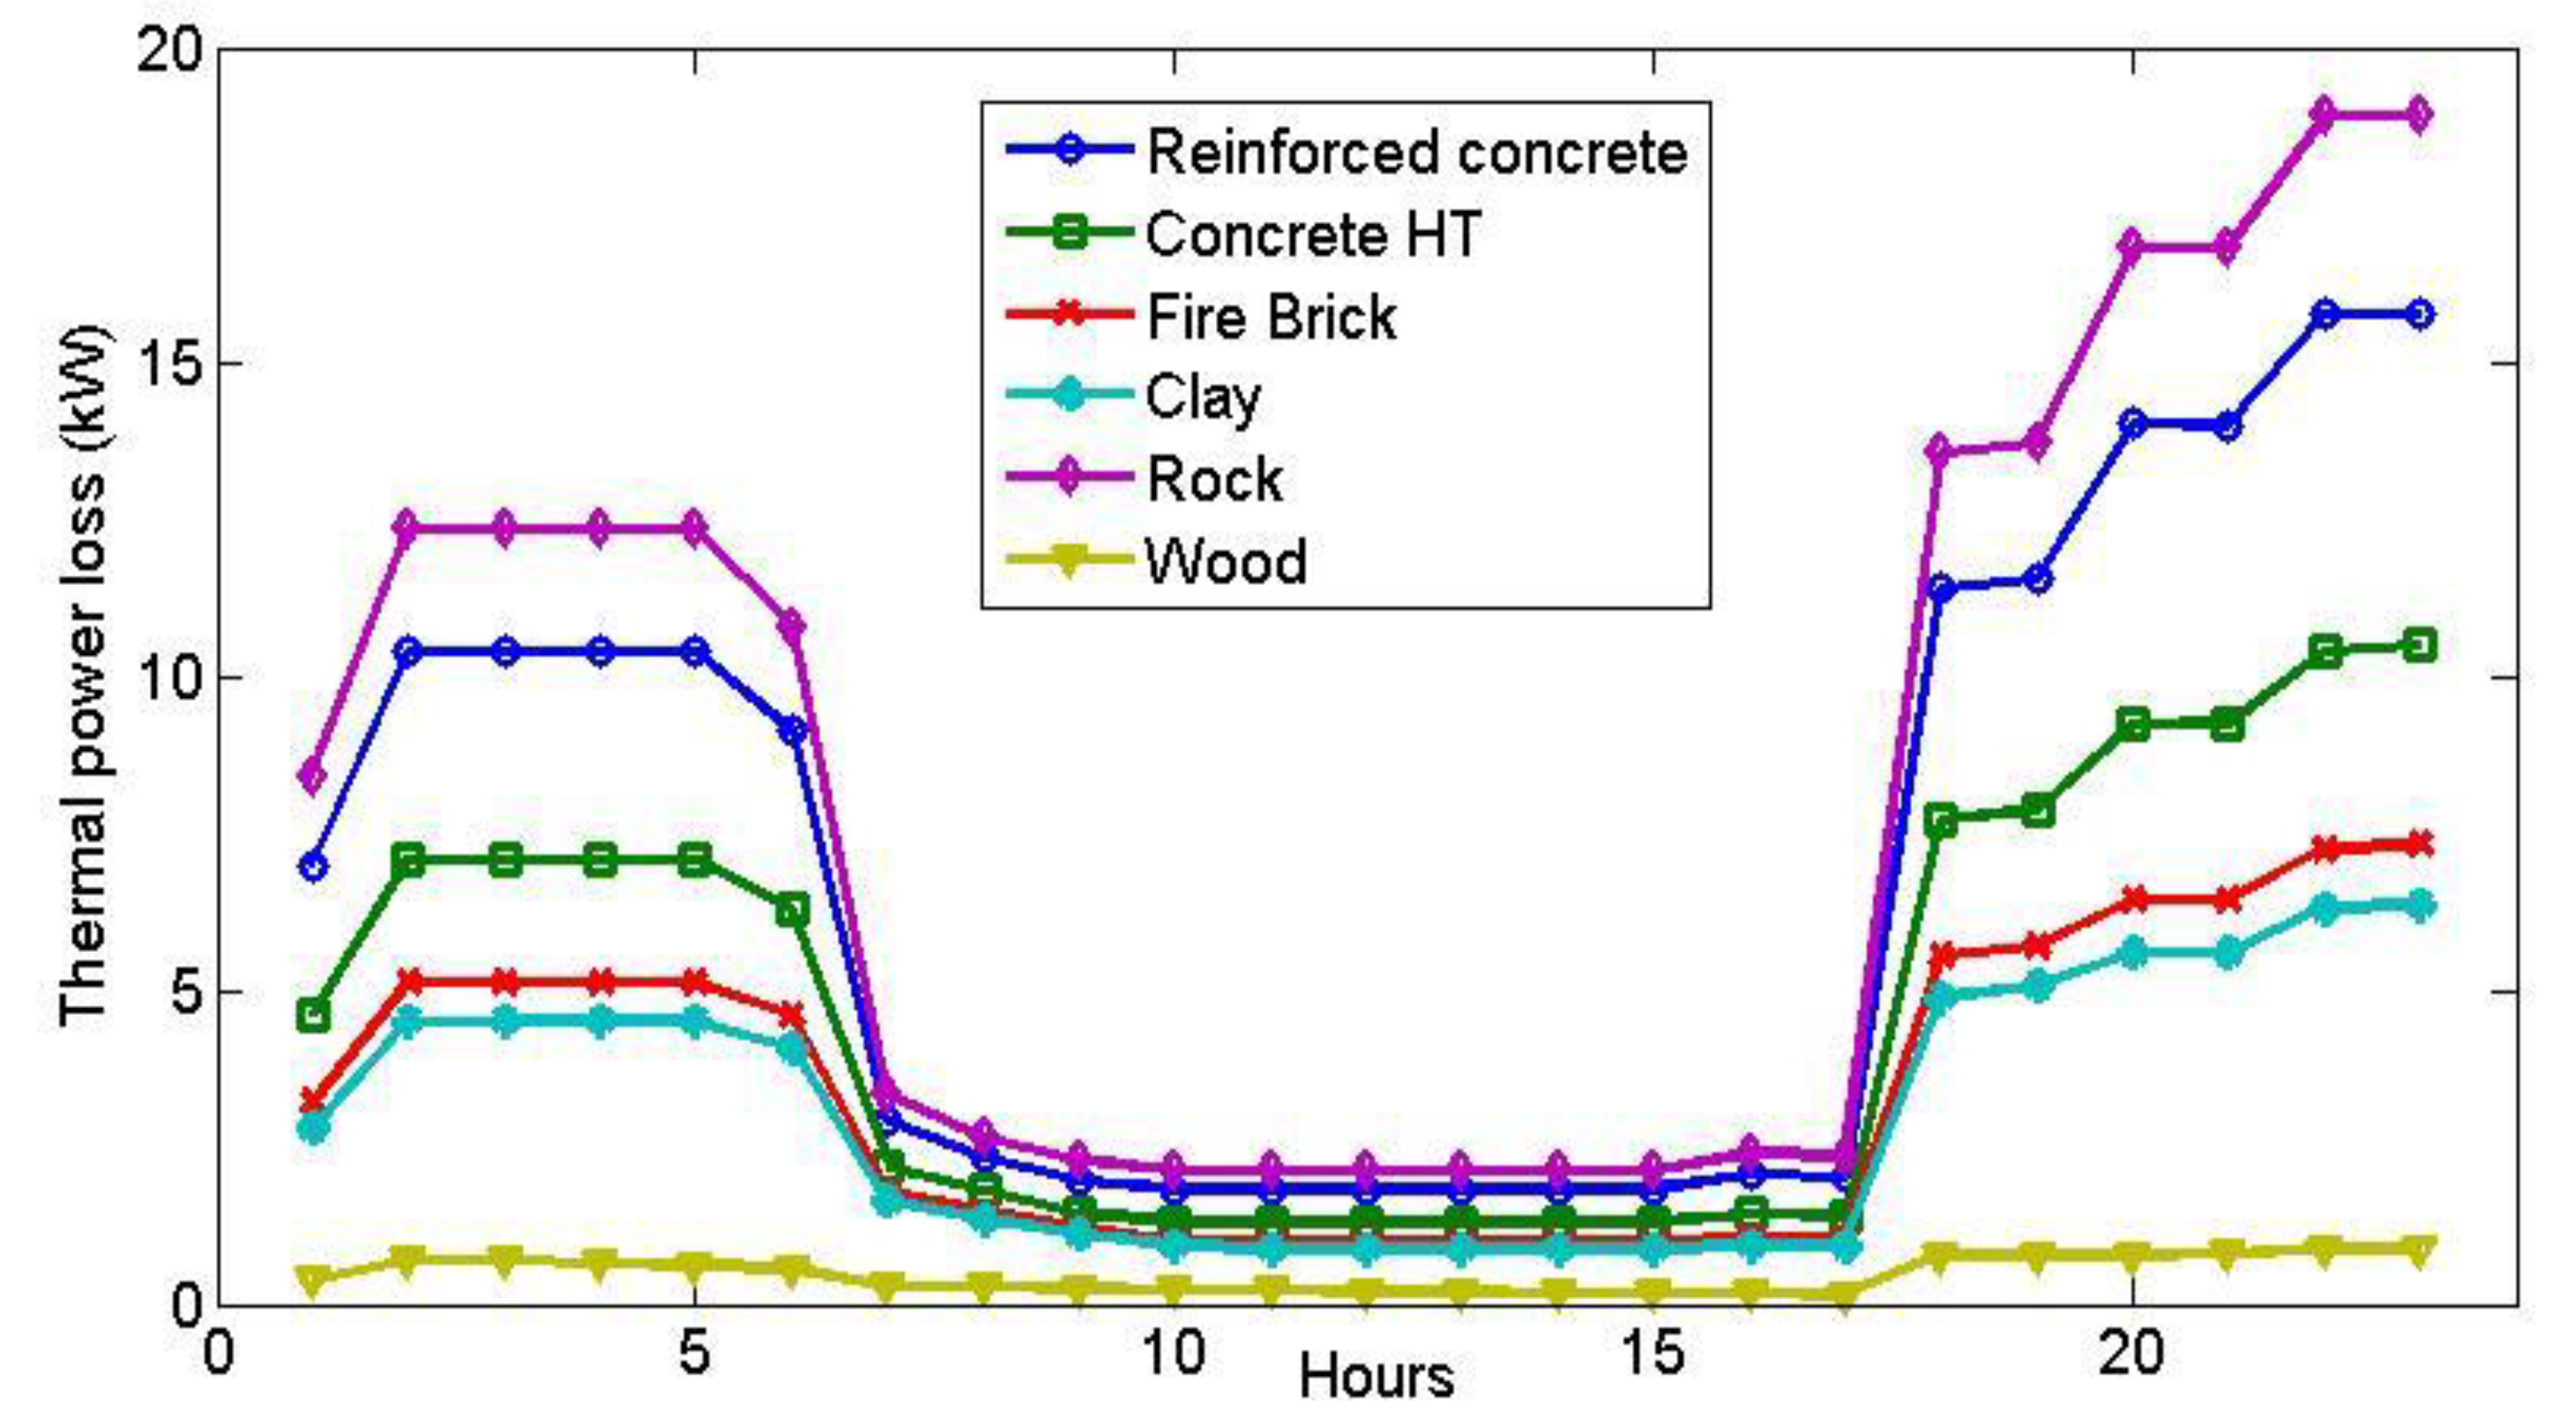
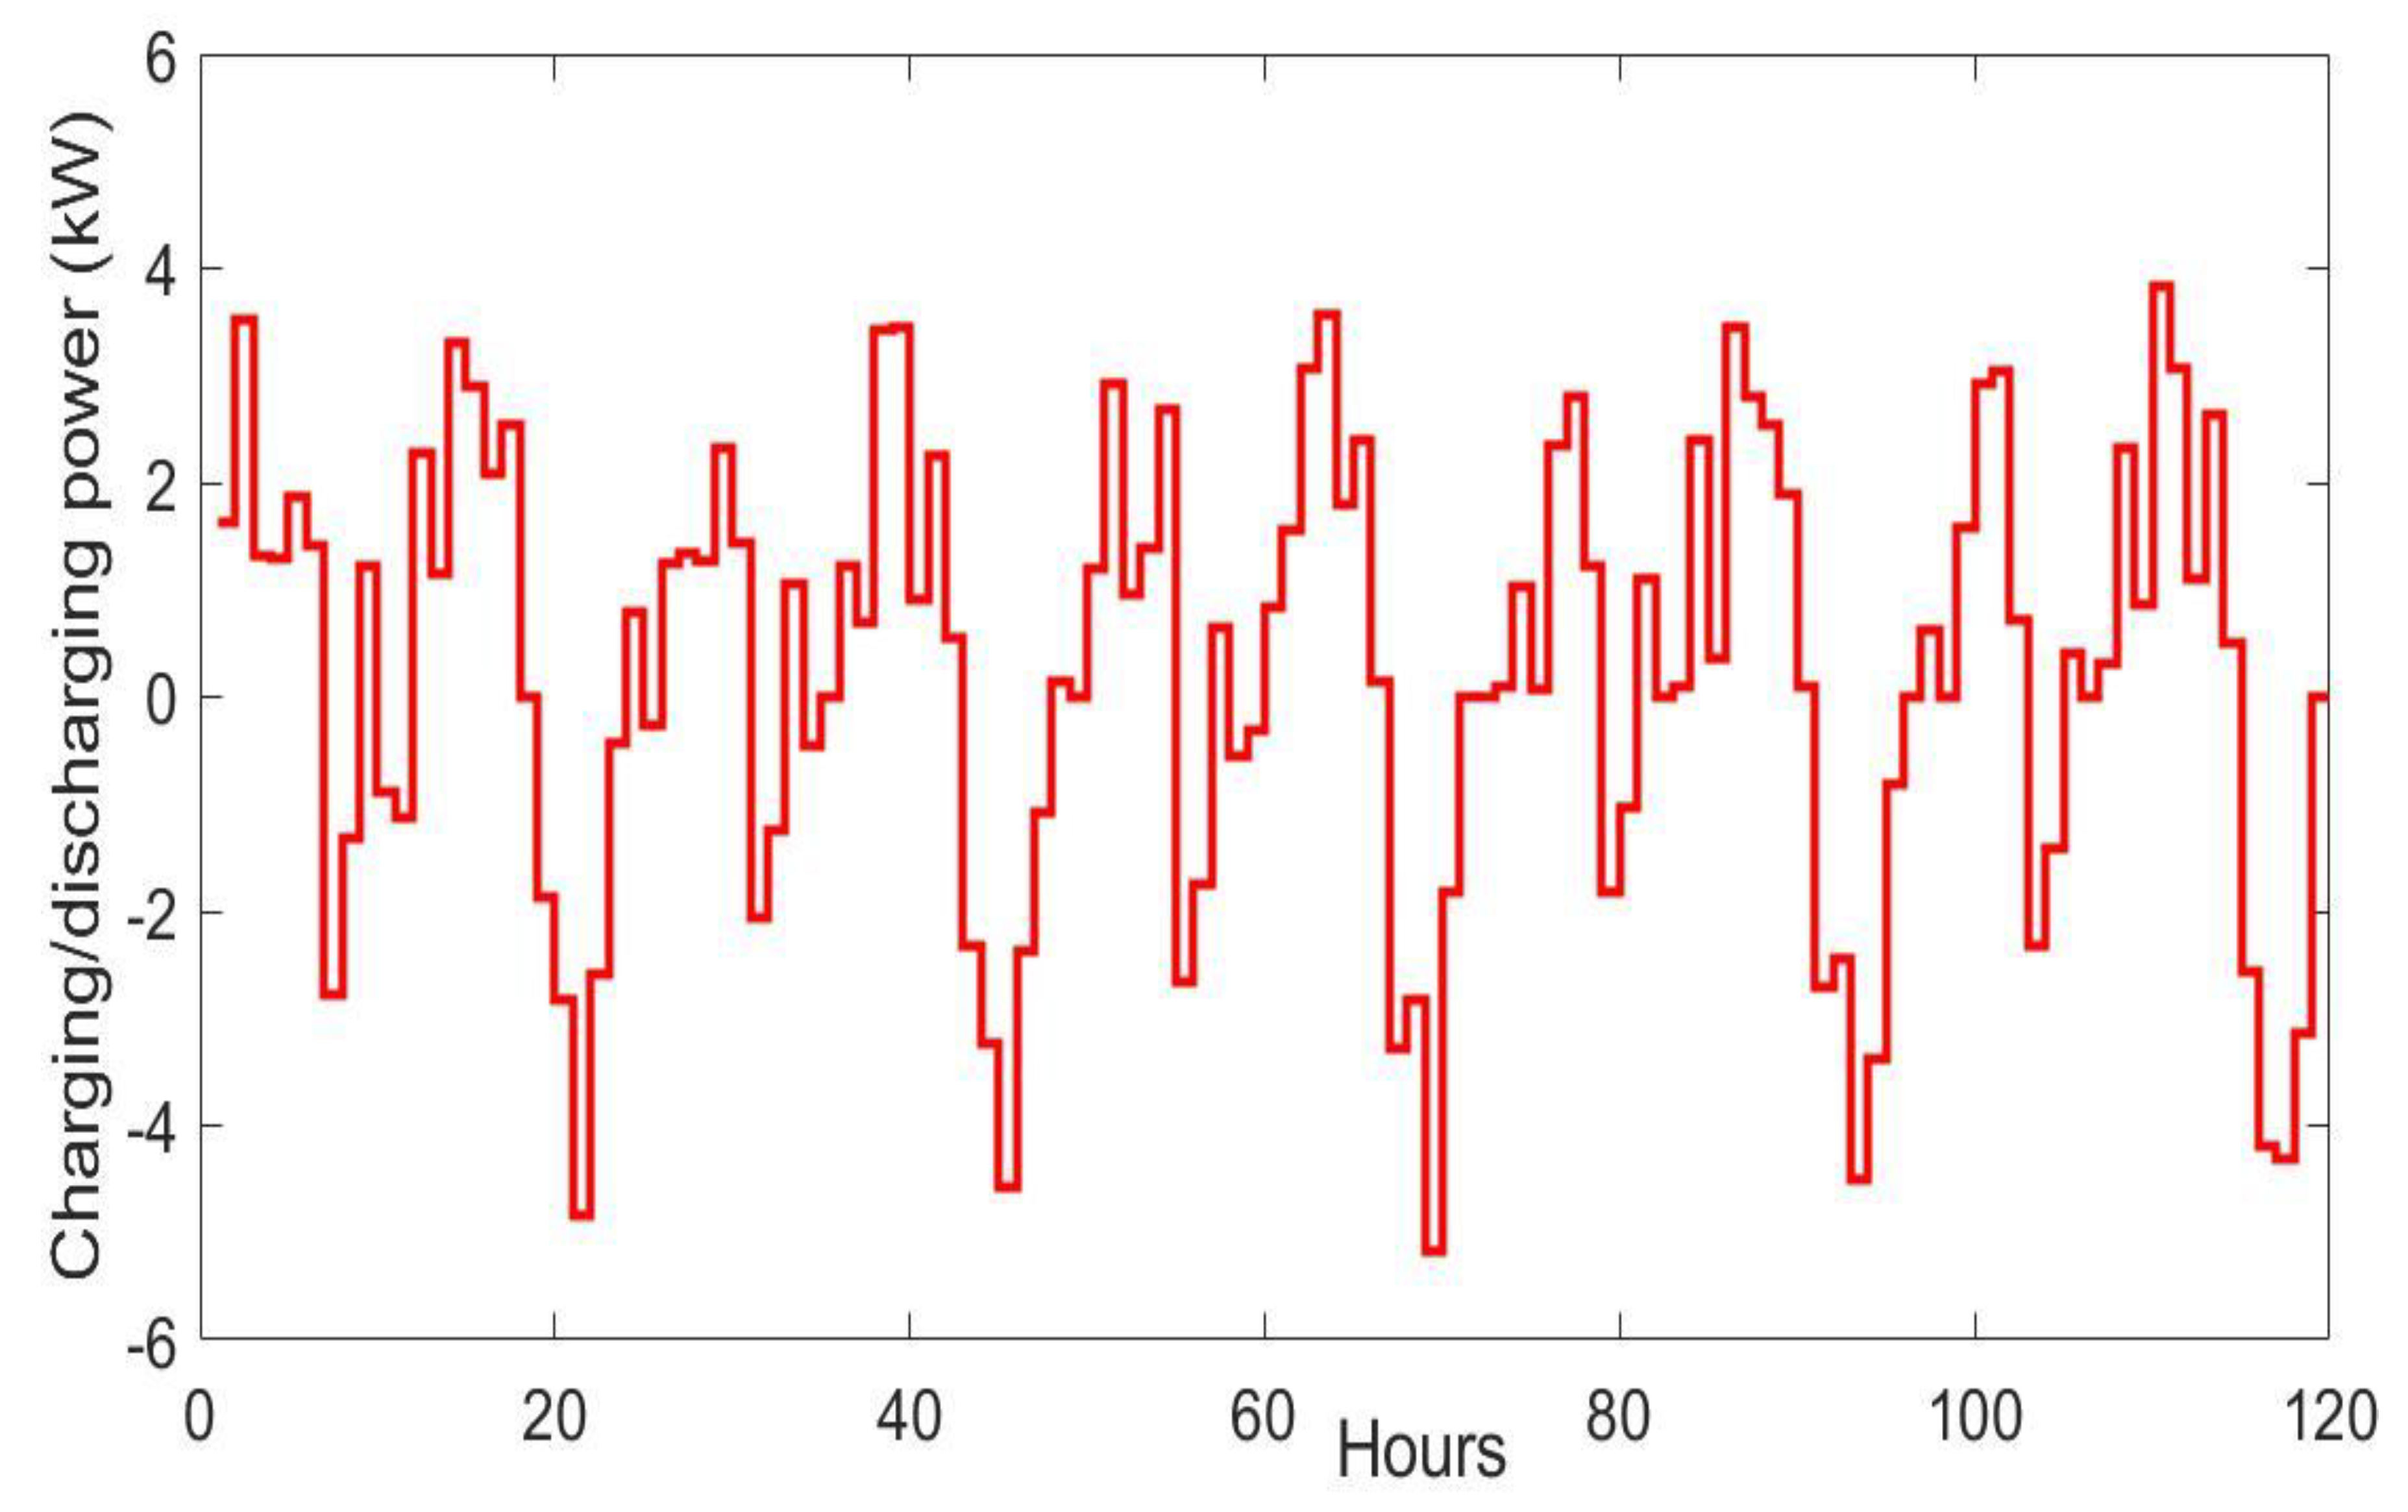
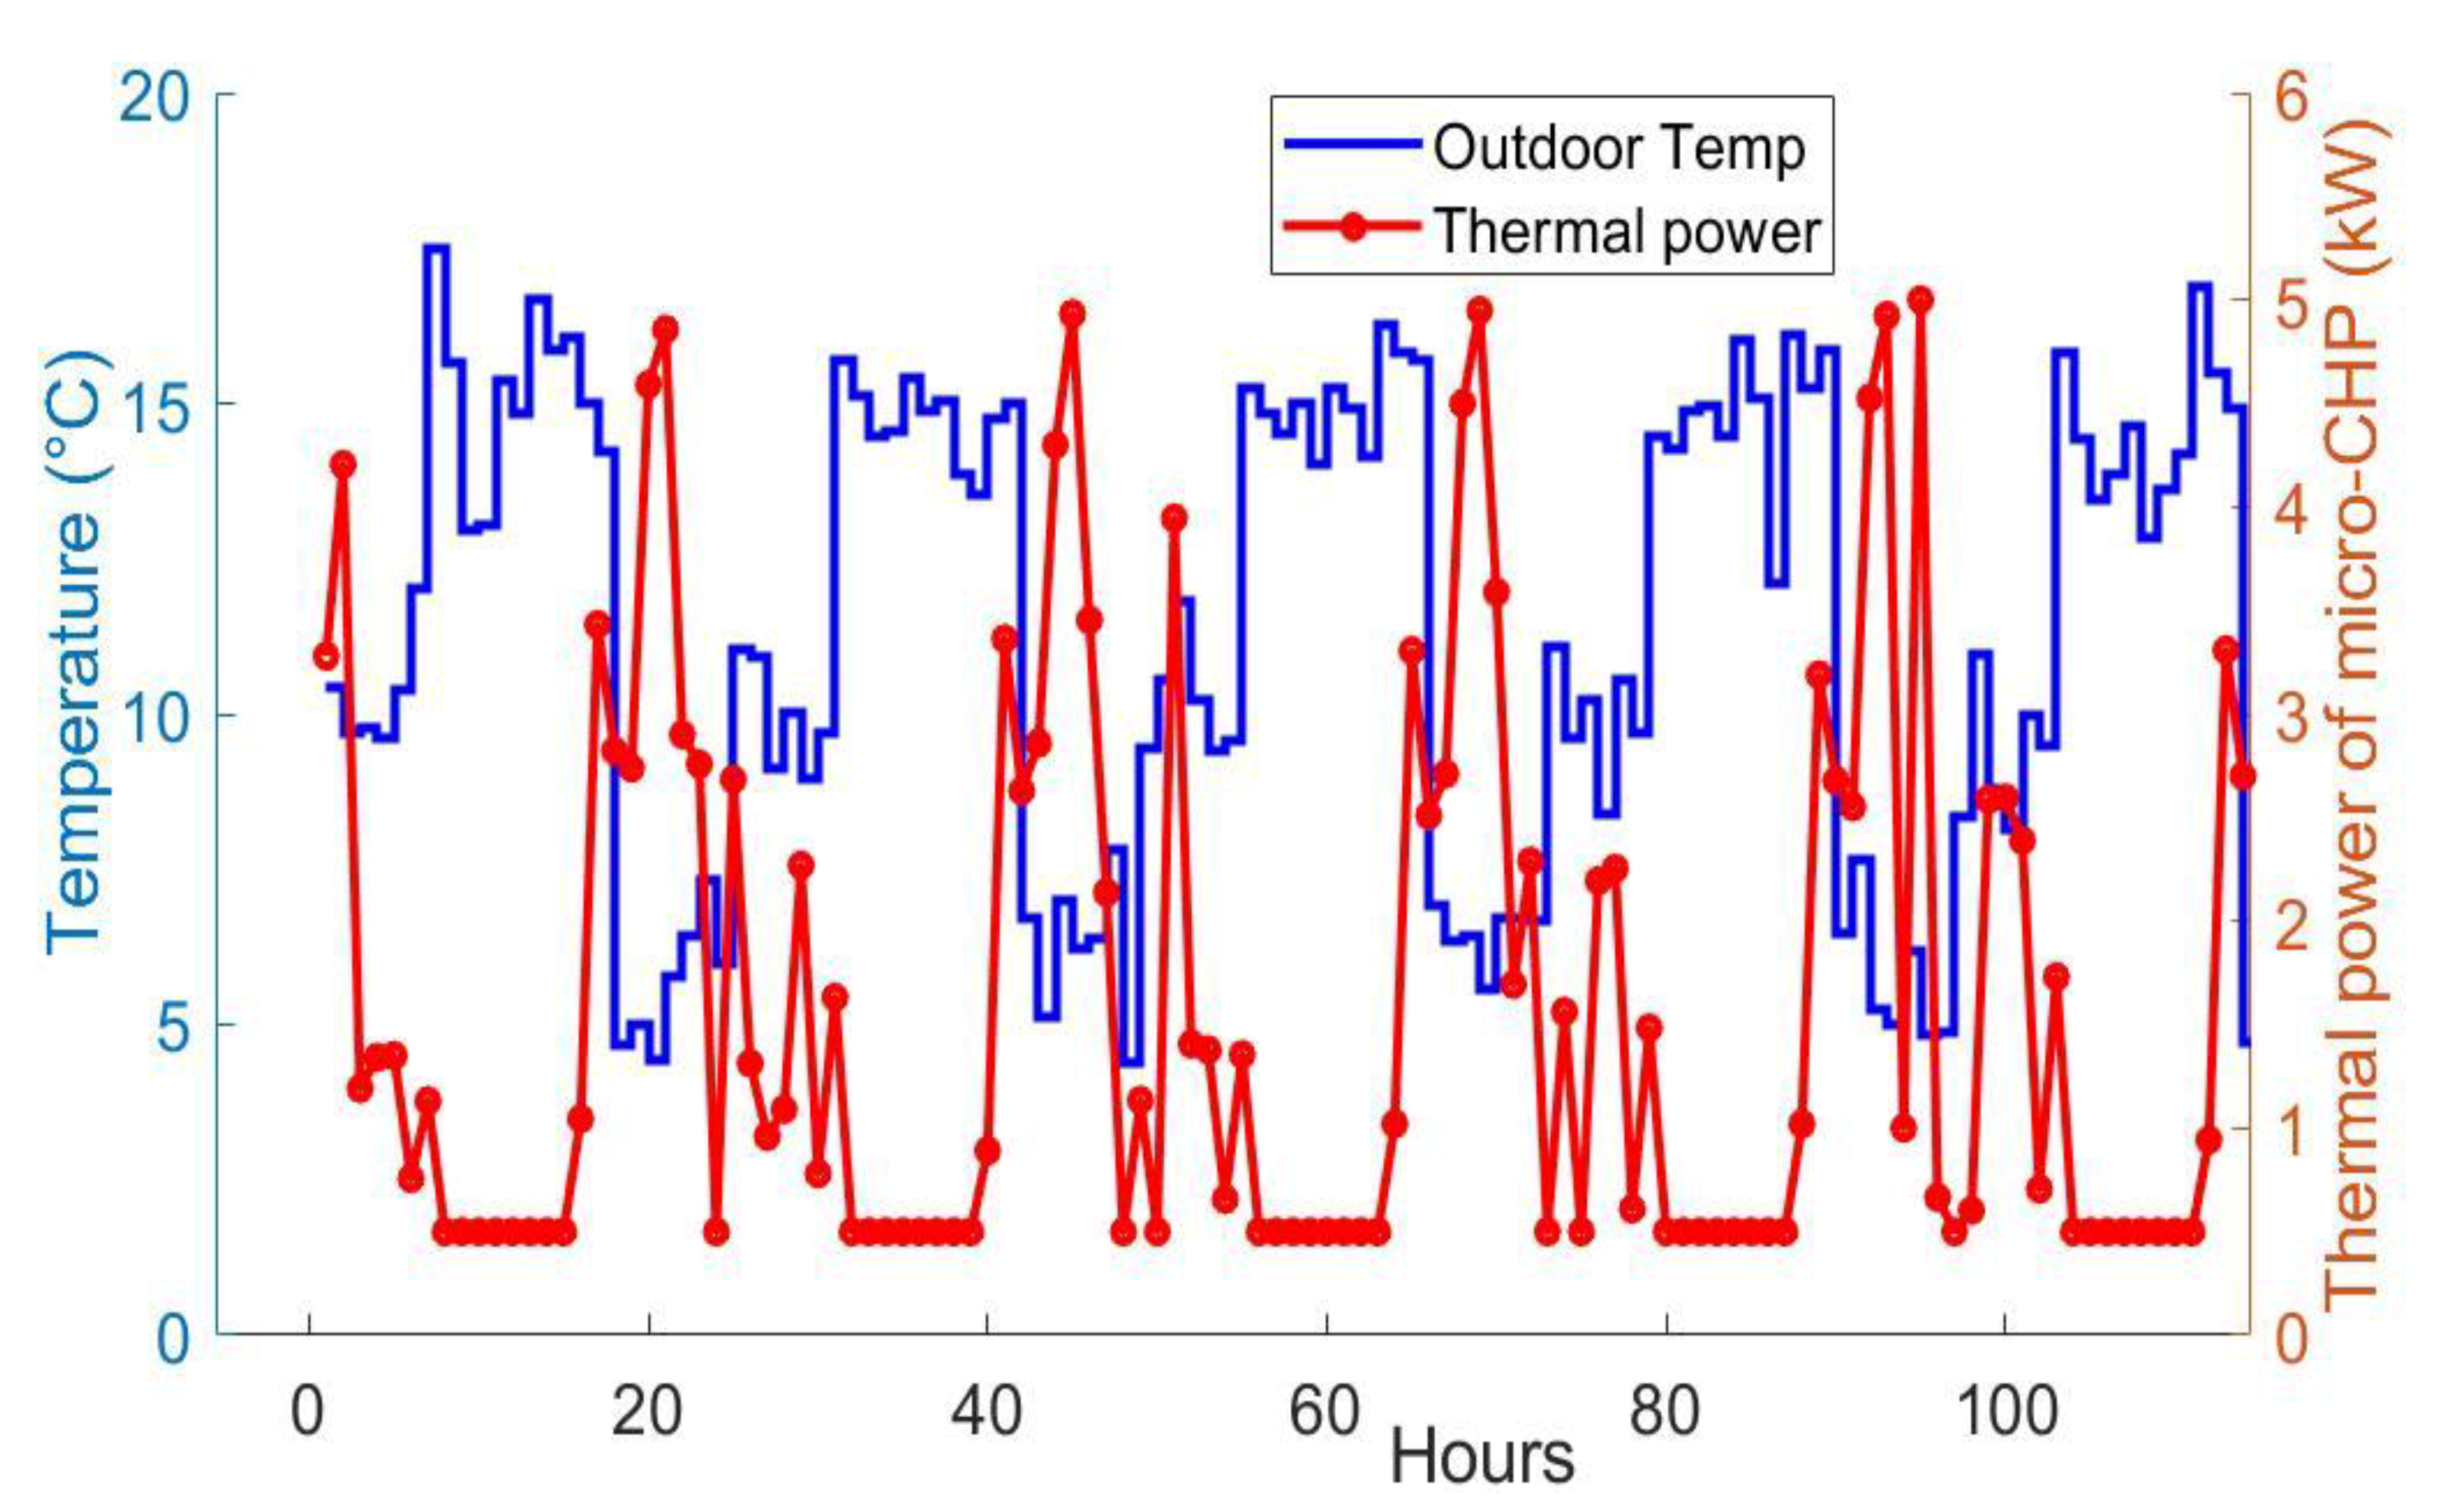
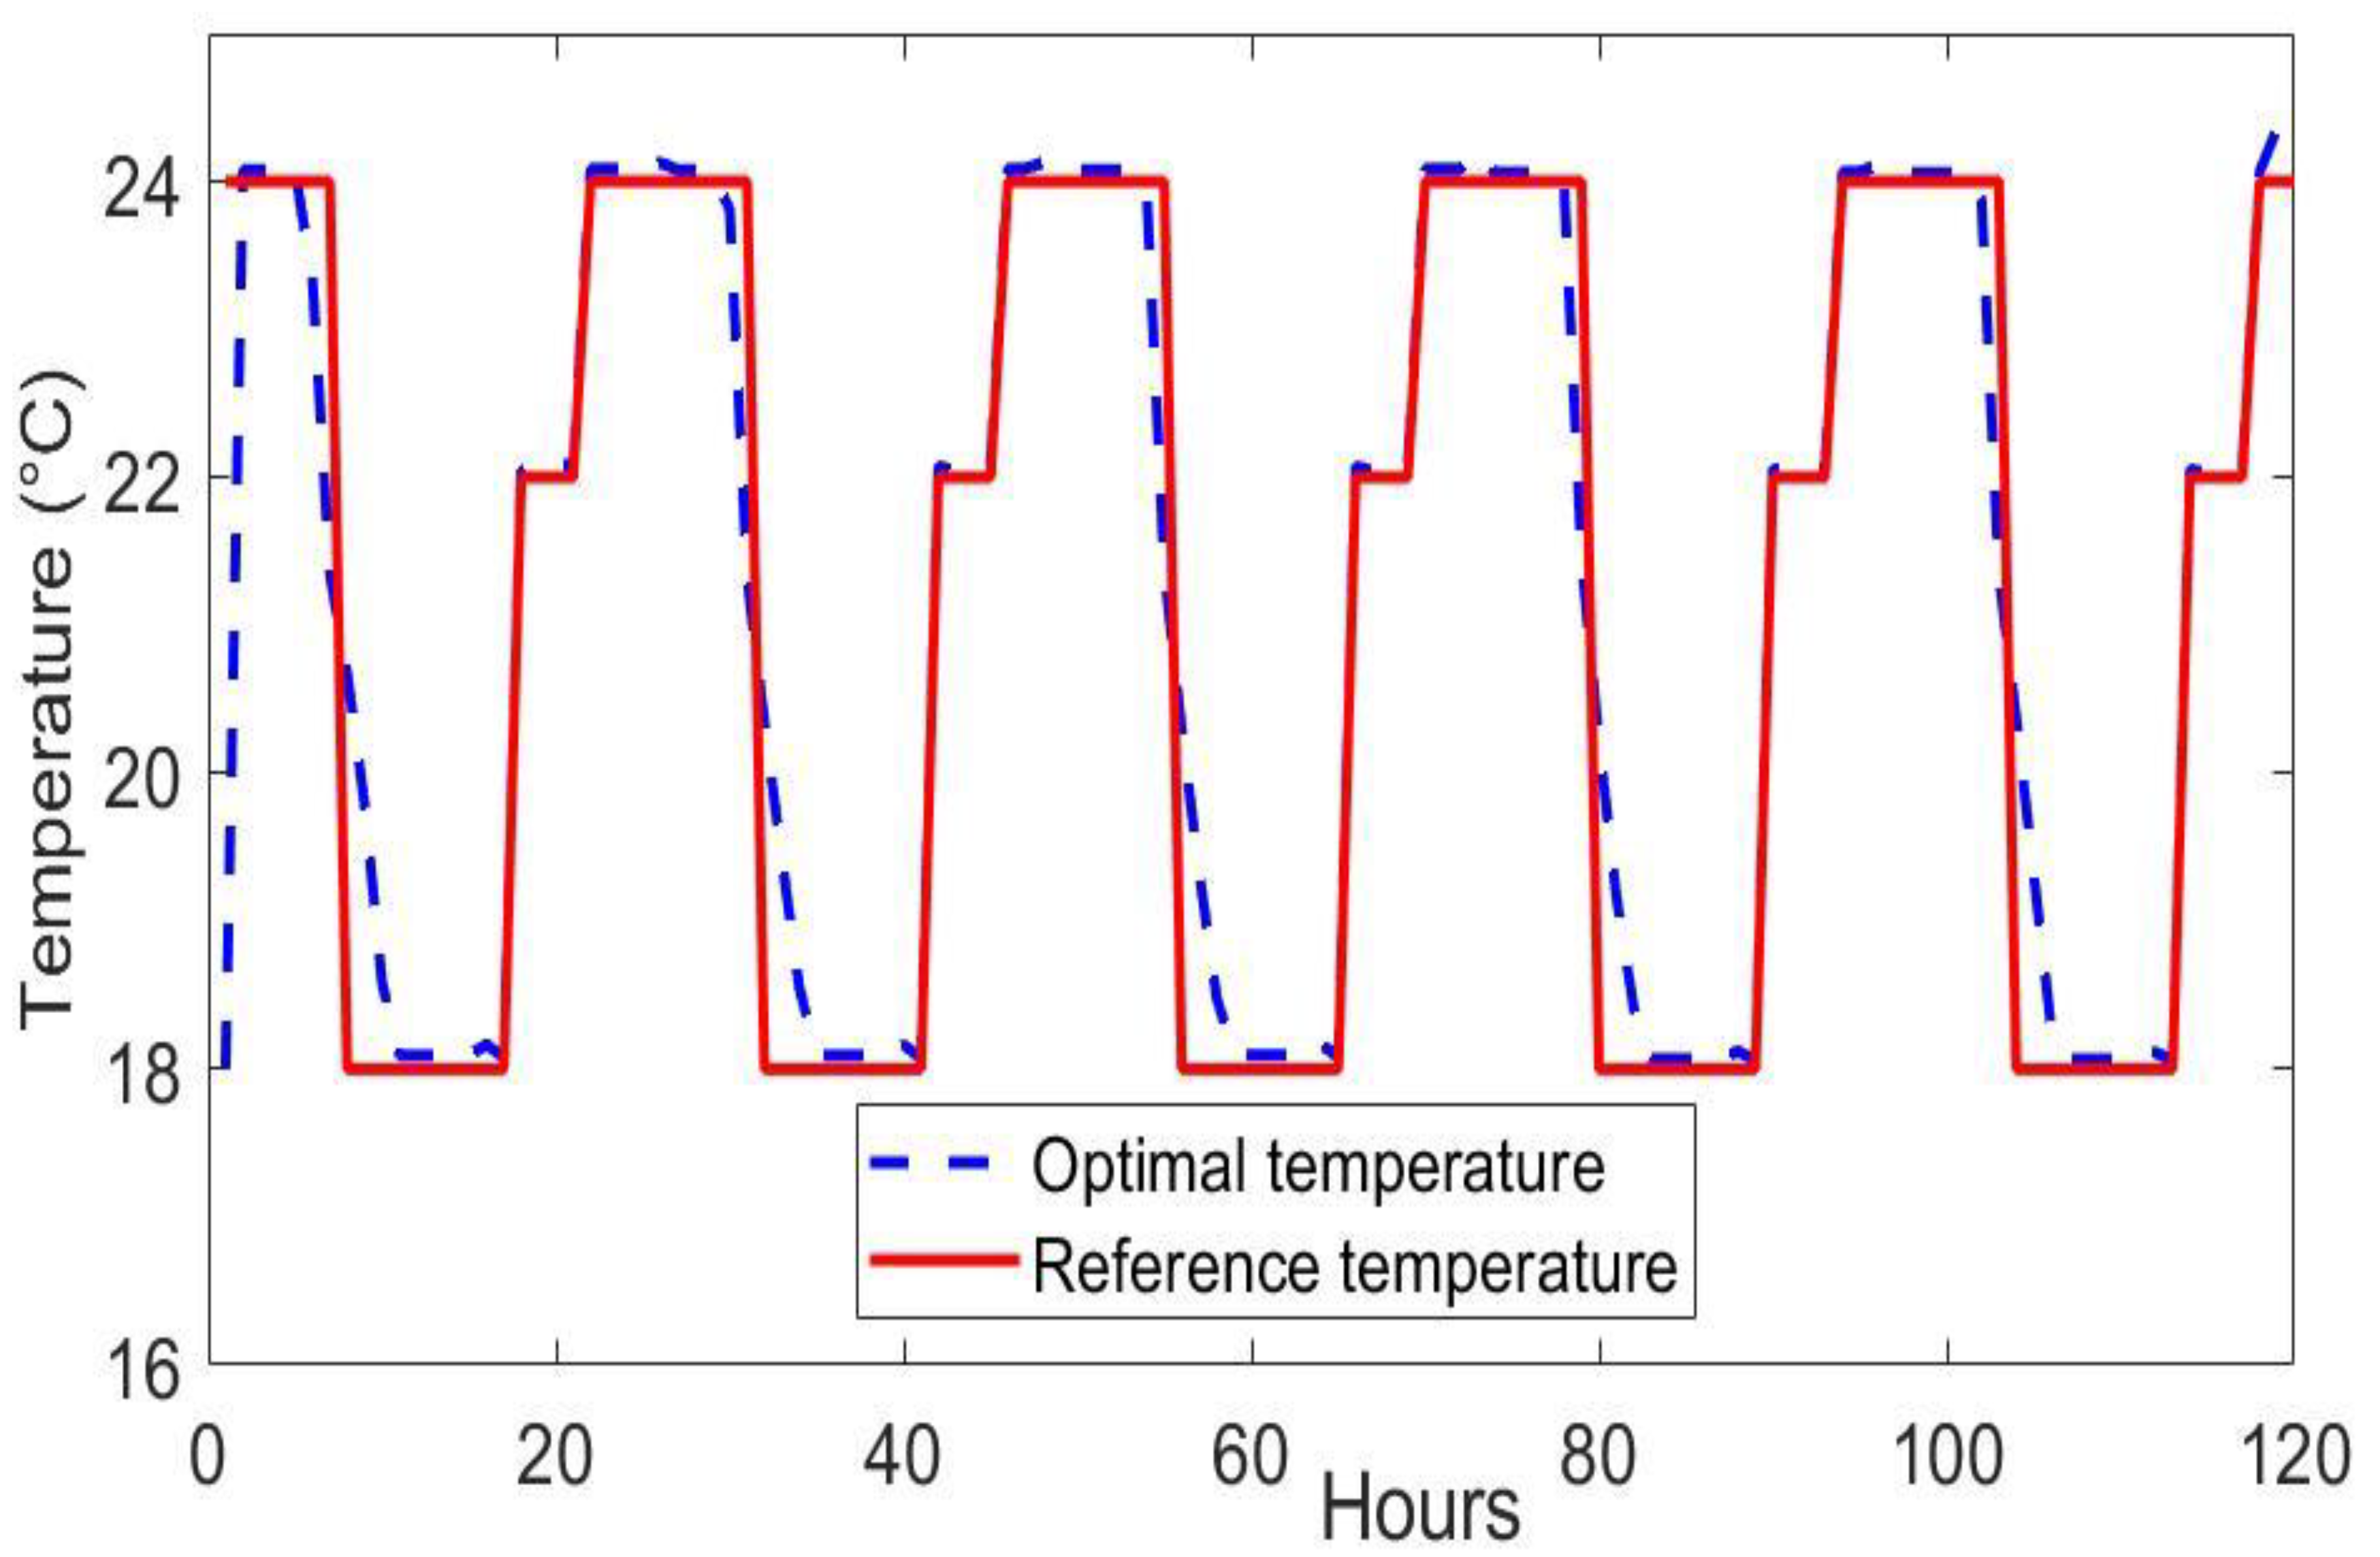
4.2. Results and Discussion

The high-level centralized control algorithm-based MPC defined in the prior sections is simulated and verified over a case study to prove its real application as well as to validate its performances considering several conditions. In this paper, it is supposed that the BIM includes renewable distributed generations, micro-CHP, ESD, electric and thermal loads, BEMS and an advanced metering infrastructure.
In this case study, the prediction and control horizons are both set equal to 24 h. Furthermore, the scheduling optimization problem has been resolved considering the receding horizon approach to take into account the intermittent character and dynamics of renewable resources and load. In addition, providing a route of the upcoming state and control variables satisfying the optimal functioning of the BIM is considered. The predictive model is applied over the prediction horizon considering new data. The expected renewable power output is modeled as the sum of deterministic part and a noise represented by the standard normal distribution to reflect the uncertain behavior of the resources. In general, the weighting factors are used to reflect and follow the strategy and objectives of the decision maker or users. In other word, the weighting factors define priorities in satisfying the different objectives (some time-conflicting). In this paper, we assumed the same priority, which means that the objectives should be satisfied considering the same priority.
The smart BIM includes a wind generator of 5 [kW] and a PV system of 1 [kW] including 4 × 250 [W] high efficiency polycrystalline solar PV modules. The deterministic renewable power generation is reported in Figure 4.
In this paper, it is assumed that the micro-CHP unit is devoted to maintaining the water storage heated through its thermal power output. The latter is set to feed the hot water demand and keep the building’s desired temperature. Although, the electric power output that is defined as a fraction of the thermal power is considered to support the BIM in covering its electric load. We note that the thermal resistance of the building’s shell affects strongly the operation of the micro-CHP unit. In this context, we considered six different building envelop materials with the aim to select optimal material minimizing the thermal power losses. The considered materials are: reinforced concrete, concrete, fire brick, clay, rock and wood; each one is characterized by its thermal conductivity. The thermal power losses of the building considering the six materials are shown in Figure 5. It can be seen that wood presents the best performance in term of minimizing the thermal power loss followed by clay and fire brick that showed similar behaviors. For the rest of the paper, the fire brick is chosen due to its good thermal proprieties as well as its large use in the north of Africa.
The time-varying power scheduling for the thermal power output of the micro-CHP unit as determined by the MPC algorithm is shown in Figure 6. It can be observed that the micro-CHP reached its maximum capacity only from 19:00 to 23:00; this is mostly for the reason that the operation of the unit tracks the temperature reference signal as well as the hot water demand defining the standard comfort of the residents. The proposed MPC model replies to the variation of the thermal loads and regulates the operation of the unit to track as the reference signal.
The dynamic state of the water storage temperature is described in Figure 7. It can be seen that the water temperature varies between 50 and 70 [°C], which define the comfort limits imposed by the occupants. This trend depends on the cold water temperature, outdoor temperature, as well as the comfort constraints imposed by the occupants.
The time-varying state of the predictive scheduling of the building’s temperature is shown in Figure 8. It can be seen that the desired temperature describing the comfort of the occupants is met except the intervals of [5 h, 8 h] and [19 h, 20 h]. We mention that initial temperature state of the building is 18 [°C], which justify the progressive evolution of the temperature at the beginning. Concerning the two other intervals, they coincide with peaks defining high demand in hot water. Consequently, the micro-CHP unit must satisfy both constraints related to building temperature and hot water. However, the MPC-based temperature validates the efficiency of the developed control strategy to follow the reference signal.
The MPC-based optimal state of the ESD as determined by resolving the optimization model considering the receding horizon scheme is presented in Figure 9. It can be observed that the ESD compensate the intermittent character of the wind and solar energy productions, fulfilling the total or a fraction of the electric load. Besides, the figure reports a comparison between the optimal states of the ESD as determined by the receding algorithm and as calculated considering perfect predictions. The purpose is to measure the impacts of the prediction errors on the optimal scheduling of the BIM operation. The investigation of the figure shows that the precision of the predictions considerably affect the optimal results.
The optimal scheduling of time-varying daily load satisfaction of the BIM is reported in Figure 10. The total electrical load has been satisfied mainly by the local energy production. The analysis of the results shows that 96% of the total electrical load has been fulfilled by the local production where 23% represents the total electric output of the micro-CHP and 73% is the renewable energy production coming directly from the renewable generators and/or discharged from the ESD.
The deficit that represents only 4% is purchased from the EDN. We have clearly demonstrated that coupling microgrid with residential buildings could be potentially beneficial from both building decision makers and the main electric grid. In fact, adopting such approach by commercial and institutional buildings could decrease significantly their energy bill and reduce the pressure on the grid. We note that the results obtained are mainly affected by the climate conditions, availability of renewable resources, accuracy of predictions, comfort constraints imposed by the occupants, as well as operational constraints.
The dynamic variation of the optimal state of the energy storage system for five days is reported in Figure 11. The storage system shows similar trends with different rates compensating the variabilities and fluctuations of the renewable resources. The storage system tends to track the power load of the building ensuring the comfort preferences of the occupants. Furthermore, the energy storage system regulates its operation to ensure the power balance between production and demand. The operation of the energy storage system depends mainly on the power balance at the BIM level. The charging/discharging states during five days are expressed in Figure 12. It can be seen that the storage system is mostly set in charging mode during the day and set in discharging mode at night due to the high power demand. In general, the operation strategy is affected by variabilities of the power load and the renewable energy production of the microgrid.
The operation of the micro-CHP is highly affected by the outdoor temperature. The time-varying thermal power output of the micro-CHP according to variation of the outside temperature is reported in Figure 13 for five days of operation. It can be seen that the micro-CHP responds actively to the variabilities of the outdoor temperature by regulating and adjusting the thermal power accordingly. As an example, during the first day, the micro-CHP is set to operate with the minimum power until 16:00, and then starts responding to the drop in outdoor temperature. We note that the operation of the micro-CHP is also affected by the occupants’ preferences represented by the set-points.
A comparison between the optimal temperature and the reference defining the comfort preferences of the occupants during five days is shown in Figure 14. We note that the initial starting indoor temperature is set to be 18 [°C]. It can be seen that the thermal comfort of the occupants is completely satisfied during all the days. This result demonstrates the efficiency and performance of the proposed control algorithm in the optimization and the real-time management of the whole BIM.

5. Conclusions

In this paper, the implementation of a multi-objective model predictive control MPC for a BIM has reached its objectives for optimizing both comfort of occupants in term of desired reference temperature, hot water and the electric load. Various methodologies in the literature presented complex frameworks, challenging to implement in practical cases, time-consuming, and computationally intensive or not appropriate for real-time implementations, or may generate suboptimal solutions. The strength of the proposed study can be summarized in providing a reduced and efficient predictive control strategy embedded in model predictive control to account for uncertainties of weather conditions and loads to optimally control a BIM. This paper aims to assess the value and utility of integrating the MPC multi-objective into a residential building through an electric and thermal optimization. A centralized control tool based on managing and controlling the renewable energies, energy storage, building material envelope, micro-CHP unit and the exchanged power with the main grid is tested. The main goal is to reduce significantly the energy bill, integrating the microgrid concept to building. The MPC resolved the optimization problem following the receding scheme, filled the electric need totally or in parts in renewable energies with less purchased power from the main grid. The total electrical load has been satisfied mainly by the local energy production in 96% including the CHP production and the renewable energies. The power purchased from the main grid was only 4% in peak load. The simulation results demonstrated clearly the efficiency of the MPC integrated to the building, taking advantages of the renewable energy sources by reducing the electric bill while ensuring the occupants’ comfort in desired temperature and hot water. The results of simulating the BIM operation over five days show that the thermal comfort of the occupants is completely satisfied during the whole time horizon. The BIM covered, as an average, about 87% of its power load, while, 13% is purchased from the utility. The results prove the ability of the proposed predictive model to cope with uncertainties and fluctuations of the renewable energy sources as well as the loads. Furthermore, the findings demonstrate the efficiency and performance of the proposed control algorithm in the optimization and the real-time management of the whole BIM. This real case can be generalized in a large-scale district to reduce the pressure on the electric grid and to enhance the penetration of renewable energy. In this case, the current problem formulation can be extended by adopting other control schemes and approaches like decentralized, team theory, multi-agent, and distributed control.

Author Contributions

Methodology, A.O. and Y.D.; modelling and formal analysis, A.O.; writing—original draft preparation, A.O.; writing—review and editing, A.O., Y.D. and R.B.; All authors have read and agreed to the published version of the manuscript.

Funding

This research received no external funding.

Acknowledgments

The publication of this article was funded by the Qatar National Library.

Conflicts of Interest

The authors declare no conflict of interest.

Nomenclature

A w total walls’ area [m2]
C w a t e r specific heat of water [kWh/l °C]
C a i r inside air heat capacity [kWh/°C]
e w thickness wall metering [m]
I s c , r e f module short circuit current [A]
I m p , r e f module maximum power current [A]
G i n solar irradiance [kW/m2]
G s t standard light intensity [kW/m2]
P r rated power [kW]
q T water storage volume [l]
R B I M thermal resistance [°C /kW]
V m p , r e f module maximum power voltage [V]
V o c , r e f module open circuit voltage [V]
β p v ,   s serial number of modules [–]
β p v ,   p parallel number of modules [–]
β C h a r charging efficiency [–]
β d i s discharging efficiency [–]
l n c ¯ ( t ) non-controllable load reference [kW]
T s t ( t ) temperature of water storage [°C]
T i n ( t ) indoor temperature [°C]
T o u t ( t ) outside temperature [°C]
T i n ¯ ( t ) indoor temperature reference [°C]
T c o l d ( t ) temperature of cold water [°C]
s ( t ) state of energy storage system [kWh]
v ( t ) expected wind speed [m/s]
u C h a r ( t ) charged power [kW]
u d i s ( t ) discharged power [kW]
u g , p ( t ) power purchased [kW]
u g , s ( t ) power sold [kW]
u c h p e l c ( t ) electric power of micro-CHP [kW]
u a i r t h ( t ) thermal power of micro-CHP [kWh]
u p v ( t ) power output of PV modules [kW]
u w t ( t ) power output of wind turbine [kW]
Δ u ˜ b a l ( t ) power balance [kW]

References

  1. Bayliss, C.R.; Hardy, B.J. Smart grids. In Transmission and Distribution Electrical Engineering, 4th ed.; Elsevier: Amsterdam, The Netherlands, 2012; pp. 1059–1074. [Google Scholar]
  2. Ouammi, A. Optimal Power Scheduling for Cooperative Network of Smart Residential Buildings. IEEE Trans. Sustain. Energy 2016, 7, 1317–1326. [Google Scholar] [CrossRef]
  3. Wang, L.; Wang, Z.; Yang, R. Intelligent Multiagent Control System for Energy and Comfort Management in Smart and Sustainable Building. IEEE Trans. Smart Grids 2012, 3, 605–617. [Google Scholar] [CrossRef]
  4. Tian, P.; Xiao, X.; Wang, K.; Ding, R. A Hierarchical Energy Management System Based on Hierarchical Optimization for Microgrid Community Economic Operation. IEEE Trans. Smart Grid 2016, 7, 2230–2241. [Google Scholar] [CrossRef]
  5. Zhao, P.; Suryanarayanan, S.; Simões, M.G. An Energy Management System for Building Structures Using a Multi-Agent Decision-Making Control Methodology. IEEE Trans. Ind. Appl. 2013, 49, 322–330. [Google Scholar] [CrossRef]
  6. Sun, B.; Luh, P.B.; Jia, Q.; Jiang, Z.; Wang, F.; Song, C. Building Energy Management: Integrated Control of Active and Passive Heating, Cooling, Lighting, Shading, and Ventilation Systems. IEEE Trans. Autom. Sci. Eng. 2013, 10, 582–602. [Google Scholar]
  7. Vaghefi, S.A.; Jafari, M.A.; Zhu, J.; Brouwer, J.; Lu, Y. A Hybrid Physics-Based and Data Driven Approach to Optimal Control of Building Cooling/Heating Systems. IEEE Trans. Autom. Sci. Eng. 2016, 13, 600–610. [Google Scholar] [CrossRef] [Green Version]
  8. Lee, S.; Kwon, B.; Lee, S. Joint Energy Management System of Electric Supply and Demand in Houses and Buildings. IEEE Trans. Power Syst. 2014, 29, 2804–2812. [Google Scholar] [CrossRef]
  9. Chapman, A.C.; Verbic, G.; Hill, D.J. Algorithmic and Strategic Aspects to Integrating Demand-Side Aggregation and Energy Management Methods. IEEE Trans. Smart Grid 2016, 7, 2748–2760. [Google Scholar] [CrossRef]
  10. Althaher, S.; Mancarella, P.; Mutale, J. Automated Demand Response from Home Energy Management System Under Dynamic Pricing and Power and Comfort Constraints. IEEE Trans. Smart Grids 2015, 6, 1874–1883. [Google Scholar] [CrossRef]
  11. Yao, E.; Samadi, P.; Wong, V.W.S.; Schober, R. Residential Demand Side Management under High Penetration of Rooftop Photovoltaic Units. IEEE Trans. Smart Grid 2016, 7, 1597–1608. [Google Scholar] [CrossRef]
  12. Wang, Z.; He, Y. Two-stage optimal demand response with battery energy storage systems. IET Gener. Transm. Distrib. 2016, 10, 1286–1293. [Google Scholar] [CrossRef]
  13. Li, Y.; Han, Y. A Module-Integrated Distributed Battery Energy Storage and Management System. IEEE Trans. Power Electron. 2016, 31, 8260–8270. [Google Scholar] [CrossRef]
  14. Dagdougui, H.; Ouammi, A.; Sacile, R. Optimal Control of a Network of Power Microgrids Using the Pontryagin’s Minimum Principle. IEEE Trans. Control Syst. Technol. 2014, 22, 1942–1948. [Google Scholar] [CrossRef]
  15. Bersani, C.; Dagdougui, H.; Ouammi, A.; Sacile, R. Distributed Robust Control of the Power Flows in a Team of Cooperating Microgrids. IEEE Trans. Control. Syst. Technol. 2016, 25, 1473–1479. [Google Scholar] [CrossRef]
  16. Ouammi, A.; Dagdougui, H.; Dessaint, L.; Sacile, R. Coordinated Model Predictive-Based Power Flows Control in a Cooperative Network of Smart Microgrids. IEEE Trans. Smart Grid 2015, 6, 2233–2244. [Google Scholar] [CrossRef]
  17. Fotuhi-Firuzabad, H.F.M.; Moeini-Aghtaie, M. A Stochastic Multi-Objective Framework for Optimal Scheduling of Energy Storage Systems in Microgrids. IEEE Trans. Smart Grid 2017, 8, 117–127. [Google Scholar]
  18. Sturzenegger, D.; Gyalistras, D.; Morari, M.; Smith, R.S. Model Predictive Climate Control of a Swiss Office Building: Implementation, Results, and Cost–Benefit Analysis. IEEE Trans. Control Syst. Technol. 2016, 24, 1–12. [Google Scholar] [CrossRef]
  19. Ouammi, A.; Dagdougui, H.; Sacile, R. Optimal Control of Power Flows and Energy Local Storages in a Network of Microgrids Modeled as a System of Systems. IEEE Trans. Control Syst. Technol. 2015, 23, 128–138. [Google Scholar] [CrossRef]
  20. Dagdougui, H.; Ouammi, A.; Dessaint, L.; Sacile, R. Global energy management system for cooperative networked residential green buildings. IET Renew. Power Gener. 2016, 10, 1237–1244. [Google Scholar] [CrossRef]
  21. Zhang, D.; Li, S.; Sun, M.; O’Neill, Z. An Optimal and Learning-Based Demand Response and Home Energy Management System. IEEE Trans. Smart Grid 2016, 7, 1790–1801. [Google Scholar] [CrossRef]
  22. Sartori, I.; Napolitano, A.; Voss, K. Net zero energy buildings: A consistent definition framework. Energy Build. 2012, 48, 220–232. [Google Scholar] [CrossRef] [Green Version]
  23. Sesana, M.M.; Salvalai, G. Overview on life cycle methodologies and economic feasibility for nZEBs. Build. Environ. 2013, 67, 211–216. [Google Scholar] [CrossRef]
  24. Brambilla, A.; Salvalai, G.; Imperadori, M.; Sesana, M.M. Nearly zero energy building renovation: From energy efficiency to environmental efficiency, a pilot case study. Energy Build. 2018, 166, 271–283. [Google Scholar] [CrossRef]
  25. Yujiro, H.; Tomohiko, I.; Kei, G.; Tsuyoshi, F. Simulation-Based Evaluation of the Effect of Green Roofs in Office Building Districts on Mitigating the Urban Heat Island Effect and Reducing CO2 Emissions. Sustainability 2019, 11, 2055. [Google Scholar]
  26. Lei, Z.; Zhenwei, C.; Qing, H.; Peipei, Z. Investigating the Constraints to Buidling Information Modeling (BIM) Applications for Sustainable Building Projects: A Case of China. Sustainability 2019, 11, 1896. [Google Scholar]
  27. Sara, E.; Chro Hama, R.; István, K.; Bálint, B.; János, G. Model Simplification on Energy and Comfort Simulation Analysis for Residential Building Design in Hot and Arid Climate. Energies 2020, 13, 1876. [Google Scholar]
  28. Van-Hai, B.; Akhtar, H.; Hak-Man, K.; Yong-Hoon, I. Optimal Energy Management of Building Microgrid Networks in Islanded Mode Considering Adjustable Power and Component Outages. Energies 2018, 11, 2351. [Google Scholar]
  29. Il-Seok, C.; Akhtar, H.; Van-Hai, B.; Hak-Man, K. A Multi-Agent System-Based Approach for Optimal Operation of Building Microgrids with Rooftop Greenhouse. Energies 2018, 11, 1876. [Google Scholar]
  30. Carli, R.; Dotoli, M. Decentralized control for residential energy management of a smart users microgrid with renewable energy exchange. IEEE/CAA J. Autom. Sin. 2019, 6, 641–656. [Google Scholar] [CrossRef]
  31. Carli, R.; Dotoli, M.; Jantzen, J.; Kristensen, M.; Othman, S.B. Energy scheduling of a smart microgrid with shared photovoltaic panels and storage: The case of the Ballen marina in Samsø. Energy 2020, 198, 117188. [Google Scholar] [CrossRef]
  32. Carli, R.; Dotoli, M. Cooperative Distributed Control for the Energy Scheduling of Smart Homes with Shared Energy Storage and Renewable Energy Source. IFAC-PapersOnLine 2017, 50, 8867–8872. [Google Scholar] [CrossRef]
  33. Tasdighi, M.; Ghasemi, H.; Rahimi-Kian, A. Residential microgrid scheduling based on smart maters data and temperature dependent thermal load modeling. IEEE Trans. Smart Grid 2014, 5, 349–357. [Google Scholar] [CrossRef]
  34. Hosseini, S.M.; Carli, R.; Dotoli, M. A Residential Demand-Side Management Strategy under Nonlinear Pricing Based on Robust Model Predictive Control. In IEEE International Conference on Systems, Man and Cybernetics (SMC); IEEE: Piscataway, NJ, USA, 2019. [Google Scholar]
Figure 1. Non-controllable electrical power demand.
Sustainability 12 04264 g001
Figure 2. Hot water demand.
Sustainability 12 04264 g002
Figure 3. Reference, outdoor and cold water temperatures.
Sustainability 12 04264 g003
Figure 4. Deterministic renewable power production.
Sustainability 12 04264 g004
Figure 5. Thermal power loss of the building.
Sustainability 12 04264 g005
Figure 6. The thermal power output of the micro-CHP.
Sustainability 12 04264 g006
Figure 7. Temperature of water storage.
Sustainability 12 04264 g007
Figure 8. MPC-based optimal scheduling of the building’s temperature.
Sustainability 12 04264 g008
Figure 9. MPC-based control of the ESD vs. deterministic.
Sustainability 12 04264 g009
Figure 10. MPC-based power dispatch in the BIM.
Sustainability 12 04264 g010
Figure 11. State of the energy storage system during five days of operation.
Sustainability 12 04264 g011
Figure 12. Charging/discharging modes during five days of operation.
Sustainability 12 04264 g012
Figure 13. Thermal power dynamics during five days.
Sustainability 12 04264 g013
Figure 14. Thermal comfort satisfaction during five days.
Sustainability 12 04264 g014

