Article

Population and Economic Projections in the Yangtze River Basin Based on Shared Socioeconomic Pathways

1
Joint Innovation Center for Modern Forestry Studies, College of Forestry, Nanjing Forestry University, Nanjing 210037, China
2
College of Hydrology and Water Resources, Hohai University, Nanjing 210098, China
3
School of Geographical Sciences, Nanjing University of Information Sciences &Technology, Nanjing 210044, China
*
Author to whom correspondence should be addressed.
Sustainability 2020, 12(10), 4202; https://doi.org/10.3390/su12104202
Submission received: 18 February 2020 / Revised: 10 May 2020 / Accepted: 17 May 2020 / Published: 20 May 2020

Abstract

:
The shared socioeconomic pathways (SSPs) were designed to project future socioeconomic developments as they might unfold in the absence of explicit additional policies and measures to limit climate forcing or to enhance adaptive capacity. Based on the sixth national population census and the third economic census data of China in 2010, this paper projects the population and economic conditions of the Yangtze River basin from 2010 to 2100 under the SSPs. The results showed that: (1) the population growth rate in most areas of the Yangtze River basin will decrease from 2021 to 2100. The population of the eastern Sichuan Province will decrease obviously, while it will increase obviously in Shanghai during this period. The population of the Yangtze River basin will decline from 2010 to 2100 under the SSPs except for SSP3; (2) The GDP (Gross Domestic Product) in most regions will increase by more than CNY 30 billion (Chinese Yuan) compared with 2010 and the total GDP will continue to rise after 2020; (3) The population of the three major urban agglomerations will decrease from 2020 to 2100. However, the GDP of the three major urban agglomerations will increase year by year, among which the YRDUA (Yangtze River Delta Urban Agglomeration) has obvious economic advantages. The GDP growth rate will maintain above 6% in 2020 under different SSPs, and then the growth rate will slow down or stall, even with negative growth in SSP1 and SSP4; (4) The GDP Per of the Yangtze River basin shows growth under different SSPs and it will maintain a growth rate of 6–9% until 2020. While the average annual growth rate of the SSP5 will be about 2.56% at the end of the 21st century, and it will remain at about 1% under other scenarios. This paper provides a scientific basis for the study of future population and socioeconomic changes and climate predictions for quantifying disaster risks.

Graphical Abstract

1. Introduction

The continuous growth of the global population and economy has brought unprecedented pressure on the climate environment [1,2,3]. Scenarios are used to help people understand the long-term consequences of short-term decisions, and scholars can explore future possibilities in the context of future uncertainty. This is an important part of climate change research and assessment [4]. Under this background, the socioeconomic scenario based on population and economic prediction has gradually become the core area of climate change research [5]. Describing the link between radiation forcing and socio-economic development plays an important role in the impact assessment of climate change and related climate policy formulation [6]. The population growth rate in developed countries has been slow or even negative since entering the 21st century; moreover, the population growth rate in most developing countries decreases year by year. The negative effects caused by labor shortage and aging, along with some poverty and employment difficulties in the national economic development, have attracted the attention of all countries in the world [7]. At present, in the context of global warming, combining population and economic development with the formulation of policies for the mitigation and adaptation of climate change, the study of future population and socio-economic changes is as important as the quantification of disaster risk by climate prediction.
The Shared Socioeconomic Pathways (SSPs) were developed in 2010 to build on the RCPs (Representative Concentration Pathways), which was used to understand potential climate change in the future through new socio-economic scenarios [8,9,10,11]. Many scholars described the SSPs as the reference path of scientific substitution features in the process of socio-ecological systems at the global or large regional levels in the 21st century, and spanning the time scale of the whole century [9,12]. The SSPs constructed on the basis of RCPs contain both radiative forcing characteristics and assumptions about future socio-economic development [9]. The SSPs can be set from the perspective adaptation and mitigation of the future social and economic challenges, which can be divided into five paths representing [9,13]. Apart from long-term population and socio-economic prediction, the SSPs can also be applied to predict the uncertainty of future climate change on the water shortage in a river basin [14].
The significance lies in reflecting the challenges of adaptation and mitigation in different socio-economies [15,16]. The simulation results of future emissions and land-use changes under SSPs have been applied to the Scenario MIP (Scenario Model Intercomparison Project) [17]. The Scenario MIP is an important part of the Sixth Coupled Model Comparison Program (CMIP6), which will provide multi-model climate prediction results under the framework of RCPs-SSPs and provide important scientific evidence [18,19,20]. For example, ISI-MIP (the Inter-Sectoral Impact Model Intercomparison Project), based on RCPs-SSPs, simulates the possible impacts of climate change on water supply, human health, agricultural production, ecosystems, etc., in a unified framework across sectors and across scales [21].
Recently, most of the researches directly used the global SSPs database, or used scenario data down-scaled to smaller areas. The detailed development of the ball SSPs story line at the national/sub-national and sector level is not fully considered, and it is difficult to meet the scenario needs of the regional conference department research [17]. For example, the current research on China is mainly divided into two categories: climate change impact assessment and SSPs element estimation. The previous researches are focused on the national level; however, there are fewer studies in subregions (at the subnational level) [17]. For example, Chen et al. estimated the number of Chinese provincial population, gender, age, education level and other structural information under five socio-economic development paths from 2010 to 2100, and found that China’s population would peak between 2027 and 2034 [22]. Pan et al. analyzed the impact of major economic impact factors on Chinese economic development under the SSPs and they found that the dominant factor affecting economic development has changed from capital input to total factor productivity [23]. Huang et al. pointed out that China’s population is expected to keep growing in 2025–2035. As a result of the change in fertility policy, the peak population will be 1.39 billion to 1.42 billion in different social scenarios [24]. Samir KC and Wolfgang Lutz reported that the difference between the population is 1.5 billion between the SSP3 and SSP1 pathways by the middle of the century [25]. Marian Leimbach made predictions based on Shared Socioeconomic Pathways (SSPs) and found that the global per capita GDP will grow at a rate of 1% to 2.8% per year during 2010–2100. [26]. Moreover, the SSPs are also used to assess the impact of climate change on agriculture and water resources [27,28]. For example, Hanasaki et al. [29] proposed a new global water scarcity assessment method, which can be used to determine the areas vulnerable to water shortage and analyze the time and degree of water shortage.
Relying on the development of the Yangtze River basin, the Yangtze River Economic Belt occupies an important strategic position in China. The construction and development of the Yangtze River Economic Zoon is a major strategy for China’s regional development and opening up to the outside world to promote the further development of China’s economy [30]. The existing literature takes into account the national development and regional differences, and combines the latest census data and policies to estimate the population, GDP and urbanization level of Chinese provinces under the SSP scenarios, but for basin scale is still relatively rare. Based on the important strategic position over the Yangtze River basin of China, it is of great significance to project the future economy and population of the Yangtze River basin under different SSPs scenario [31,32,33,34]. It can also provide a reliable reference for exploring the population and economic problems in the sustainable development of the ecological economic system in other areas in the world.

2. Materials and Methods
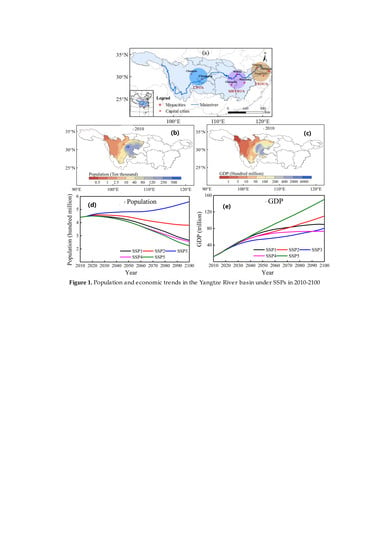
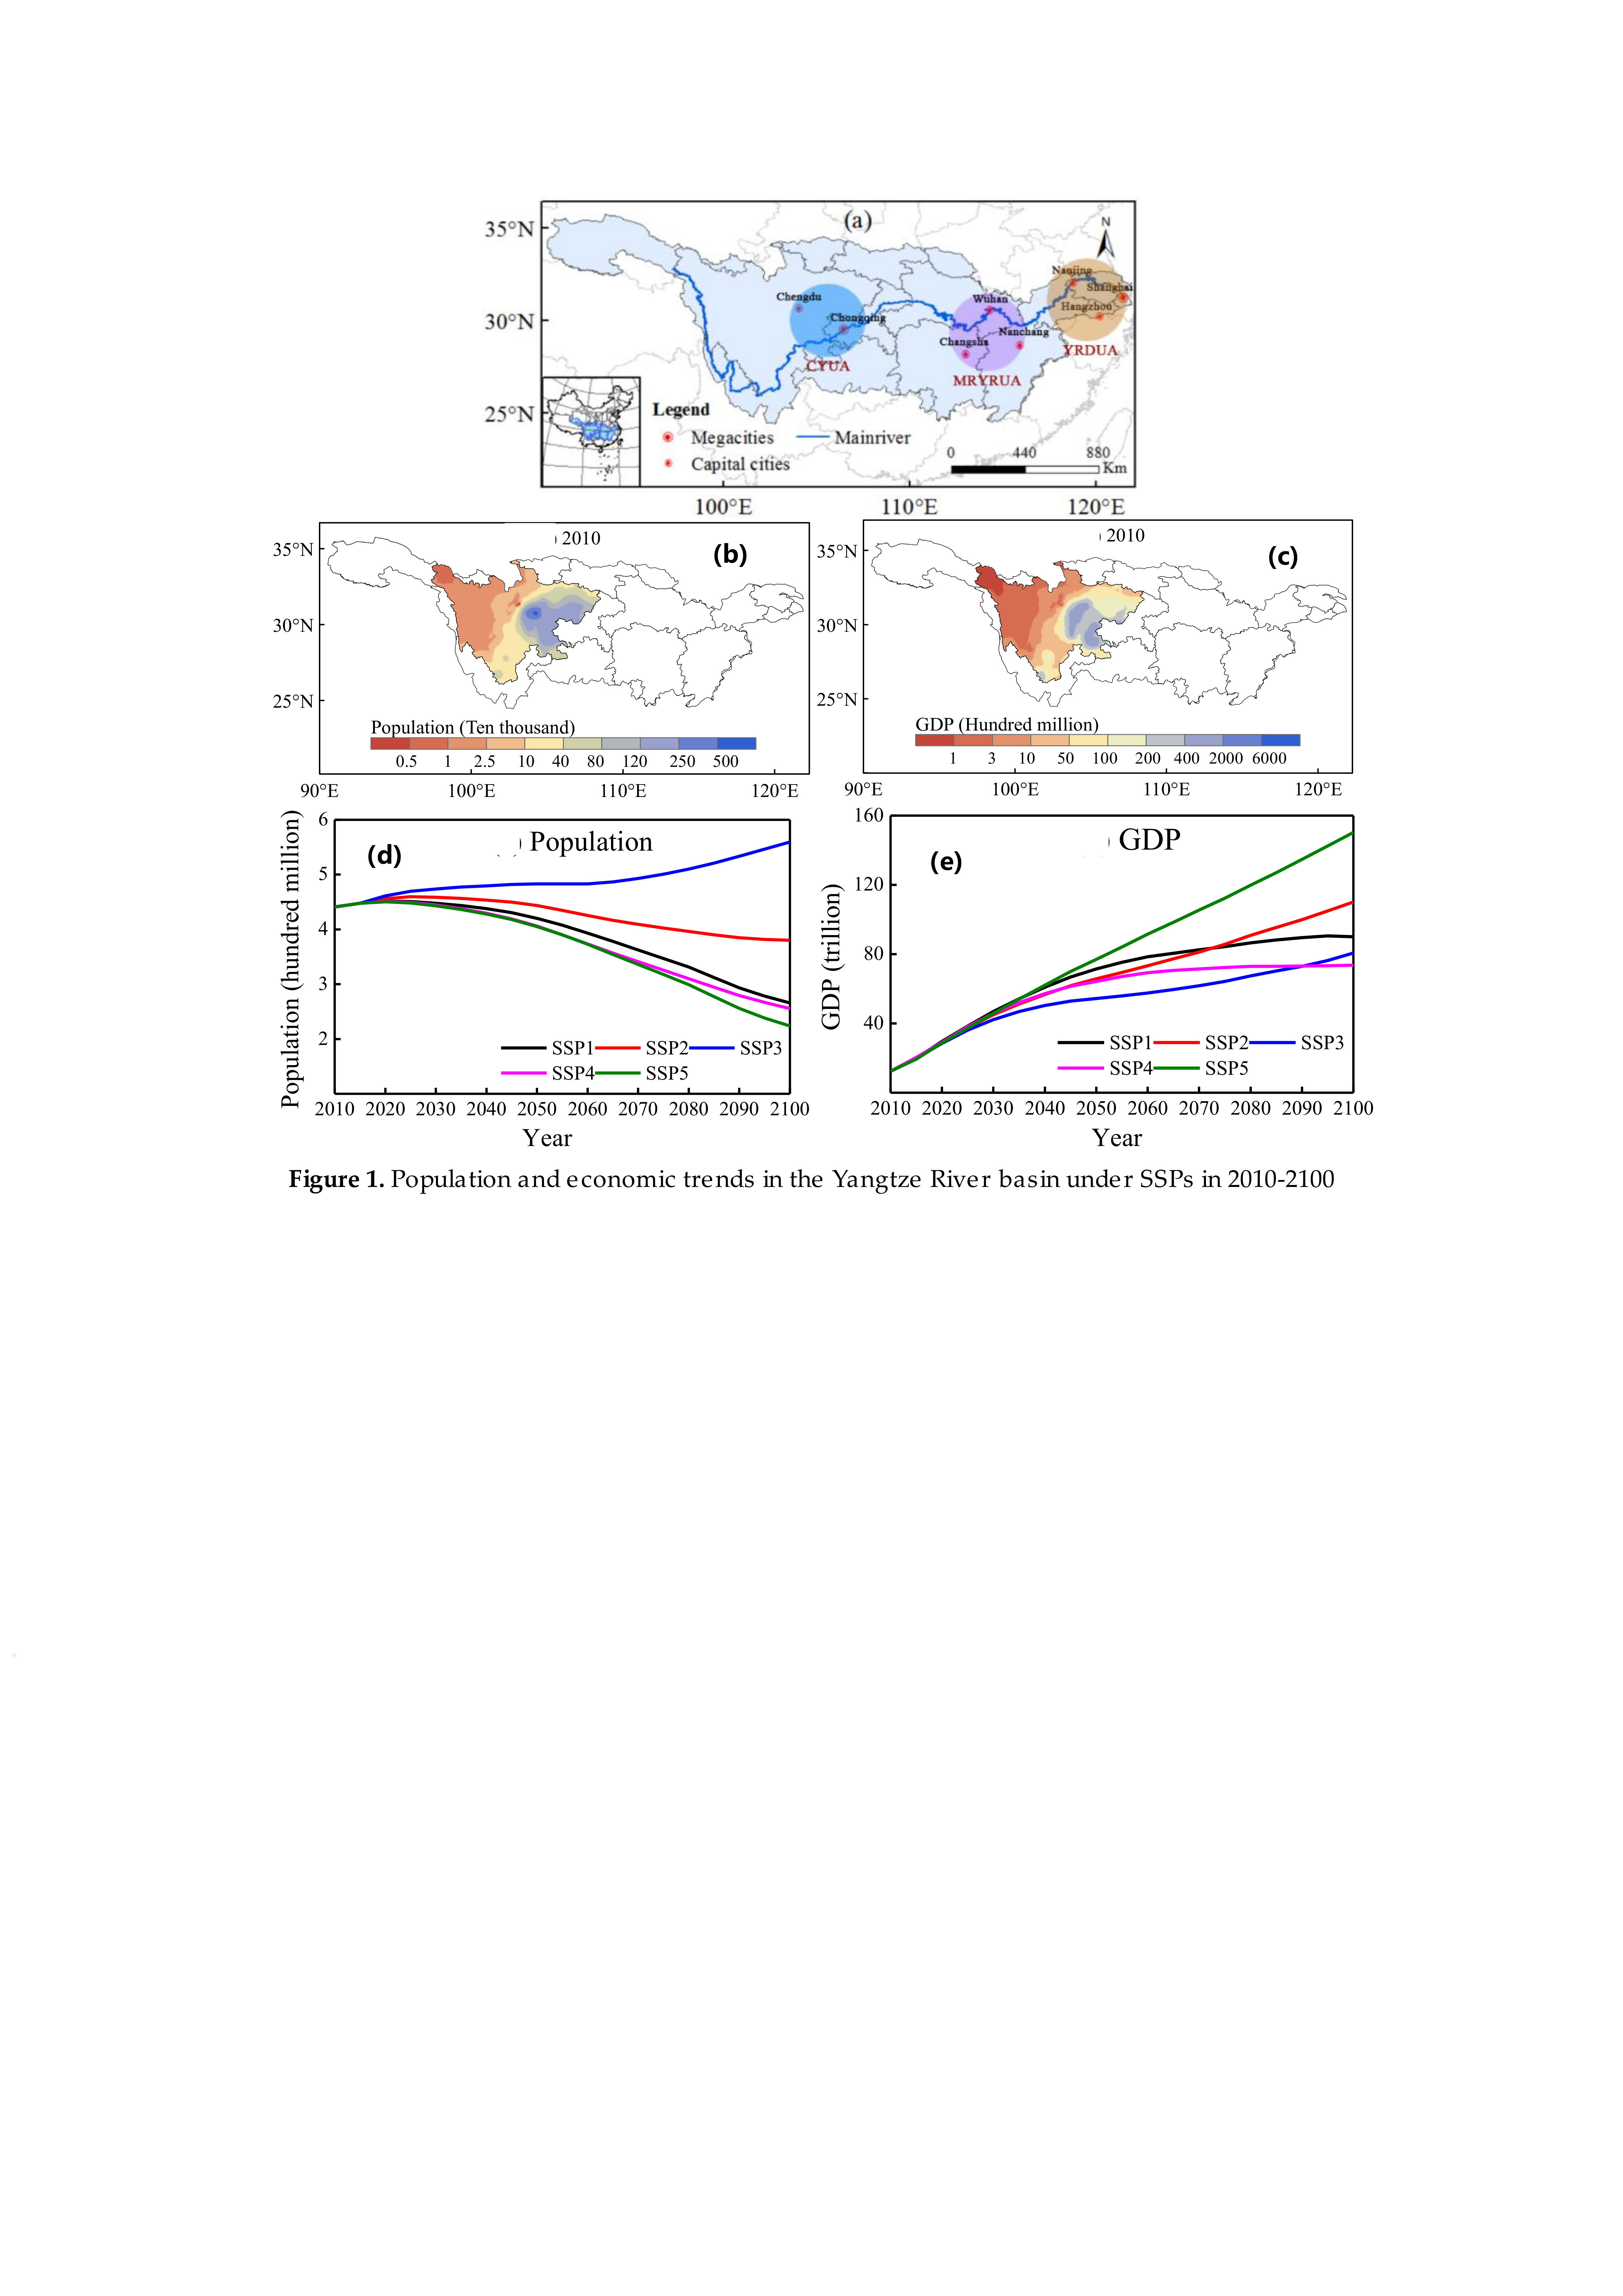
2.1. Study Area

The location map of the Yangtze River basin is shown in Figure 1. The Yangtze River is the largest river in China and the third largest river in the world, accounting for 35.1% of the total flow in China [35]. The river originates from the Qinghai-Tibet plateau and flows from west to east. The main stream of the Yangtze River covers an area of 1.8 million km2, accounting for 18.8% of the land area, 36% of the population and 40% of the GDP [36]. According to the survey, the Yangtze River basin has the largest number of towns and population in the world, and the most complete industrial system. The Yangtze River occupies an important position in regional development.
There are three major urban agglomeration in the Yangtze River basin, including Chengdu-Chongqing Urban Agglomeration (CYUA), Middle Yangtze Reaches Urban Agglomeration (MYRUA) and Yangtze River Delta Urban Agglomeration (YRDUA) (Table 1).

2.2. Data

The population forecast in this paper uses the age structure, sex ratio, education, fertility, mortality, migration and other indicators from the fifth and sixth national census data. The economic forecast takes the data of total factor productivity, energy, capital, labor in the 2nd and 3rd economic censuses as the original data. The Population–Development–Environment (PDE) model and Cobb–Douglas Economic (Cobb–Douglas) model were used to forecast the population and economy of the Yangtze River basin from 2010 to 2100 [31,33].

2.3. Methods

Meng Lingguo and others compared the Linear Regression model, the United Nations model, the average growth rate method, the exponential smoothing method, the average growth rate method, the grey system GM method and the Population–Development–Environment (PDE) model used in the current population prediction [37]. Although the average growth method, average growth rate method, and exponential smoothing method are simple, convenient, and fast to calculate, due to the many factors affecting population growth, the assumption of a new fixed number of people every year is unrealistic. Therefore, the accuracy of the model’s prediction results has been questioned. The premise of Linear Regression method is to assume that the future will follow the historical trend unchanged, but considering the current changes in China’s fertility policy, so this method is also not suitable for this study. The United Nations model is used to predict the proportion of urban population and is not suitable for studying the population trend of the Yangtze River basin. The grey system GM method abandons the statistical inspection process, and its scientific nature is questioned. The PDE model expands the cohort composition prediction method and multi-state life table, and divides the population into different combinations according to age and sex, fertility, and mortality. The calculation formula is easy to understand. There is a lot of space for using this model to study the future total population and population structure change.
Population forecast for 2010–2100 adopts the PDE model, taking the sixth national population census in 2010 as the original data, and assuming that the model parameters of future mortality, fertility, education and migration are high, medium and low (Table 2). Under the medium assumption, the social and economic level remains at the current level. Combined with the basic national conditions of the current two-child policy, the total population of China will increase to a certain extent. China’s total fertility rate will rise to 1.9 in 2019 and gradually stabilize after dropping to 1.8 after 2020. According to the age-specific mortality rate directly registered in the census, the average life expectancy of China’s population in 2010 will reach 77.95 years, including 75.65 years for men and 80.49 years for women. According to the prediction of the United Nations, the life expectancy of Chinese men will increase from 74.23 years in 2010–2015 to 86.71 years in 2095–2100, while that of women will increase from 77.23 years to 88.18 years [24]. Provincial life expectancy is calculated on the basis of provincial death rates at different ages in 2010, with life expectancy expected to increase by two years per decade before 2050 and drop to one year per decade after that. The parameter setting of migration rate is the same as that in 2010, and the migration population of each province remains unchanged at the current level [32].
Under the low/high hypothesis, TFR (Total Fertility Rate) is lower/higher than the medium hypothesis since 2011, 20% lower/higher than the medium hypothesis by 2030, and 25% lower/higher after 2050. Assume that life expectancy is reduced/increased by 1 year under low/high assumptions. Under the low assumption, the migrant population in each province decreased to year by year, while under the high assumption, the final migrant population was twice that of 2010. Lower assumptions suggest, to maintain the current level of education, under the hypothesis of the development of the higher, that the level of education in China will reach the level of South Korea or Singapore by 2050 (Korean elementary school middle school and university enrolment were 1.00, 1.00 and 0.93, respectively), the medium hypothesis—between higher and low assumptions, takes the middle value between the high hypothesis and the low hypothesis [32]. The model expression is as follows [31]:
P t + 1 = P t × ( 1 D t + 1 ) + M t + 1
Pt+1t + 1 year old population in a given year, P t —Number of ts in the previous year, Dt+1—The death rate of t + 1 year old population in that year, Mt+1—That year t + 1 year old migration population.
P n = t = 15 49 P t × R t × F t  
Pn—The number of births in a given year; Pt—Population of t years old at that year; Rt—The proportion of the population aged t was female; Ft—The birth rate at t.
The SSP1 scenario presents a sustainable green development path; the challenges of climate change adaptation and mitigation are low. It maps the SRES B1/A1 scenario. Due to the improvement of education and health, the fertility rate and mortality rate are lower, resulting in a reduction in the number of people. The SSP2 scenario represents the intermediate path, facing adaptation and mitigation of moderate climate change. It maps the SRES B2 scenario. The development trend of the world is basically similar to the main trend in recent decades. Parameters such as fertility, mortality, migration and education are all medium-sized assumptions. The SSP3 scenario is partial or inconsistent development, facing high climate change challenges. It maps the SRES A2 scenario—scenarios with high fertility and mortality, and low education. Under the SSP4 scenario, it is mainly focused on adaptation challenges and unbalanced development. It maps the SRES A2 scenario—low fertility countries, low fertility and education, moderate mortality and migration. The SSP5 scenario focuses on mitigating challenges, attaches more importance to the traditional rapid development, and focuses on the rapid development of its own economy and strength—accompanied by low fertility and mortality, and high education [12,24]. Table 3 shows the summary of the SSPs.
Over the past decades, many scientific researchers have looked for a function that can represent the output level as a function to the input level, for example, capital, labor, and land. It was found that the Cobb–Douglas model can make the best statistical fit for empirical data on the premise that the elasticity of the constant output to the factor input and the Hicks neutral technique [26,38]. The Cobb–Douglas model is widely used in the systematic study of regional economy due to its simple data form and clear economic significance. It is called the general method of regional system diagnosis and system prediction [39].
The Cobb–Douglas model is adopted to predict China’s economy in 2010–2100 according to the data of the third economic census and the statistical data of 2010 [33]. The Cobb–Douglas model is used to predict the production of industrial systems or large enterprises in countries and regions and to analyze the ways in which production is developed. It takes the form [40,41]:
Y ( t ) = K ( t ) α L ( t ) 1 α T ( 0 ) e λ t
where Y denotes GDP, K capital stock, α the output elasticity on capital, L labor input, T total factor productivity (TFP) and λ Level of scientific and technological progress. T(0) is TFP in 2010. TFP is calculated by dividing output by the weighted average of labor and capital input.
Among these, Labor (L) has three components: working age people (WAP), labor force participation (LFPR) and education (H).
L = q H × LEPR ( q ) × WAP ( q )
where WAP distinguishes two age classes q: those aged 15–64 years and those aged 65 and above. In 2010, the LFPR of the population aged 16–64 was about 77.37%, and the LFPR of the population aged 65 and above was about 19%.
The factors of labor production are affected by education (H), the calculation formula is as follows [26]:
H = exp ( 0.134 min ( M 2010 , 4 ) + 0.101 min ( max ( M 2010 4 , 0 ) , 4 ) + 0.068 max ( M 2010 8 , 0 ) )
where   M 2010 denotes Mean years of schooling (MYS) in 2010, China’s MYS in 2010 was approximately 9.04 years.
The capital stock (K) reflects the cumulative amount of social and economic capital at a certain point in time. The most common method for measuring basic stock is the perpetual inventory method [33]. Using 1952 as the base year, the perpetual inventory method is used to calculate the capital stock of China and the provinces (districts/cities) in 2010 at the constant price of the base year [33]. It takes the form:
K t + 1 = ( 1 d ) K t + I t
where d denotes Depreciation rate, which is 6.3%; I—Total amount of fixed assets, China’s capital stock at CNY 1.391795 trillion in 2010.
As for the assumed value of LFPR of labor force population aged 15–64 under each path of SSPs, the SSP2 is at a medium level, and LFPR will converge to about 0.7 in the future. LFPR converges to 0.7 in the future SSP1. The fast developing SSP5 LFPR converges to about 0.8. For SSP3 with slow development, LFPR will converge to 0.6 in the future. Under the path of SSP4, the growth rate of LFPR is slow, but eventually it will reach the long-term stable state of LFPR at 0.75 [24].
Under the medium assumption of maintaining the current level of science and technology, the average annual growth rate of factor productivity of all people is 0.7%. The low/high hypothesis assumes that the total factor productivity is lower/higher than the medium hypothesis. Under the SSP1–5, the average annual growth rate of factor productivity of all people is different. Under the SSP1, SSP2 and SSP4, it is 0.7%; under the SSP3 and SSP5, it is 0.35% and 1.05%, respectively [33,42]. The elasticity coefficients of capital output were also different in different paths. The SSP1 and SSP5 scenarios developed rapidly, with alpha converging to 0.35 and 0.45, respectively, and the convergence time was 75 years and 250 years. It takes 150 years for convergence to 0.35 and 0.25 under the SSP2 and SSP3 scenarios. Under the SSP4, alpha will converge to 0.3, which takes about 75 years (Table 4).
At present, in China’s population forecast, the input data for the forecasting models were different. Even the same influencing factors were different due to the statistical caliber of each region. This produces errors in the statistical results of the population of the entire region, leading to inaccurate predictions. Using national census and economic census data, the data are authoritative. Under the assumption that the base period population structure data are accurate and the population change parameters are reasonable. The results of the population forecast can indicate the future population development process. Even if there is a gap between these two assumptions and the actual situation, the results of the population forecast can roughly reflect the trend of the future population process. Domestic scholars evaluated the quality of the sixth census data in 2010. It was found that the under-reporting rate of the population aged 0–9 was 0.75%, the re-reporting rate was 0.55%, and the total error rate was 1.30%. According to the spot check results after the registration phase of the census, the total under-reporting rate of the population was 0.12% and 1.6 million were underreported. The total population published in the 2010 Census Bulletin is credible [43]. In the process of economic forecasting, although factors such as population and education were used as inputs, there was a lack of consideration of the direct impact on urbanization [44]. All of these will have a certain impact on the prediction and put limitations on the model prediction.

3. Results

3.1. Verification of Prediction Results

The national bureau of statistics data from 2010 to 2018 were analyzed and compared with the data predicted by the model. Sichuan province, Hubei province and Shanghai city were selected as representative provinces (cities) to verify the statistical data and the estimated results under the SSP2 scenario. The total annual population of Sichuan Province, Hubei Province and Shanghai city from 2010 to 2018 announced by the National Bureau of Statistics was 81.7 million, 58.26 million and 23.94 million, respectively. Under the SSP2 scenario, the annual average population estimates for Sichuan, Hubei, and Shanghai from 2010 to 2018 were 80.1 million, 58.09 million, and 23.6 million, respectively. The annual error between the forecast data and the statistical data is below 4.0% (Figure 2a). The analysis results show that the PDE model can be used in population estimation research in the Yangtze River basin, and that the parameter selection is reasonable.
From 2010 to 2018, the average annual GDPs announced by the National Bureau of Statistics of Sichuan, Hubei, and Shanghai were CNY 2.82 trillion, CNY 2.75 trillion, and CNY 2.43 trillion. The predicted average annual GDP of Sichuan, Hubei and Shanghai from 2010 to 2018 is CNY 2.44 trillion, CNY 2.36 trillion, and CNY 2.01 trillion under the SSP2 scenario. The average annual error of the two sets of data is about 14.0% (Figure 2b). The above results show that the Cobb–Douglas model can be applied to the population estimation over the Yangtze River basin, and the parameters set by the model are more reasonable.
Using the statistical data of 2010–2018 and the prediction data under the SSP2, the ME (Mean Error), RMSE (Root Mean Squared Error) and MARE (Mean Absolute Relative Error) of the Sichuan Province, Hubei Province and Shanghai City data are discussed. As can be seen from the results (Table 5), the ME of the population of all province and city is between −0.1–0.02, the RMSE and MARE are less than 0.051 and 0.019, respectively. The ME of GDP of each province and city is about −0.4, the RMSE and MARE are about 1.1 and 0.1, respectively. It shows that the accuracy of the prediction of population and GDP using the PDE and Cobb–Douglas models meets the requirements in this study.

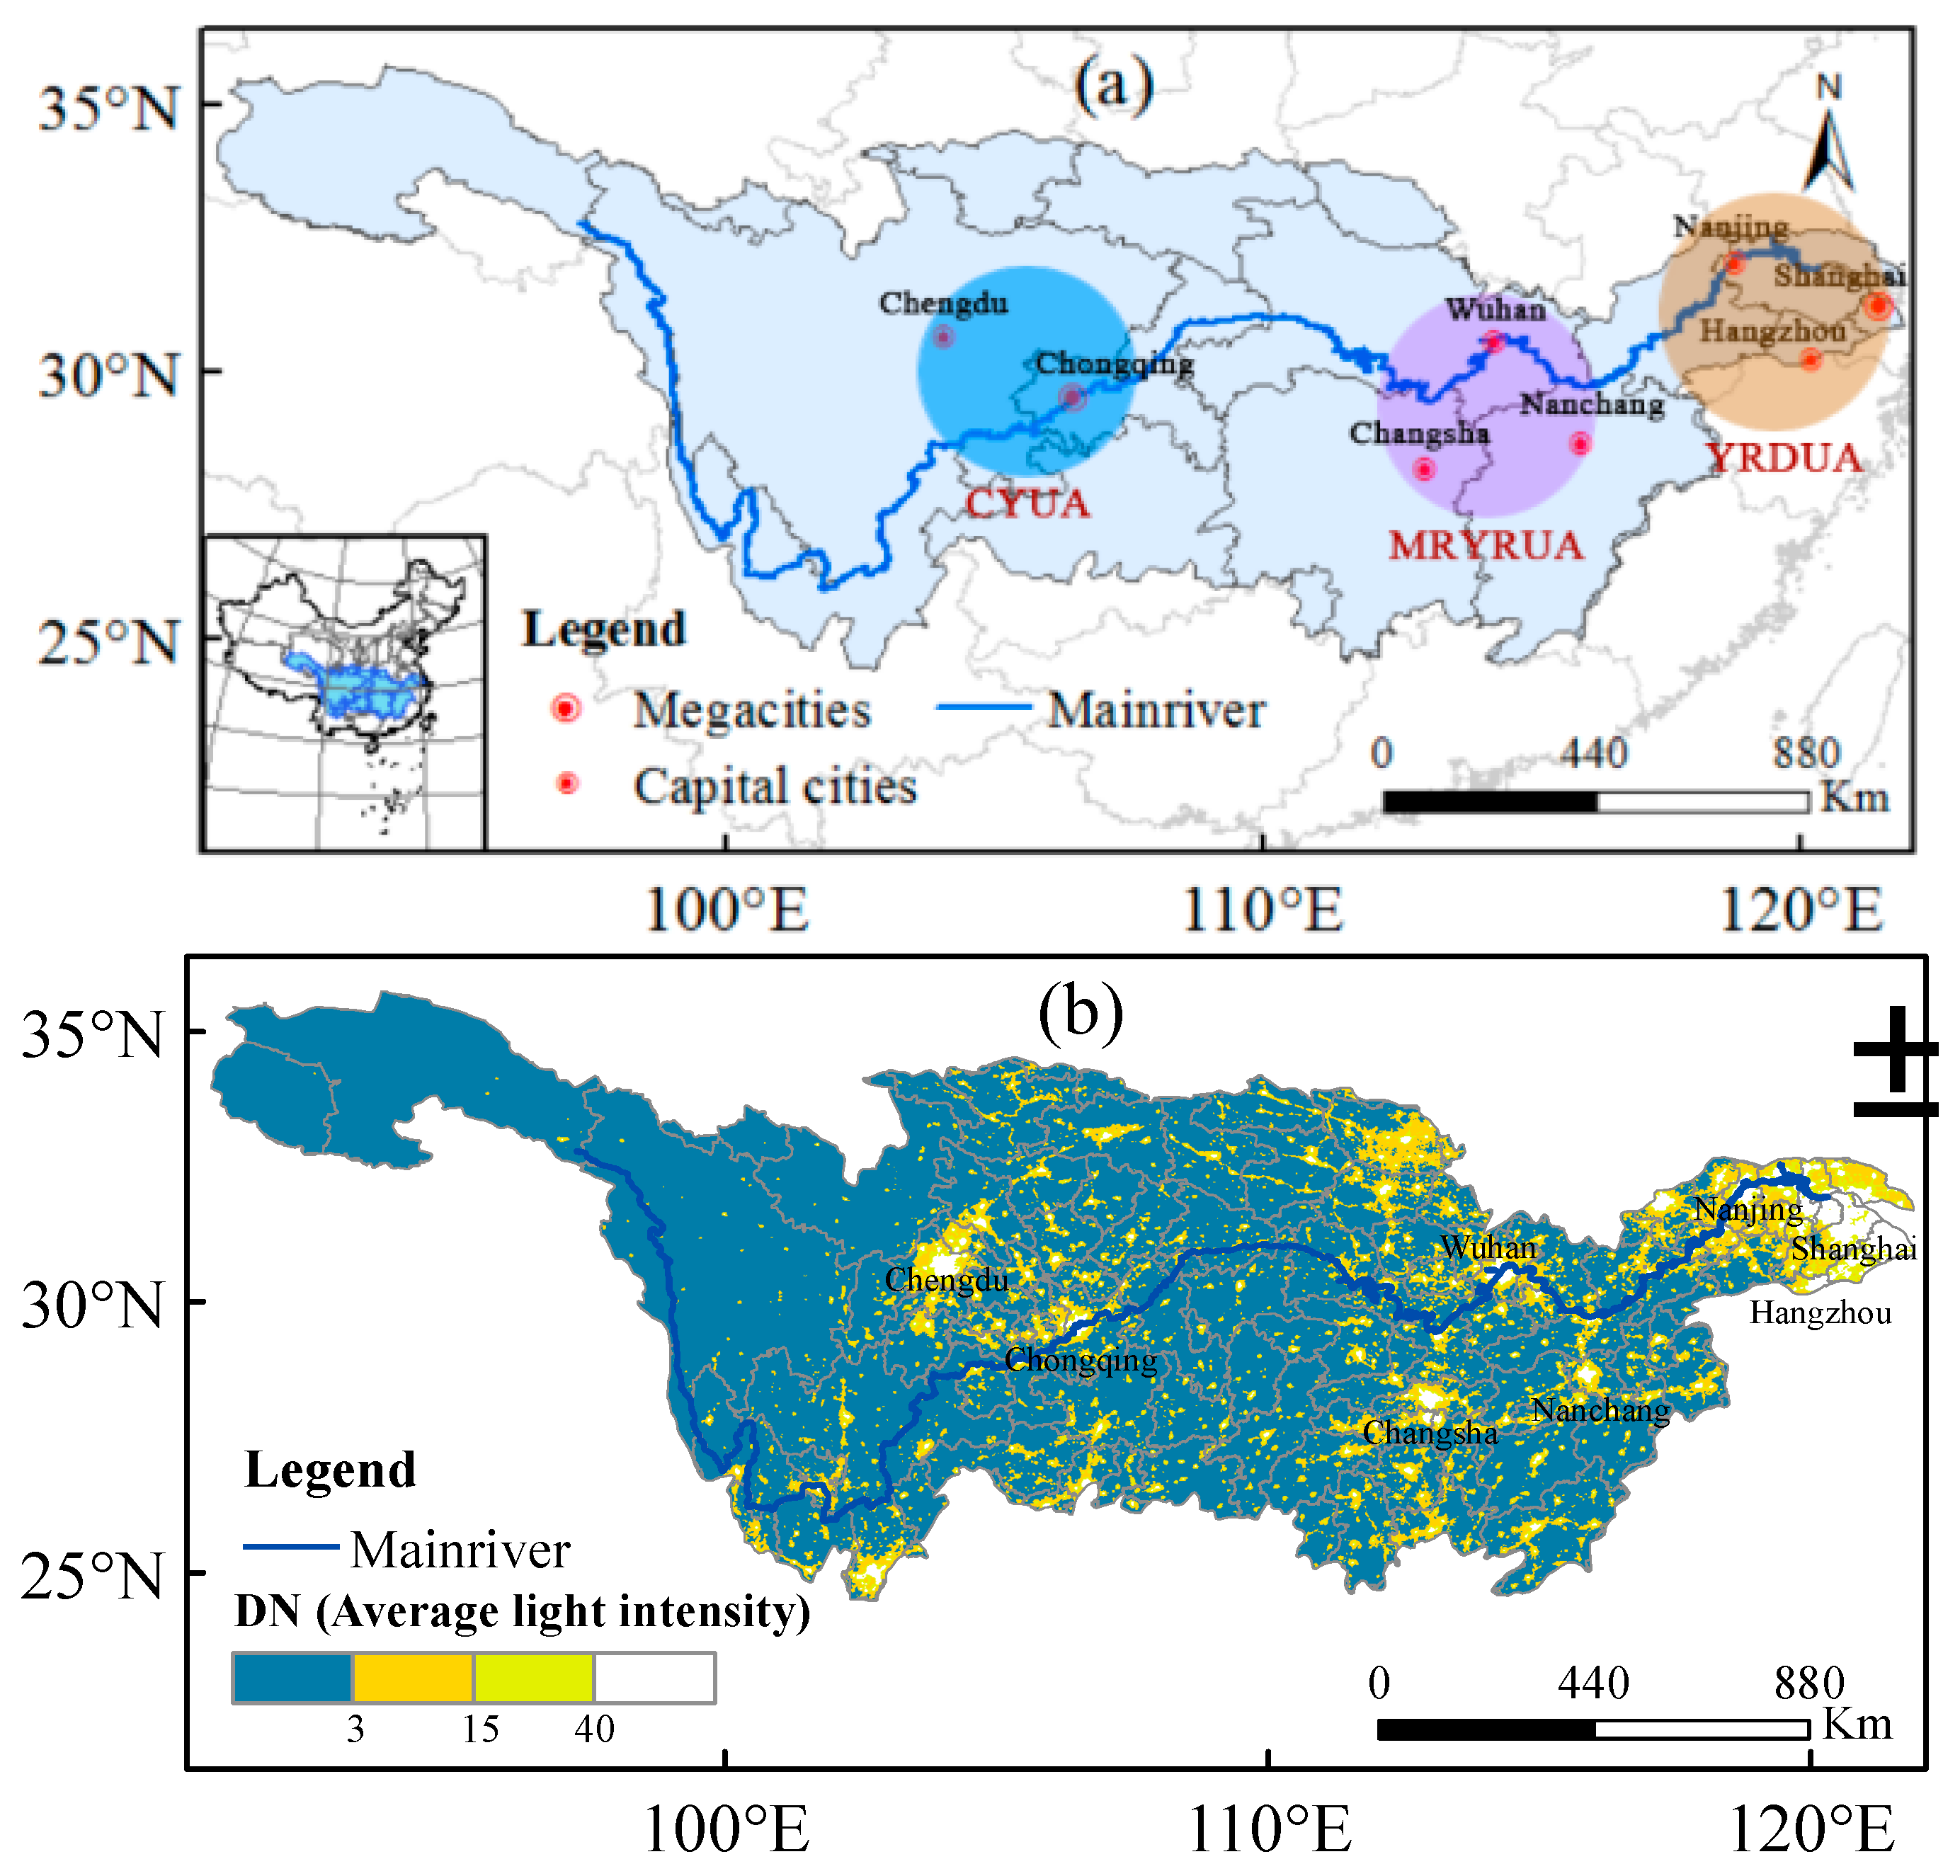
3.2. The Population and Economic Situation of the Yangtze River Basin before the 2050s

The population of the Yangtze River basin in 2010 was shown in Figure 3a. It can be found that the total population of the Yangtze River basin was 441 million, accounting for 33.1% of the national population. The average population density was 245 people/km2. While the future annual average population density in the Yangtze River basin from 2021 to 2050 will be between 240 and 265 people/km2 under different SSPs (Figure 3b–f). Compared with the population in 2010, negative population growth can be found in the CYUA and MYRUA areas under different SSP scenarios (Table 6).
The population of the CYUA areas might decrease obviously for almost all SSPs except SSP3. However, the population of the YRDUA areas will increase at different SSPs. Moreover, it can be found that the population will increase in the mid-lower Yangtze River basin under the SSP2 and SSP3 scenarios. Among them, the largest population decrease will appear in the CYUA areas, with a population decrease of about 5 million compared with 2010 under different SSPs except the SSP3 scenario. Under the SSP5 scenario, more than 70% of the areas in the Yangtze River basin have negative population growth, and some areas have a population decrease of over 200,000.
In 2010, the total GDP of the Yangtze River basin was CNY 12.3 trillion, accounting for 28.9% of China’s GDP. The GDP density was about 6.845 million CNY/km2 in the Yangtze River basin in 2010. The pattern of the GDP distribution is similar to that of the population, and it mainly concentrated in the YRDUA, MYRUA and CYUA. As a whole, the GDP of the Yangtze River basin shows a growth state. The GDP of the three major urban agglomerations continues to grow under different scenarios. The average annual GDP of the three major urban agglomerations in 2021–2050 compared to the increase in 2010 is shown in Table 7.
The annual average GDP density of the Yangtze River basin might increase by 25–30 hundred million CNY/km2 during the period of 2021–2050 (Figure 4b–f). The GDP in most regions of the middle and upper reaches will increase by more than CNY 30 billion during the period 2021–2050 compared with that of 2010. As for the GDP of capital cities such as Chengdu, Wuhan, Changsha, Nanjing and Chongqing, the GDP of these cities will increase by more than CNY 100 billion. While the GDP of the YRDUA will increase faster than the MYRUA and CYUA, for example, Suzhou and Shanghai will increase by CNY 1 trillion more than other cities in the middle and upper Yangtze reaches. Although the GDP growth in Qinghai Province will not exceed CNY 1 billion, the GDP growth rate in the western region of Qinghai Province is relatively higher.

3.3. Population and Economic Trends for 2010–2100

The areal mean population and GDP variabilities of the Yangtze River basin from 2010 to 2100 are shown in Figure 5. The total population of the Yangtze River basin has been rising up to the 2020s, and then falling during the period of 2030–2100 under the SSPs except SSP3. The population of the Yangtze basin will peak around 2022–2026 at 452–559 million under the SSPs except under SSP3. This difference is mainly caused by different fertility assumptions. The SSP3 scenario was different from other scenarios, and the total population in the Yangtze River basin generally shows an increasing trend until 2100, with an increase of 118 million people compared with 2010. By 2050, there might be 78 million people between the SSP3 and SSP5 scenarios, while the population will reach 266 million, 380 million, 559 million, 255 million and 224 million people under the SSP1–SSP5 scenarios in the year of 2100. As can be seen from Figure 5b, the GDP of the Yangtze River basin will keep increasing, and the GDP will be 7.33, 8.94, 6.55, 5.98 and 12.21 times that of 2010 by 2100 under the SSP1–5 scenarios. Since the two-child policy replaced the one-child policy, the population has increased, and to some extent, the problems of aging and labor shortage have been solved, which is one of the reasons for the continued rise in GDP.

3.4. Population and Economic Changes of Three Major Urban Agglomerations in Yangtze River Basin

There are three major urban agglomerations in the Yangtze River basin, namely the YRDUA (the Yangtze River delta), MYRUA (the middle reaches of the Yangtze River) and CYUA (the Chengdu-Chongqing urban agglomerations). Figure 6 shows that the population of the YRDUA will increase before 2050 and then begin to decrease under the different SSPs. As for the MYRUA, the population will increase before 2030 and then decrease except for SSP3 scenario. The population of the MYRUA will keep increasing during the period of 2010–2100 under the SSP3 scenario. However, the population of the CYUA will keep decreasing during the period of 2010–2100 under the different SSP scenarios. The population was 96.65 million, 125.92 million and 146.93 million in the year of 2010 for the CYUA, MYRUA and YRDUA, respectively. The population of the YRDUA will increase by 6–14 million in 2030 compared with that of 2010 under the different SSP scenarios, and it will increase by 1–11 million for the MYRUA areas from the year of 2010 to 2030. The population of CYUA will decrease 2–6 million from the year of 2010 to 2030 under the different SSP scenarios except for SSP3 scenario. The population of the YRDUA will keep increasing until 2050, while the other two urban agglomerations will decrease after the year of 2030 in different SSP scenarios. The largest population amount of the YRDUA will reach its peak in 2050 under the SSP5 scenario, with 20 million more than in 2010.
There are only two scenarios in which the future population will increase by 2100, for example, the population of the YRDUA under the SSP5 scenario will increase by 0.2 million and it will increase by 53.4 million for the MYRUA under the SSP3 scenario compared with 2010. For example, the population of YRDUA under the SSP1 and SSP4 scenarios will decrease by more than 35 million. The population of CYUA and MYRUA will decrease by more than 50 million under the SSP1, SSP4 and SSP5 scenarios. In 2010, the GDP was CNY 7.49, 3.07 and 2.15 trillion for the YRDUA, MYRUA and CYUA areas in the Yangtze River basin, respectively. Figure 6b shows in all scenarios, the GDP of the three urban agglomerations will keep increasing in the future (Figure 6b). The GDP under the SSP1 scenario will be the highest for the three urban agglomerations in 2030. The GDP of the YRDUA in 2030 will increase by CNY 22 trillion compared with that of 2010 and it will increase by CNY 6–7 trillion for the CYUA and the MYRUA areas, respectively. In the year of 2100, the GDP of the YRDUA will be the largest with CNY 120 trillion under the SSP5 scenario. However, the GDP of MYRUA under the SSP4 scenario will be higher than that of SSP2 scenario while the GDP of the YRDUA under the SSP4 scenario will be lower than that of SSP2 scenario. The reason for this phenomenon may be that the SSP4 scenario is mainly to adapt to the challenges, and the inherent unbalanced development hinders the development of some regions. In the YRDUA, due to policy and regional advantages, the GDP has great advantages in different years and different scenarios. It can be seen that income convergence is a rather slow process. Because by 2050, the GDP of CYUA will be lower than that of the MYRUA, especially far lower than that of the YRDUA. The GDP under the SSP2 scenario will be 7.2 times (CNY 15.45 trillion), 9 times (CNY 27.66 trillion) and 10.5 times (CNY 78.63 trillion) larger in 2100 than it was in 2010 for the CYUA, MYRUA and YRDUA, respectively. The difference between the CYUA and the MYRUA is gradually narrowing, but the gap with the YRDUA still exists. In particular, the difference between the YRDUA and other urban agglomeration under the SSP5 scenario is also large.
Figure 7 shows the population growth rate of the three major urban agglomerations in the Yangtze River basin from 2020 to 2100. The population growth rate of the three urban agglomerations in the future shows a declining trend, except for the MYRUA under the SSP3 scenario. Although the population growth rate of the CYUA shows a declining trend from 2010 to 2025 under the SSP3 scenario, the population under the other scenarios will decrease from the year of 2020. In the MYRUA, there will be a negative population growth after the 2020s under the scenarios other than SSP3 scenario. While the population in the MYRUA has been growing under the SPP3 scenario, under the SSP5 scenario, the population of the YRDUA began to show negative growth in 2053, while under the other scenarios, the population will decrease after the 2030s.
The population growth rate for CYUA will be around −20‰ under the SSP1 and SSP4 scenarios by the year 2100. The negative population growth rate of SSP2 scenario will slow down after the 2060s, and the population growth rate will be −9.63‰ in 2100. Under the SSP5 scenario, the population growth rate of CYUA will drop almost in a straight line. By 2050, the population growth rate will be −12.28‰ and it will drop to −35.09‰ by 2100. The population reduction rate is relatively fast. The population growth rate of CYUA will begin to show negative growth in 2025 under the SSP3 scenario, but the decrease is relatively small. After the 2070s, the population growth rate will stabilize at around −1‰.
The highest and lowest population growth rate will appear in the MYRUA under the SSP5 and SSP3 scenarios, respectively. The difference is that from 2020 to 2100, the population growth rate does not show negative growth for the MYRUA under the SSP3 scenario. The population growth rate will be reduced from 6.29‰ (2020) to 1.27‰ (2054) and then begin to keep increasing from 1.27‰ (2054) to 5.51‰ in 2100. After 2075, the population growth rate in MYRUA will decline faster than before 2075 in the scenario of SSP5. The growth rate of the population will grow slowly after the 2090s. the growth rate of population in MYRUA will increase gradually after dropping to −4.27‰ in 2059 under the SSP2 scenario. The population in MYRUA will increase in a small scale in 2100. The population growth rate of shows decreasing trends under different SSP scenarios for the three urban agglomerations during 2010–2100. Moreover, the population growth rate of the CYUA will be obviously negative during 2010–2100, and it will decrease more obviously than other urban agglomerations. The change of population growth rate is relatively complicated in the YRDUA, and the year of negative population growth will be postponed. The population growth rate before the 2080s will be higher under the SSP5 scenario than other scenarios. The highest population growth rate can be found in the 2080s under the SSP3 scenario, and the population growth rate in 2100 will be around −1.15‰. The population growth rate will start to increase after it drops to −6.28‰ in 2059 under the SSP3 scenario. Before the 2050s, the population growth under SSP1 and SSP2 scenarios will not significantly different. After the 2050s, the gap will gradually be widened. The population of SSP1 and SSP2 scenarios will decrease rapidly and the population growth rate will be −4.41‰ and −0.39‰, respectively, by 2100. The population growth rates of SSP4 and SSP2 scenarios are basically the same. The population growth rate will increase after 2085 under each scenario.
The GDP growth rate of the three major urban agglomerations from 2020 to 2010 is shown in Figure 8. The GDP growth rate of different urban agglomerations is also different. As a whole, the GDP shows a declining trend for the whole Yangtze River basin. The GDP growth of the YRDUA stable under different scenarios. The decline of the growth rate in the future is due to the aging of the society (which leads to the decline of the labor force participation rate and a decrease in employment). The GDP growth rate of CYUA is lower than that of the MYRUA during the period of 2020–2100. At the beginning of the 21st century, the growth of the MYRUA fluctuates greatly and will grow slowly under SSP1 and SSP5 scenarios. With the passage of time and the level of total factor productivity getting closer to the level of high-income regions, the GDP growth rate is continuously declining. As a dividing point, the GDP growth rate before 2050 will decline faster than after 2050. Under the SSP1 scenario, the GDP of the CYUA, MYRUA and YRDUA will show negative growth in 2087, 2099 and 2098, respectively. Under the SSP4 scenario, CYUA will show negative growth after 2065, while the MYRUA will show negative growth in 2075–2085.

3.5. Per Capita GDP in Yangtze River Basin from 2010 to 2100

The forecast results of per capita GDP in the Yangtze River basin from 2010 to 2100 can be seen in Figure 9. The per capita GDP shows a continuous growth trend under different paths. Under SSP2 and SSP4 scenarios, the peak value will be CNY 289,400 and CNY 288,800, respectively in 2100, an increase of 10.31–10.36 times compared with 2010. The growth trend is obvious under SSP1 and SSP5 scenarios, but the growth rate of SSP1 scenario slows down from 2050 to 2080, while the growth rate of the SSP5 scenario keeps a fast growth rate. In 2100, the per capita GDP will be CNY 672,200, which is 24.07 times that of 2010. Although the per capita GDP under the SSP3 scenario shows an upward trend, the growth rate will slow down after 2040, and the per capita GDP increasing slightly, almost unchanged. The per capita GDP will be CNY 144,100 in 2100, an increase of 5.16 times over 2010. In conclusion, the difference in per capita GDP under different SSP scenarios before 2030 is not significant, and the difference gradually appears after 2050. The difference between SSP2 and SSP4 scenarios is not significant. By 2100, the difference between the largest SSP5 scenario and the smallest SSP3 scenario will be CNY 528,100 or more (Figure 9a).
According to the per capita GDP growth rate (Figure 9b), under the SSP1-SSP5 scenarios, the average annual growth rate of per capita GDP was about 9% from 2011 to 2018 in the Yangtze River basin. The per capita GDP will still maintain a growth rate of around 6–9% before 2020 under the SSP1–5 scenarios. Under the SSP1 scenario, the average annual growth rate of per GDP capita will slow down to about 5.1% in the 2020s, and it will remain at about 3.0% in the 2030s, and the annual growth rate will be less than 1% in the 2090s. Under the SSP2 scenario, the average annual growth rate of per GDP capita will be about 4.88% in the 2020s, and will maintain at about 2.18% from 2030 to 2049, and slowdown from 2050 to the end of the 21st century, with an average annual growth rate of about 1.35%. Under the SSP3 scenario, the average annual growth rate of per GDP capita will about 4.22% in the 2020s, will maintain at about 1.79% in the 2030s, and will be relatively slow after 2040. Under the SSP4 scenario, the average annual growth rate of per GDP capita will about 5.14% in the 2020s, and it will begin to slow down after 2050, which is basically consistent with the SSP2 scenario. Under the SSP5 scenario, the annual growth rate is still around 6.7% before 2025, around 4.94% before 2050, and around 2.56% from 2050 to the end of the 21st century.
The per capita GDP of a region can reflect the economic development level in a region. The following figure shows the spatial distribution of per capita GDP in the Yangtze River basin in 2010 (Figure 10a) and 2021–2050 (Figure 10d–f) compared to changes in per capita GDP in 2010. In 2010, the per capita GDP of the upper, middle and lower reaches of the Yangtze River basin was CNY 21,300, CNY 20,700, and CNY 30,600, respectively. With the economic growth and population decline, by the 2050s, the average per capita GDP of the upper, middle and lower reaches of the Yangtze River basin will increase from 2010.
Under different scenarios (Figure 10d–f), there are differences in the per capita GDP increasing over the Yangtze River basin from 2021 to 2050. With SSP5 and SSP3 scenarios, the fastest and slowest economic development, the difference is obvious. The per capita GDP of the middle and upper reaches of the Yangtze River will increase by about CNY 40,000 to CNY 70,000 compared with 2010, while that in the lower reaches will increase by about CNY 80,000–110,000. The per capita GDP of the upper, middle and lower reaches of the SSP5 scenario is CNY 89,800, CNY 90,800 and CNY 139,200, an increase of CNY 68,500, CNY 70,100 and CNY 108,600 more than 2010, respectively. The per capita GDP of SSP3 scenario is the lowest, which is CNY 69,400, CNY 63,900 and CNY 108,300, respectively, and an increase of CNY 48,100, CNY 43,200 and CNY 77,700 from 2010. The per capita GDP of the Yangtze River basin shows a growth state. As for the per capita GDP of main cities such as Shanghai, Suzhou, Yichang and Haixi Mongolian and Tibetan Autonomous Prefecture in Qinghai Province, these cities will increase by about CNY 300,000–500,000. Under the SSP3 scenario, the per capita GDP of most areas in the Yangtze River basin will increase by CNY 30,000 to 80,000, and it will increase by about CNY 50,000 to 100,000 under other scenarios.
Under different scenarios, the Haixi Mongolian and Tibetan Autonomous Prefecture in Qinghai Province has the largest increase in per capita GDP in the western region of the Yangtze River basin, and its per capita GDP growth is similar to that in the eastern region of the Yangtze River basin. This may be the reason that the per capita GDP growth on the Yangtze River is slightly higher than that on the Yangtze River. This region is the source of the Yangtze River. It is rich in mineral resources and secondary industry occupies a relatively large proportion. In addition, natural and tourism resources are abundant. The tertiary industry is developing rapidly, the economy is developing fast, and the per capita GDP is high.

4. Discussion

This paper considers the impact on the population and economy after the implementation of the two-child policy in China, and the data of the sixth census in 2010. It predicts the population and economic growth in the Yangtze River basin under the shared socioeconomic pathways.
The family planning policy can be said to be one of the most important social experiments in China in the 20th century. China began to implement the family planning policy in 1978. The fertility rate has fallen sharply. The population structure has changed over the decades, and a low population growth rate has gradually appeared. Therefore, China’s population is aging very fast and on a large scale [45,46].
After the implementation of the comprehensive two-child policy in 2016, China’s population has increased in a short period. To a certain extent, it has solved the problems of China’s current population aging, gender imbalance and labor decline. After the comprehensive implementation of the two-child policy, it will have a series of impacts on population size, population structure, economic development and environment [47,48].
The reduction in the working-age population is one of the key factors affecting the economy. The increase in the number of people caused by changes in fertility policies can alleviate the shortage of old motivation and the problem of aging to a certain extent. Although fertility control has been fully relaxed, the actual fertility level is not high because it is also affected by other factors, such as the occupation of the mother, the pressure of raising children, and the lifestyle of the parents [49,50]. The implementation of the two-child policy can alleviate the shortage of old motivation and the problem of aging to a certain extent. Niklas et al. [51] created country-level scenario data consistent with RCPs (urban land use) and SSPs (population) for Africa’s 2000–2100 population projections.
The Yangtze River Economic Belt covers half of China, showing obvious characteristics of industrialization, but also showing typical gradient differences and unbalanced development in the east, central and western regions [30]. The Yangtze River Economic Belt emphasizes the path of green development and ecological priority. President Xi Jin-ping held a symposium in Chongqing, emphasizing the need to place the restoration of the Yangtze River ecological environment in a prominent position, focusing on protection rather than large-scale development. In the process of planning and construction, its important ecological status has been constantly emphasized since 5 January 2016. At present, the environmental bearing capacity is close to the limit, the Yangtze River basin and even the whole country are under tremendous pressure. Some researchers have compared the distribution of major lakes in the middle reaches of the Yangtze River 50 years ago by using land use data and remote sensing data. It was found that the diversity of aquatic organisms has decreased significantly. The main causes of these are habitat degradation, large-scale water conservancy projects and construction of protected areas, etc. [52]. With the economic development and the expansion of the city scale, the demand for water resources is gradually increasing. As a continuous external pressure, the population plays an important role in the change of water resource carrying capacity. GDP is a dynamic factor in the economic system. The impact of changes in water resources carrying capacity is clear. Water resources are relatively stable in the short term relative to population changes. Therefore, population development and rapid economic growth will affect the population carrying capacity of water resources in the short term [53]. It can be seen that the environmental and ecological conditions of the Yangtze River basin have been seriously affected by previous human activities, and the climate change within the basin has affected the hydrological conditions of the Yangtze River mainstream [54]. In this case, the concept of green development is needed, which is the objective judgment for national economic development.
Contrary to population growth, after the two-child policy is fully opened, in addition to SSP1 and SSP4, other paths and GDP are expected to grow. GDP is growing fast—almost in a straight line growth trend, especially in the SSP5 scenario. The SSP3 scenario is increased, no matter the relatively slow growth rate and total amount, and the SSP3 scenario shows greater GDP than SSP4 scenario in the 2090s. The change in population policy has a great impact on the size of the working-age and elderly populations, which further affects the economic development of the region. As part of China’s new round of reform and opening up, the Yangtze River Economic Belt has implemented a new regional opening-up and development strategy, and is also a leading demonstration zone for ecological civilization construction. The Yangtze River Economic Belt should take the lead and take Shanghai as the leader to drive the overall development of the whole basin and realize the green development strategy. However, the green development is still at the theoretical level, and there is still a long way to go in practice [55]. The long-term population and economic forecast in the Yangtze River basin based on the current situation of population and economy, and the understanding of the population and economy of the Yangtze River basin in the 21st century, can provide a scientific basis for the adjustment of urban structure and industry in the Yangtze River basin in the future, as well as the better construction of the green development for the Yangtze River Economic Belt.
Based on the different paths of SSP, this paper analyzed the characteristics of future population and economic development in the Yangtze River basin. Population and economic development are relatively complicated processes. There is great uncertainty in forecasting the regional population and economic levels of the whole century. Although the implementation of China’s current new population policy and the impact of changes in population policy on changes in the number of working people on economic development have been fully taken into account in the forecast process, major external impacts may occur in the future. There is some uncertainty in the population forecast. The population base uses census data, and there are a certain number of underreports and restatements, which will affect the population forecast. At the same time, there is some uncertainty in the parameter setting during the prediction process. Higher education and medical standards, as well as good living habits, will reduce mortality. A key factor in accurately predicting the future population is fertility. However, due to uncertain factors such as education and urbanization, the total fertility rate is often overestimated, which will affect the accuracy of population forecasts [24]. Urbanization affects population growth by reducing fertility in urban areas [44]. Therefore, it is impossible to predict the impact of larger scale changes. Sudden issues such as wars, natural disasters, the discovery of new resources, and the inability of some rapidly developing provinces and cities to predict population competition may affect long-term forecasts and even permanently affect regional population and economic development. At present, in the past century, there are still uncontrollable factors in China’s political development, technological progress and implementation of low-carbon transition. In addition, economic forecasts also ignore terms of trade, purchasing power parity changes, and environmental impacts on the economy. For sudden major diseases, such as the economic loss caused by the COVID-19 in early 2020, it is unavoidable and unpredictable. Therefore, the forecast of population and economy of the Yangtze River basin in this paper is still uncertain and needs further research and improvement. Different national security programmes face different challenges, and the links between economic activity and these challenges are complex [16]. Therefore, it is necessary to carry out regional population and economic future forecast research in the world.

5. Conclusions

Based on the shared socioeconomic pathways, this paper forecasts the population and economy in the Yangtze River basin from 2010 to 2100. The main conclusions drawn from our paper were summarized as follows:
(1)
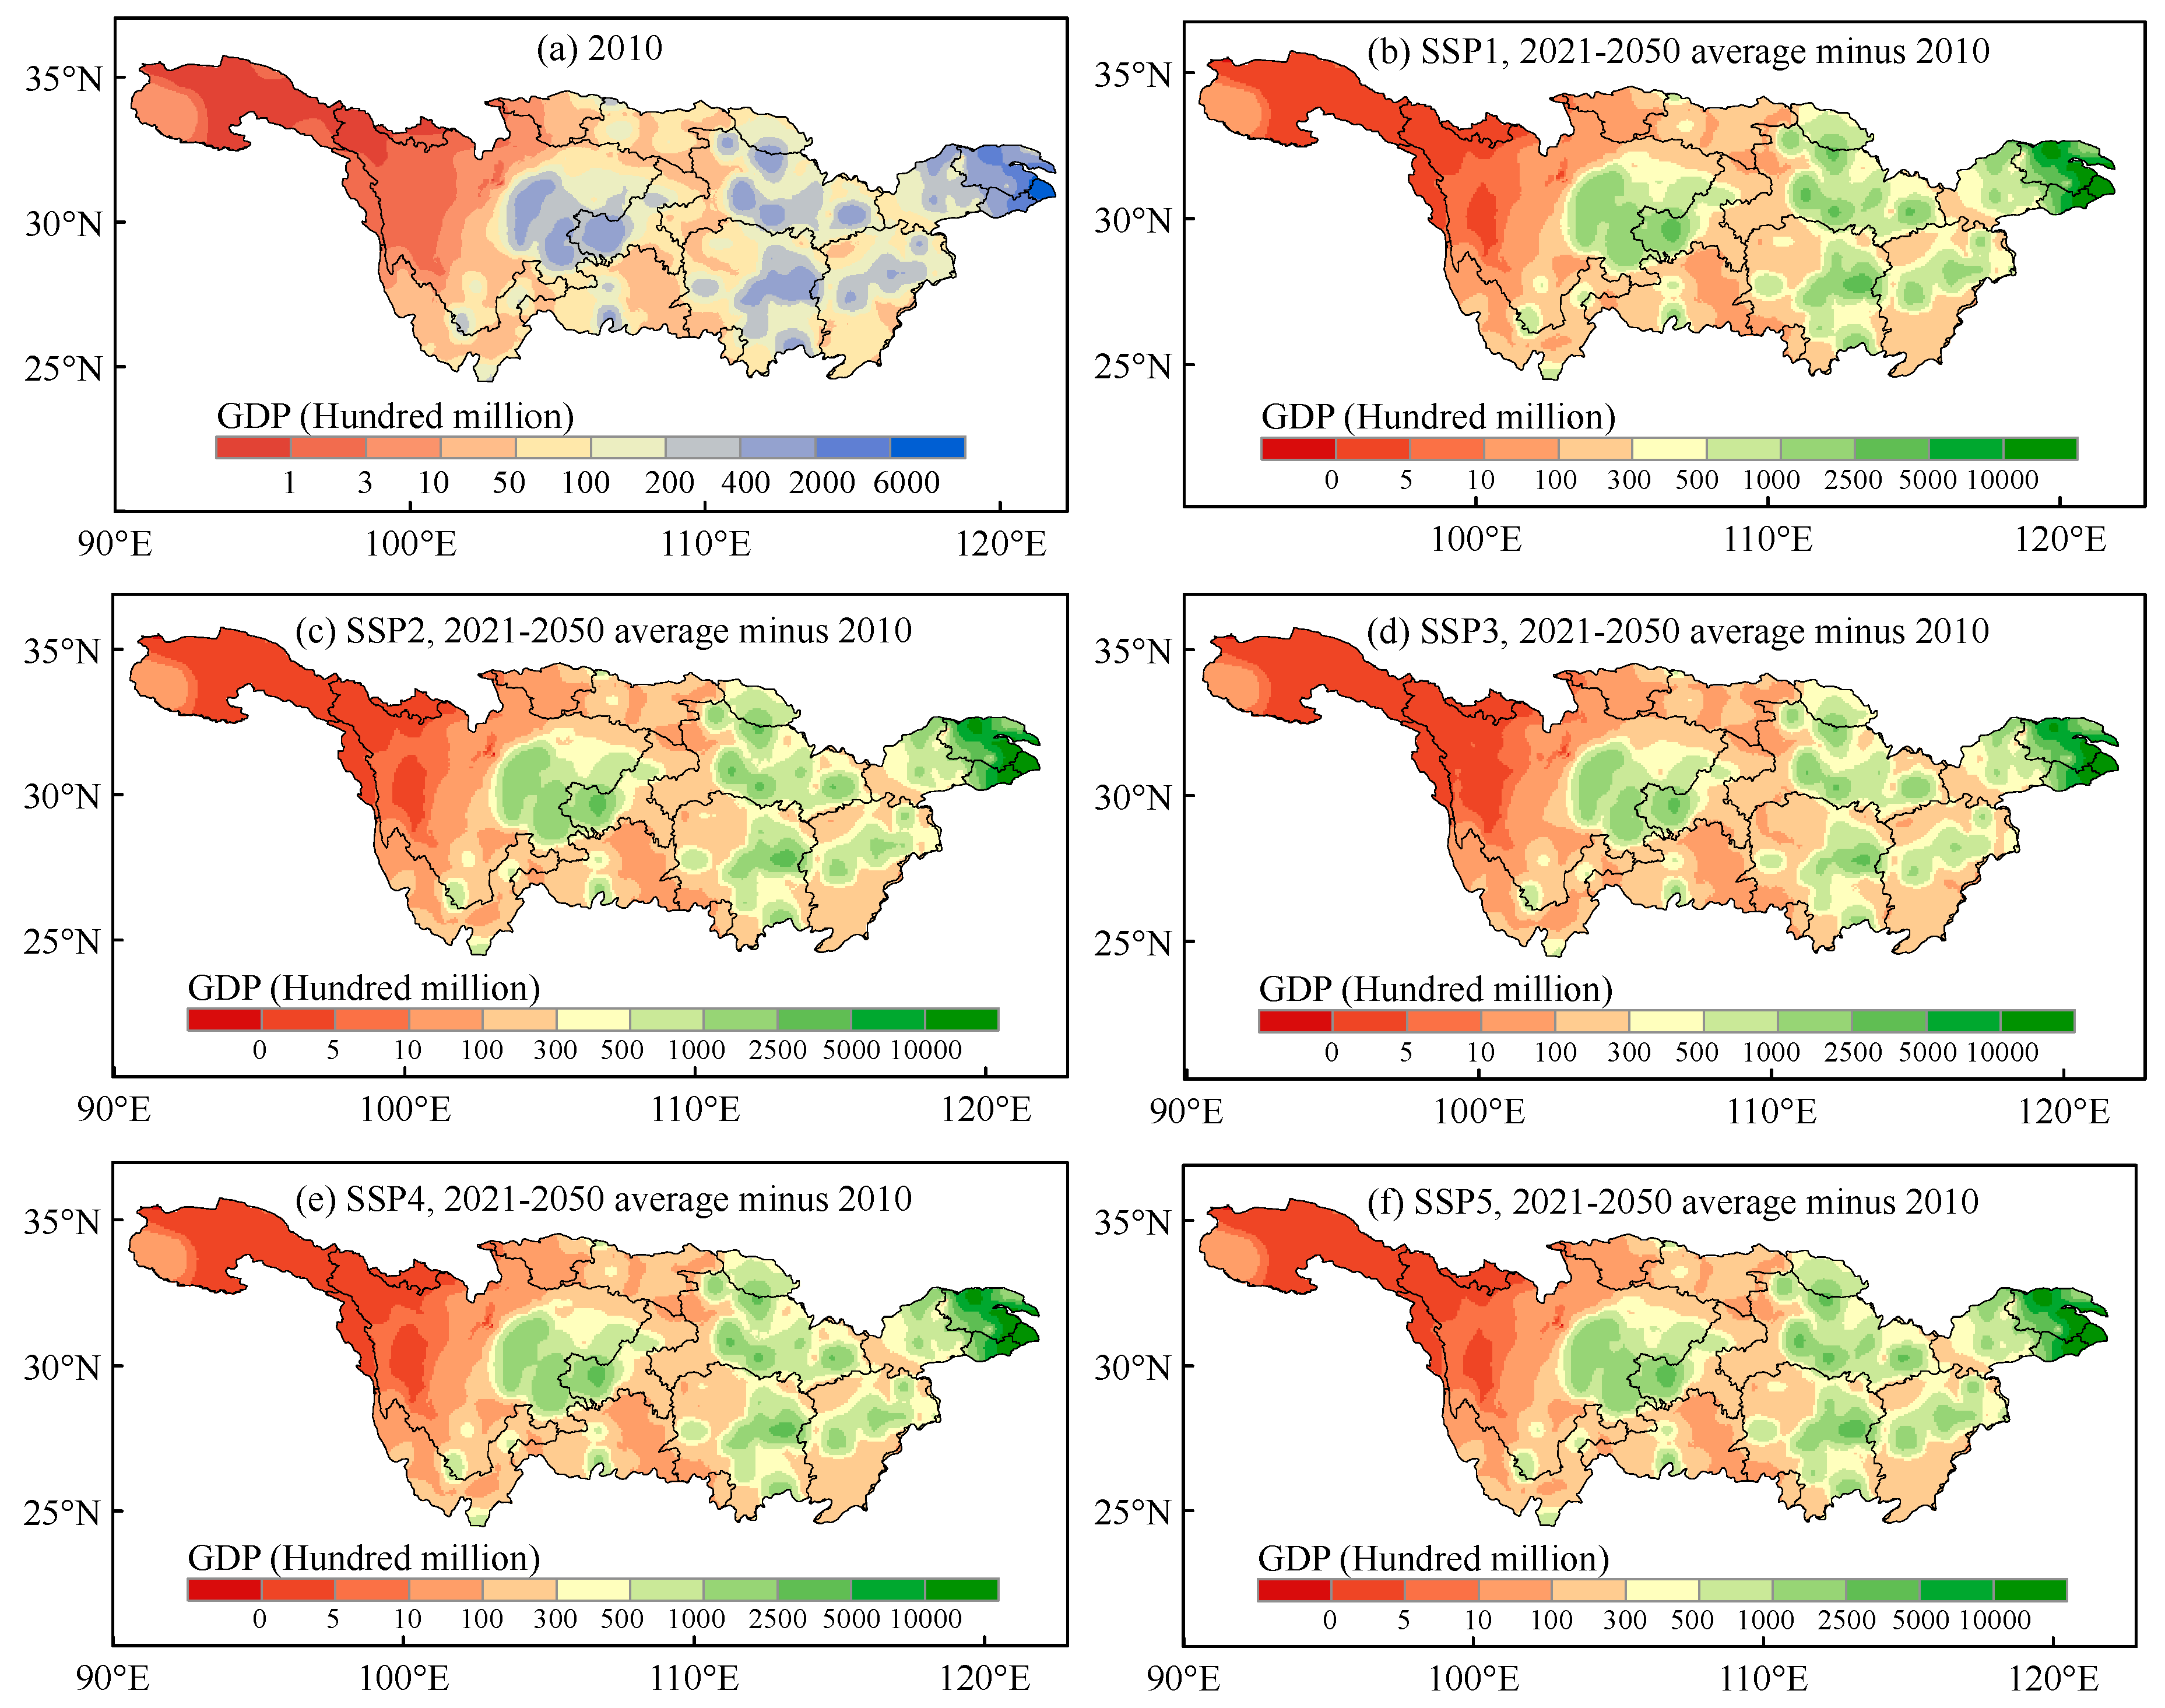
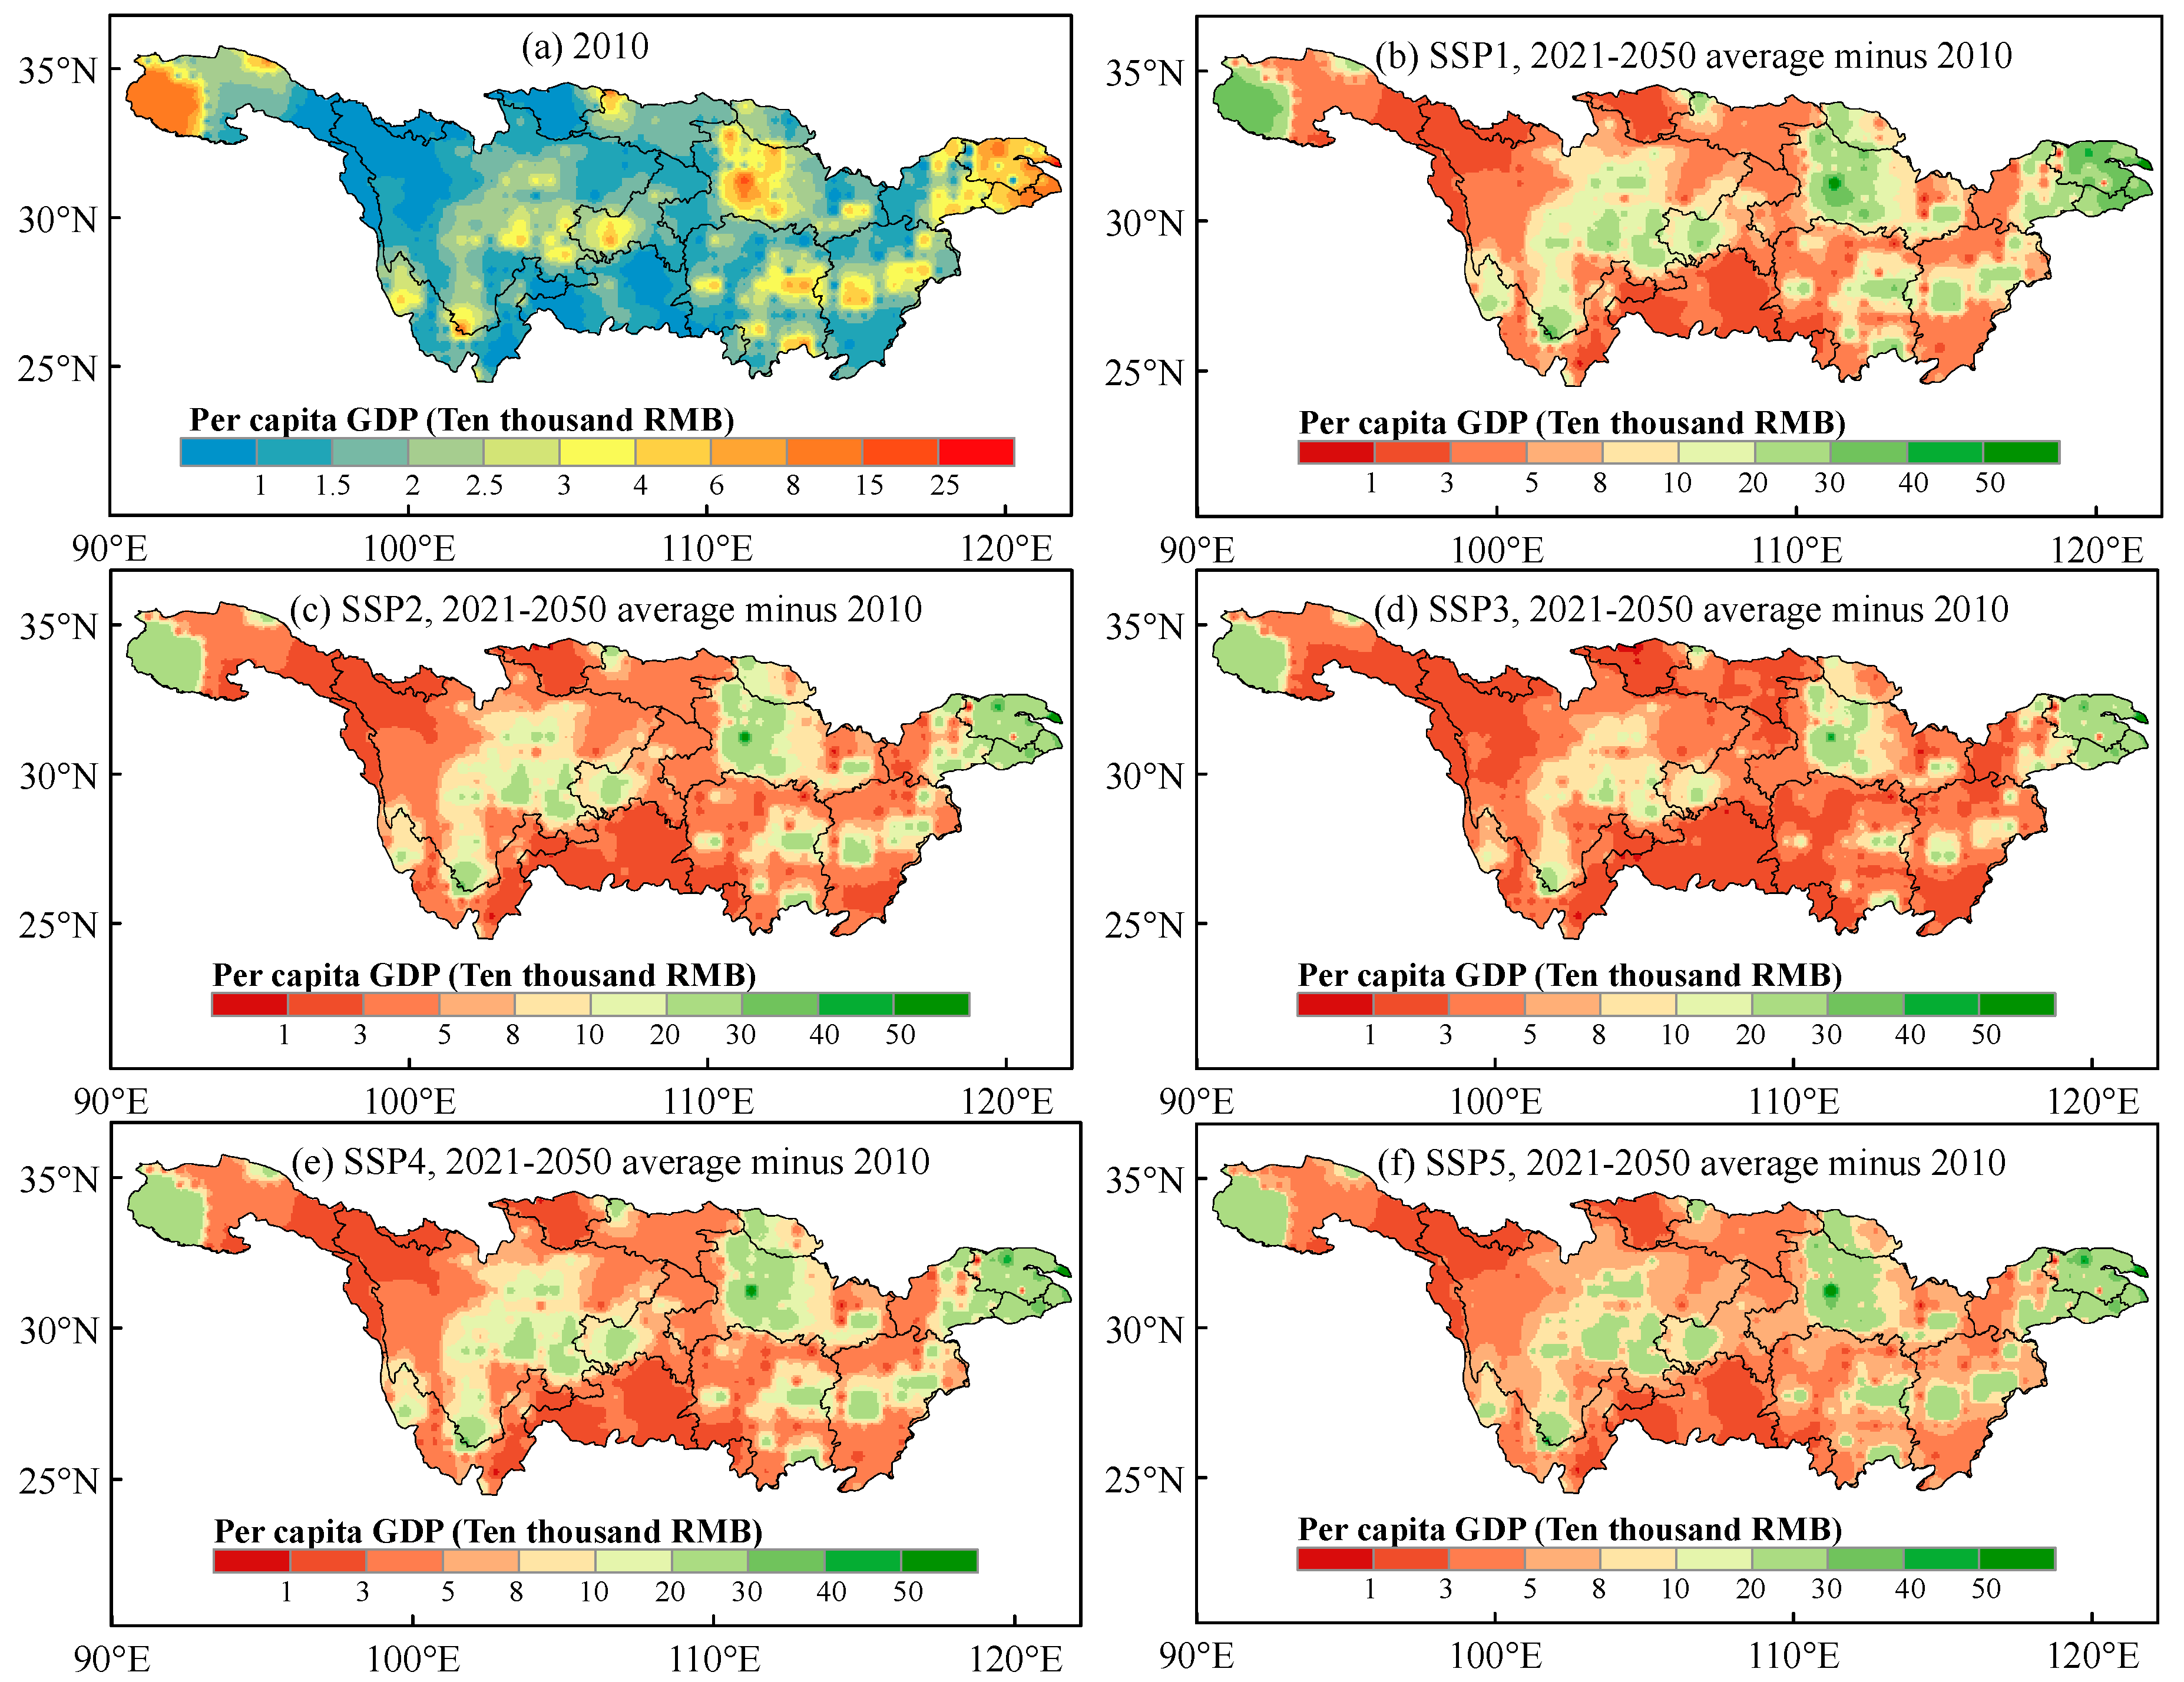
The population of the Yangtze River basin shows a negative growth during the period of 2021–2050. It is mainly concentrated in Sichuan Province, Chongqing City, Hubei Province, Hunan Province and Anhui Province. The Eastern Sichuan Province will see the most significant population decrease, and Shanghai the most significant population increase. The GDP will continue to increase in most of the Yangtze River basin, and it will increase by CNY 30 billion compared to 2010 in most regions.
(2)
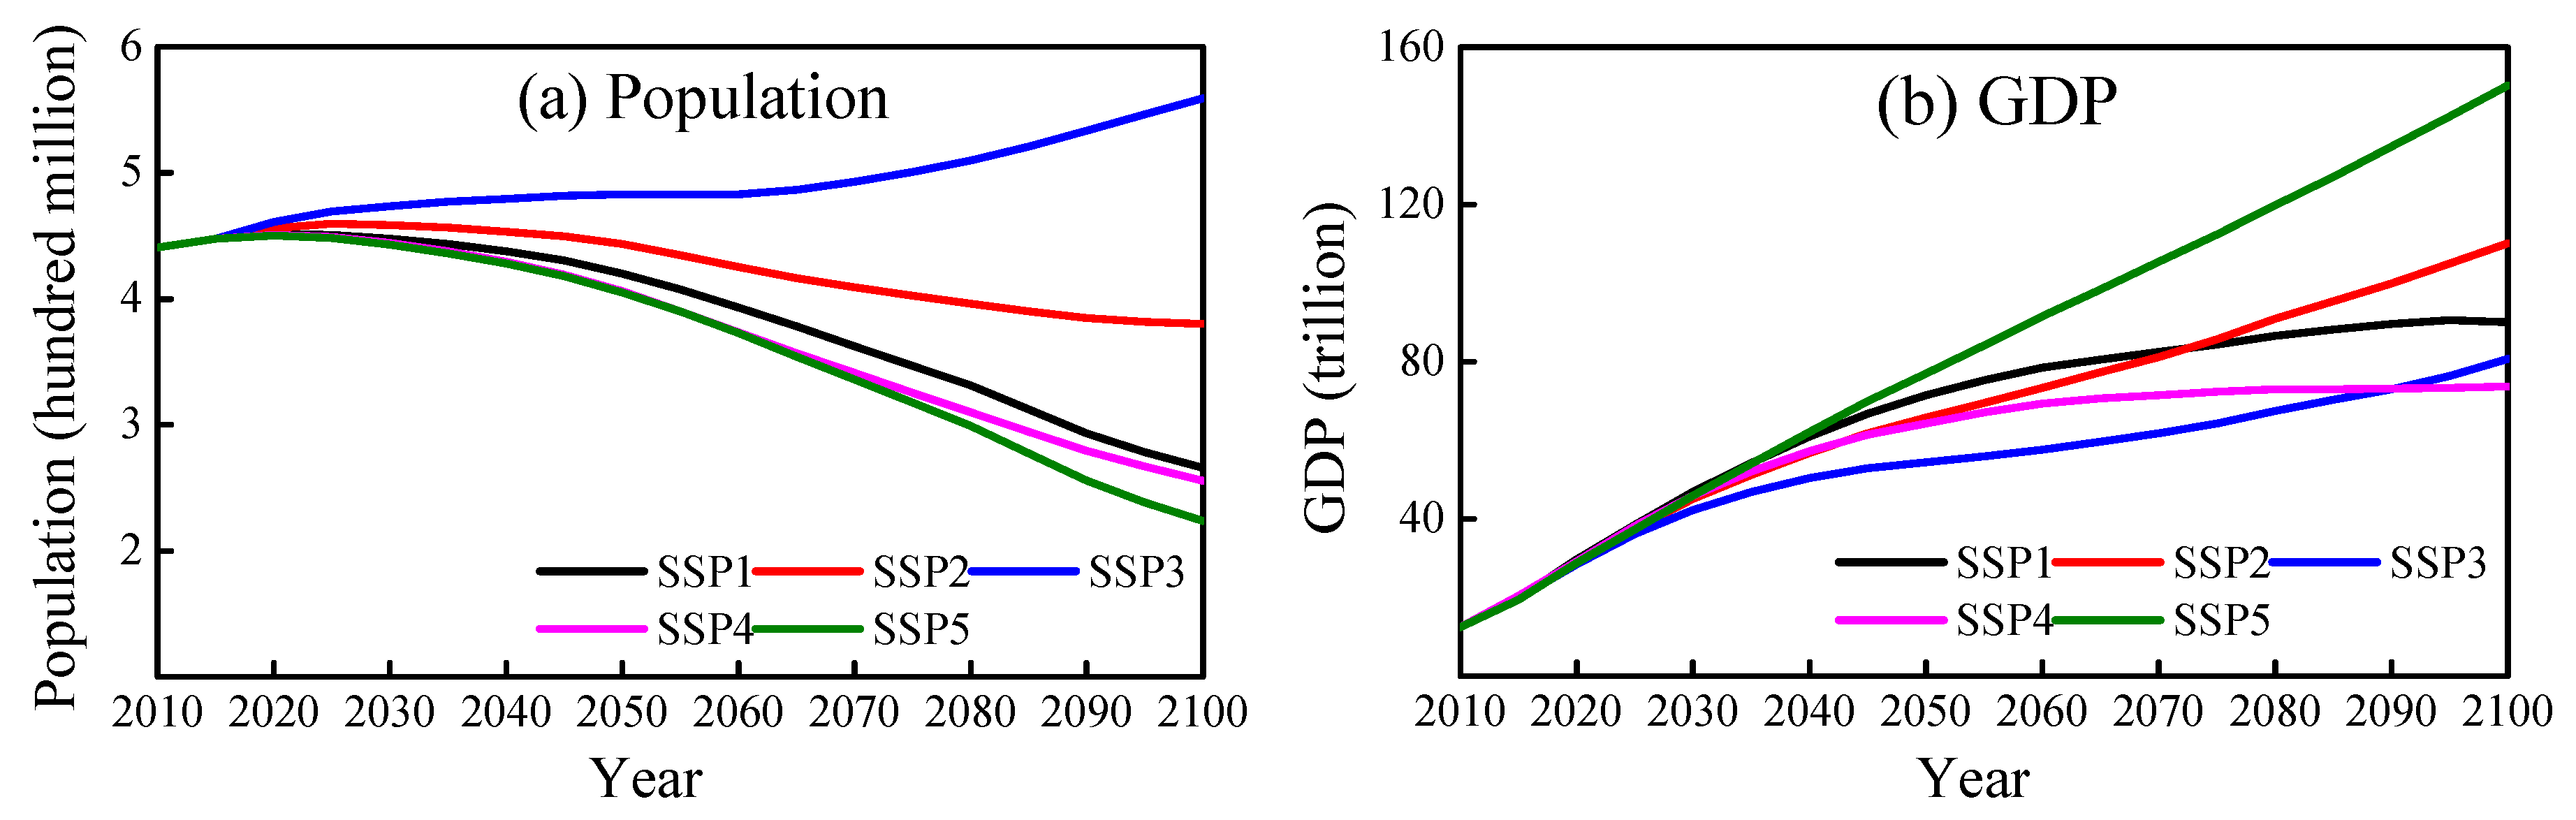
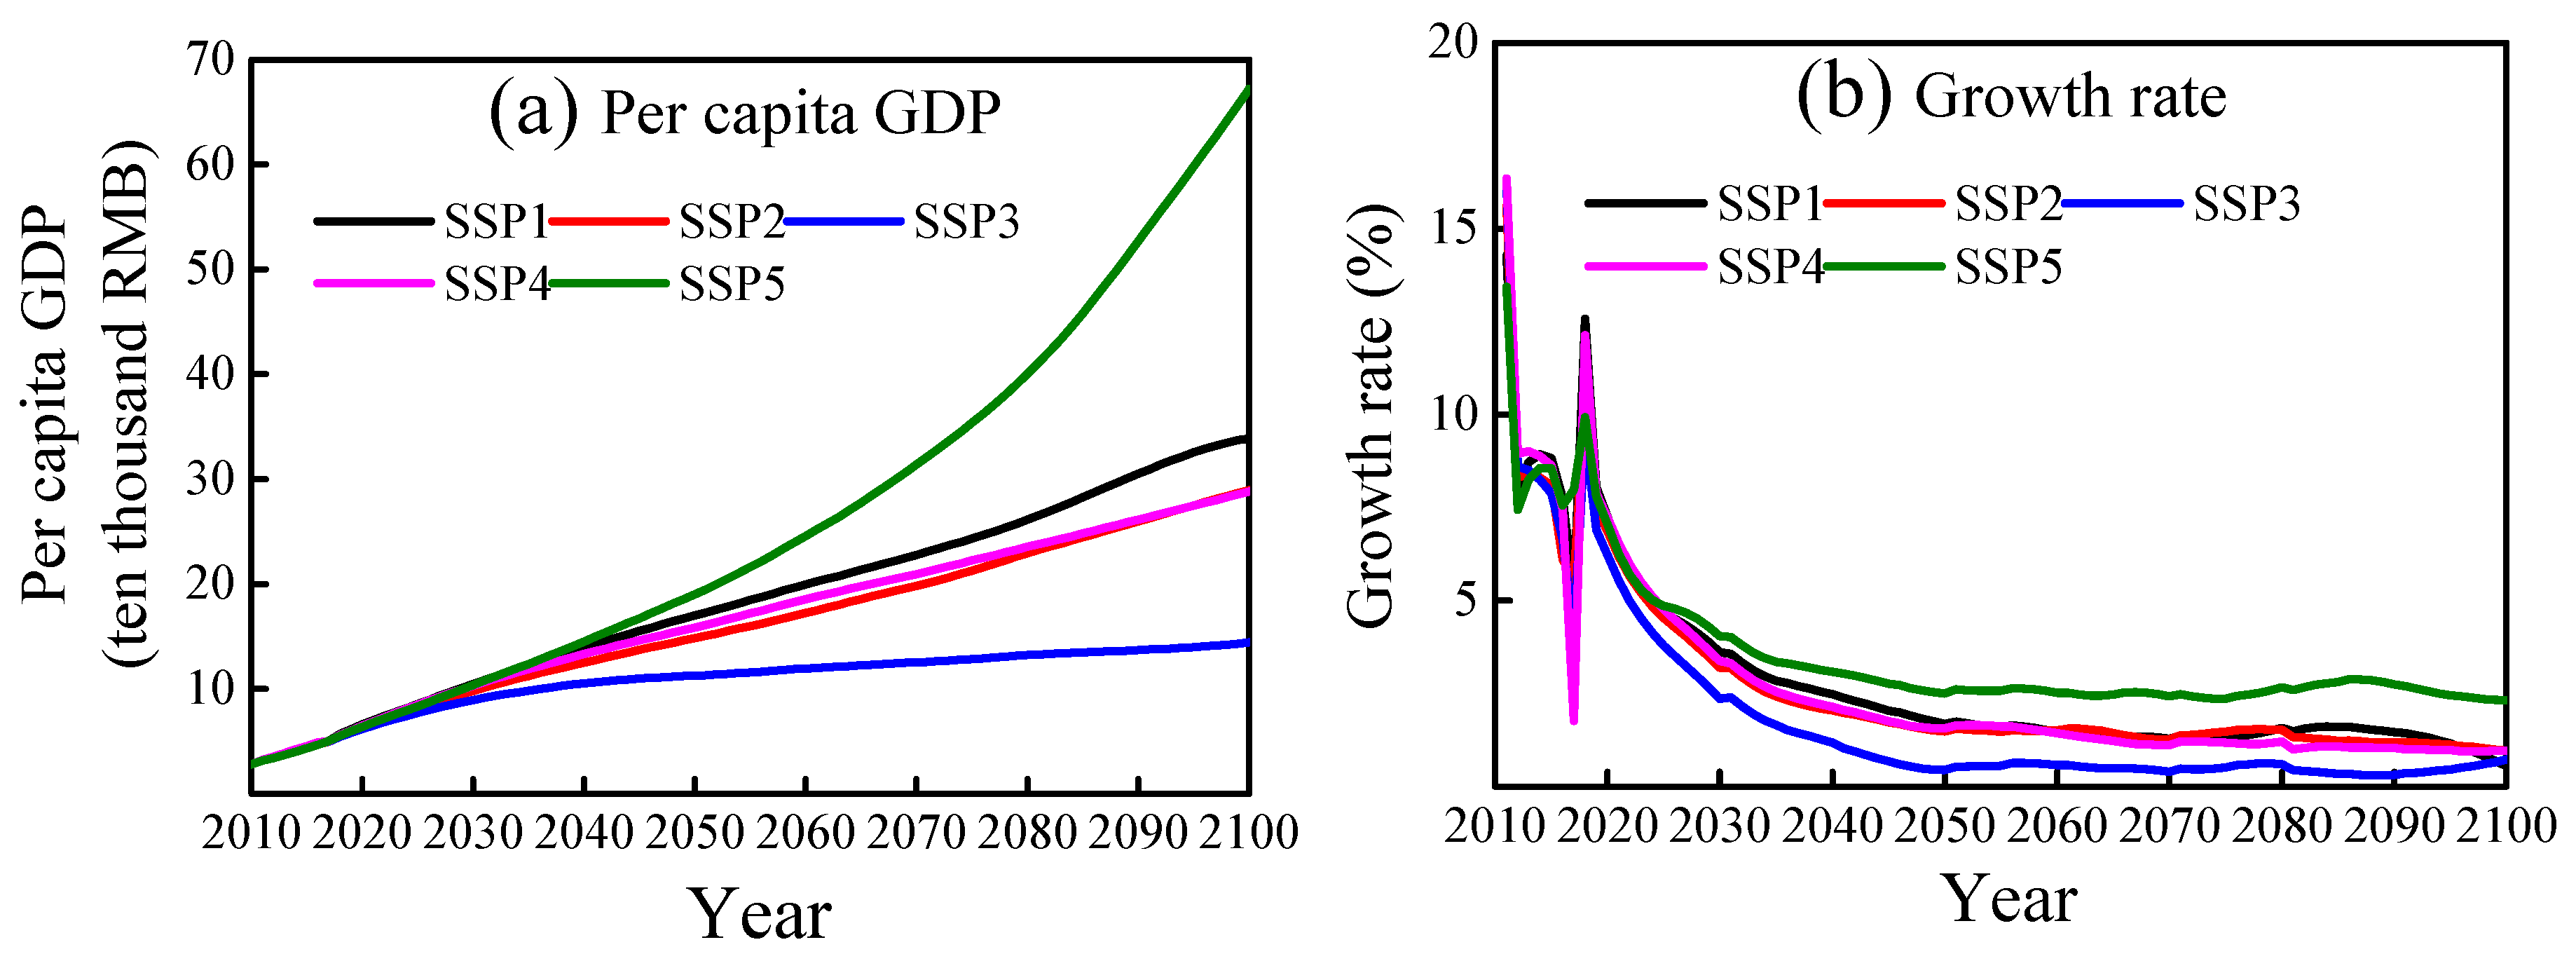
During the period of 2010–2100, the population shows a declining trend except for the SSP3 scenario in the Yangtze River basin. The peak population of each path will be 452 million (2022), 460 million (2026), 559 million (2100), 451 million (2021), and 451 million (2020). By the end of the 21st century, the GDP of different paths in the Yangtze River basin will be 7.33, 8.94, 6.55, 5.98, and 12.21 times in 2010, respectively.
(3)
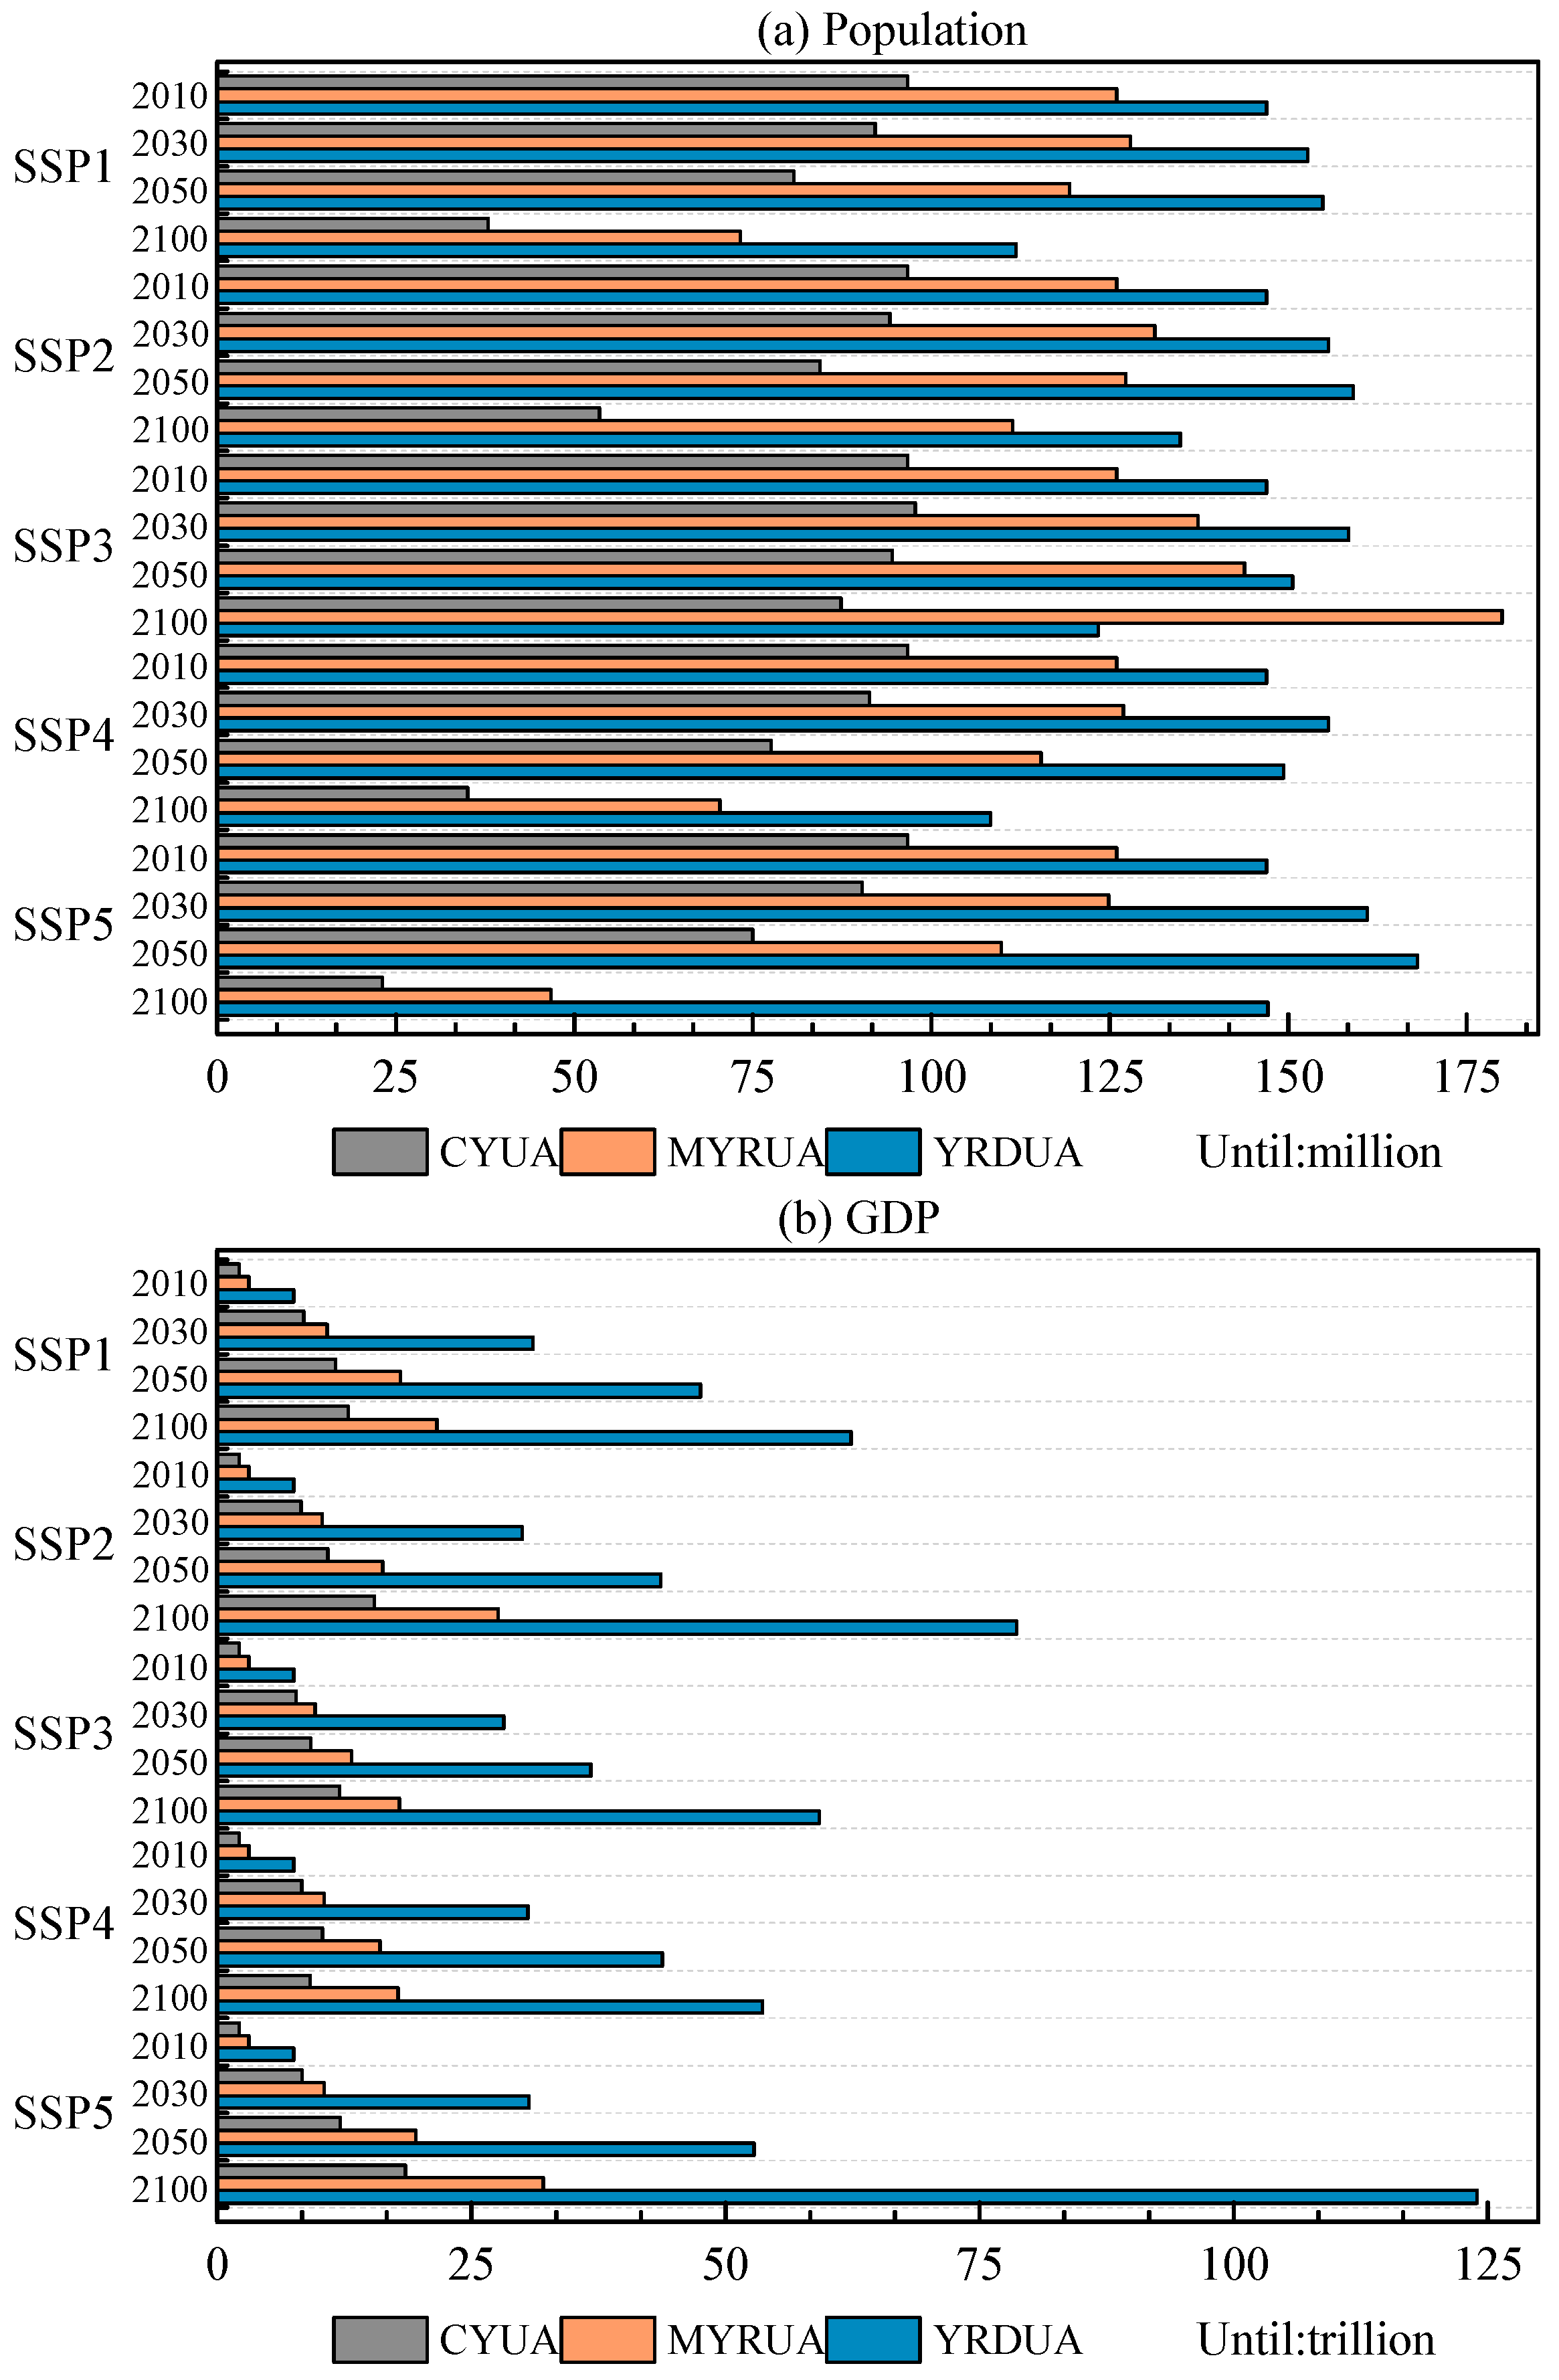
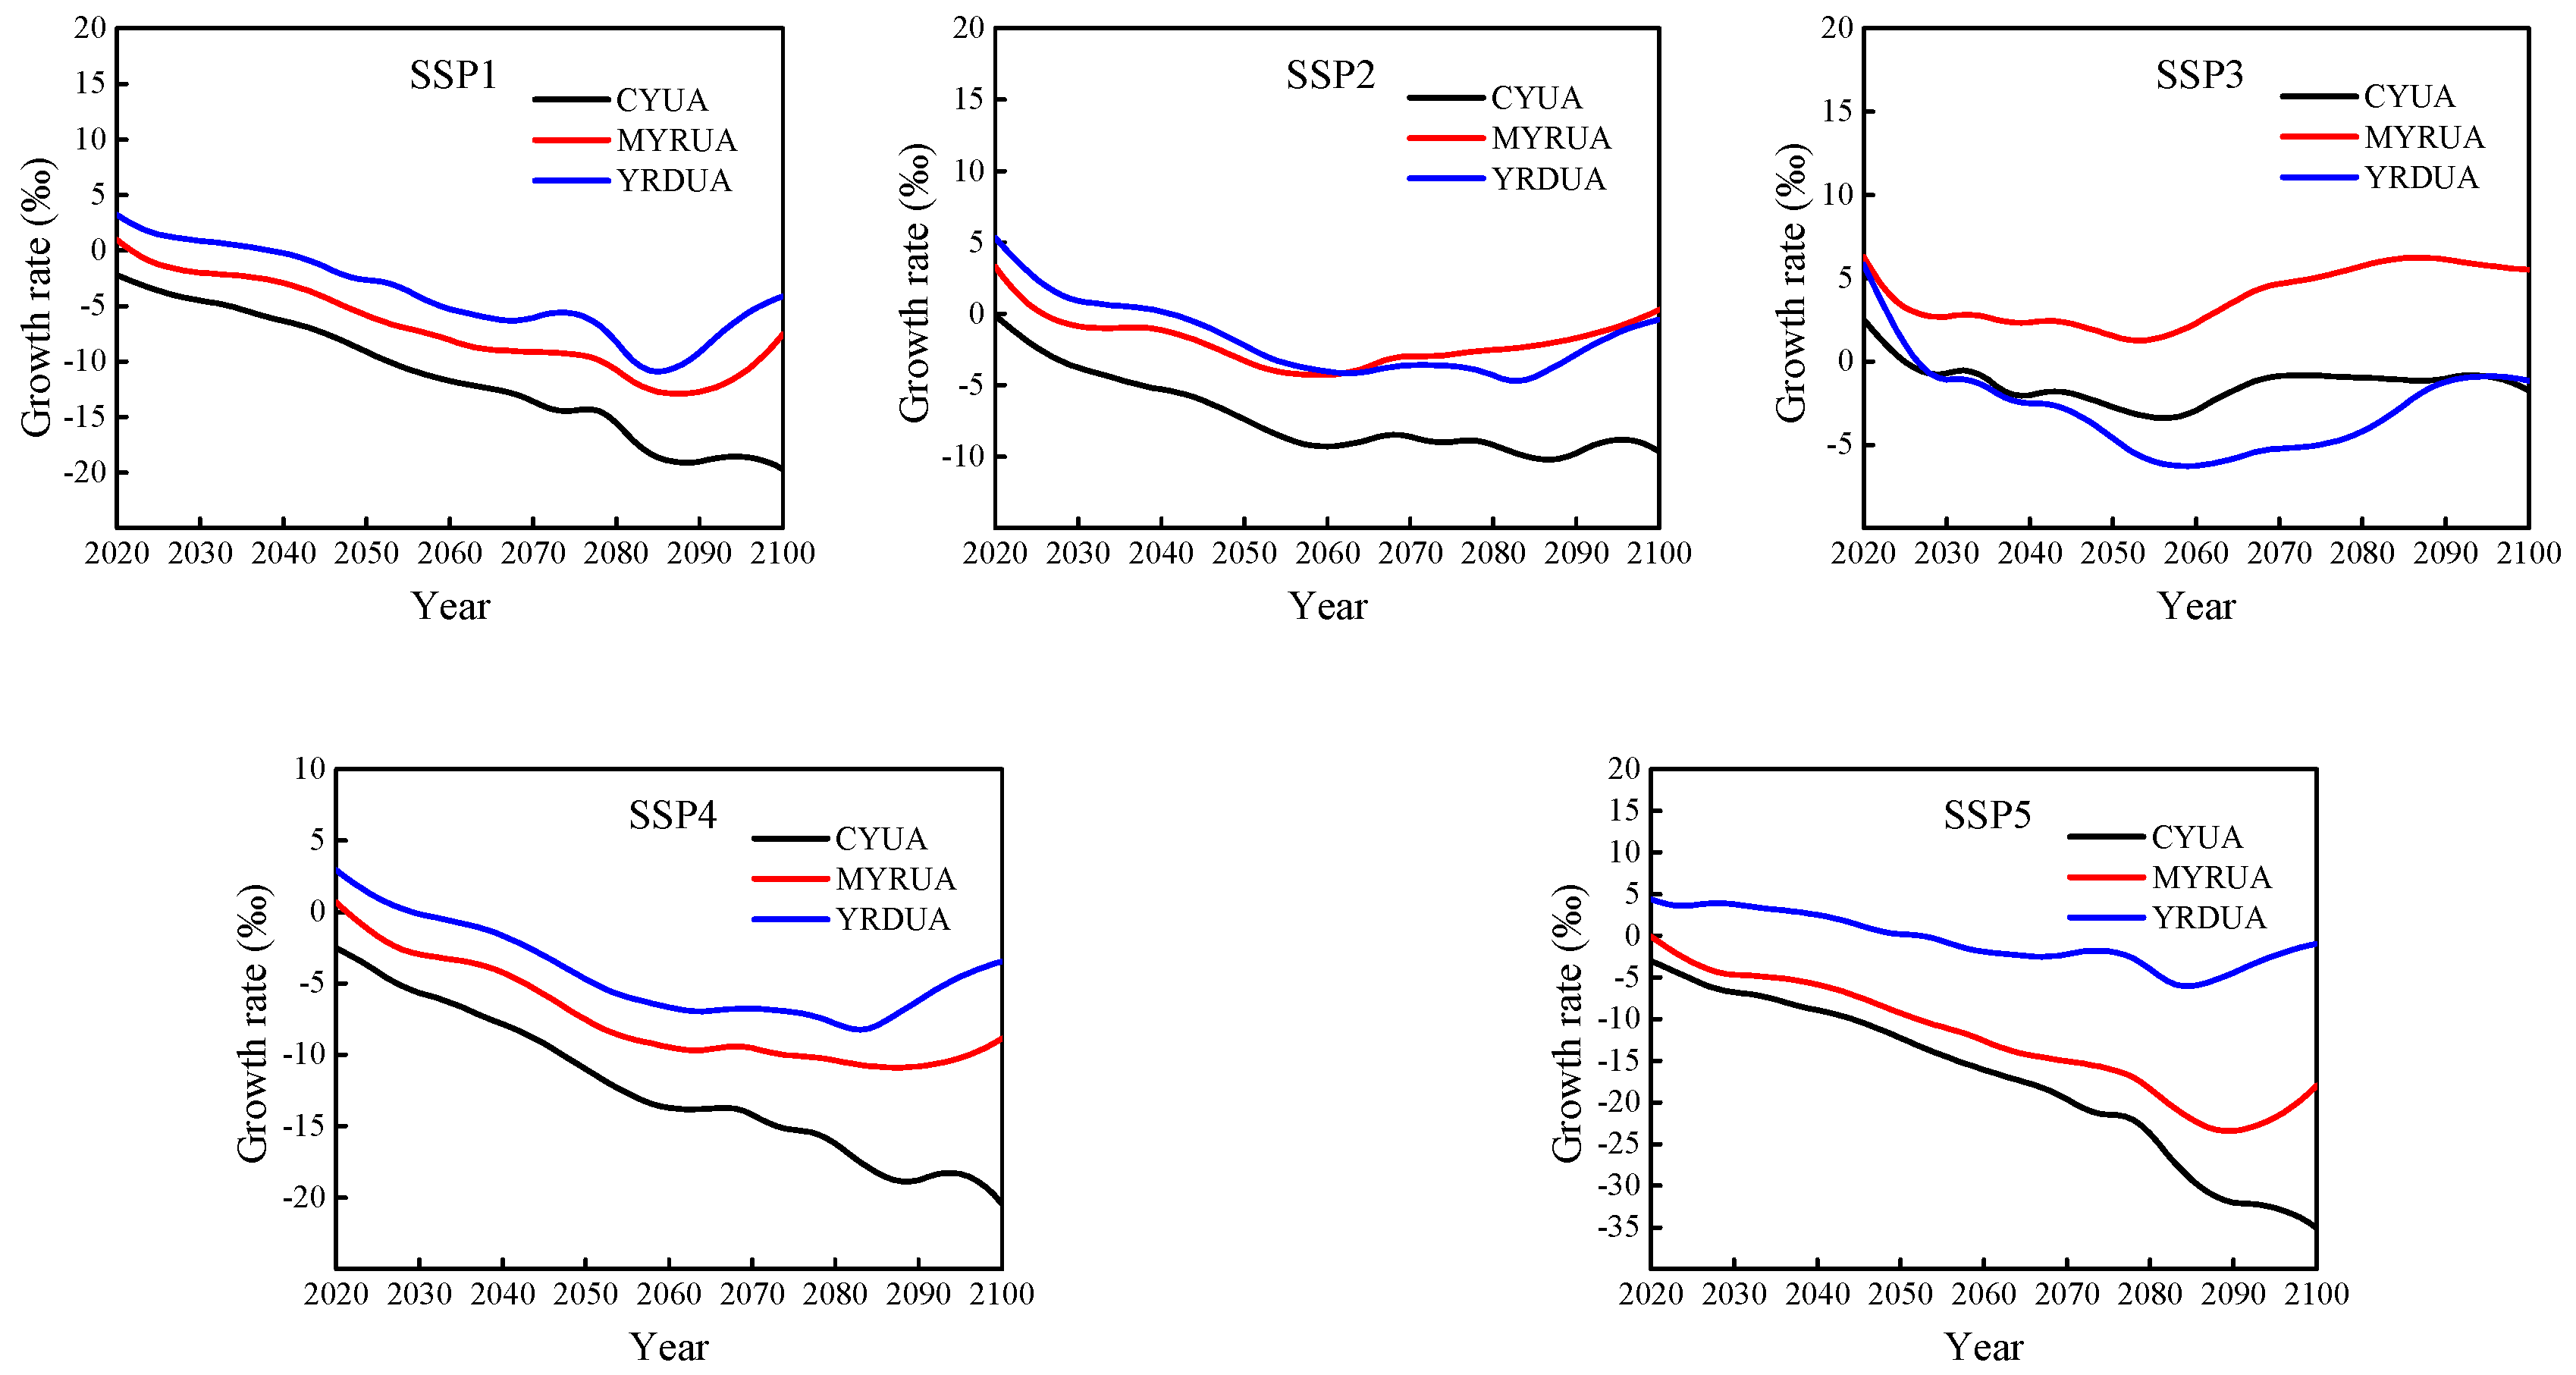
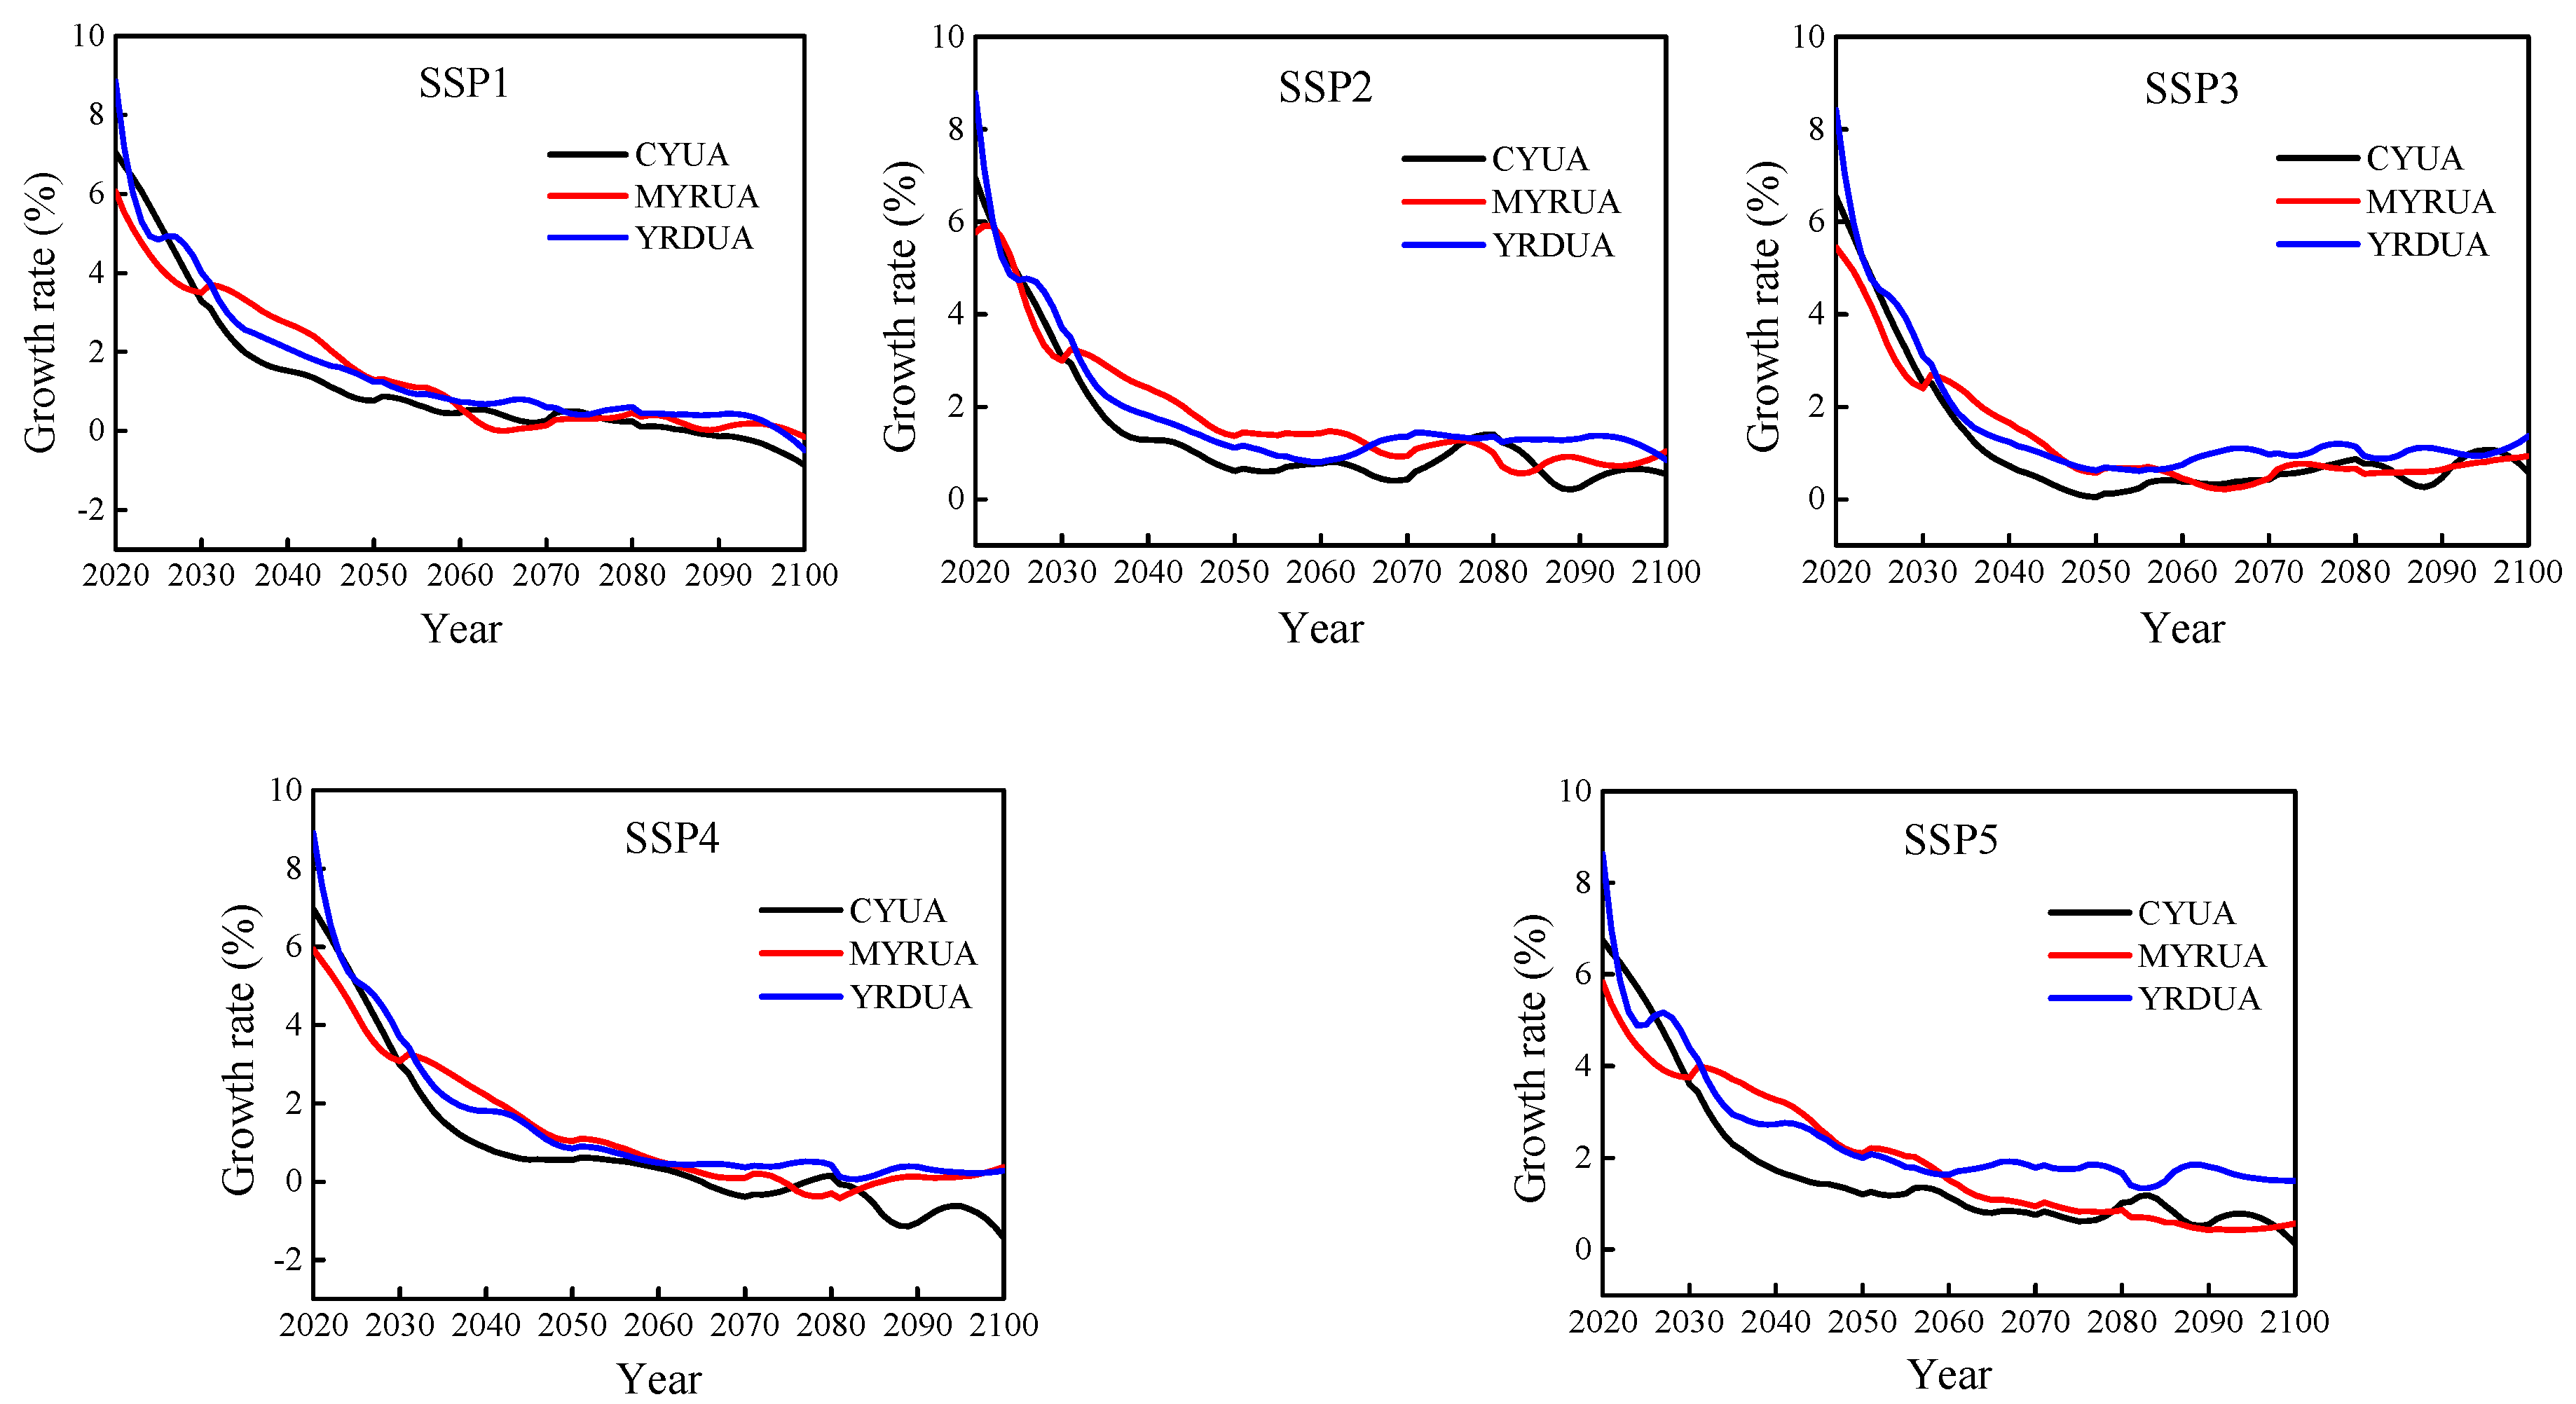
As a whole, the population of the three major urban agglomerations will decrease in the 21st century. The negative population growth rate for the CYUA and MYRUA will appear in 2020, while it will occur in the 2030s–2040s for the YRDUA. However, the GDP growth rate shows a downward trend and the decline rate will gradually slow down after 2050.
(4)
The per capita GDP growth rate shows a downward trend after 2020. The growth rate of per capita GDP will be about 1% under the SSP2, SSP3 and SSP4 scenarios by 2100, and it will be that of about 0.55% and 2.32% under the SSP1 and SSP5 scenarios, respectively. The per capita GDP in the upper-middle reaches of the Yangtze River basin will increase by about CNY 40,000 to 70,000 compared with 2010, while the per capita GDP in the lower reaches will increase by CNY 80,000 to 110,000 during the period of 2021–2050 under different scenarios.
This research provides a reference for the study of future population and socioeconomic changes and climate predictions. It will provide a scientific basis for the adjustment of urban structure and industry in the Yangtze River basin, the better construction of the Yangtze River Economic Belt, and the promotion of green development of the Yangtze River. Meanwhile, it might have some implications for future regional or global population and economic development projections for other areas in the world.

Author Contributions

Z.Z. provided ideas for the paper, T.J. provided data and methods, M.Z., B.Z., F.Z. and R.K. made model predictions and analyzed the data, M.Z. wrote articles, Z.Z. and J.T. revised the language. All authors have read and agreed to the published version of the manuscript.

Funding

This paper is financially supported by National Key Research and Development Project of China (Grant no. 2019YFC0409004) and National Natural Science Foundation of China (Grant no. 41971025) and the Priority Academic Program Development of Jiangsu Higher Education Institutions (PAPD).

Acknowledgments

We would like to thank Yanjun Wang of Nanjing University of Information Sciences & Technology for providing the calculation method of PDE model and Cobb–Douglas model. We want to thank the editor and reviewers for their valuable advices and suggestions that helped us improve this manuscript.

Conflicts of Interest

The authors declare no conflict of interest.

References

  1. Moss, R.H.; Edmonds, J.A.; Hibbard, K.A.; Manning, M.R.; Rose, S.K.; van Vuuren, D.P.; Carter, T.R.; Emori, S.; Kainuma, M.; Kram, T.; et al. The next generation of scenarios for climate change research and assessment. Nature 2010, 463, 747–756. [Google Scholar] [CrossRef]
  2. Muller, R.A.; Rohde, R.; Jacobsen, R.; Muller, E.; Wickham, C. A New Estimate of the Average Earth Surface Land Temperature Spanning 1753 to 2011. Geoinform. Geostat. Overv. 2013, 1, 1–7. [Google Scholar] [CrossRef]
  3. Trenberth, K.E.; Fasullo, J.T.; Shepherd, T.G. Attribution of climate extreme events. Nat. Clim. Chang. 2015, 5, 725–730. [Google Scholar] [CrossRef]
  4. Riahi, K.; van Vuuren, D.P.; Kriegler, E.; Edmonds, J.; O’Neill, B.C.; Fujimori, S.; Bauer, N.; Calvin, K.; Dellink, R.; Fricko, O.; et al. The Shared Socioeconomic Pathways and their energy, land use, and greenhouse gas emissions implications: An overview. Glob. Environ. Chang. 2017, 42, 153–168. [Google Scholar] [CrossRef] [Green Version]
  5. Kriegler, E.; O’Neill, B.C.; Hallegatte, S.; Kram, T.; Lempert, R.J.; Moss, R.H.; Wilbanks, T. The need for and use of socio-economic scenarios for climate change analysis: A new approach based on shared socio-economic pathways. Glob. Environ. Chang. 2012, 22, 807–822. [Google Scholar] [CrossRef]
  6. Kriegler, E.; Edmonds, J.; Hallegatte, S.; Ebi, K.L.; Kram, T.; Riahi, K.; Winkler, H.; van Vuuren, D.P. A new scenario framework for climate change research: The concept of shared climate policy assumptions. Clim. Chang. 2014, 122, 401–414. [Google Scholar] [CrossRef] [Green Version]
  7. Bashford, A. Global population: History, geopolitics, and life on earth. Glob. Public. Health 2014, 10, 129–131. [Google Scholar]
  8. Taylor, K.E.; Stouffer, R.J.; Meehl, G.A. An Overview of CMIP5 and the Experiment Design. B Am. Meteorol. Soc. 2012, 93, 485–498. [Google Scholar] [CrossRef] [Green Version]
  9. van Vuuren, D.P.; Riahi, K.; Moss, R.; Edmonds, J.; Thomson, A.; Nakicenovic, N.; Kram, T.; Berkhout, F.; Swart, R.; Janetos, A.; et al. A proposal for a new scenario framework to support research and assessment in different climate research communities. Glob. Environ. Chang. 2012, 22, 21–35. [Google Scholar] [CrossRef] [Green Version]
  10. Huang, J.; Wang, Y.; Fischer, T.; Su, B.; Li, X.; Jiang, T. Simulation and projection of climatic changes in the Indus River Basin, using the regional climate model COSMO-CLM. Int. J. Climatol. 2017, 37, 2545–2562. [Google Scholar] [CrossRef]
  11. Su, B.; Huang, J.; Gemmer, M.; Jian, D.; Tao, H.; Jiang, T.; Zhao, C. Statistical downscaling of CMIP5 multi-model ensemble for projected changes of climate in the Indus River Basin. Atmos. Res. 2016, 178, 138–149. [Google Scholar] [CrossRef]
  12. O’Neill, B.C.; Kriegler, E.; Ebi, K.L.; Kemp-Benedict, E.; Riahi, K.; Rothman, D.S.; van Ruijven, B.J.; van Vuuren, D.P.; Birkmann, J.; Kok, K.; et al. The roads ahead: Narratives for shared socioeconomic pathways describing world futures in the 21st century. Glob. Environ. Chang. 2017, 42, 169–180. [Google Scholar] [CrossRef] [Green Version]
  13. Nakicenovic, N.; Lempert, R.J.; Janetos, A.C. A Framework for the Development of New Socio-economic Scenarios for Climate Change Research: Introductory Essay. Clim. Chang. 2014, 122, 351–361. [Google Scholar] [CrossRef] [Green Version]
  14. Arnell, N.W.; Arnell, N.W.; Lloyd-Hughes, B.; Lloyd-Hughes, B. The global-scale impacts of climate change on water resources and flooding under new climate and socio-economic scenarios. Clim. Chang. 2014, 122, 127–140. [Google Scholar] [CrossRef] [Green Version]
  15. Popp, A.; Calvin, K.; Fujimori, S.; Havlik, P.; Humpenöder, F.; Stehfest, E.; Bodirsky, B.L.; Dietrich, J.P.; Doelmann, J.C.; Gusti, M.; et al. Land-use futures in the shared socio-economic pathways. Glob. Environ. Chang. 2017, 42, 331–345. [Google Scholar] [CrossRef] [Green Version]
  16. Dellink, R.; Chateau, J.; Lanzi, E.; Magné, B. Long-term economic growth projections in the Shared Socioeconomic Pathways. Glob. Environ. Chang. 2017, 42, 200–214. [Google Scholar] [CrossRef]
  17. Weng, Y.; Cai, W.; Wang, C. The application and future directions of the Shared Socioeconomic Pathways (SSPs). Clim. Chang. Res. 2020, 16, 215–222. [Google Scholar]
  18. Neill, B.C.; Tebaldi, C.; van Vuuren, D.P.; Eyring, V.; Friedlingstein, P.; Hurtt, G.; Knutti, R.; Kriegler, E.; Lamarque, J.; Lowe, J.; et al. The Scenario Model Intercomparison Project (ScenarioMIP) for CMIP6. Geosci. Model. Dev. 2016, 9, 3461–3482. [Google Scholar] [CrossRef] [Green Version]
  19. Eyring, V.; Bony, S.; Meehl, G.A.; Senior, C.A.; Stevens, B.; Stouffer, R.J.; Taylor, K.E. Overview of the Coupled Model Intercomparison Project Phase 6 (CMIP6) experimental design and organization. Geosci. Model. Dev. 2016, 9, 1937–1958. [Google Scholar] [CrossRef] [Green Version]
  20. Gidden, M.J.; Riahi, K.; Smith, S.J.; Fujimori, S.; Luderer, G.; Kriegler, E.; van Vuuren, D.P.; van den Berg, M.; Feng, L.; Klein, D.; et al. Global emissions pathways under different socioeconomic scenarios for use in CMIP6: A dataset of harmonized emissions trajectories through the end of the century. Geosci. Model. Dev. 2019, 12, 1443–1475. [Google Scholar] [CrossRef] [Green Version]
  21. Warszawski, L.; Frieler, K.; Huber, V.; Piontek, F.; Serdeczny, O.; Schewe, J. The Inter-Sectoral Impact Model Intercomparison Project (ISI–MIP): Project framework. Proc. Natl. Acad. Sci. USA 2014, 111, 3228–3232. [Google Scholar] [CrossRef] [PubMed] [Green Version]
  22. Chen, Y.; Guo, F.; Wang, J.; Cai, W.; Wang, C.; Wang, K. Provincial and gridded population projection for China under shared socioeconomic pathways from 2010 to 2100. Sci. Data 2020, 7, 83. [Google Scholar] [CrossRef] [PubMed] [Green Version]
  23. Pan, J.; Su, B.; Zhai, J.; Wang, Y.; Jiang, T. Development of economy and its influencing factors in China under the shared socioeconomic pathways. Adv. Clim. Chang. Res. 2019, 15, 607–616. [Google Scholar]
  24. Huang, J.; Qin, D.; Jiang, T.; Wang, Y.; Feng, Z.; Zhai, J.; Cao, L.; Chao, Q.; Xu, X.; Wang, G.; et al. Effect of Fertility Policy Changes on the Population Structure and Economy of China: From the Perspective of the Shared Socioeconomic Pathways. Earth’s Future 2019, 7, 250–265. [Google Scholar] [CrossRef]
  25. KC, S.; Lutz, W. Demographic scenarios by age, sex and education corresponding to the SSP narratives. Popul. Environ. 2014, 35, 243–260. [Google Scholar] [CrossRef]
  26. Leimbach, M.; Kriegler, E.; Roming, N.; Schwanitz, J. Future growth patterns of world regions—A GDP scenario approach. Glob. Environ. Chang. 2015, 42, 215–225. [Google Scholar] [CrossRef] [Green Version]
  27. Schewe, J.; Heinke, J.; Gerten, D.; Haddeland, I.; Arnell, N.W.; Clark, D.B.; Dankers, R.; Eisner, S.; Fekete, B.M.; Colón-González, F.J.; et al. Multimodel assessment of water scarcity under climate change. Proc. Natl. Acad. Sci. USA 2014, 111, 3245–3250. [Google Scholar] [CrossRef] [Green Version]
  28. Wiebe, K.; Lotze-Campen, H.; Sands, R.; Tabeau, A.A.; Meijl, V.J.C.M. Climate change impacts on agriculture in 2050 under a range of plausible socioeconomic and emissions scenarios. Environ. Res. Lett. 2015, 10, 85010. [Google Scholar] [CrossRef]
  29. Hanasaki, N.; Fujimori, S.; Yamamoto, T.; Yoshikawa, S.; Masaki, Y.; Hijioka, Y.; Kainuma, M.; Kanamori, Y.; Masui, T.; Takahashi, K.; et al. A global water scarcity assessment under Shared Socio-economic Pathways—Part 1: Water use. Hydrol. Earth Syst. Sci. 2013, 17, 2375–2391. [Google Scholar] [CrossRef] [Green Version]
  30. Zhu, M. Industry reconstruction and coordinated development of Yangtze River economic zone. In Proceedings of the 2016 International Conference on Logistics, Informatics and Service Sciences (LISS), Sydney, NSW, Australia, 24–27 July 2016; pp. 1–7. [Google Scholar]
  31. Jiang, T.; Zhao, J.; Jing, C.; Cao, L.; Wang, Y.; Sun, H.; Wang, A.; Huang, J.; Su, B.; Wang, R. National and Provincial Population Projected to 2100 Under the Shared Socioeconomic Pathways in China. Adv. Clim. Chang. Res. 2017, 13, 128–137. [Google Scholar]
  32. Wang, Y.; Jing, C.; Cao, L.; Zhai, J.; Tao, H.; Gao, C. The Population Patterns over China Under the 1.5 °C and 2.0 °C Warming Targets. Adv. Clim. Chang. Res. 2017, 13, 327–336. [Google Scholar]
  33. Jiang, T.; Zhao, J.; Cao, L.; Wang, Y.; Su, B.; Jing, C.; Wang, R.; Gao, C. Projection of national and provincial economy under the shared socioeconomic pathways in China. Adv. Clim. Chang. Res. 2018, 14, 50–58. [Google Scholar]
  34. Ding, X.; Zhong, F.; Mao, J.; Song, X.; Huang, C. Provincial urbanization projected to 2050 under the shared socioeconomic pathways in China. Adv. Clim. Chang. Res. 2018, 14, 392–401. [Google Scholar]
  35. Xu, Y.; Xu, C.; Gao, X.; Luo, Y. Projected changes in temperature and precipitation extremes over the Yangtze River Basin of China in the 21st century. Quatern. Int. 2009, 208, 44–52. [Google Scholar] [CrossRef]
  36. Tian, J.; Chang, J.; Zhang, Z.; Wang, Y.; Wu, Y.; Jiang, T. Influence of Three Gorges Dam on Downstream Low Flow. Water-Sui 2019, 11, 65. [Google Scholar] [CrossRef] [Green Version]
  37. Meng, L.; Li, C.; Hu, G. Predictions of China’s Population Structure Based on the PDF Model. China Popul. Resour. Environ. 2014, 24, 132–141. [Google Scholar]
  38. McCombie, J.; Thirlwall, A.P. Economic Growth and the Balance-of-Payments Constraint; The Macmillan Press Ltd.: London, UK, 1994; pp. 1–616. [Google Scholar]
  39. Liu, Y. Using the theory and method of analysis of Cobb-Douglas production function to study regional economy. Areal Res. Dev. 1989, 8, 89–93. [Google Scholar]
  40. Zakir Hossain, M.; Said Al Amri, K. Use of Cobb-Douglas production model on some selected manufacturing industries in Oman. Educ. Bus. Soc. Contemp. Middle East. Issues 2010, 3, 78–85. [Google Scholar] [CrossRef]
  41. Biddle, J. Retrospectives: The Introduction of the Cobb–Douglas Regression. J. Econ. Perspect. 2012, 26, 223–236. [Google Scholar] [CrossRef] [Green Version]
  42. Jiang, T.; Wang, Y.; Yuan, J.; Chen, Y.; Gao, X.; Jing, C.; Wang, G.; Wu, X.; Zhao, C. Projection of population and economy in the Belt and Road countries (2020‒2060). Adv. Clim. Chang. Res. 2018, 14, 155–164. [Google Scholar]
  43. Wang, J.; Ge, Y. Assessment of 2010 Census Data Quality and Past Population Changes. Popul. Res. 2013, 37, 22–33. [Google Scholar]
  44. Jiang, L. Internal consistency of demographic assumptions in the shared socioeconomic pathways. Popul. Environ. 2014, 35, 261–285. [Google Scholar] [CrossRef] [PubMed] [Green Version]
  45. Chen, F.; Liu, G. Population Aging in China; Bangkok Thailand U: Watthana, Bangkok, Thailand, 2009; Volume 1, pp. 157–172. [Google Scholar]
  46. Peng, X. China’s Demographic History and Future Challenges. Science 2011, 333, 581–587. [Google Scholar] [CrossRef] [PubMed] [Green Version]
  47. Feng, W.; Cai, Y.; GU, B. Population, Policy, and Politics: How Will History Judge China’s One-Child Policy? Popul. Dev. Rev. 2012, 38, 115–129. [Google Scholar] [CrossRef] [Green Version]
  48. Zeng, Y.; Hesketh, T. The eff ects of China’s universal two-child policy. Lancet 2016, 388, 1930–1938. [Google Scholar] [CrossRef] [Green Version]
  49. Zheng, Z.; Yong, C.; Wang, F.; Gu, B. Below-Replacement Fertility and Childbearing Intention in Jiangsu Province, China. Asian Popul. Stud. 2009, 5, 329–347. [Google Scholar]
  50. Zhang, X.; Huang, C.; Zhang, Q.; Chen, S.; Fan, Q. Fertility Intention for the Second Child under the Selective and Universal Two-Child Policies: Comparisons and Implications. Popul. Res. 2016, 40, 87–97. [Google Scholar]
  51. Boke-Olén, N.; Abdi, A.M.; Hall, O.; Lehsten, V. High-resolution African population projections from radiative forcing and socio-economic models, 2000 to 2100. Sci. Data 2017, 4, 1–9. [Google Scholar] [CrossRef] [Green Version]
  52. Fang, J.; Wang, Z.; Zhao, S.; Li, Y.; Tang, Z.; Yu, D.; Ni, L.; Liu, H.; Xie, P.; Da, L.; et al. Biodiversity changes in the lakes of the Central Yangtze. Front. Ecol. Environ. 2006, 4, 369–377. [Google Scholar] [CrossRef]
  53. Li, H.; Huang, X.; Jin, Y.; Zhang, X. Population Carrying Capacity of Water Resources in the Yangtze River Economic Belt. Econ. Geogr. 2017, 37, 181–186. [Google Scholar]
  54. Chen, Y.; Zhang, S.; Huang, D.; Li, B.; Liu, J.; Liu, W.; Ma, J.; Wang, F.; Wang, Y.; Wu, S.; et al. The development of China’s Yangtze River Economic Belt: How to make it in a green way? Sci. Bull. 2017, 62, 648–651. [Google Scholar] [CrossRef] [Green Version]
  55. Ma, J.; Wu, Y.; Deng, X. Green development of industries in Yangtze River Economic Belt. Ecol. Econ. 2016, 12, 287–295. [Google Scholar]
Figure 1. Location map of the Yangtze River basin ((a), Urban agglomeration; (b), Night light average intensity map).
Sustainability 12 04202 g001
Figure 2. Comparison of population and GDP statistics for 2010–2018 with SSP2 scenario forecast results ((a), Population; (b), GDP).
Sustainability 12 04202 g002
Figure 3. Growth of population in Yangtze River Basin from 2021 to 2050 compared with 2010 ((a), Population in 2010; bf, 2021–2050 average minus 2010).
Sustainability 12 04202 g003
Figure 4. Growth of economy in Yangtze River basin from 2021 to 2050 compared with 2010 ((a), GDP in 2010; (bf), 2021–2050 average minus 2010).
Sustainability 12 04202 g004
Figure 5. Population and economic trends in the Yangtze River basin under SSPs in 2010–2100 ((a), Population; (b), GDP).
Sustainability 12 04202 g005
Figure 6. The population and GDP of the three major urban agglomerations in the Yangtze River basin. ((a) population; (b), GDP).
Sustainability 12 04202 g006
Figure 7. The population growth rate of the three major urban agglomerations in the Yangtze River basin in 2020–2010.
Sustainability 12 04202 g007
Figure 8. The GDP growth rate of the three major urban agglomerations in the Yangtze River basin in 2020–2100.
Sustainability 12 04202 g008
Figure 9. Changes in per capita GDP and growth rate of Yangtze River from 2010 to 2100 ((a), per capita GDP; (b), growth rate).
Sustainability 12 04202 g009
Figure 10. Growth of per capita GDP in Yangtze River basin from 2021 to 2050 over 2010 ((a), 2010; bf, 2021–2050 average minus 2010).
Sustainability 12 04202 g010
Table 1. Major Cities in Yangtze River basin Urban Agglomeration.
Urban AgglomerationMain CitiesNumber of CitiesPopulation (Million)GDP (Trillion)
YRDUAYangtze River Delta Urban AgglomerationShanghai2615012.67
Nanjing
Hangzhou
Hefei
MYRUAMiddle Yangtze Reaches Urban AgglomerationWuhan311216.0
Changsha
Nanchang
CYUAChengdu-Chongqing Urban AgglomerationChongqing16913.76
Chengdu
Table 2. Parameters of population prediction model under the SSPs [31].
Model ParameterFertilityMortalityMobilityEducation
SSP1LowLowMediumHigh
SSP2MediumMediumMediumMedium
SSP3HighHighLowLow
SSP4LowMediumMediumLow
SSP5LowLowHighHigh
Table 3. Summary of the SSP narratives [4].
SSP Narratives
SSP1Sustainability—Green development path (Low climate change challenge), low fertility, high life expectancy, moderate migration, high education levels
SSP2Middle of the Road (Medium climate change challenge)
Parameters such as fertility, mortality, migration and education are all medium-sized assumptions
SSP3Regional Rivalry—A Rocky Road (Climate change challenges are higher)
The education level maintains the current enrollment rate, high fertility, high mortality, low migration
SSP4Inequality—A Road Divided (Focusing on adapting to challenges, mitigation challenges are low)
The low fertility countries will have low fertility, medium mortality, medium migration, and low education.
SSP5Fossil-fueled Development—Taking the Highway (Traditional development scenarios focus on mitigating challenges)
low fertility and mortality, high education
Table 4. Assumptions on the economic projections for SSPs [33].
Economic ParametersSSP1SSP2SSP3SSP4SSP5
LFP0.700.700.600.750.80
Time of convergence to LFP/year100100100400100
TFP annual growth rate/%0.700.700.350.701.05
α0.350.350.250.300.45
Time of convergence to α/year7515015075250
Table 5. Discussion on the accuracy of simulation models.
CitiesMERMSEMARE
Sichuan provincePOP−0.1590.4790.019
GDP−0.4211.2620.140
Hubei provincePOP−0.0190.0510.003
GDP−0.3811.1430.122
Shanghai cityPOP0.0020.0050.013
GDP−0.3330.9990.128
Table 6. The population growth of the three major urban agglomerations in the Yangtze River basin. Unit: ten thousand.
SSP1SSP2SSP3SSP4SSP5
CYUA−726−51921−909−1053
MYRUA−224321322−201−507
YRDUA95712749327191635
Table 7. The GDP growth of the three major urban agglomerations in the Yangtze River basin. Unit: trillion.
SSP1SSP2SSP3SSP4SSP5
CYUA7.156.715.916.617.14
MYRUA9.918.967.699.1010.10
YRDUA28.0326.0722.8026.5529.07

