Abstract
Sassafras tzumu (Chinese sassafras) is an economically and ecologically important deciduous tree species. Over the past few decades, increasing market demands and unprecedented human activity in its natural habitat have created new threats to this species. Nonetheless, the distribution of its habitat and the crucial environmental parameters that determine the habitat suitability remain largely unclear. The present study modeled the current and future geographical distribution of S. tzumu by maximum entropy (MAXENT) and genetic algorithm for rule set prediction (GARP). The value of area under the receiver operating characteristic curve (AUC), Kappa, and true skill statistic (TSS) of MAXENT was significantly higher than that of GARP, indicating that MAXENT performed better. Temperate and subtropical regions of eastern China where the species had been recorded was suitable for growth of S. tzumu. Relative humidity (26.2% of permutation importance), average temperature during the driest quarter (16.6%), annual precipitation (12.6%), and mean diurnal temperature range (10.3%) were identified as the primary factors that accounted for the present distribution of S. tzumu in China. Under the climate change scenario, both algorithms predicted that range of suitable habitat will expand geographically to northwest. Our results may be adopted for guiding the preservation of S. tzumu through identifying the habitats susceptible to climate change.
1. Introduction
Understanding the relationship between the geographical distribution of species and that of environmental characteristics is a central issue in ecology [1,2]. Changes in environmental characteristics, especially climate, have significant implications for life-history traits, flowering and fruiting phenology, as well as habitat requirements that have consequently altered the forest ecosystem functions and structures [2]. Indeed, the changes in global climate that have been detected in the last several decades have generated numerous variations in species distributions, which may serve to be the primary cause leading to species extinction in the short run, based on the direct or synergistic effect with additional extinction enablers [3,4]. Therefore, understanding the distribution of habitat (with suitable climate) can enable forest managers to accurately assess ecosystem and species vulnerabilities in the face of climate change [5]. However, a lack of appropriate biogeographical data accounts for a leading drawback that hinders the implementation of appropriate conservation measures [6].
When an insufficient amount of distribution data is available, species distribution models (SDMs) are known to be the efficient approach for evaluating the possible geographical distribution of species; these models have been used in various fields, such as biogeography, ecology, conservation, and evolutionary biology [7,8,9,10,11,12]. There are various SDMs, such as the generalized additive model, generalized linear model [9,13], general rule set prediction (GARP) [14], DOMAIN [9], bioclimatic envelopes [9], and MAXENT (maximum entropy) [15]. These models use different species records (presence/pseudo-absence, presence/absence, or presence-only data) to predict the distribution of various species.
Recent integrated comparisons of presence-only modelling approaches have shown that GARP and MAXENT perform well in prediction when compared with other approaches [16,17,18]. MAXENT has been used to estimate species distributions through examining the possible maximum entropy distribution [15]. GARP produces mathematical rules in the random set after an iterative rule selection process, by testing, incorporating, and rejecting possible outcomes [10]. Such rule sets have been integrated randomly for generating the possible species niche restrictions based on environmental conditions [7]. Evaluating the performance of GARP and MAXENT will help to reveal the variations in their ability to accurately predict the potential distribution of species.
Sassafras tzumu (Chinese sassafras) is an endemic deciduous tree of China belonging to the Lauraceae family. This species grows well in moist, well-drained, or sandy loam soils and tolerates a variety of soil types [19]. It occurs in Anhui, Fujian, Guangdong, Guangxi, Guizhou, Hubei, Hunan, Jiangsu, Sichuan, Yunnan, and Zhejiang Provinces of China [19], and grows in both broad-leaved evergreen and in mixed deciduous forests with an elevation of 100–1900 m [19]. This species plays a significant role in increasing the ability of soil to retain water and reducing the loss of soil to surface runoff [20]. In addition, the roots and bark of S. tzumu are often harvested from the wild and the species is used as a medicinal plant locally for treating inflammation and traumatic injuries [21]. The essential oils obtained from its bark, leaf, and root vary significantly in chemical composition, which suggests that they might vary in their pharmacological effects as well [22]. Moreover, this species-important timber tree is valued for its decorative and often fragrant wood. This wood is strong, extremely durable, handsome, and maintains its shape well [19]. The profit of one hectare of S. tzumu timber is ca. 250,000 RMB [20].
Over the past few decades, increasing market demands and unprecedented man-made activity in its natural habit have created new threats to S. tzumu [22]. Nonetheless, the potential geographic distribution of S. tzumu has rarely been investigated in existing studies. Determining the effects of climate changes on habitat suitability is also a critical problem linked to its economic value and ecological significance. In this study, the MAXENT and GARP models were adopted for predicting the possible distribution of S. tzumu. Specifically, this study aimed to (1) model this species’ potential geographical distribution; (2) identify the critical environmental factors shaping the distribution of S. tzumu; and (3) discuss the variations of appropriate habitat distributions in the face of climate changes. Our results will allow researchers to identify the future suitable habitat and help in the use, management, and cultivation of S. tzumu.
2. Materials and Methods
2.1. Species Occurrence Data
Occurrence data of S. tzumu was acquired from various sources, such as the Chinese virtual herbarium [23], the Global Biodiversity Information Facility [24], and our field survey, as well as literature reports. The longitude and latitude of few specimens (ca. 20) that give an exact village location were found using Google Earth. To reducing the possible errors of specific points, the locations that were duplicated or lack detailed information were deleted. Eventually, a total of 202 records were screened and used to model the distribution of S. tzumu (Figure 1).
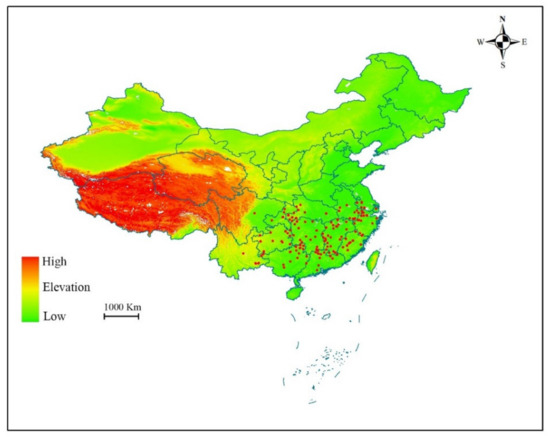
Figure 1.
Occurrence records of Sassafras tzumu in China. Provinces and other administrative areas are outlined.
2.2. Environmental Parameters
In total, 28 environmental parameters possibly affecting S. tzumu distribution were selected. These include 19 bioclimatic variables having a 30-second spatial resolution obtained from the World Climate Database [25], three topographic variables, i.e. slope degree, aspect, and altitude, were extracted from the digital elevation model (DEM, 20 × 20 m resolution) obtained from Geospatial Data Cloud [26], and three soil variables, i.e. the type, pH, and organic carbon content of soil which were acquired from the Center for Sustainability and the Global Environment [27]. In addition, data related to the normalized difference of vegetation index (NDVI), relative humidity, and sunshine duration in growing season were acquired based on the China Meteorological Data Sharing Service System [28]. The annual average NDVI was calculated based on a 10-year time-series of SPOT vegetation imagery with a 1 km2 resolution; then it was used to measure vegetation cover [28].
The Beijing Climate Center Climate System Model version 1.1 (BCC-CSM1.1) were obtained based on representative concentration pathways (RCPs) 2.6 and 8.5 for 2050 and 2070, issued via the Intergovernmental Panel on Climate Change (IPCC) Assessment Report 5 (AR5), which were used as the simulation data for future distribution. The BCC-CSM1.1 has been recommended for use in studies on climate change and on the operational short-term forecast of climate across China [29]. The RCP 2.6 reflects potential radiative forcing by 2100 compared with the pre-industrial values of +2.6 W/m2 which is optimistic, while RCP 8.5, a more pessimistic scenario, reflects high emission levels of greenhouse gases, and leads to 8.5 W/m2 of radiative forcing in the year of 2100 [25]. The other variables were not changed to analyze the SDM in the projected future climate scenarios.
Each bioclimatic layer had a resolution of 1 km, and each environmental layer was processed using a system with identical projection, cell size, and extent (WGS84 Longitude-Latitude projection) in ArcGIS 10.1 (ESRI, Redlands, CA, USA). To eliminate the multicollinearity among variables, the Pearson correlation coefficient were used. Only one parameter was selected for those with high cross-correlation (r2 > 0.90) [30]. The decision of which variable was kept were based on principal component analyses (For more detail see Yi et al. [30]). Eventually, the number of predicting factors was decreased to 16 (Table 1).

Table 1.
Environment variables used for predicting the potential distribution of Sassafras tzumu.
2.3. GARP Analysis
The GARP 1.1 was adopted for predicting species distribution [31]. The occurrence records were classified into two groups, among which 75% data were randomly screened in training the model, while the remaining 25% were used to test the model. Afterwards, the environmental variables shown below were adopted to fit the GARP model, including runs of 100 times, a convergence limit of 0.01, and a maximum of 1000 iterations. Additionally, four types of rules (range, atomic, logistic regression, and negated range) were used, while the remaining variables were set as defaults. Eventually, the ‘best subset’ models were chosen for result mapping. Then, the ArcGIS 10.1 spatial analysis tools were adopted to average the top ten models for generating one singular distribution map.
2.4. MAXENT Analysis
MAXENT 3.3.3k [18] was used in analysis. Similar to GARP, we also used 25% of occurrence records to test the model and 75% of occurrence records for training. A bias file layer was used to avoid bias of sampling within those species’ occurrence records [32]. This file was generated using occurrence point data by deriving a Gaussian kernel density map that was rescaled from 1 to 20 based on Elith et al. [33]. Altogether, four possibilities, including bioclimatic rules, logistic regression, negated range rules, and range rules, were applied. The algorithm was run until convergence or for 1000 iterations. The internal jackknife of MAXENT was also adopted for testing and assessing the significance for all environmental parameters in the prediction of the distribution of S. tzumu. Other optimization parameters are selected by default.
2.5. Environmental Parameters That Determined S. tzumu Distribution
Maxent can be used in several ways to quantify how each variable contributes to the model. Here, ‘permutation importance’ was used to identify the most important bioclimatic variables that predicted the geographical distribution of a specific group. Permutation importance measures the decrease in the training area under the receiver operating characteristic curve (AUC) that results from randomly permuting the value of a specific variable when training the model. The decrease in the training AUC is proportional to the importance of each variable to the model [18].
2.6. Shift of The Distribution Center of Suitable Habitat
The distribution center of S. tzumu under current and future climate change scenarios were calculated using the SDM toolbox [34] and the primary shifts of the suitable habitat of S. tzumu were analyzed. The movement of the distribution center was tracked to examine the distributional shift under climate change.
2.7. Model Assessments
Three approaches were used for model evaluation, including AUC [35], Cohen’s Kappa, as well as the true skill statistic (TSS) [36]. To compare the model performance of GARP and MAXENT, a Mann-Whitney U test were used. The AUC has been an approach used to measure model performance, which is independent of a threshold and has been universally accepted [35]. The AUC value can range from 0–1, and AUC values close to 0.9 are recognized as favorable performance. The value of Cohen’s Kappa was between −1 and +1, in which +1 suggests excellent performance, while values of ≤0 indicate that a performance that was not superior to a random result [15]. The value of TSS also falls within the interval of −1 to +1, among which ≤0 suggests poor model performance, while 1 predicts the best possible performance. The R software “ROCR” package was adopted for calculating the TSS, kappa and AUC values of those ten models in each algorithm.
3. Results
3.1. Model Accuracy and Comparison
The test AUC, Kappa, and TSS value of both MAXENT and GARP were > 0.85, indicating the good performance of both models. According to the results from a Mann-Whitney U test, MAXENT had significantly higher AUC, Kappa and TSS scores than those of GARP (Table 2), indicating that MAXENT models performed better than GARP models.
Table 2.
Comparison of area under the receiver operating characteristic curve (AUC), true skill statistic (TSS), and Kappa of genetic algorithm for rule set prediction (GARP) and maximum entropy (MAXENT) models.
3.2. Regions for Possible S. tzumu Distribution
Based on the prediction results of MAXENT and GARP models (Figure 2), the climate in most regions of southeastern China, such as Anhui, Chongqing, Guangdong, Guangxi, Guizhou, Hubei, Hunan, Fujian, Jiangxi, and Zhejiang, is suitable for the growth of S. tzumu. However, the current modeled distributions via both algorithms are inconsistent: GARP forecast that large areas in Jiangsu, Anhui, Shaanxi, and Hainan were suitable, which were forecasted to be marginally suitable via MAXENT. Moreover, GARP predicted that the areas of potential distribution with high suitability was continuous and covers a large area, whereas those predicted by MAXENT were scattered and small.
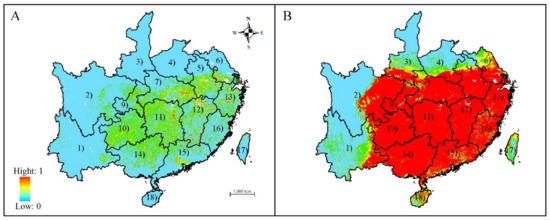
Figure 2.
Predicted habitat suitability of Sassafras tzumu by Maxent (A) and GARP (B): (1) Yunnan; (2) Sichuan; (3) Shaanxi; (4) Henan; (5) Anhui; (6) Jiangsu; (7) Hubei; (8) Shanghai; (9) Chongqing; (10) Guizhou; (11) Hunan; (12) Jiangxi; (13) Zhejiang; (14) Guangxi; (15) Guangdong; (16) Fujian; (17) Taiwan; and (18) Hainan. Only the provinces where S. tzumu is predicted to occur are shown.
3.3. Environmental Parameters that Determined S. tzumu Distribution
Environmental parameters with the greatest contributions to constructing the possible S. tzumu distribution model based on the MAXENT algorithm included relative humidity (Hum, 26.2% contribution), mean temperature at the driest quarter (Bio 9, 16.6%), annual precipitation (Bio 12, 12.6%), and the mean diurnal temperature range (Bio 2, average of (max temp—min temp) every month) (10.3%). For those four environmental parameters, the cumulative contribution reached up to 65.7%, proving that these four parameters would make vital contributions to the possible future distribution of S. tzumu. According to those standard curves regarding the S. tzumu distribution model (Figure 3), we acquired the thresholds for leading parameters (with the probability of occurrence of >0.3), including Hum of 75%–83%, Bio 9 of 4–20 °C, Bio 12 of >1000 mm, and Bio 2 of 70%–90%.
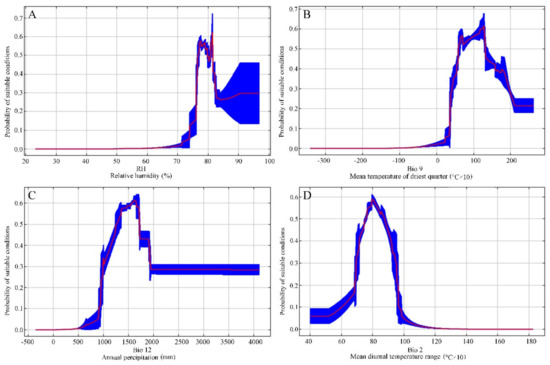
Figure 3.
Response curves of relatively humidity (A), mean temperature of driest quarter (B), annual precipitation (C), and mean diurnal temperature range (D) based on the MAXENT algorithm for Sassafras tzumu in China.
3.4. Variations of Future Habitat Under Climate Change
In the RCP 2.6–2050 climate scenario, MAXENT forecasted that the gains in suitable habitat areas of S. tzumu would be in the central Sichuan, southern Anhui, southern Shaanxi, northern Hubei, and south Jiangsu (Figure 4A1), which amounted to ca. 1.14 × 10⁵ Km2 (Table 3). In addition, losses of suitable habitat area of ca. 1.12 × 10⁵ km2 were predicted for Fujian and northern Guangdong. In the RCP 2.6–2070 climate scenario, MAXENT forecast that area of expanded distribution increase to 1.18 × 10⁵ (Table 3), while the decreased habitat continued to decrease and accounted for ca. 0.98 × 10⁵ km2 (Table 3). In the RCP 2.6–2050 and RCP 2.6–2070 climate scenarios, GARP predicted losses of appropriate habitat area accounting for ca. 1.38 × 10⁵ km2 and 1.76 × 10⁵ km2, respectively, in Guangdong and Guangxi (Figure 4(A1,B2)). Meanwhile, the areas of increased suitable habitat accounting for ca. 0.89 × 10⁵ km2 and 0.27 × 10⁵ km2 (Table 3) under RCP 2.6–2050 and RCP 2.6–2070 climate scenarios, respectively, were predicted for areas in southern Shanxi, and southern Anhui (Figure 4(A1,B2)). Overall, under RCP 2.6 scenario, MAXENT predict an increase in distribution while GARP predict a decrease in distribution. Nonetheless, both MAXENT and GARP predicted the distribution shift to northwest (Figure 5).
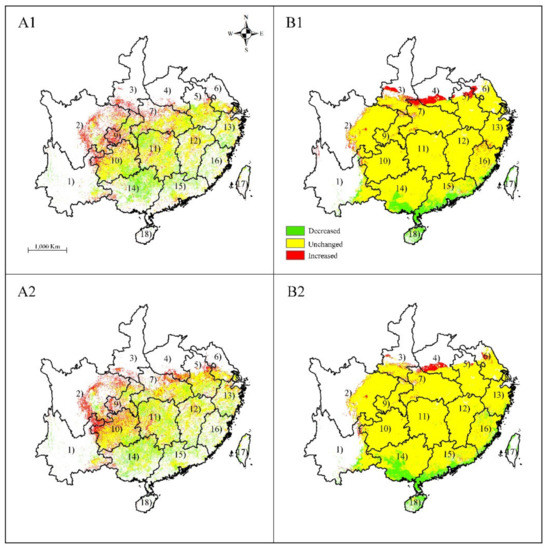
Figure 4.
Changes in distribution area for Sassafras tzumu under climate change scenarios RCP 2.6 by Maxent (A1), (A2) and GARP (B1), (B2). (A1), (B1), scenarios for RCP 2.6–2050; (A2), (B2), scenarios for RCP 2.6–2070; (1) Yunnan; (2) Sichuan; (3) Shaanxi; (4) Henan; (5) Anhui; (6) Jiangsu; (7) Hubei; (8) Shanghai; (9) Chongqing; (10) Guizhou; (11) Hunan; (12) Jiangxi; (13) Zhejiang; (14) Guangxi; (15) Guangdong; (16) Fujian; (17) Taiwan; and (18) Hainan. Only the provinces where S. tzumu is predicted to occur are shown.
Table 3.
Dynamic changes in the distribution area for Sassafras tzumu under four future climate scenarios/years.
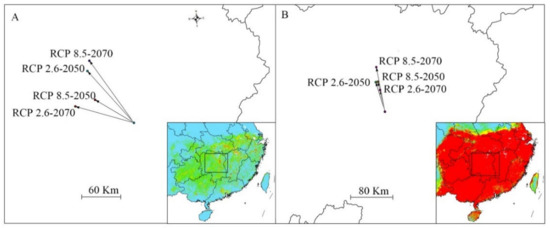
Figure 5.
Shift of the distribution center of suitable habitat under different climate scenario/year for Sassafras tzumu by MAXENT (A) and GARP (B).
Under the RCP 8.5 climate scenario, both MAXENT and GARP predicted that the area of change was located in the same provinces as were predicted with RCP 2.6 climate scenario (Figure 6) and showed a similar distribution shift (Figure 5). MAXENT predicted that the increased area accounted for ca. 1.19 × 10⁵ km2 and 2.36 × 10⁵ km2 under the RCP8.5–2050 and RCP 8.5–2070 climate scenarios, respectively, while GARP predicted that the increased area accounted for 0.95 × 10⁵ km2 and 0.33 × 10⁵ km2 under the RCP 8.5–2050 and RCP 8.5–2070 climate scenario, respectively. MAXENT predicted that the decreased area accounted for ca. 1.09 × 10⁵ km2 and 0.68 × 10⁵ km2 under the RCP8.5–2050 and RCP 8.5–2070 climate scenarios, respectively, while GARP predicted that the decreased area accounted for 1.49 × 10⁵ km2 and 3.58 × 10⁵ km2 under the RCP 8.5–2050 and RCP 8.5–2070 climate scenarios, respectively.
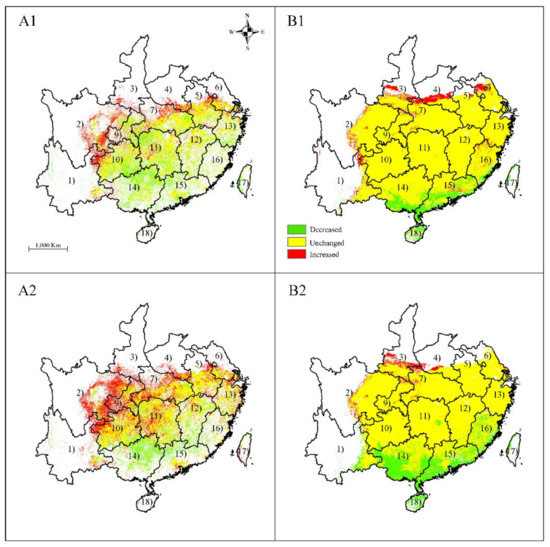
Figure 6.
Changes in distribution area for Sassafras tzumu under climate change scenarios RCP 8.5 by Maxent (A1), (A2) and GARP (B1), (B2). (A1), (B1), scenarios for RCP 8.5–2050; (A2), (B2), scenarios for RCP 8.5–2070; (1) Yunnan; (2) Sichuan; (3) Shaanxi; (4) Henan; (5) Anhui; (6) Jiangsu; (7) Hubei; (8) Shanghai; (9) Chongqing; (10) Guizhou; (11) Hunan; (12) Jiangxi; (13) Zhejiang; (14) Guangxi; (15) Guangdong; (16) Fujian; (17) Taiwan; and (18) Hainan. Only the provinces where S. tzumu is predicted to occur are shown.
4. Discussion
Understanding the relationship between the geographical distribution of a species and that of environmental characteristics needed by a species is a central issue in ecology. S. tzumu is an ecologically and economically important tree species. However, because S. tzumu has a weak natural ability to regenerate and because unprecedented damage has occurred in its natural habitat, wild germplasm resources are being exhausted. In this study, we used MAXENT and GARP to model the potential distribution of this species and the effects of climate change on its habitat suitability. Our results indicate that MAXENT performed better than GARP. Relative humidity, average temperature during the driest quarter, annual precipitation, and mean diurnal temperature range were identified as the primary factors that accounted for the present distribution of S. tzumu in China. Under RCP 2.6 and 8.5 climate change scenarios, both algorithms predicted that the range of suitable habitat will expand geographically to the northwest.
SDM has been recognized as an efficient and universal approach to guide the management of forest in the face of global climate change [8]. However, model performance differs among different SDMs based on the sampling size, the study area, and the species modelled [9,16,37,38,39]. Using the performance measures employed in this study, the results show that the MAXENT has superior performance over GARP and thus can be used to predict the geographical distributions of species, or of other species of similar ecological traits. Such findings conformed to those obtained from Elith et al. [9], Hernandez et al. [16], and Elith and Graham [40], who rated MAXENT higher than GARP.
MAXENT is advantageous when compared with additional ecological niche models for the prediction of possible species distributions. Specifically, MAXENT allows for model to be run based on a small number of sample locations [9,41]. As indicated in the present study, GARP predicted similar appropriate areas of distribution to those predicted by MAXENT, and both algorithms drew maps consistent with the known distribution of the species. However, GARP predicted extensive areas compared with those by MAXENT. These findings may have occurred because GARP and MAXENT have basic differences; GARP tends to result in models with a greater number of errors of commission than MAXENT, i.e., it would predict broader areas of suitable habitat [42]. Apparent errors of commission were derived from regions with potentially suitable habitat where the species was predicted to be present, but where presence cannot be demonstrated because the species has not been verified to exist there. This lack of verification may have several causes such as the existence of map pixels that indicate presence that lack documentation of the species simply because biologists have not adequately sampled an area [40,42].
Determining which environment factor is shaping and maintaining a species geographical distribution is a critical issue in ecology and evolution. According to our findings, the most important ones that explained the species’ environmental requirements best were relative humidity, mean temperature during the driest quarter, the average diurnal range of temperature, and annual precipitation. In fact, each area possessing a relatively large probability for the occurrence S. tzumu was associated with rainy seasons having high humidity during the growing season; this might offer an appropriate growth environment for S. tzumu. In the meantime, those areas that had a reduced S. tzumu occurrence probability might experience a dry growing season. The above findings indicated the distribution of S. tzumu would occur within habitats with a high relative humidity.
The tolerance of a particular range of temperatures is one of the most important features used to explain the latitudinal distribution of various species [43]. S. tzumu generally grows in warm and humid regions with an average winter (December-February) temperature > 4°C. This finding agrees with the known climatic preference of S. tzumu [44]. Variations in temperature affect the distribution S. tzumu through affecting germination, water absorption, photosynthesis, transpiration, respiration, reproduction, and growth. Low winter temperature has been suggested to affect the dormancy breaking of S. tzumu seeds [45]. Moreover, based on the mean air temperature of winter in field records (occurrence points), S. tzumu occurrence was not detected within areas with means of <−1°C. The response curve of annual precipitation showed that the optimal range for S. tzumu was from >1000 mm. Patterns and annual amounts of precipitation serve as important factors in plant regeneration and survival for this species as well as in other ecosystem functions [46]. Previous studies have shown that plants of S. tzumu have a plastic response of seedling growth [47], biomass allocation [48,49], physiological characteristics [22,48], and phenology [50] to variations in annual precipitation.
The above parameters might affect the ultimate S. tzumu distribution and its ability to adapt ecologically. However, the species distribution models usually depict the fundamental niches of species, but not the realized niches [51]. Numerous parameters that affect those realized niche dimensions are usually not considered when predicting the possible species geographical distribution [52]. In our results, some parameters that may affect the distribution of S. tzumu were not considered because of a lack of robust data, such as interspecific competition, the effects of natural enemy predation, anthropogenic influence, and geographical barriers. Therefore, future studies need to incorporate these factors in their analysis [53]. Moreover, each bioclimatic layer used in our studied had a resolution of 1 km, predictions based on low resolution data are likely to overestimate the spatial extent of a species’ habitat [14,17], and therefore, a higher resolution is needed in further studies.
At present, climate change has received unprecedented attention [54,55]. Although the future potential distributions of S. tzumu predicted by the two algorithms were inconsistent, both models predicted that the range of habitat suitable will expand geographically to the northwest. Typically, southern Shaanxi, and Anhui Province has been recognized to be inappropriate for this species under the present situations based on the literature [19] as well as by our model constructed based on present climatic conditions.
Climate changes can lead to the local or regional disappearance of S. tzumu and loss of entire ecosystems; alternatively, some ecosystems may be replaced by additional types of ecosystems [56]. The variations of temperature and precipitation regimes, such as the duration of the dry season, can lead to S. tzumu trees experiencing phenological shifts, which indirectly affects the faunal and floral species that depend on S. tzumu. In addition, climate changes may have adverse effects on a number of insects, mammals, and terrestrial birds that are indirectly and directly dependent on S. tzumu seeds, fruits, and flowers [57].
Our model results may be tailored to suit the preservation guidelines of S. tzumu through recognizing those critically susceptible and climatically appropriate habitats in which artificial regeneration must be considered during reforestation. Using our models, the appropriate climatic habitats for S. tzumu were detected to shift northwards outside the current area of natural distribution. However, the speed of natural migration is low; therefore, assisted migration of S. tzumu can serve as a potential preservation strategy if extensive future climate change creates new areas of climatically appropriate habitat [58]. Therefore, plantations of S. tzumu can be proposed within newly climatically appropriate habitats; besides, more attention should be paid to preserve the natural regeneration for such trees at sites determined to be in high-risk areas under future climate scenarios. Moreover, the non-change and gain within the climate space shown among the various S. tzumu ecoregions may be recognized to be the underlying refugia of climate change. S. tzumu trees currently grow under various climates, providing a way for the species to adapt to the new climates within specific natural habitats [59]. Consequently, the persistence of S. tzumu can be improved by the application of phenotypic plasticity and the selection of genotypes that potentially adapt to future climate scenarios.
To promote the sustainable development of S. tzumu and the related forest ecosystems, we recommend the following strategies: (1) in-situ and ex-situ conservation methods for wild S. tzumu and related information networks should be developed; (2) anthropogenic disturbance should be minimized; (3) a database for long-term and systematic monitoring of the population dynamics of S. tzumu should be established; (4) for high risk areas under climate change, forest managers should introduce other species that were known to be appropriate for specific climatic situations, rather than continue to create new plantations of S. tzumu; and (5) we recommend forest management agencies be given additional funding so they can conduct intensive surveys to analyze and understand the present situation related to wild S. tzumu. Land managers would then need to develop a management strategy and practical measures to conserve valuable wild S. tzumu resources.
5. Conclusions
Based on our findings as well as on previous biological data, the distribution of S. tzumu are suggested to be primarily driven by relative humidity, mean temperature during the driest quarter, mean diurnal temperature range, and annual precipitation. The temperate and subtropical regions of eastern China where the species has been recorded were also identified as having high environmental suitability for this species. Under RCP 2.6 and 8.5 climate change scenarios, both algorithms predicted that the spatial extent of the potential distribution would move to the northwest. Additional studies using additional environmental factors, such as anthropogenic influence and geographical barriers, as well as a higher resolution of bioclimatic layer will be needed to validate the effects of climate on the distribution of S. tzumu. Nonetheless, the maps produced in our study allows the quantitative assessment of risks related to regional climate change that could have an effect on S. tzumu cultivation; therefore, the present study offers valuable data related to forest management planning efforts in the face of global climate change. In addition, the findings in this work may also be used to optimize future field surveys and the detection of unknown populations.
Author Contributions
Conceptualization, K.Z. and J.T.; methodology, K.Z. and D.J.; formal analysis, K.Z. and J.T.; data curation, J.T.; investigation, D.J. and Y.Z.; writing—original draft preparation, J.T. and K.Z.; writing—review and editing, Y.Z. and K.Z.; supervision, J.T. All authors have read and agreed to the published version of the manuscript.
Funding
This research was funded by the Forestry Science and Technology Promotion and Demonstration Fund of Central Finance ([2018]TG08); and the Construction of Jiangsu Modern Agricultural Industry Technology System (JATS[2019]448).
Conflicts of Interest
The authors declare no conflict of interest.
References
- Guisan, A.; Zimmermann, N.E. Predictive habitat distribution models in ecology. Ecol. Model. 2000, 135, 147–186. [Google Scholar] [CrossRef]
- Grimm, N.B.; Chapin, F.S.; Bierwagen, B.; Gonzalez, P.; Groffman, P.M.; Luo, Y.; Melton, F.; Nadelhoffer, K.; Pairis, A.; Raymond, P.A. The impacts of climate change on ecosystem structure and function. Front. Ecol. Environ. 2013, 11, 474–482. [Google Scholar] [CrossRef]
- Araújo, M.B.; Alagador, D.; Cabeza, M.; Nogués-Bravo, D.; Thuiller, W. Climate change threatens European conservation areas. Ecol. Lett. 2011, 14, 484–492. [Google Scholar] [CrossRef] [PubMed]
- Franklin, J. Species distribution models in conservation biogeography: Developments and challenges. Divers. Distrib. 2013, 19, 1217–1223. [Google Scholar] [CrossRef]
- Wang, T.L.; Wang, G.Y.; Innes, J.; Nitschke, C.; Kang, H.J. Climatic niche models and their consensus projections for future climates for four major forest tree species in the Asia-Pacific region. Forest Ecol. Manag. 2016, 360, 357–366. [Google Scholar] [CrossRef]
- Bini, L.M.; Diniz-Filho, J.A.F.; Rangel, T.F.; Bastos, R.P.; Pinto, M.P. Challenging Wallacean and Linnean shortfalls: Knowledge gradients and conservation planning in a biodiversity hotspot. Divers. Distrib. 2006, 12, 475–482. [Google Scholar] [CrossRef]
- Ganeshaiah, K.N.; Barve, N.; Nath, N.; Chandrashekara, K.; Swamy, M.; Shaanker, U.R. Predicting the potential geographical distribution of the sugarcane woolly aphid using GARP and DIVA-GIS. Curr. Sci. 2003, 85, 1526–1528. [Google Scholar]
- Guisan, A.; Thuiller, W. Predicting species distribution: Offering more than simple habitat models. Ecol. Lett. 2005, 8, 993–1009. [Google Scholar] [CrossRef]
- Elith, J.; Graham, C.H.; Anderson, R.P.; Dudík, M.; Ferrier, S.; Guisan, A.; Hijmans, R.J.; Huettmann, F.; Leathwick, J.R.; Lehmann, A.; et al. Novel methods improve prediction of species’ distributions from occurrence data. Ecography 2006, 29, 129–151. [Google Scholar] [CrossRef]
- Peterson, A.T.; Papes, M.; Eaton, M. Transferability and model evaluation in ecological niche modeling: A comparison of GARP and Maxent. Ecography 2007, 30, 550–560. [Google Scholar] [CrossRef]
- Mac, N.R. Regression and model-building in conservation biology, biogeography and ecology: The distinction between—and reconciliation of—‘predictive’ and ‘explanatory’ models. Biodivers. Conserv. 2000, 9, 655–671. [Google Scholar] [CrossRef]
- Thuiller, W.; Lavorel, S.; Araujo, M.B. Niche properties and geographical extent as predictors of species sensitivity to climate change. Global. Ecol. Biogeogr. 2005, 14, 347–357. [Google Scholar] [CrossRef]
- Guisan, A.; Lehmann, A.; Ferrier, S.; Austin, M.; Overton, J.; Aspinall, R.; Hastie, T. Making better biogeographical predictions of species’ distributions. J. Appl. Ecol. 2006, 43, 386–392. [Google Scholar] [CrossRef]
- Stockwell, D.; Peters, D. The GARP modelling system: Problems and solutions to automated spatial prediction. Int. J. Geogr. Inf. Sci. 1999, 13, 143–158. [Google Scholar] [CrossRef]
- Phillips, S.J.; Anderson, R.P.; Schapire, R.E. Maximum entropy modeling of species geographic distributions. Ecol. Model. 2006, 190, 231–259. [Google Scholar] [CrossRef]
- Hernandez, P.A.; Graham, C.H.; Master, L.L.; Albert, D.L. The effect of sample size and species characteristics on performance of different species distribution modeling methods. Ecography 2006, 29, 773–785. [Google Scholar] [CrossRef]
- Hijmans, R.J.; Graham, C.H. The ability of climate envelope models to predict the effect of climate change on species distributions. Globle Chang. Biol. 2006, 12, 2272–2281. [Google Scholar] [CrossRef]
- Phillips, S.J.; Dudík, M. Modeling of species distributions with Maxent: New extensions and a comprehensive evaluation. Ecography 2008, 31, 161–175. [Google Scholar] [CrossRef]
- Li, X.; Li, J.; Huang, P.; Wei, F.; Cui, H.; Van der Werf, H. Lauraceae. In Flora of China; Wu, C.Y., Raven, P.H., Hong, D.Y., Eds.; Science Press: Beijing, China; Missouri Botanical Garden Press: St. Louis, MO, USA, 2009; Volume 7, p. 102. [Google Scholar]
- Sun, J. Study on Habitat Characterization and Regionalization of Sassafras tzumu (Hemsl.) Hemsl. Community in Zhejiang. Master’s Thesis, Zhejiang Agriculture & Forestry University, Zhejiang, China, 2018. [Google Scholar]
- Hou, Y.L.; Chang, H.S.; Wang, H.C.; Wang, S.Y.; Chen, T.Y.; Lin, C.H.; Chen, I.S. Sassarandainol: A new neolignan and anti-inflammatory constituents from the stem of Sassafras randaiense. Nat. Prod. Res. 2015, 29, 827–832. [Google Scholar] [CrossRef]
- Wang, X.; Yang, S.G.; Yu, F.; Ji, C.F.; Long, C.L.; Jiang, X.M. Research progress of Sassafras tzumu. South China Forest. Sci. 2015, 43, 29–33. [Google Scholar]
- Chinese Virtual Herbarium. Available online: http://v5.cvh.org.cn/ (accessed on 12 February 2019).
- Global Biodiversity Information Facility. Available online: http://www.gbif.org/ (accessed on 12 February 2019).
- Hijmans, R.J.; Cameron, S.E.; Parra, J.L.; Jones, P.G.; Jarvis, A. Very high resolution interpolated climate surfaces for global land areas. Int. J. Climatol. 2005, 25, 1965–1978. [Google Scholar] [CrossRef]
- Geospatial Data Cloud. Available online: http://www.gscloud.cn/ (accessed on 15 February 2019).
- Center for Sustainability and the Global Environment. Available online: http://www.sage.wisc.edu/atlas/index.php/ (accessed on 23 September 2017).
- China Meteorological Data Sharing Service System. Available online: http://data.cma.cn/site/index.html (accessed on 15 February 2019).
- Wu, T.; Song, L.; Li, W.; Wang, Z.; Zhang, H.; Xin, X.; Zhang, Y.; Zhang, L.; Li, J.; Wu, F.; et al. An overview of BCC climate system model development and application for climate change studies. J. Meteorol. Res. 2014, 28, 34–56. [Google Scholar] [CrossRef]
- Yi, Y.J.; Cheng, X.; Yang, Z.F.; Zhang, S.H. Maxent modeling for predicting the potential distribution of endangered medicinal plant (H. riparia Lour) in Yunnan, China. Ecol. Eng. 2016, 92, 260–269. [Google Scholar] [CrossRef]
- Stockwell, D.R.B.; Noble, I.R. Induction of sets of rules from animal distribution data: A robust and informative method of data analysis. Math. Comput. Simulat. 1992, 33, 385–390. [Google Scholar] [CrossRef]
- Phillips, S.J.; Dudík, M.; Elith, J.; Graham, C.H.; Lehmann, A.; Leathwick, J.; Ferrier, S. Sample selection bias and presence-only distribution models: Implications for background and pseudo-absence data. Ecol. Appl. 2009, 19, 181–197. [Google Scholar] [CrossRef]
- Elith, J.; Kearney, M.; Phillips, S. The art of modelling range-shifting species. Methods Ecol. Evol. 2010, 1, 330–342. [Google Scholar] [CrossRef]
- Zhang, K.; Yao, L.; Meng, J.; Tao, J. Maxent modeling for predicting the potential geographical distribution of two peony species under climate change. Sci. Total Environ. 2018, 634, 1326–1334. [Google Scholar] [CrossRef]
- Deb, J.C.; Phinn, S.; Butt, N.; McAlpine, C.A. The impact of climate change on the distribution of two threatened Dipterocarp trees. Ecol. Evol. 2017, 7, 2238–2248. [Google Scholar] [CrossRef]
- Allouche, O.; Tsoar, A.; Kadmon, R. Assessing the accuracy of species distribution models: Prevalence, kappa and the true skill statistic (TSS). J. Appl. Ecol. 2006, 43, 1223–1232. [Google Scholar] [CrossRef]
- Pearson, R.G.; Thuiller, W.; Araújo, M.B.; Martinez-Meyer, E.; Brotons, L.; McClean, C.; Miles, L.; Segurado, P.; Dawson, T.P.; Lees, D.C. Model-based uncertainty in species range prediction. J. Biogeogr. 2006, 33, 1704–1711. [Google Scholar] [CrossRef]
- Tsoar, A.; Allouche, O.; Steinitz, O.; Rotem, D.; Kadmon, R. A comparative evaluation of presence-only methods for modelling species distribution. Diver. Distrib. 2007, 13, 397–405. [Google Scholar] [CrossRef]
- Austin, M. Species distribution models and ecological theory: A critical assessment and some possible new approaches. Ecol. Model. 2007, 200, 1–19. [Google Scholar] [CrossRef]
- Elith, J.; Graham, C.H. Do they? How do they? Why do they differ? On finding reasons for differing performances of species distribution models. Ecography 2009, 32, 66–77. [Google Scholar] [CrossRef]
- Hernandez, P.A.; Franke, I.; Herzog, S.K.; Pacheco, V.; Paniagua, L.; Quintana, H.L.; Soto, A.; Swenson, J.J.; Tovar, C.; Valqui, T.H.; et al. Predicting species distributions in poorly-studied landscapes. Biodivers. Conserv. 2008, 17, 1353–1366. [Google Scholar] [CrossRef]
- Sánchez-Flores, E. GARP modeling of natural and human factors affecting the potential distribution of the invasives Schismus arabicus and Brassica tournefortii in ‘El Pinacate y Gran Desierto de Altar’Biosphere Reserve. Ecol. Model. 2007, 204, 457–474. [Google Scholar] [CrossRef]
- Larcher, W. Physiological Plant Ecology, 3rd ed.; Springer: Berlin, Germany, 2011. [Google Scholar]
- Long, C.; Song, H. China Diesel Plant; Science Press: Beijing, China, 2012. [Google Scholar]
- Baskin, C.C.; Baskin, J.M. Seeds: Ecology, Biogeography, and Evolution of Dormancy and Germination, 2nd ed.; Elsevier: San Diego, CA, USA, 2014. [Google Scholar]
- Nicotra, A.B.; Atkin, O.K.; Bonser, S.P.; Davidson, A.M.; Finnegan, E.J.; Mathesius, U.; Poot, P.; Purugganan, M.D.; Richards, C.L.; Valladares, F.; et al. Plant phenotypic plasticity in a changing climate. Trends Plant Sci. 2010, 15, 684–692. [Google Scholar] [CrossRef] [PubMed]
- Shi, Y. The Effect of Drought Stress on Growth and Physiological Characteristics of Sassafras Tsumu Seedlings. Master’s Thesis, Zhejiang Agriculture & Forestry University, Zhejiang, China, 2015. [Google Scholar]
- Liu, J.; Hong, W.; Wu, C.; He, D.; Bi, X.; Yan, S. Biomass production and productivity of natural regenerated Sassafras tzumu trees. J. Trop. Subtrop. Bot. 2002, 10, 105–110. [Google Scholar]
- Shen, Y. Nutrient Cycling and Biomass of Natural Secondary Mixed Forest in Subtropical Area. Ph.D. Thesis, Central South University of Forestry and Technology, Changsha, China, 2011. [Google Scholar]
- Jiang, A. Research on the Variation Mechanism of Autumn Leaf Characteristics and Family Evaluation of Landscape Application Value of Sassafras tsum. Master’s Thesis, Chinese Academy of Forestry, Beijing, China, 2016. [Google Scholar]
- Wang, X.Y.; Huang, X.L.; Jiang, L.Y.; Qiao, G.X. Predicting potential distribution of chestnut phylloxerid (Hemiptera: Phylloxeridae) based on GARP and Maxent ecological niche models. J. Appl. Entomol. 2010, 134, 45–54. [Google Scholar] [CrossRef]
- Zimmerman, N.; Edwards, T.; Graham, C.; Pearman, P.; Svenning, J. Species distribution modelling. Ecography 2010, 33, 985–1092. [Google Scholar] [CrossRef]
- Pearson, R.G.; Dawson, T.P. Predicting the impacts of climate change on the distribution of species: Are bioclimate envelope models useful? Global Ecol. Biogeogr. 2003, 12, 361–371. [Google Scholar] [CrossRef]
- Apan, A.; Cadavid, L.S.; Maraseni, T.N.; Salmo, S.G.; Castillo, J.A.A. The Rate, Extent and spatial predictors of forest loss (2000–2012) in the terrestrial protected areas of the Philippines. Appl. Geogr. 2017, 81, 32–42. [Google Scholar] [CrossRef]
- Aryal, A.; Shrestha, U.B.; Ji, W.; Ale, S.B.; Shrestha, S.; Ingty, T.; Maraseni, T.N.; Cockfield, G.; Raubenheimer, D. Predicting the distributions of predator (snow leopard) and prey (blue sheep) under climate change in the Himalaya. Ecol. Evol. 2016, 6, 4065–4075. [Google Scholar] [CrossRef]
- Thomas, C.D.; Cameron, A.; Green, R.E.; Bakkenes, M.; Beaumont, L.J.; Collingham, Y.C.; Erasmus, B.F.; de Siqueira, M.F.; Grainger, A.; Hannah, L.; et al. Extinction risk from climate change. Nature 2004, 427, 145–148. [Google Scholar] [CrossRef] [PubMed]
- Butt, N.; Seabrook, L.; Maron, M.; Law, B.S.; Dawson, T.P.; Syktus, J.; McAlpine, C.A. Cascading effects of climate extremes on vertebrate fauna through changes to low-latitude tree flowering and fruiting phenology. Glob. Chang. Biol. 2015, 21, 3267–3277. [Google Scholar] [CrossRef]
- Hällfors, M.; Aikio, S.; Fronzek, S.; Hellmann, J.; Ryttäri, T.; Heikkinen, R. Assessing the need and potential of assisted migration using species distribution models. Biol. Conserv. 2016, 196, 60–68. [Google Scholar] [CrossRef]
- Deb, J.C.; Phinn, S.; Butt, N.; McAlpin, C.A. Climatic-induced shifts in the distribution of teak (Tectona grandis) in tropical Asia: Implications for forest management and planning. Environ. Manag. 2017, 60, 422–435. [Google Scholar] [CrossRef]
© 2020 by the authors. Licensee MDPI, Basel, Switzerland. This article is an open access article distributed under the terms and conditions of the Creative Commons Attribution (CC BY) license (http://creativecommons.org/licenses/by/4.0/).