Effects of Different Fertilization Regimes on Crop Yield and Soil Water Use Efficiency of Millet and Soybean


 ,
,  and
and 
Abstract
1. Introduction
2. Materials and Methods
2.1. Basic Geographic Information
2.2. Experimental Design and Fertilizer Management
2.3. Sampling and Measurement
2.4. Calculations and Statistics
3. Results
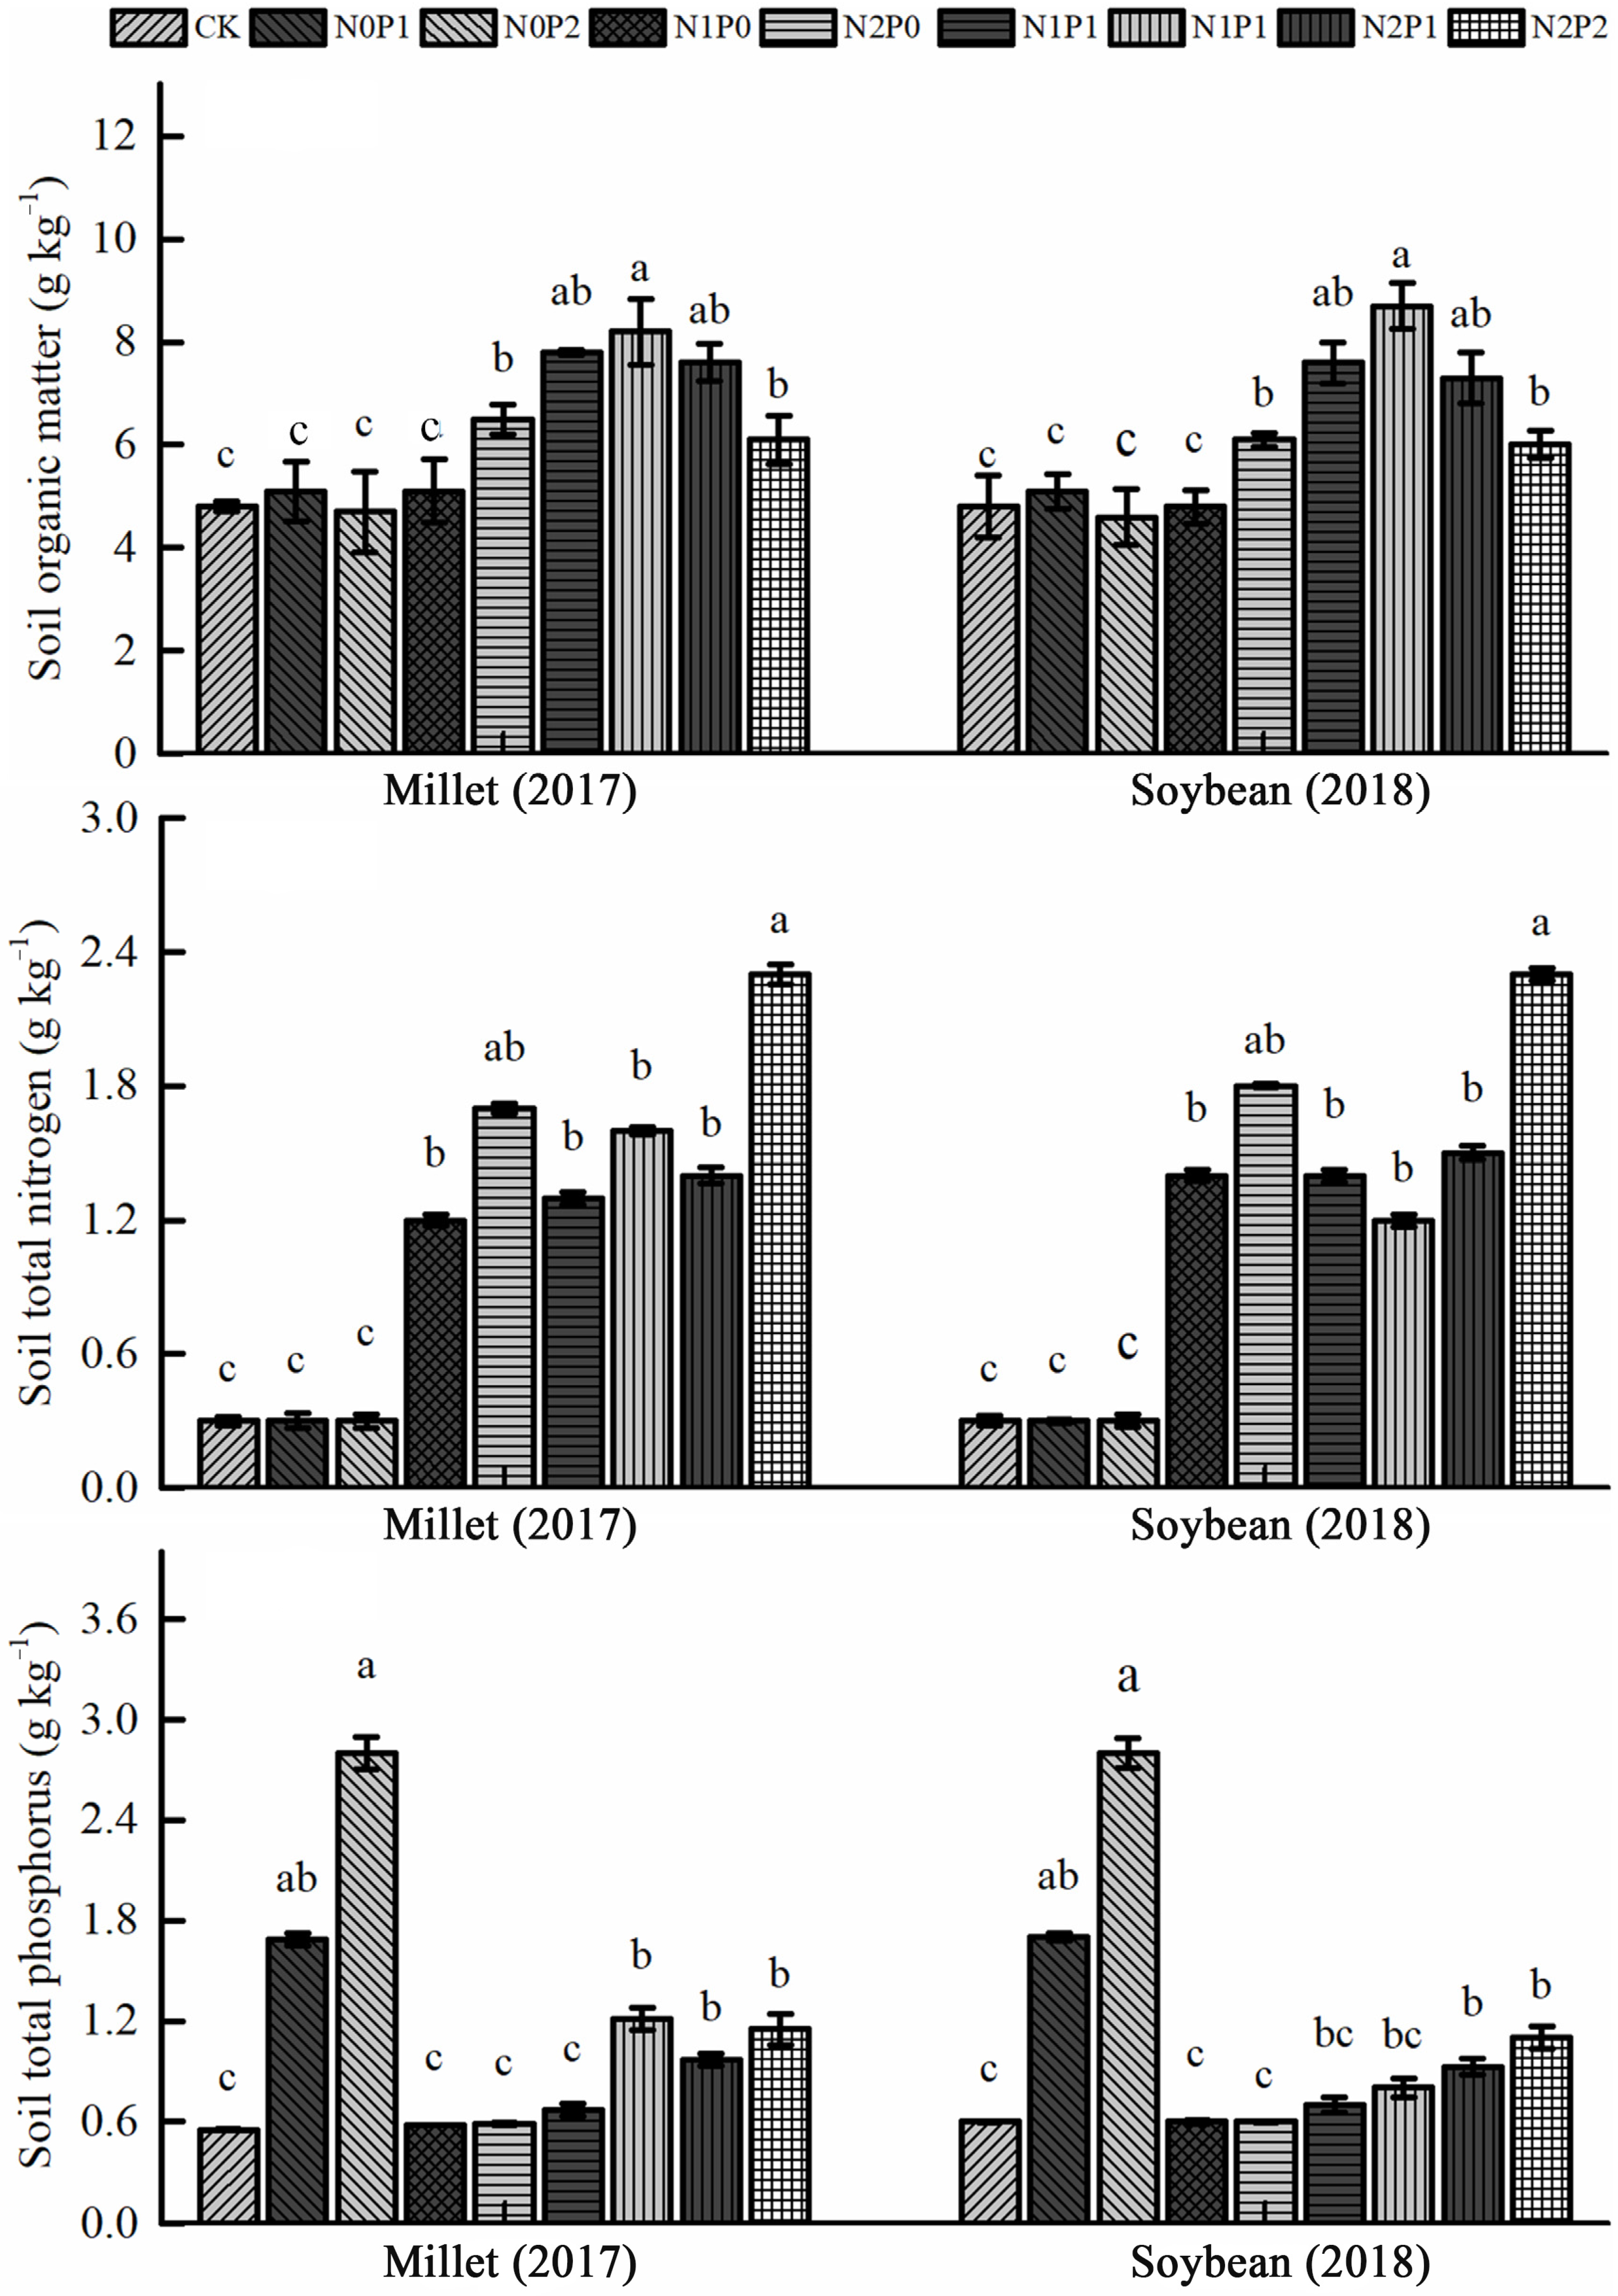
3.1. Soil Nutrients
3.2. Water Consumption (ET) and Soil Water Use Efficiency
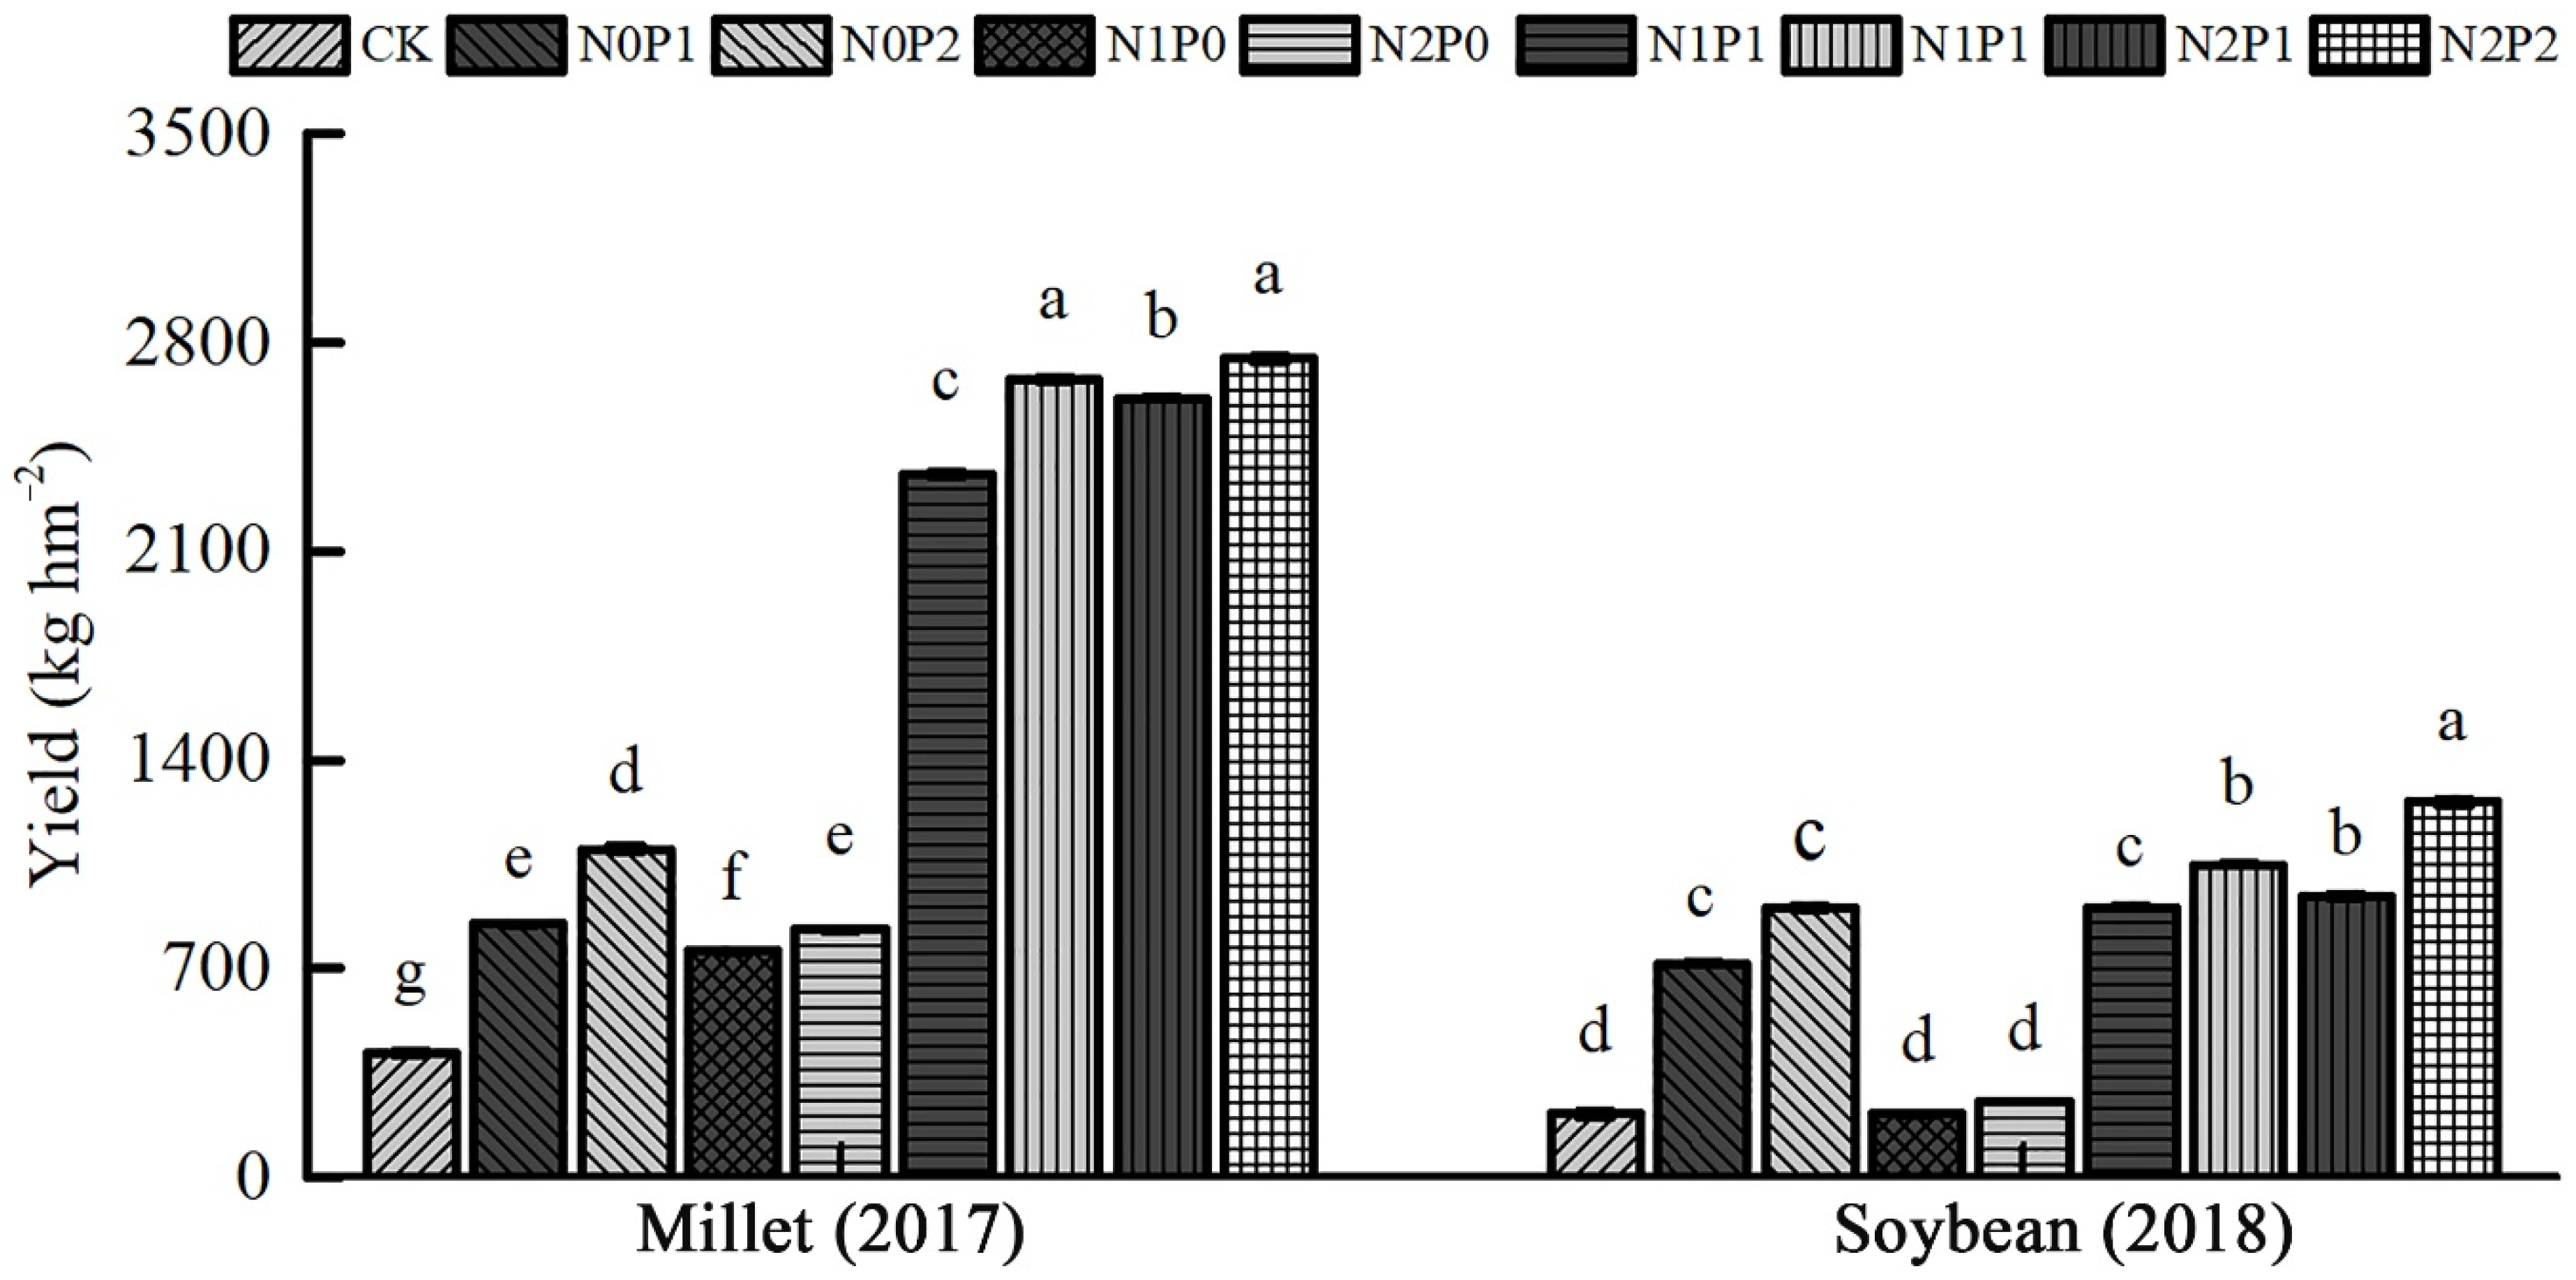
3.3. Crop Yield
3.4. Correlation among Different Parameters
4. Discussion
5. Conclusions
Author Contributions
Funding
Acknowledgments
Conflicts of Interest
References
- Chaab, A.; Savaghebi, G.R.; Motesharezadeh, B. Differences in the zinc efficiency among and within maize cultivars in a calcareous soil. Asian J. Agric. Sci. 2011, 3, 26–31. [Google Scholar]
- Eisvand, H.R.; Kamaei, H.; Nazarian, F. Chlorophyll fluorescence, yield and yield components of bread wheat affected by phosphate bio-fertilizer, zinc and boron under late-season heat stress. Photosynthetica 2018, 56, 1287–1296. [Google Scholar] [CrossRef]
- Amoah, A.A.; Masateru, S.; Shuichi, M.; Kengo, I. Effects of soil fertility management on growth, yield, and water-use efficiency of maize and selected soil properties. Commun. Soil Sci. Plant Anal. 2012, 43, 924–935. [Google Scholar] [CrossRef]
- Zhang, L.; Yan, M.; Li, H.; Ren, Y.; Siddique, K.H.M.; Chen, Y.; Zhang, S. Effects of zinc fertilizer on maize yield and water-use efficiency under different soil water conditions. Field Crops Res. 2020, 248, 107718. [Google Scholar] [CrossRef]
- Li, P.; Zhang, J.; Qi, X.; Du, Z.; Guo, W.; Zhang, Y.; Zhao, Z. The responses of soil function to reclaimed water irrigation changes with soil depth. Desalin. Water Treat. 2018, 122, 100–105. [Google Scholar] [CrossRef]
- Hamdy, A.; Ragab, R.; Scarascia-Mugnozza, E. Coping with water scarcity: Water saving and increasing water productivity. Irrig. Drain. 2003, 52, 3–20. [Google Scholar] [CrossRef]
- Xu, H.; Qu, Q.; Li, P.; Guo, Z.; Wulan, E.; Xue, S. Stocks and stoichiometry of soil organic carbon, total nitrogen, and total phosphorus after vegetation restoration in the loess hilly region, China. Forests 2019, 10, 27. [Google Scholar] [CrossRef]
- Xu, H.; Wang, X.; Qu, Q.; Zhai, J.; Song, Y.; Qiao, L.; Liu, G.; Xue, S. Cropland abandonment altered grassland ecosystem carbon storage and allocation and soil carbon stability in the loess hilly region, China. Land Degrad. 2020, 31, 1001–1013. [Google Scholar] [CrossRef]
- Zhang, K.; Greenwood, Q.J.; White, P.J.; Burns, I.J. A dynamic model for the combined effects of N, P and K fertilizers on yield and mineral composition: Description and experimental test. Plant Soil 2007, 298, 81–98. [Google Scholar] [CrossRef]
- Ye, Y.; Liang, X.; Chen, Y.; Liu, J.; Gu, J.; Guo, R.; Li, L. Alternate wetting and drying irrigation and controlled-release nitrogen fertilizer in late-season rice. Effects on dry matter accumulation, yield, water and nitrogen use. Field Crops Res. 2013, 144, 212–224. [Google Scholar] [CrossRef]
- Kwon, S. Application effect of organic fertilizer and chemical fertilizer on the watermelon growth and soil chemical properties in greenhouse. Korean Soc. Environ. Agric. 2020, 31, 1–8. [Google Scholar]
- Guo, Q.; Cheng, C.; Jiang, H.; Liu, B.; Wang, Y. Comparative rates of wind and water erosion on typical farmland at the northern end of the loess plateau, China. Geoderma 2019, 352, 104–115. [Google Scholar] [CrossRef]
- Zhong, Y.; Shangguan, Z. Water consumption characteristics and water use efficiency of winter wheat under long-term nitrogen fertilization regimes in northwest China. PLoS ONE 2014, 9, e98850. [Google Scholar] [CrossRef] [PubMed]
- Yu, H.; Ding, W.; Luo, J.; Geng, R.; Cai, Z. Long-term application of organic manure and mineral fertilizers on aggregation and aggregate-associated carbon in a sandy loam soil. Soil Tillage Res. 2012, 124, 170–177. [Google Scholar] [CrossRef]
- Wang, J.; Liu, W.Z.; Dang, T.H.; Sainju, U.M. Nitrogen fertilization effect on soil water and wheat yield in the Chinese loess plateau. Agron. J. 2013, 105, 143–149. [Google Scholar] [CrossRef]
- Zhang, Y.; Peng, M.; Wang, J.; Gao, Q.; Cao, M.; Yang, Z. Corn yield response to phosphorus fertilization in northeastern China. Agron. J. 2015, 107, 1135–1140. [Google Scholar] [CrossRef]
- Laxminarayana, K.; John, K.S.; Ravindran, C.S.; Naskar, S.K. Effect of lime, inorganic, and organic sources on soil fertility, yield, quality, and nutrient uptake of sweet potato in alfisols. Commun. Soil Sci. Plan. 2011, 42, 2515–2525. [Google Scholar] [CrossRef]
- Tahir, M.; Khan, A.; Batool, M.; Zeeshan, H.M.; Iqbal, M.; Khan, A.G. Effect of dairy manure and rice planting methods on yield, soil quality, water-use efficiency, and economics of rice and succeeding wheat crop. Commun. Soil Sci. Plan. 2012, 43, 1897–1914. [Google Scholar] [CrossRef]
- Belay, A.; Claassens, A.S.; Wehner, F.C. Effect of direct nitrogen and potassium and residual phosphorus fertilizers on soil chemical properties, microbial components and maize yield under long-term crop rotation. Biol. Fert. Soils. 2002, 35, 420–427. [Google Scholar]
- Buwalda, J.G.; Lenz, F. Effects of cropping, nutrition and water-supply on accumulation and distribution of biomass and nutrients for apple-trees on m9 root systems. Physiol. Plantarum. 1992, 84, 21–28. [Google Scholar] [CrossRef]
- Chen, Y.; Liu, L.; Guo, Q.; Zhu, Z.; Zhang, L. Effects of different water management options and fertilizer supply on photosynthesis, fluorescence parameters and water use efficiency of Prunella vulgaris seedlings. Biol. Res. 2016, 49, 12–21. [Google Scholar] [CrossRef] [PubMed]
- Gowing, J.; Rose, D.; Ghamarnia, H. The effffect of salinity on water productivity of wheat under defificit irrigation above shallow groundwater. Agric. Water Manag. 2009, 96, 517–524. [Google Scholar] [CrossRef]
- Wang, X.; Jia, Z.; Liang, L.; Yang, B.; Ding, R.; Nie, J.; Wang, J. Impacts of manure application on soil environment, rainfall use efficiency and crop biomass under dryland farming. Sci. Rep. 2016, 6, 20994. [Google Scholar] [CrossRef]
- Wang, Q.; Chen, H.; Li, H.; Li, W.; Wang, X.; McHugh, A.D.; He, J.; Gao, H. Controlled traffic farming with no tillage for improved fallow water storage and crop yield on the Chinese loess plateau. Soil Till. Res. 2009, 104, 192–197. [Google Scholar]
- Nelson, D.W.; Sommers, L.E. Total carbon, organic carbon and organic matter. In Methods of Soil Analysis, 3rd ed.; John Wiley & Sons: Hoboken, NJ, USA, 1982. [Google Scholar]
- Bremner, J.; Mulvaney, C. Nitrogen-total: Methods of soil analysis chemical methods part 3. Soil Sci. Soc. Am. 1996, 72, 532–535. [Google Scholar]
- Schimel, J.P.; Weintraub, M.N. The implications of exoenzyme activity on microbial carbon and nitrogen limitation in soil: A theoretical model. Soil Biol. Biochem. 2003, 35, 549–563. [Google Scholar] [CrossRef]
- Manna, M.; Swarup, A.; Wanjari, R.; Ravankar, H.; Mishra, B.; Saha, M. Long-term effect of fertilizer and manure application on soil organic carbon storage, soil quality and yield sustainability under sub-humid and semi-arid tropical india. Field Crops Res. 2005, 93, 264–280. [Google Scholar] [CrossRef]
- Zou, Y.; Fan, J. Review on effect of organic fertilizer on soil fertility. Chin. Agric. Sci. Bull. 2013, 29, 12–16. [Google Scholar]
- Yin, Y.; Ying, H.; Zheng, H.; Zhang, Q.; Xue, Y.; Cui, Z. Estimation of NPK requirements for rice production in diverse Chinese environments under optimal fertilization rates. Agric. Forest Meteorol. 2019, 279, 107756. [Google Scholar] [CrossRef]
- Adimassu, Z.; Langan, S.; Johnston, R.; Mekuria, W.; Amede, T. Impacts of soil and water conservation practices on crop yield, run-off, soil loss and nutrient loss in Ethiopia: Review and synthesis. Environ. Manag. 2017, 59, 87–101. [Google Scholar] [CrossRef]
- Lu, J.; Yang, M.; Liu, M.; Lu, Y.; Yang, H. Nitrogen and phosphorus fertilizations alter nitrogen, phosphorus and potassium resorption of alfalfa in the Loess Plateau of China. J. Plant Nutr. 2019, 42, 2234–2246. [Google Scholar] [CrossRef]
- Chen, Y.; Ren, K.; Su, J.; He, X.; Zhao, G.; Hu, B.; Chen, Y.; Xu, Z.; Lin, Y.; Zou, C. Rotation and organic fertilizers stabilize soil water-stable aggregates and their associated carbon and nitrogen in flue-cured tobacco production. J. Soil Sci. Plant Nutr. 2020, 20, 192–205. [Google Scholar] [CrossRef]
- Yan, W.; Zhong, Y.; Shangguan, Z. The relationships and sensibility of wheat c:n:p stoichiometry and water use efficiency under nitrogen fertilization. Plant Soil Environ. 2015, 61, 201–207. [Google Scholar] [CrossRef]
- Ameen, A.; Liu, J.; Han, L.; Xie, G. Effects of nitrogen rate and harvest time on biomass yield and nutrient cycling of switchgrass and soil nitrogen balance in a semiarid sandy wasteland. Ind. Crop. Prod. 2019, 136, 1–10. [Google Scholar] [CrossRef]
- Samuelson, L.; Kane, M.; Markewitz, D.; Teskey, R.; Akers, K.; Stokes, T.; Pell, C.; Qi, J. Fertilization increased leaf water use efficiency and growth of Pinus taeda subjected to five years of throughfall reduction. Can. J. Forest Res. 2018, 48, 227–236. [Google Scholar] [CrossRef]
- Tamaki, M.; Tashiro, T.; Yamamoto, Y. Effects of shading and fertilized nitrogen levels on the growth, yield components and physicochemical properties of rice. Jpn. J. Crop Sci. 1997, 66, 708–709. [Google Scholar] [CrossRef]
- Ma, N.; Li, T.; Wu, C.; Zhang, E. Effect of long-term fertilization on soil enzyme activities and soil physicochemical properties of facility vegetable field. Chin. J. Appl. Ecol. 2010, 21, 1766–1771. [Google Scholar]
- Tang, H.; Xu, Y.; Sun, J. Soil enzyme activities and soil microbe population as influenced by long term fertilizer management under an intensive cropping system. J. Pure Appl. Microbiol. 2014, 8, 15–23. [Google Scholar]
- De Kauwe, M.G.; Medlyn, B.E.; Zaehle, S.; Walker, A.P.; Dietze, M.C.; Hickler, T. Forest water use and water use efficiency at elevated co\r, 2\r,: A model-data intercomparison at two contrasting temperate forest face sites. Glob. Chang. Biol. 2013, 19, 1759–1779. [Google Scholar] [CrossRef]
- Ibrahim, A.; Abaidoo, R.C.; Fatondji, D.; Opoku, A. Hill placement of manure and fertilizer micro-dosing improves yield and water use efficiency in the Sahelian low input millet-based cropping system. Field Crops Res. 2015, 180, 29–36. [Google Scholar] [CrossRef]
- Roland, K.; Lemke, R.; Desjardins, R.L.; Campbell, C.A.; Zentner, R.P.; Steppuhn, H. Nitrogen and phosphorus effects on water use efficiency of spring wheat grown in a semi-arid region of the Canadian prairies. Can. J. Soil Sci. 2012, 4, 573–587. [Google Scholar]
- Liu, J.; Yang, Y.; Gao, B.; Li, Y.; Xie, J. Bio-based elastic polyurethane for controlled-release urea fertilizer: Fabrication, properties, swelling and nitrogen release characteristics. J. Clean. Prod. 2018, 209, 528–537. [Google Scholar] [CrossRef]
- Fan, T.; Stewart, B.; Yong, W.; Junjie, L.; Guangye, Z. Long-term fertilization effects on grain yield, water-use efficiency and soil fertility in the dryland of Loess Plateau in China. Agric. Ecosyst. Environ. 2005, 106, 313–329. [Google Scholar] [CrossRef]
- Edmeades, D.C. The long-term effects of manures and fertilisers on soil productivity and quality: A review. Nutr. Cycl. Agroecosyst. 2003, 66, 165–180. [Google Scholar] [CrossRef]


| Soil Depth (cm) | Bulk Density | SOM | TN | TP | pH |
|---|---|---|---|---|---|
| 40 cm | 1.387 | 4.053 | 0.234 | 0.588 | 8.42 |
| Experimental Plots | ||||||||
|---|---|---|---|---|---|---|---|---|
| 1 | 2 | 3 | 4 | 5 | 6 | 7 | 8 | 9 |
| CK | N0P1 | N0P2 | N1P0 | N1P1 | N1P2 | N2P0 | N2P1 | N2P2 |
| 10 | 11 | 12 | 13 | 14 | 15 | 16 | 17 | 18 |
| N2P2 | N2P1 | N2P0 | N1P2 | N1P1 | N1P0 | N0P2 | N0P1 | CK |
| 19 | 20 | 21 | 22 | 23 | 24 | 25 | 26 | 27 |
| CK | N0P1 | N0P2 | N1P0 | N1P1 | N1P2 | N2P0 | N2P1 | N2P2 |
| Planting Season | Parameter | Soil Water Consumption | Soil Water Use Efficiency | Yield | Soil Organic Matter | Soil Total Nitrogen |
|---|---|---|---|---|---|---|
| Millet (2017) | Soil water use efficiency | 0.892 ** | ||||
| Yield | 0.896 ** | 1.000 ** | ||||
| Soil organic matter | 0.712* | 0.803 ** | 0.799 ** | |||
| Soil total nitrogen | 0.752* | 0.673 * | 0.678 * | 0.619 | ||
| Soil total phosphorus | 0.120 | –0.017 | –0.017 | –0.332 | –0.427 | |
| Soybean (2018) | Soil water use efficiency | 0.768 * | ||||
| Yield | 0.791 * | 0.999 ** | ||||
| Soil organic matter | 0.701 * | 0.503 | 0.518 | |||
| Soil total nitrogen | 0.647 | 0.240 | 0.266 | 0.440 | ||
| Soil total phosphorus | –0.104 | 0.386 | 0.361 | –0.405 | –0.512 |
© 2020 by the authors. Licensee MDPI, Basel, Switzerland. This article is an open access article distributed under the terms and conditions of the Creative Commons Attribution (CC BY) license (http://creativecommons.org/licenses/by/4.0/).
Share and Cite
Liu, Q.; Xu, H.; Mu, X.; Zhao, G.; Gao, P.; Sun, W. Effects of Different Fertilization Regimes on Crop Yield and Soil Water Use Efficiency of Millet and Soybean. Sustainability 2020, 12, 4125. https://doi.org/10.3390/su12104125
Liu Q, Xu H, Mu X, Zhao G, Gao P, Sun W. Effects of Different Fertilization Regimes on Crop Yield and Soil Water Use Efficiency of Millet and Soybean. Sustainability. 2020; 12(10):4125. https://doi.org/10.3390/su12104125
Chicago/Turabian StyleLiu, Qiang, Hongwei Xu, Xingmin Mu, Guangju Zhao, Peng Gao, and Wenyi Sun. 2020. "Effects of Different Fertilization Regimes on Crop Yield and Soil Water Use Efficiency of Millet and Soybean" Sustainability 12, no. 10: 4125. https://doi.org/10.3390/su12104125
APA StyleLiu, Q., Xu, H., Mu, X., Zhao, G., Gao, P., & Sun, W. (2020). Effects of Different Fertilization Regimes on Crop Yield and Soil Water Use Efficiency of Millet and Soybean. Sustainability, 12(10), 4125. https://doi.org/10.3390/su12104125