Article

Corporate Social Performance: An Assessment Model on an Emerging Market

by
Cătălina Silvia Crișan-Mitra
1,
Liana Stanca
2 and
Dan-Cristian Dabija
3,*
1
Department of Management, Faculty of Economics and Business Administration, Babeș-Bolyai University, RO-400591 Cluj-Napoca, Romania
2
Department of Business Informatics, Faculty of Economics and Business Administration, Babeș-Bolyai University, RO-400591 Cluj-Napoca, Romania
3
Department of Marketing, Faculty of Economics and Business Administration, Babeș-Bolyai University, RO-400591 Cluj-Napoca, Romania
*
Author to whom correspondence should be addressed.
Sustainability 2020, 12(10), 4077; https://doi.org/10.3390/su12104077
Submission received: 20 April 2020 / Revised: 11 May 2020 / Accepted: 13 May 2020 / Published: 15 May 2020
(This article belongs to the Section Economic and Business Aspects of Sustainability)

Abstract

:
This paper investigates the priorities governing large companies in an emerging market regarding corporate social performance (CSP). The authors propose profile patterns of responsible managerial behavior and a framework for evaluating CSP relying on stakeholder theory. The study relies on a statistical analysis which is designed to examine the significance of corporate social responsibility (CSR) practice as it emerges from company business strategies. Taking the form of an empirical study involving 87 managers, this work relies on the cluster analysis theory, identifying six behavioral patterns when considering CSR practices: “lethargic”, “compliant, “pragmatist”, “auditor”, “formalist”, and “performer”. The cluster typology indicates the complexity of CSR practices and highlights the role of CSR in company strategy development. The proposed assessment model is intended to empower CSP diagnosis, while supporting management towards achieving sustainable growth.

1. Introduction

The contribution of CSR to societal development is a topic of extensive debate in modern society. Despite the proliferation of CSR in academic and organizational spheres, empirical evidence in this area remains limited, particularly in the context of emerging countries. Research indicates that emerging markets require approaches, structures and institutions to effectively advance social and environmental components into a value creation agenda [1,2,3,4,5].
In the attempt to achieve sustainable development, a profound knowledge of the methods used to evaluate the economic, social and environmental impact of organizations on society is a guiding factor [6,7]. Moreover, extensive data analysis will enable the validation of the assessment tools, emphasizing the correlation between the items considered [8]. Thus, following the literature [1,3,9,10,11,12,13,14], we argue that the CSR approach must be a part of organizational business strategy due to the differences that currently exist in terms of CSR practices between emerging countries and developed countries [4,15].
Increasingly, CSR practices are playing a central role in company strategies due to their effect on reputation, and subsequently on firms’ performance [16]. The communication of CSR measures is of critical importance and needs to be carefully managed in interactions with stakeholders [17]. Stakeholders tend to appreciate those companies that show a consistent attitude towards social and environmental dimensions more, encouraging managers to adopt unwavering long-term strategies [18]. Nevertheless, managerial practices are not always in the best interests of the organization, nor do they automatically lead to social and environmental impacts [19]. To facilitate CSP evaluation, our paper proposes an assessment model which highlights the CSR behavioral types that managers develop when making a conscious effort to render their organizations more trustworthy for stakeholders. Furthermore, to demonstrate the existence of multivariate profiles, we evaluate our results in correlation with previous findings [20,21], relying on the K-means clustering method. For this purpose, the authors developed an analytical instrument to evaluate corporate social performance (CSP), where all latent items were measured using several elements, as recommended by Churchill [22]. The research instrument was built taking into consideration the complexity of CSR practices and the strategic role of CSR in the overall strategy of relevant companies. Because we expect to identify patterns in CSR firms’ activities, several possible CSR scenarios are considered.
Romania is used as an example to illustrate CSP instruments and methods, as the results might be useful for planning market development in both developed and emerging markets. The paper focuses on two interrelated goals: (1) emphasizing the readiness of large companies from an emerging market with a sharp GDP increase (Romania) to embrace CSR practices by both domestic and international companies; and (2) providing a model for evaluating CSP of companies operating in emerging countries to facilitate comparison and corrective measures in order to increase performance. The measurement tool allows the evaluation of organizational CSP based on six different behaviors: “lethargic”, “compliant, “pragmatist”, “auditor”, “formalist”, and “performer”.
The article includes four main sections. First, the literature review addresses CSP and depicts the reality of CSR and CSP in emerging markets in terms of the theory and practice. Second, the research design section outlines the research instrument, the econometrical computations performed, the data collection process and the thematic content analysis. Next, we present the research results and discuss them in the context of the state-of-the-art literature, showing the originality and novelty of our approach. Finally, the theoretical and managerial implications of the paper along with its limitations and future research perspectives are presented.

2. Literature Review

2.1. CSR and CSP

CSR emphasizes the role of companies in the development of the surrounding community [23]. It can also become a good means of achieving higher performance and a source of competitive advantage [24,25]. The benefits of coherent, long-term CSR practices are impossible to ignore [26], underlining the symmetry between economic, social and environmental responsibility [27,28]. CSR is a necessary result of business success and manifests itself based on policies and practices that are consistent with society’s resources [23]. CSR represents a company’s general, coherent approach towards preserving society’s resources and providing the surrounding community with a higher quality of life, enabling companies to voluntarily take full responsibility for the development of society. As a result, measuring CSP will afford a much clearer understanding of the perspectives of large companies on CSR, providing a multidimensional view due to the different behaviors exhibited and the multidisciplinary nature of their approaches [29,30,31].
The literature emphasizes various aspects of the relationship between CSR and company performance in terms of being strong and positive [6,29,30,32,33,34,35], negative [36,37,38,39], or non-existent [40,41,42]. On the other hand, one should remember that the CSR concept does not relate to business entities only, but also to public sector organizations [43]. CSR’s intricacy and its effects require a multidimensional approach to sustain best practices. CSR practices reconfigure business strategies towards the environment and society on four levels: economic, legal, ethical and philanthropic [44]. Socially responsible actions can be divided into three different levels: institutional, organizational and individual [45]. Companies must make an in-depth consideration of the effects of their CSR programs on organizational performance and on stakeholder activity [46] and propose a methodology that integrates economic, social and environmental factors in the company’s overall strategy to increase corporate social performance. Companies should consider a variety of different stakeholders when evaluating CSP. Measuring CSP must include indicators that quantify employee working conditions, harmful emissions, relationships established with primary stakeholders (e.g., shareholders, customers, suppliers, employees and the local community), and a wide range of other social and environmental aspects [47]. CSP must also involve the accountability of stakeholders and volunteers [48]. A proper market-value approach must additionally encompass features such as culture and a country’s stage of economic development [49,50,51]. When analyzing CSP, other dimensions must be considered, such as a company’s relationship with the community, the diversity of social programs, employee relations, environmental impacts, the human rights approach and the degree to which the company’s products meet social and environmental standards [52]. Institutional mechanisms drive a company’s approach towards CSR [53]. Companies with a stable CSR approach tend to gain more natural consumer loyalty [54]. Employees are highly relevant stakeholders, not only in the implementation and development of CSR initiatives, but also because of how the company’s CSR policy positively affects them [55,56]. Peloza and Shang [57] proposed four aspects of this: (1) “social”, at the local community and society level; (2) “labor”, achieved by their own employees; (3) “environment”, involving habitat and the natural environment; and (4) “governance”, to ensure transparent and independent corporate governance.
Schreck [58] studied the bi-directional causality between social and financial performance. CSR procedures should be standardized and institutionalized using rules, norms and established practices to provide transparency concerning social and environmental impacts, as well as compliance with national and international regulations [12,47]. CSR models need to ensure management support and company performance [24,46]. Thus, developing precise instruments and structures to assess CSP will facilitate communication with stakeholders [59,60,61]. Using an integrative model will make it possible to focus on the socially responsible practices of CSR in day-to-day business with all stakeholders [55,62].
The multidimensional context of CSR allows researchers to focus on different behavior patterns, such as planning, assessment and the inducements of CSR, covering a wide range of CSR activities. Different authors consider the interrelation between individual CSR dimensions and company activities in various areas, such as strategy, control, or performance [3,9,12,13,14]. Nevertheless, few researchers [57,58,63] have analyzed the distribution of corporate efforts across the dimensions of CSR. However, it should also be noted that, while companies utilize different sets of instruments in order to be regarded as ethical organizations (e.g., codes of ethics, ethical values and norms), business practice shows that these companies often operate in completely different ways [64].

2.2. CSR in Emerging Markets

Increasingly, companies operating in emerging markets are working to strengthen their CSR profile in the struggle to pursue trustworthy trade partnerships, not only with developed but also within emerging markets [10]. A vital aspect of CSR practices’ success is management readiness to sustain social causes for financial gain and tax reasons [65,66,67]. Economic and technical demands in emerging markets are more intense than social and cultural demands, which is why the approach of corporations towards CSR has become more reactive as opposed to proactive [68]. Weak institutional environments in which tax fraud, mistrust and corruption are prevalent often determine the approach undertaken in emerging countries, which is why the nature of CSR there differs considerably compared to that in more developed countries [69]. With a tendency to be less formalized, CSR activity in emerging countries is more philanthropic, rooted in cultural and religious values, and primarily oriented toward local communities [30,49,70,71].
Multinational companies are more concerned with implementing CSR practices on a global level and less concerned about their local visibility [72]. Domestic companies pursue a more specific approach towards community needs and standards [73,74]. Leonidou et al. [75] recognized five main components to driving sustainability in emerging markets: external and internal drivers, management, performance outcomes, marketing aspects, and consumer orientation. In pursuing sustainable development in emerging economies, CSR should be promoted through collaboration with specialized institutions and/or associations and non-governmental organizations (NGOs), allowing the speeding up of social and environmental progress, as in emerging countries [76].
Vested interests pursued under the guise of CSR policy can diminish the credibility and legitimacy of a company’s CSR approach [1,77]. Emerging countries face various challenges in satisfying even the most basic daily needs of their population, including access to education by socio-economically disadvantaged children, poor medical healthcare and low quality of life in rural areas. Such deficiencies cause stakeholders, such as employees, the local community, authorities and non-profit organizations, to lower their expectations [70].
Ali et al. [4] noted essential differences between the determining factors of CSR disclosure in developed and developing countries, showing that in developing countries, CSR reporting is controlled mostly by influential stakeholders from foreign markets. Moreover, little pressure is perceived from the public for CSR disclosure, due to the lack of knowledge about social and environmental domain request programs to raise awareness. Ting et al. [15] examined environmental, social and governance influences on financial performance. They discovered that emerging market firms had more environmental, social and governance initiatives when it came to resource use, workforce, human rights and CSR strategies, while developed market firms had significantly higher community scores, reflecting preoccupation with preserving public health and business ethics perpetuation.

2.3. Romania: the Research Context

This paper investigates an emerging market from Eastern Europe—Romania—for several reasons. Romania, a former communist market and now a member of the European Union, is receiving increased attention from international companies, as it has exhibited one of the most significant growing economies in recent years [78,79]. Romania is also an attractive marketplace for companies with online activities, as the average connection speed was estimated as fourth worldwide in December 2019 [80], allowing organizations to interact better with stakeholders, customers and staff. Of course, Romania still faces significant sustainability challenges, such as the exploitation of raw materials and cheap labor, high levels of energy consumption, imports, air and water pollution, and substantial environmental risks [81]. Different generations of Romanian consumers are becoming increasingly aware of their role in sustainability and their contribution to protecting the environment by choosing to buy from sustainable-oriented organizations [82]. However, the poor living standards of low-income consumers may cause them to re-evaluate their preference for highly CSR-oriented companies [8,70,83].

3. Research Methodology

3.1. Research Design

The purpose of our research was to identify patterns in managerial behavior leading to higher CSP. Therefore, we followed some specific steps [22]: designing and developing the research instrument (questionnaire) based on the technical literature, applying the research instrument, collecting data, and analyzing the data.
The questionnaire used a multidimensional approach, relying on different perspectives of the literature. The items used to measure the most relevant CSR factors and indicators included the economic, social and environmental practices of the companies, external trends, and the degree of formalization of CSR practices [84]. CSP was measured using latent items, while others were adapted to suit the purpose of the study. The complex and extensive approach towards CSR highlights its relevance in the overall decision-making process [85]. In the operationalization of items, we relied on the scales and findings of previous research [1,39,46,47,48,52,83,86,87,88,89,90]. Besides the elements proposed, the authors introduced the category of external factors [91]: items such as “industry trend regarding the practices meant to promote sustainable development”, “customer pressure on social protection and environment”, and “current economic conditions”. In the category of internal factors [92], other items were introduced, such as “the degree of company internationalization”, “company’s implication in educating customer consumption behavior”, and “board degree of independence” [46,83,86,87,88,89,91,92].
A model was developed and empirically tested to explain the CSP factors/indicators, as presented in Table 1. All items were measured on a five-point Likert scale (1—total disagreement, 5—total agreement), and were operationalized according to the literature.
Our experimental approach was developed based on a list of companies retrieved from a database which contains all companies operating in Romania [93]. Each company was only represented once in the sample even if it had more than one subsidiary in Romania. We contacted 1046 large companies (with more than 249 employees) [94,95]. In total, 115 questionnaires were retrieved, only 87 of which could be validated, representing under 10% missing data [22]. Because employees are arguably in a better position to describe the authenticity of CSR efforts due to their views and tacit knowledge [56], respondents solely comprised CSR representatives and HR managers from the companies. The collection of data followed the procedure recommended by Dillman [96], adapted to a Romanian context. First, we sent a one-page notification presenting our research scope and objectives and requesting participation in the survey. Representatives of companies who agreed to participate then received a package with a covering letter, an online questionnaire and guide documentation. As business representatives, companies are often reluctant to participate in a research study, and only 87 valid questionnaires could be obtained. While this represented a considerable success rate, it was simultaneously a major limitation of our study. To test the non-response bias, we compared all latent and control items for the first third of respondents (n = 28) with the last third (n = 29); i.e., company turnover and type of business (family-owned, listed, subsidiary or headquarters). The t-tests indicated no significant differences between the two groups (P > 0.1), suggesting that non-response bias was not a significant concern in this study.
The research instrument was designed to conduct a survey in which all latent items were measured using several elements [22]. The purpose of the research instrument was to identify the most relevant factors used to evaluate CSR behavior in large companies. In summary, we identified noticeable patterns in CSR firms’ activities. Therefore, we expected to find several possible CSR scenarios of managerial profiles: (a) they could become more committed to CSR in general; (b) they could shift away from the even/diffuse profiles and more toward the focused profiles; (c) they could shift away from focused profiles to even profiles; or (d) they could shift between focused or unfocused profiles.

3.2. Research Approach Steps

The response processing was performed by applying mathematical models and statistical methods. To test the statistical hypothesis of the research, we used SPSS 17.0 (for the descriptive statistics, reliability/validity, and factor analysis) and Statistical 7.0 (for the cluster analysis). We used Statistical 7.0 because it offers the possibility of developing cluster analysis through MacQueen’s K-Mean, which is perfected by Diday’s dynamic clouds method [97]. The statistical investigation was initiated with a marginal homogeneity test, followed by the verification of the questionnaire’s validity, which required the use of reliability tests. The following hypothesis could be postulated [98,99,100]:
H1
There is an agreement between the evaluators’ assessments.
The purpose of this stage was to concentrate the data collected in precise factors by purifying measurement scales and by identifying the main dimensions created through factor analysis using Varimax rotation.
According to the literature [98,99,100], factor analysis assumes that a small number of latent constructs are responsible for the correlations between large numbers of observed variables. Thus, factor analysis was used to identify latent constructs that could not be directly observed in the studied variables. To select the components of specific factors, a measuring model whose value is greater than 0.6 was considered reliable [98,99,100]. The results of factor analysis, item-to-total correlation, and analysis of internal consistency (Cronbach’s alpha) were used to confirm the factor reliability. Item-to-total correlation measured the correlation of each item to the number of remaining elements within a factor. This approach assumes that the total score is valid; thus, it determines the degree of correlation with the total score of each item. The items with a low correlation, specifically less than 0.5, were removed from the analysis. The investigation continued with an “internal consistency analysis”, according to which the alpha coefficient was a measure of the correlation square between the observed score and the actual score. If alpha was greater than 0.7, this showed high reliability, and if alpha was less than 0.3, there was low reliability [101,102,103]. Next, we computed the principal component analysis (PCA) to select the number of final factors identified and tested multicollinearity in our dataset without loss of information. This analysis as used to transform the variable space into an optimal space [100]. The analysis started with the determination of the Kaiser–Meyer–Olkin test value, which was 0.740, which demonstrated that it was advisable to make a factor analysis. At this stage, we decided whether the instrument used had an average degree of confidence or consistency, meaning that its results were the same over time and could be used in scenarios such as those discussed in this article. The hypotheses formulated in this stage of the analysis are as follows:
H2
The respondents recognized the reliability of the factors/indicators included in the proposed model.
H3
The proposed CSP measurement instrument (survey) has discriminating power.
H4
The variables studied are able to measure the CSP.
H5
CSR factors have a single dimension or more.
Our study continued with a Chi-square test with the aim of identifying if the differences between the agreements correspond with CSR performance. The hypothesis at this stage is as follows:
H6
There are statistical differences within the relationships between the measured attributes considered factors/indicators in Romania by the evaluator (i.e., the proportion in the case of non-existent correlation is not equal to that of total agreement).
The study continued with cluster analysis [97,104]. The last stage of the validation method used was meant to verify the discriminatory power of the analyzed instrument by applying the receiver operating characteristic (ROC) curve [105]. By using the ROC curve procedure, we aimed to test if the attributes included in the study were predictive for the chosen model (i.e., a model to detect the types of CSR firm behavior) in the evaluation of CSR firm performance profiles (see Figure 1). The hypothesis at this stage is as follows:
H7
The research instrument is discriminatory.

3.3. Sample Description

The descriptive analysis involved the calculation of centrality indicators as the common responses to each beneficial effect analyzed: standard deviation (SD), a minimum quantified number of 1 and maximum number of five indicators of normal skewness and kurtosis of data, which the literature recommends [102,103] as valuable indicators for measuring the degree of acceptance of the analyzed items. The higher the index value, the higher the respondent’s acceptance of the indexes in the model to detect the types of behavior preferred by the respondent managers.

4. Results

4.1. Model Consistency

An analysis of the respondents’ perception of the items in the model showed that 19.6% were in total agreement and that 32.9% were in partial agreement. The analysis continued by the evaluation of an agreement test. Popular statistics used in practical testing applications include exact percentage agreement or Fleiss’ kappa analysis [106], Cohen’s [107] kappa correlations, and the intraclass correlation, which were used to assess hypothesis H1; i.e., that there was an agreement between the evaluators’ assessments. To some extent, respondents believed that the factors/indicators were a reliable foundation for the CSP model; more specifically, they provided the same values as the attributes considered. According to Fleiss et al.’s [106] kappa analysis, the result was kappa = 0.333; Z = 66.263 and p-value = 0.001. Therefore, the study indicates moderate agreement in terms of the CSR factors/indicators included in the survey (see Table A1).
As a result of applying the test, we determined that the test was sensitive to the measured characteristics—alpha Cronbach = 0.962; mean = 3.186; standard deviation = 3.286—which shows that the alpha value obtained is significant and suggests that the instrument is adequate for the purpose for which it was built; thus, it can be stated with certainty that the test is one-dimensional. During the procedure of determining the alpha coefficient, we obtained the values of the coefficient to discriminate the existing items within the test. The values and significance of the discriminating coefficient in our study are presented in Appendix A Table A1.
A high degree of acceptance was obtained when analyzing the reliability with a high Cronbach alpha coefficient (0.962) and a 95% confidence interval (CI) of [0.949; 0.973]. Therefore, the assessment made by the respondents was consistent, showing that the respondents recognized the reliability of the factors/indicators included in the proposed model. The result was also validated through the single measures test, which had a value of 0.484; furthermore, the 95% CI (0.409; 0.571) was quite moderate in terms of range [108]. Thus, according to the result of calculating the coefficient reliability, the number of items in the test is correct, and there is no need to increase the items; i.e., the test has a good level of reliability, which means that the questions in the test had the tendency to form an entity by themselves, meaning that hypothesis H2 is valid.
The next step was to analyze the differences between the groups and the interaction effect with the proposed instrument [98,99,100]. Therefore, the authors unilaterally applied the ANOVA test (F = 15.282; p = 0.000), the result of which demonstrated the existence of several differences between items, determined by the respondents’ answers. Therefore, the proposed CSP measurement instrument could successfully accomplish its functions, with a discriminating power confirmed by the Hotelling’s T-square test (F (5,85) = 15.604; p = 0.001), according to which the means of the analyzed items were different to those in Appendix A Table A2. According to the literature [98,99,100], it can be concluded that there are differences between the answers formulated by respondents. Therefore, H3 is valid; i.e, the CSR performance survey can be used in studies such as ours.
The analysis continued with a factor analysis to test the internal validity of the measurement scale used [98,99,100]; i.e., to assess if the considered items rigorously evaluated CSP. After that, a principal component analysis (PCA) was employed to identify the CSR dimensions or any clusters of the analyzed data. This allowed the translation of the variable space into an optimal space [100]. As the Kaiser–Meyer–Olkin test showed a value of 0.740 (>0.7), the factor analysis could be performed [22]. The value of Bartlett’s test of sphericity (569.15; Sig = 0.000) was small enough to reject hypothesis H4, according to which the variables were not correlated. This revealed a strong connection to our study. The next step was to determine how many of the dispersion indicators/factors used for CSR measurement were explained by the extracted factors. The results are available in Appendix A Table A1, according to which most of the variables were well represented by the factorial model used (i.e., hypothesis H5 was validated). The next step was to select the number of principal components to identify the CSR performances. This allowed the identification of six factors/components that met the selection criteria (eigenvalues ≥ 1) [98]. The explained variance of each component was distributed as follows: the value for the first component was 52.53%, the second component was 8.526%, the third component was 6.755%, the fourth component was 6.386%, the fifth component was 4.945%, and the sixth component was 3.708%. All six components explained 82.850% of the variance analysis. Applying the rotation procedure caused changes at the saturation level in each case but did not reduce the number of components. Thus, the the explained variation found the following results: the value of the first component was 20.200%, that of the second component was 17.576%, the third component was 16.854%, the fourth component was 11.885%, the fifth component was 9.208%, and the sixth component was 7.127%; thus, the analyzed variance remained constant at 82.850%.
Our study continued with hypothesis H6; i.e., there are statistics in terms of the respondents’ perceptions regarding the attributes measured (the proportion of poor agreement to absence is not equal to that of total agreement). According to the Chi-square test, as shown in Appendix A Table A3, the alternative hypothesis was accepted and the null was rejected. The test results show differences between the agreement and the lack of agreement regarding the accepting/non-accepting of the items used to measure CSP, but this is not a result of a random sampling variation (the respondents were not guessing the answers). In this context, we focused on identifying the existence of groups of clusters; groups of companies/respondents that had the same opinion regarding the components of a CSP measuring model. Thus, the hierarchical method and K-means clustering method were applied, and according to performance, scores were obtained from six clusters, giving six classes of companies that permitted the evaluation of the well-defined groups. The collated inertia values obtained significantly exceeded the values of intra-class inertia. The result of variance analyses (F test) regarding the p threshold indicated the following variables as the main criteria for dividing companies into clusters (see Appendix A Table A1).
Figure 2 illustrates the interaction between main variables which generate the typologies of the surveyed companies. Thus, the variables that have a significant influence in the cluster configuration process are as follows: V3—“economic performance”, V6—“social practices”, V9—“fraud and false advertising”, V12—“certification schemes”, V15—“customer pressure”, V18—“codes of ethics compliance”, V21—“past anti-corruption/bribery policies”, V24—“external economic trends”, and V27—“board independence”. The remaining variables, even if present, do not have an inherent behavior towards the typologies developed.
Thus, the following correlations were observed:
-
Groups 1, 2, 5 and 6 are correlated with the “degree of internationalization” of the company;
-
Groups 2 and 3 are correlated with the “consumer education process promoted by the company”;
-
Groups 1, 2 and 3 are correlated with “fraud and false advertising”;
-
Group 1 and 4 are correlated with “past anti-corruption/bribery policies”;
-
Groups 2, 4, 5 and 6 are correlated with the “reporting method used for CSP”;
-
Groups 1, 3 and 4 are correlated with “board independence”.
Groups 1 and 2 predominantly register correlations with most of the remaining variables, demonstrating that respondent managers tend to diffuse their CSR practices and are more committed to CSR in general. Groups 3 and 4 register correlations with three of the variables considered, showing that they shift away from even/diffuse profiles toward the focused profiles. Group 5 registers correlations with two of the items, showing that they can shift focused to unfocused profiles depending on the followed intent. Group 6 is correlated with one item, showing a clear focus towards the reporting of CSP, and demonstrating a shift in CSP from a focused to a uniform profile. These differences show that worse-performing groups might focus on several CSR practices, while better-performing groups rely on more focused and uniform CSP behavior.
The analysis continued with the ROC curve to test if the considered attributes were predictive for the model used, with implications for the CSR performance measurement activity (see Figure 3). This test was used to remove zero false positives and zero false negative situations.
The area under the ROC curve quantifies the total capacity of the test to discriminate between those companies that implement CSR practices and wish to embrace CSR and those that are not implementing CSR. The result obtained demonstrated that the area under the curve was significantly different from 0.5, and the p-value is 0.042 (AUC = 0.757 95% CI (0.703; 0.812)). Thus, the model used is discriminatory in 76% of cases. Therefore, we believe that the CSR performance measurement model has a discriminatory power regarding the measurement and classification of companies based on the CSR model. In conclusion, the authors demonstrated that the model would correctly recognize normal situations versus abnormal ones in a manner independent of the respondents, enabling the applicability of the model even in developed countries. Thus, hypothesis H7 is accepted.

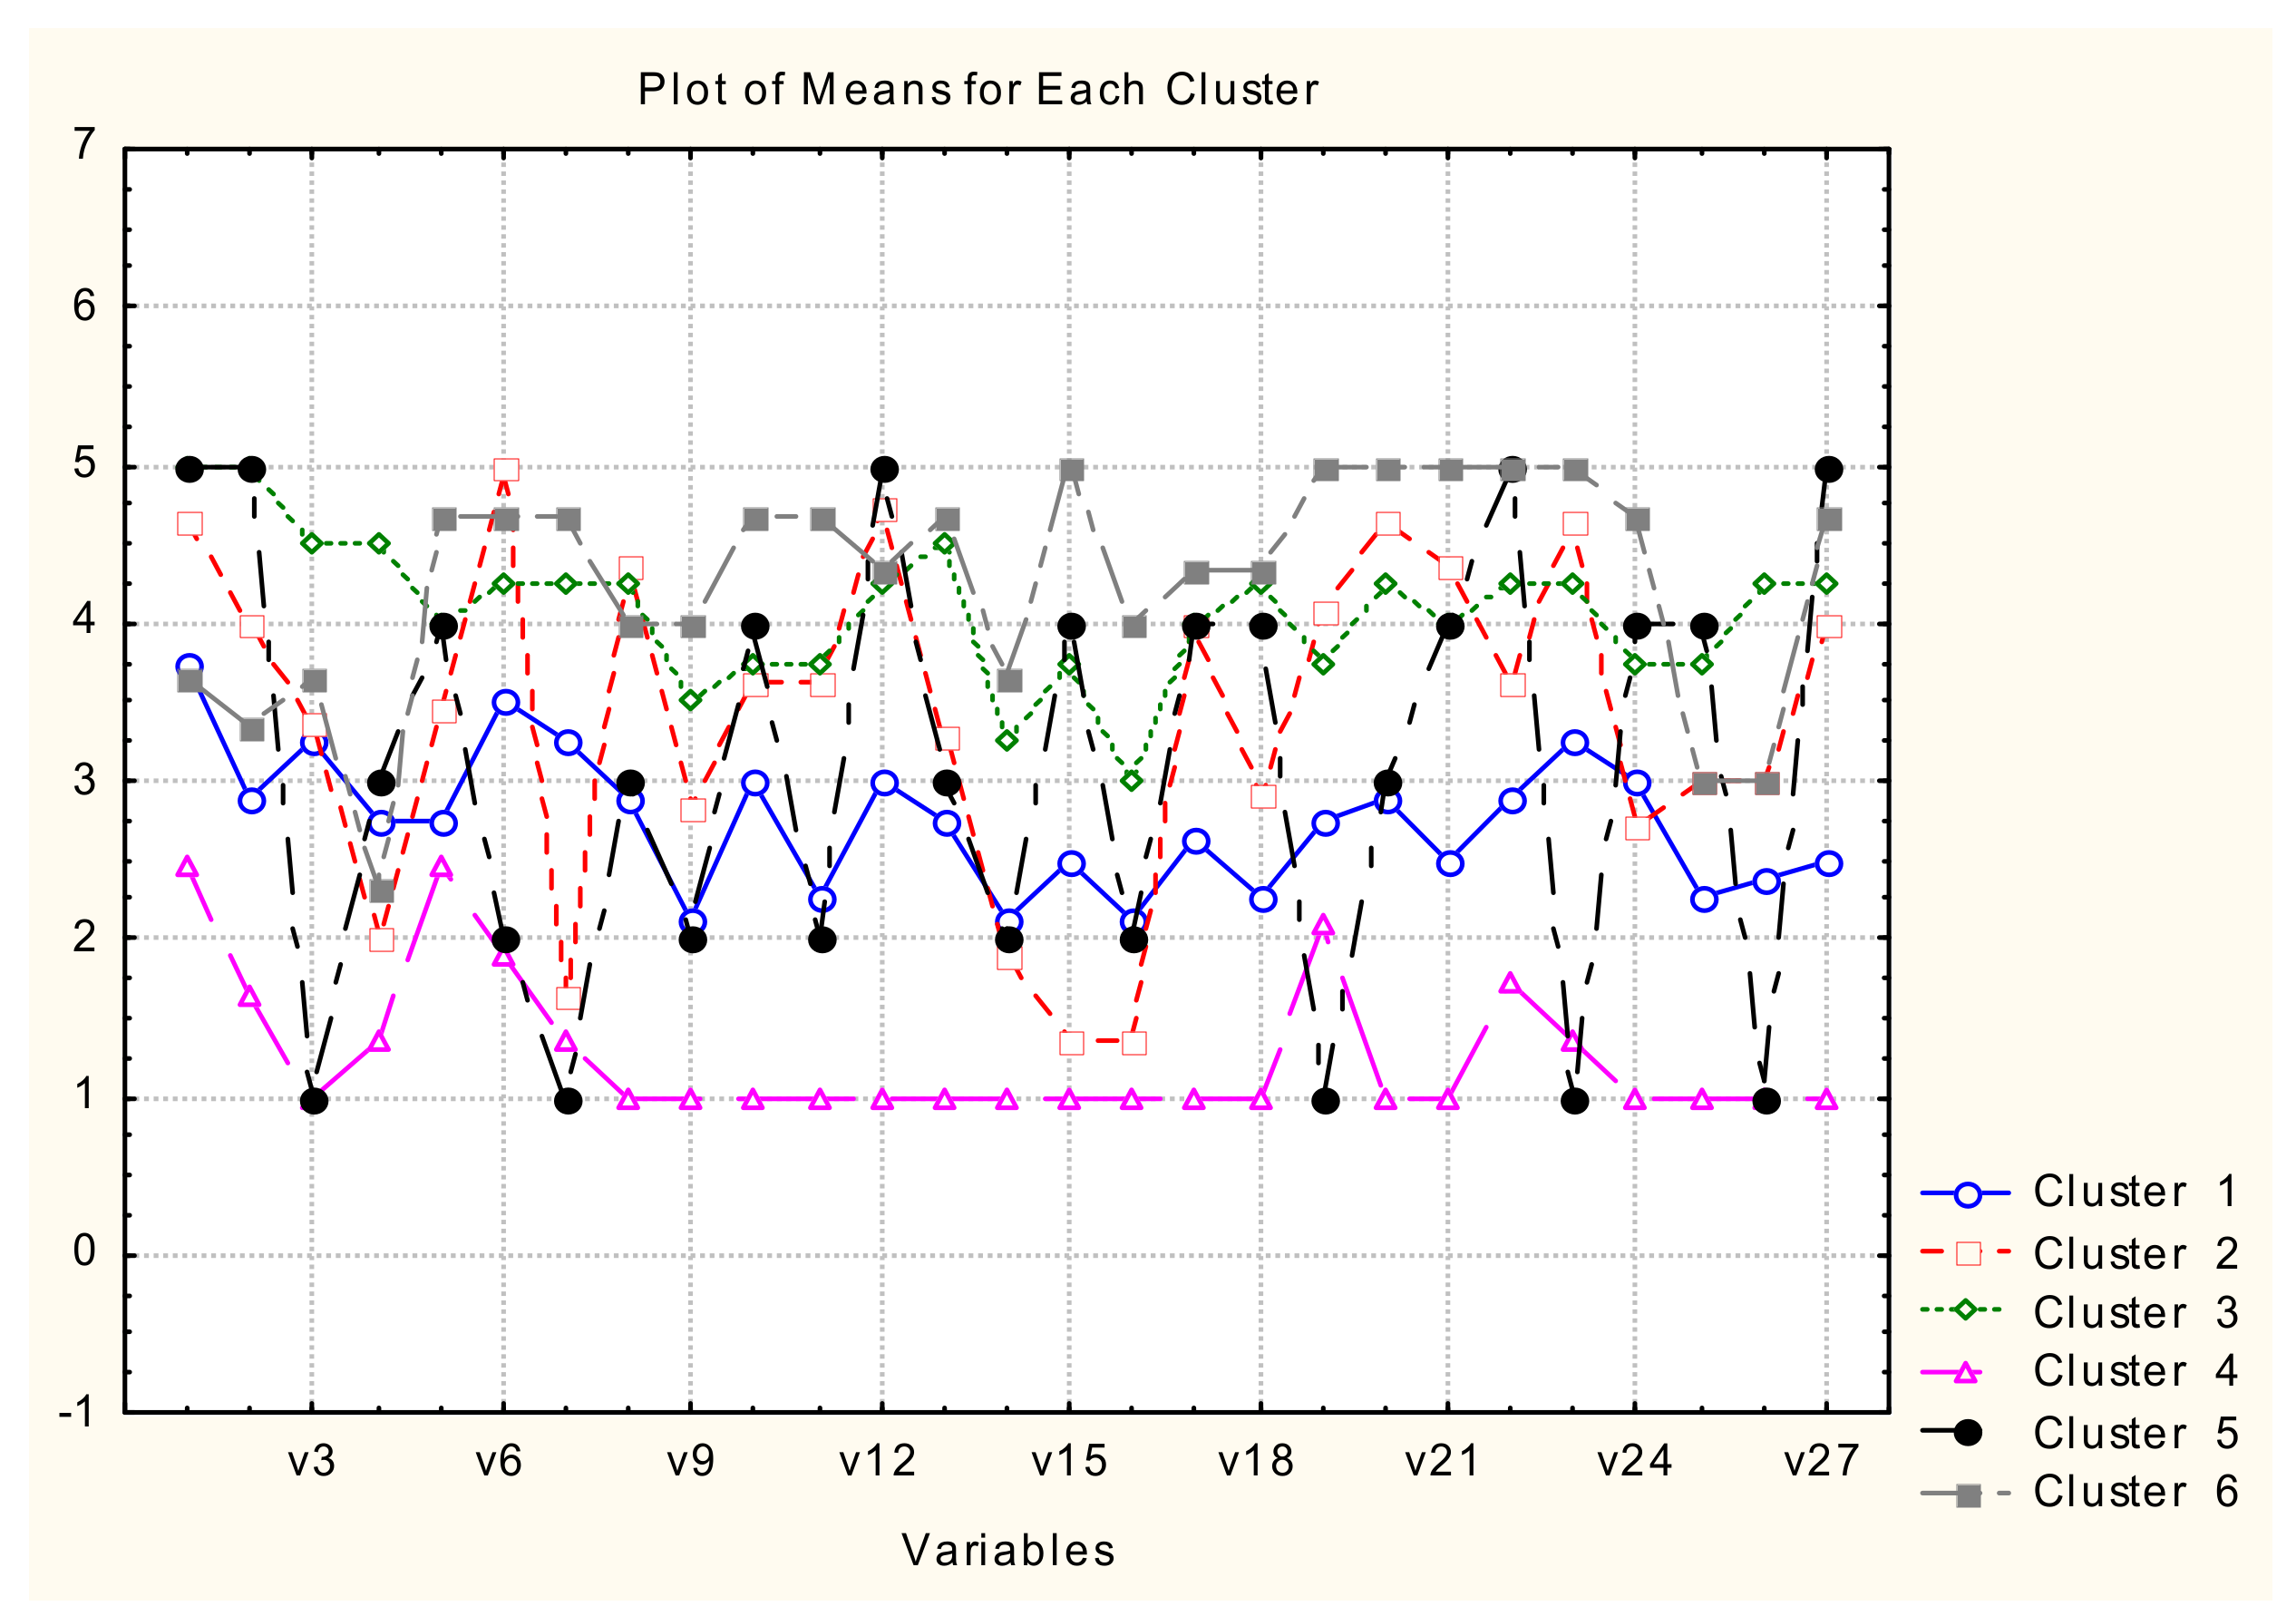
4.2. Description of the Identified Typologies/Clusters

The clusters identified indicate six different typologies as follows:
Typology 1—Lethargic: The variables included in this cluster registered values between 2.5 and 3.75; therefore, the respondent’s attitude towards the CSR performance measurement model is neutral to moderate. A moderate to high acceptance was observed in the case of the following variables: “the extent to which employees are involved in available forms of profit”, “customer pressure (environment and social protection)”, and “Code of Ethics compliance”. In this cluster, it was observed that respondents manifested an aversion to the items “fraud and false advertising”; and “governmental/NGO pressure”. The poor reaction to NGOs and governmental pressure in terms of social and environmental practices and the mostly low importance attributed to fraud and false advertising demonstrates that the CSR approach does not rely on solid fundamentals or on complex methodologies. This typology approaches CSR in a simplistic way—mostly because others do it—without having deep implications for the company’s overall strategy.
Typology 2—Compliant: This includes respondents that showed a high degree of acceptance for the considered variables, such as “shareholder satisfaction towards the social impact of CSR policies”, “equal remuneration for women and men”, “fraud and false advertising”, “business partners’ human rights assessment”, and “degree of board independence in the decision process”. In this group, these are the defining elements of the CSR performance measurement model in an emerging market. The variables registered values between 1.63 and 5, and so respondents’ attitudes towards the proposed CSR measurement model range from disagreement to a high level of acceptance. It was observed that the respondents showed an adverse reaction towards “companies’ internationalization”, “customer pressure (environment and social protection)”, “governmental/NGO pressure”, and “social practices”. This typology approaches CSR by implementing common practices that depend more on what is of main importance at a certain moment. Managers acknowledged the importance of CSRs, with CSR practices being more the result of manipulative behavior to be perceived as a proactive CSR company. From a strategic point of view, this typology tends to consider CSR strategies as being relevant; even so, the methodologies implemented are not complex, and the companies are not relying on clear indicators and methodologies.
Typology 3—Pragmatist: According to this typology, a CSR performance measuring model should include the following variables: “image and reputation in the market”, “market presence”, “procurement practices”, and “use of certifications”. In this cluster, the variables registered values between 3.25 and 5, which illustrates a moderate to high acceptance towards all the variables included in the CSR performance measurement model. This typology uses a more pragmatic approach, considering CSR as being a means to reach greater notoriety and recognition in the market. Thus, CSR performance measurement has at its center the “result of its operations—the product”, relying mostly on methodology and indicators meant to measure the whole value chain from an economic, social and environmental perspective, starting with the suppliers and internal operations and ending with consumer perceptions. From a strategic point of view, this typology recognizes the need to integrate CSR assessment methodologies in a company’s daily operations, not because the company is a driven by the willingness to have a proactive role in sustainable development but because these can bring many financial benefits to the company.
Typology 4—Auditor: The respondents included in this cluster consider that a CSR performance measuring model should rely on “social practices”, “supplier environmental assessment”, “business partners’ human rights assessment”, and “industry trends regarding sustainable development”. In this cluster, the variables registered values between 1 and 2.45, illustrating a null to neutral degree of acceptance towards variables included in the model of CSR performance measurement. According to this typology, CSR performance measurement models should rely on companies’ and business partners’ willingness to meet the standards imposed as regards environmental standards and human rights, with CSR activity being more associated with complying with the legislation and international trends. Thus, from the strategic point of view, CSR’s role in gaining a competitive advantage is not deeply acknowledged. Nevertheless, the practices implemented demonstrate a certain degree of recognition of the implications of CSR on companies’ daily operations.
Typology 5—Formalist: The respondents from this category show a high degree of acceptance towards the following variables: “socially responsible investments”, “committees, forums, panels, departments, etc. involved in CSR”, and “report type, format and verification of CSR performance”. This group considers these variables as being representative in CSR performance measurement models within an emerging market. In this cluster, the variables registered values between 1 and 5, which shows that respondents’ attitudes towards the variables included in the CSR performance measurement model vary significantly. In this cluster, the respondents excluded the following elements: “company performance”, “the degree of the company’s level of internationalization”, “industry trend regarding sustainable development”, and “report type, format and verification of CSR performance”. On the other hand, they manifested total acceptance for variables such as ”board independence”, “certification schemes”, “the image and reputation on the market”, and “market presence”. This typology recognizes the major role of CSR in companies’ strategic approaches; thus, CSR performance evaluation models should rely on those structures which are especially created to address social and environmental responsibility. Additionally, companies’ approaches towards CSR imply the use of clear frameworks without making use of them, not only because there is a general trend in terms of CSR, but because they must comply with the standards to reach higher performances. Those companies that have formal departments created to manage CSR are more likely to have a reliable and continuous approach towards it. This typology perceives the need to implement a sustainable approach towards CSR in the long term, making it more likely for them to make CSR a core value in the company’s strategic approach.
Typology 6—Performer: According to this cluster, the variables which are relevant to measure CSR performance in an emerging market are the following: “economic performance”, “the degree of companies’ internationalization”, “consumer education process”, “anti-corruption or bribery policies implemented within the past”, “fraud and false advertising”, “eco labels”, “environmental grievance mechanisms”, “motivating and retaining competent employees”, and “external economic condition”. The variables registered values between 3 and 5, illustrating a moderate to high acceptance towards all the variables included in the CSR performance measurement model. This typology relies on the premise that a CSR performance measuring model must have a triple bottom line approach, which is in line with international trends. This typology can approach CSR from several perspectives, driven by the recognition of its major role in companies’ strategic approaches, but not necessarily relying on the most complex formalities and methods available to approach CSR.
The CSP model used is discriminatory in 76% of the cases, showing that it can be widely used in emerging countries, even if there are some particularities. The clusters identified indicate the complex picture of the large companies that operate in Romania, taking into consideration five dimensions: economic performance, social performance, environmental performance, external trends, and the degree of formalization of the CSR practices. The multitude of typologies identified demonstrates a great variety in the accountability of CSP practices due to factors manifested at an individual, organizational and institutional level.

5. Discussions

Gaining stakeholders’ trust drives managers to expand CSR practices to ensure CSP. Our results propose two high-ranking typologies—the “Performer” and the “Formalist”—that place an emphasis on using CSP to gain the client’s trust (understanding and satisfying their needs as well as providing a response to their interests). CSR positively influences consumer behavior by reinforcing reputation, improving levels of satisfaction, and increasing the level of loyalty towards an organization. It is essential to note that applying these actions is not sufficient: it is essential for these concepts to be rooted in an organization’s strategy instead of being carried out independently. Furthermore, we may consider these activities as an independent, differentiated element regarding the competition, as well as a generator of competitive advantage, owing to their capacity to influence the final decisions of consumers.
The authors believe that the case of Romania can be illustrative for other emerging countries facing transition challenges and which need guidance to enable a positive attitude towards sustainability. The proposed CSP assessment model can be widely used in emerging countries by specialists familiar with the environmental particularities of the market in which the company operates.
The cluster analysis theory enables the identification of different structural patterns of CSR activity along with its dimensions [63]. In the real world, some companies may focus on just one dimension, such as the environment (“going green”) or labor (staff development); others might prefer to split their efforts by contributing equally to two or more dimensions [109]. One would expect that the CSP of large companies in this regard would be more consistent. Our results validate previous findings [63] that consider CSP to be a process of change that evolves from predominantly uniform patterns (using results from 2007) to the predominantly single-focus patterns of CSR (results from 2012). The authors consider that the identified patterns will evolve significantly as the external context changes (e.g., as a result of the COVID-19 crisis), and that the transition process will enable more sophisticated CSP practices in the future.
Our findings bridge the gap between design analyses and the consequences of enabling studies to become action-oriented and solution-focused in providing alternatives to the way companies gain stakeholders’ trust. Organization design is the “explicit effort to improve organizations” [110] because “few organization researchers, for example, have focused on the social problems associated with organizations; they have concentrated on making organizations more efficient or profitable and have not devoted resources to manage the effects that organizations have on their employees, their communities, or their societies” [110].
CSR literature needs to be redirected towards an exploratory, experimental design approach, guided by what may help firms and people to live better [111]. There is an acknowledged need for assessment models that evaluate both observable and unobservable data manager characteristics [112,113]. Corporate culture and managerial culture are unobservable, but their influences are significant determinants for CSR activity [114]. Thus, our study encourages practitioners to engage in business experimentation to develop well-designed CSP initiatives to address the economic, social and environmental challenges that society faces. The implementation of rules, practices and incentives to sustain CSR initiatives positively influences firms’ social performance [115,116]. However, it has been observed that even transparent CSR agreements can create perverse incentives, lowering shareholder value [19]. Increasingly, companies are using CSR contracting to compensate top executives and to avoid the practice of executives using a CSR rating to cover their misconduct. There is therefore a need to monitor executives more closely and provide suitable incentives to compensate their accomplishments [117]. Our assessment model enables the identification of CSR practices, empowering differentiation between managers’ subjective and objective CSR-contingent compensation, and aiding boards and policymakers in designing CSR-contingent compensation contracts.
CSR influences intangibles such as reputation and trust, and CSR reputation can positively contribute to a firm’s performance [16]. CSR reputation represents the public information on a firm’s CSP, and to maximize shareholders’ long-term benefits, managers should consider CSR initiatives as part of their long-term strategy [18]. Our study provides additional opportunities for research. Future research could address the relation between CSR and intangibles (e.g., social capital) that are more volatile and unpredictable and which are challenging to assess. Moreover, gaining more insights into how managers can use the influence of CSR to build true relations will open new ways of attracting stakeholders who want to join the company’s struggle to solve social problems. Our research stresses the importance of scholars advancing the research in the field of intangible effects on managers’ responsible behavior.

6. Conclusions

Emerging markets are fields in which many corporations can gain competitive advantage. Because of the macro and micro particularities in these markets, companies tend to disregard vital issues that could improve social and environmental conditions for citizens [118]. The conclusion derived from the research analyses underlines the point that large companies operating in the Romanian market are familiar with the concept of CSR, but their perspective of CSP varies significantly in terms of the practices and factors of influence considered. According to performance statistical analysis, six typologies of respondents were identified as follows: “Lethargic”, “Compliant”, “Pragmatist”, “Auditor”, “Formalist”, and “Performer”. Each of these typologies emphasizes a different CSP approach, derived from the methodology used and the strategic role of CSR in companies ‘overall strategies.
The statistical analysis could guide future investigations in the field of CSR in emerging countries. The research instrument was developed considering five different dimensions, relying on 27 indexes to evaluate CSP. Thus, we have observed company perspectives in their CSP approach, using a model that has been discriminatory in 76% of the cases.
From a managerial perspective, this research gives a general perspective of CSP in a former communist emerging market—Romania—and represents a first step in enabling future researchers to extend the model and its applicability. Managers can widely use the CSR behavioral assessment model to facilitate change towards greater CSP. It can also contribute to the development of a supportive culture of sustainable development. The findings of the study shed new light on this research direction and could be of interest to board members, managers, practitioners, investors, policymakers, and regulators who are planning to promote the sustainability practices and strategies needed for sustainable development.
This article is the first of a series of steps aiming to provide greater insight into the particularities of CSP in emerging countries, giving a much clearer perspective of the interventions needed at an organizational level to apply trustworthy practices to address stakeholders‘ expectations. Future research will aim to provide methodologies to encourage the use of more complex CSP methods, considering national strategy regarding institutional transparency, corruption prevention measures, evaluation indicators and standards for the distribution of public interest information. Furthermore, the authors intend to replicate this exploratory research in other sectors not yet tested in Romania, such as IT (registers significant growth), and extend our research to Bulgaria and Moldavia.
Several limitations restrict the generalizability of our results: first, there was a low number of respondents due to a lack of availability and willingness of top managers, CSR managers and HR to participate in the study. Secondly, we did not choose respondents from a single domain of activity, which would have given us a more specific overview. Thirdly, we did not control for firm profitability, although we recognize that profitability levels may greatly affect a firm’s social responsibility to its various stakeholders. Future studies in this area may eliminate these shortcomings. The authors would expect to find the six typologies in other emerging countries, with the understanding that small variations might be found from one country to another. Even if these patterns of behaviors are novel perspectives, further discussion on them could be developed.
Even if Romania, as with other emerging markets, has a particular context, the role of CSR was acknowledged at different levels by top managers in the studied companies. This suggests a growing interest in studying and finding new approaches to enable practitioners to use CSR to achieve competitive advantage. Our research is one step in discussing managerial preferences towards CSR and contributes to the recognition of unobserved managerial influence on companies’ corporate social performance. Firm performance and policies used to approach social, environmental, labor/employees and governance issues offer circumstantial evidence about the nature of unobserved managerial attributes, which differ between firms. This enables the evaluation of specific circumstances that lead to high CSP. Our study provides an assessment model that can be used by practitioners and policy makers to better assess CSP, not only to estimate performance relevant to key stakeholders but also to ensure a benchmark tool to compare results with the best in class.

Author Contributions

C.S.C.-M.: conceptualization; investigation; Resources; Writing original draft; L.S.: formal analysis; methodology; software; Writing original draft; D.-C.D.: resources; supervision; Writing review and editing; C.S.C.-M. made substantial contributions to conception and design, acquisition of data, create literature review, analysis and interpretation of data and participated in drafting the article. L.S. made substantial contributions to conception and design, acquisition of data, analysis and interpretation of data and participated in drafting the article. D.-C.D. made substantial contributions to conception and design, interpretation of data and participated in drafting the article and preparing the final version D.-C.D. revising it critically for important intellectual content. All authors gave final approval of the submitted manuscript. All authors have read and agreed to the published version of the manuscript.

Funding

This research received no external funding.

Conflicts of Interest

The authors declare no conflict of interest

Appendix A

Table A1. Fidelity indicators/extraction method: principal component analysis. Cluster results.
Scale Mean if Item DeletedScale Variance if Item DeletedCorrected Item-Total CorrelationInterpretation of Discrimination ItemCronbach’s Alpha if Item DeletedKMO > 0.7Cluster Analysis Variance Analyses - F test
Companies’ image and reputation in the market81.96562.2300.659vgi0.9610.720F = 18.028 **
Market presence 82.43557.9560.656vgi0.9610.873F = 48.039 **
Economic performance 82.66558.3240.643vgi0.9610.826F = 41.828 **
Return of socially responsible investments 83.08573.5900.398gi 0.9630.915F = 26.658 **
Procurement practices 82.60554.5110.827vgi0.9600.750F = 14.694 **
Social practices 82.16556.2560.661vgi0.9610.771F = 25.176 **
The degree of companies’ internationalization82.75558.4600.579vgi0.9620.858F = 49.335 **
Consumer education process promoted by the company82.58550.7350.743vgi0.9600.730F = 27.158 **
Fraud and false advertising83.27552.8070.711vgi0.9600.726F = 16.598 **
Supplier environmental assessment82.58554.0520.666vgi0.9610.921F = 19.866 **
The use of eco labels (e.g., Fair Trade)82.96546.7180.810vgi0.9600.780F = 48.637 **
Certification schemes 82.34553.9340.663vgi0.9610.844F = 39.995 **
Environmental grievance mechanisms82.63546.1390.827vgi0.9590.884F = 46.454 **
The degree to which employees are involved in the available forms of participation in profits83.48563.6190.601vgi0.9610.666F = 16.554 **
Customer pressure on environment and social protection83.02550.7800.638vgi0.9610.837F = 41.678 **
Governmental/NGO pressure83.55563.0060.650vgi0.9610.882F = 38.392**
Shareholder satisfaction towards social impact of CSR policies82.67553.0510.672vgi0.9610.819F = 23.908 **
Codes of ethics compliance82.92546.8590.731vgi0.9600.793F = 26.882 **
Motivating and retaining talented employees82.57560.2970.599gi0.9610.772F = 26.722 **
Equal remuneration for women and men82.40543.6810.772vgi0.9600.923F = 36.991 **
Past anti-corruption/bribery policies82.58543.5150.818vgi0.9590.919F = 21.949 **
Business partners’ human rights assessment82.34556.3730.642vgi0.9610.852F = 67.741 **
Industry trends regarding sustainable development82.30553.7980.692vgi0.9610.910F = 90.603 **
External economic conditions82.70557.6030.781vgi0.9600.792F = 21.073 **
Committees, forums, panels, departments, etc. involved in CSR 83.19563.7180.608vgi0.9610.896F = 32.766 **
Reporting method used for CSR performance83.19558.9380.649vgi0.9610.909F = 98.158 **
Board independence 82.58545.4660.786vgi0.9600.904F = 56.158 **
Note: vgi – very good item; gi – good item; **: p = 0.001.; KMO – Kaiser Meyer Olkin Criterium
Table A2. ANOVA–Hotelling’s T-square test.
Sum of SquaresdfMean SquareFSig
Between People1815.2318222.137
Within PeopleBetween Items333.6372612.83215.2820.000
Residual1790.21521320.840
Total2123.85221580.984
Total3939.08322401.759
Table A3. Result Test Statistics.
ItemChi-Square (a,b)dfp-value
Companies’ image and reputation in the market45.01140.000
Market presence16.04640.003
Economic performance15.12640.004
Return of socially responsible investments9.60940.048
Procurement practices19.72440.001
Social practices25.24140.000
The degree of companies’ internationalization5.64740.227
Consumer education process promoted by the company36.70640.000
Fraud and false advertising19.52940.001
Supplier environmental assessment15.05940.005
The use of eco labels (e.g., Fair Trade)10.82440.029
Certification schemes 11.76540.019
Environmental grievance mechanisms6.58840.159
The degree to which employees are involved in the available forms of participation in profits20.23540.000
Customer pressure on environment and social protection5.41240.248
Governmental/NGO pressure37.41240.000
Shareholder satisfaction towards social impact of CSR policies26.82440.000
Codes of ethics compliance2.35340.671
Motivating and retaining talented employees10.82440.029
Equal remuneration for women and men18.82440.001
Past anti-corruption/bribery policies4.70640.03
Business partners’ human rights assessment16.47140.002
Industry trends regarding sustainable development14.58840.006
External economic conditions37.64740.000
Committees, forums, panels, departments, etc. involved in CSR21.64740.000
Reporting method used for CSR performance12.70640.013
Board independence4.70640.04

References

  1. Dobers, P.; Halme, M. Corporate social responsibility and developing countries. Corp. Soc. Responsib. Environ. Manag. 2009, 16, 237–249. [Google Scholar] [CrossRef] [Green Version]
  2. Cheung, Y.L.; Tan, W.; Ahn, H.J.; Zhang, Z. Does corporate social responsibility matter Asian emerging markets. J. Bus. Ethics 2010, 92, 401–413. [Google Scholar] [CrossRef]
  3. Lund-Thomsen, P.; Lindgreen, A.; Vanhamme, J. Industrial clusters and corporate social responsibility in developing countries: What we know, what we do not know, and what we need to know. J. Bus. Ethics 2016, 133, 9–24. [Google Scholar] [CrossRef]
  4. Ali, W.; Frynas, J.G.; Mahmood, Z. Determinants of Corporate Social Responsibility (CSR) Disclosure in Developed and Developing Countries: A Literature Review. Corp. Soc. Responsib. Environ. Manag. 2017, 24, 273–294. [Google Scholar] [CrossRef]
  5. Popa, I.D.; Dabija, D.C. ISO 26000—A Brief Literature Review. In ISO 26000—A Standardized View on Corporate Social Responsibility; Idowu, S.O., Sitnikov, C., Simion, D., Bocean, C., Eds.; Springer International Publishing: Cham, Switzerland, 2019; pp. 81–92. [Google Scholar] [CrossRef]
  6. Weber, M. The business case for corporate social responsibility: A company-level measurement approach for CSR. Eur. Manag. J. 2008, 26, 247–261. [Google Scholar] [CrossRef]
  7. Mesterházy, Á.; Oláh, J.; Popp, J. Losses in the Grain Supply Chain: Causes and Solutions. Sustainability 2020, 12, 2342. [Google Scholar] [CrossRef] [Green Version]
  8. Crişan-Mitra, C.; Borza, A. Approaching CSR in Romania: An empirical Analysis. Proc. Soc. Behav. Sci. 2015, 207, 546–552. [Google Scholar] [CrossRef] [Green Version]
  9. Welford, R.; Frost, S. Corporate social responsibility in Asian supply chains. Corp. Soc. Responsib. Environ. Manag. 2006, 13, 166–176. [Google Scholar] [CrossRef]
  10. Jamali, D. The case for strategic corporate social responsibility in developing countries. Bus. Soc. Rev. 2007, 112, 1–27. [Google Scholar] [CrossRef]
  11. Peng, M.W.; Wang, D.Y.; Jiang, Y. An institution-based view of international business strategy: A focus on emerging economies. J. Int. Bus. Stud. 2008, 39, 920–926. [Google Scholar] [CrossRef] [Green Version]
  12. Gilbert, D.U.; Rasche, A.; Waddock, S. Accountability in a global economy: The emergence of international accountability standards. Bus. Ethics Q. 2011, 21, 23–44. [Google Scholar] [CrossRef]
  13. García-Rodríguez, F.J.; García-Rodríguez, J.L.; Castilla-Gutiérrez, C.; Major, S.A. Corporate social responsibility of oil companies in developing countries: From altruism to business strategy. Corp. Soc. Responsib. Environ. Manag. 2013, 20, 371–384. [Google Scholar] [CrossRef]
  14. Giuliani, E. Human rights and corporate social responsibility in developing countries’ industrial clusters. J. Bus. Ethics 2016, 133, 39–54. [Google Scholar] [CrossRef] [Green Version]
  15. Ting, I.W.K.; Azizan, N.A.; Bhaskaran, R.K.; Sukumaran, S.K. Corporate Social Performance and Firm Performance: Comparative Study among Developed and Emerging Market Firms. Sustainability 2020, 12, 26. [Google Scholar] [CrossRef] [Green Version]
  16. Miller, S.R.; Eden, L.; Li, D. CSR Reputation and Firm Performance: A Dynamic Approach. J. Bus. Ethics 2018, 163, 619–636. [Google Scholar] [CrossRef]
  17. García-Pozo, A.; Mondéjar-Jiménez, J.; Sánchez-Ollero, J.L. Internet’s User Perception of Corporate Social Responsibility in Hotel Services. Sustainability 2019, 11, 2916. [Google Scholar] [CrossRef] [Green Version]
  18. Li, M.; Minor, D.B.; Wang, J.; Yu, C. A Learning Curve of the Market: Chasing Alpha of Socially Responsible Firms. J. Econ. Dyn. Control 2019, 109, 103772. [Google Scholar] [CrossRef]
  19. Ikram, A.; Li, Z.F.; Minor, D. CSR-Contingent Executive Compensation Contracts. J. Bank. Finance 2019. [Google Scholar] [CrossRef]
  20. Lord, E.; Willems, M.; Lapointe, M.; Makarenkov, V. Using the stability of objects to determine the number of clusters in datasets. Inf. Sci. 2017, 393, 29–46. [Google Scholar] [CrossRef]
  21. Mirkin, B. Core Data Analysis: Summarization, Correlation, and Visualization, 2nd ed.; Springer: New York, NY, USA, 2019. [Google Scholar]
  22. Churchill, G.A., Jr. A paradigm for developing better measures of marketing constructs. J. Mark. Res. 1979, 16, 64–73. [Google Scholar] [CrossRef]
  23. Matten, D.; Moon, J. Corporate Social Responsibility. J. Bus. Ethics 2004, 54, 323–337. [Google Scholar] [CrossRef] [Green Version]
  24. Porter, M.E.; Kramer, M.R. Strategy and Society: The Link between Competitive Advantage and Corporate Social Responsibility. Harv. Bus. Rev. 2006, 84, 78–92. [Google Scholar] [PubMed]
  25. Lakner, Z.; Kiss, A.; Popp, J.; Zéman, Z.; Máté, D.; Oláh, J. From Basic Research to Competitiveness: An Econometric Analysis of the Global Pharmaceutical Sector. Sustainability 2019, 11, 3125. [Google Scholar] [CrossRef] [Green Version]
  26. Di Giuli, A.; Kostovetsky, L. Are red or blue companies more likely to go green? Politics and corporate social responsibility. J. Financ. Econ. 2014, 111, 158–180. [Google Scholar] [CrossRef]
  27. Elkington, J. Cannibals with Forks: The Triple Bottom Lines of 21st Century Business; Capstone Publishing: Oxford, UK, 1997. [Google Scholar]
  28. Stubbs, W.; Schapper, J. Two approaches to curriculum development for educating for sustainability and CSR. Int. J. Sustain. High. Educ. 2011, 12, 259–268. [Google Scholar] [CrossRef]
  29. Waddock, S.A.; Graves, S.B. The corporate social performance-financial performance link. Strateg. Manag. J. 1997, 18, 303–319. [Google Scholar] [CrossRef]
  30. Dabija, D.C.; Băbuţ, R. Empirical Study on the Impact of Service, Communication and Corporate Social Responsability on the Image of Romanian Retail Brands. Procedia Soc. Behav. Sci. 2014, 109, 906–912. [Google Scholar] [CrossRef] [Green Version]
  31. Luo, X.; Wang, H.; Raithel, S.; Zheng, Q. Corporate social performance, analyst stock recommendations, and firm future returns. Strateg. Manag. J. 2015, 36, 123–136. [Google Scholar] [CrossRef]
  32. Freeman, R.E. Strategic Management: A Stakeholder Approach; Pitman: Boston, MA, USA, 1984. [Google Scholar]
  33. Bird, R.; Hall, A.D.; Momente, F.; Reggiani, F. What corporate social responsibility activities are valued by the market? J. Bus. Ethics 2007, 76, 189–206. [Google Scholar] [CrossRef]
  34. Aguinis, H.; Glavas, A. What we know and don’t know about corporate social responsibility a review and research agenda. J. Manag. 2012, 38, 932968. [Google Scholar] [CrossRef] [Green Version]
  35. Saeidi, S.P.; Sofian, S.; Saeidi, P.; Saeidi, S.P.; Saeidi, S.A. How does corporate social responsibility contribute to firm financial performance? The mediating role of competitive advantage, reputation, and customer satisfaction. J. Bus. Res. 2015, 68, 341–350. [Google Scholar] [CrossRef]
  36. Friedman, M. The Social Responsibility Is to Increase Its Profits. New York Times Mag. 1970, 13 September, 32–33. [Google Scholar]
  37. McGuire, J.B.; Sundgren, A.; Schneeweis, T. Corporate social responsibility and firm financial performance. Acad. Manag. J. 1988, 31, 854–872. [Google Scholar] [CrossRef]
  38. Riahi-Belkaoui, A. Executive compensation, organisational effectiveness, social performance and firm performance: An empirical investigation. J. Bus. Financ. Account. 1992, 19, 25–38. [Google Scholar] [CrossRef]
  39. Rasche, A. The limits of corporate responsibility standards. Bus. Ethics: A Eur. Rev. 2010, 12, 280–291. [Google Scholar] [CrossRef]
  40. Aupperle, K.E.; Van Pham, D. An Expanded Investigation in the Relationship Between Corporate Social Responsibility and Profitability. Acad. Manag. J. 1989, 2, 263–274. [Google Scholar] [CrossRef]
  41. King, A.A.; Lenox, M.J. Industry self-regulation without sanctions: The chemical industry’s responsible care program. Acad. Manag. J. 2000, 43, 698–716. [Google Scholar] [CrossRef] [Green Version]
  42. Lee, S.; Kwanglim, S.; Amit, S. Corporate social responsibility and firm performance in the airline industry: The moderating role of oil prices. Tour. Manag. 2013, 38, 20–30. [Google Scholar] [CrossRef]
  43. Sroka, W.; Vveinhardt, J. Nepotism and favouritism in the steel industry: A case study analysis. Forum Sci. Oeconomia 2018, 6, 31–45. [Google Scholar] [CrossRef]
  44. Carroll, A.B. A three-dimensional conceptual model of corporate performance. Acad. Manag. Rev. 1979, 4, 497–505. [Google Scholar] [CrossRef] [Green Version]
  45. Wood, D. Corporate social performance revisited. Acad. Manag. Rev. 1991, 16, 691–717. [Google Scholar] [CrossRef] [Green Version]
  46. Egbeleke, A.A. Strategic corporate responsibility and sustainability performance management model. J. Manag. Sustain. 2014, 4, 92–105. [Google Scholar] [CrossRef]
  47. De Colle, S. CSR and management systems. In Corporate Social Responsibility: Concepts, Accountability and Reporting; Alluche, J., Ed.; Palgrave MacMillan: New York, NY, USA, 2006; pp. 333–353. [Google Scholar]
  48. Dahlsrud, A. How corporate social responsibility is defined: An analysis of 37 definitions. Corporate Social Responsib. Environ. Manag. 2008, 15, 1–13. [Google Scholar] [CrossRef]
  49. Jamali, D.; Zanhour, M.; Keshishian, T. Peculiar strengths and relational attributes of SMEs in the context of CSR. J. Bus. Ethics 2009, 87, 355–367. [Google Scholar] [CrossRef]
  50. Dabija, D.C.; Bejan, B.M. Sustainability reporting of grocery retailers on an emerging market. In New Trends in Sustainable Business and Consumption. In Proceedings of the 4th BASIQ International Conference, Heidelberg, Germany, 11–13 June 2018; Pleșea, D., Vasiliu, C., Murswieck, A., Pamfilie, R., Dinu, V., Tăchiciu, L., Olaru, M., Eds.; Editura ASE: Bucharest, Romania, 2018; pp. 611–619. [Google Scholar]
  51. Vveinhardt, J.; Andriukaitiene, R. Management Culture as Part of Organizational Culture in the Context of Corporate Social Responsibility Implementation. Econ. Sociol. 2017, 10, 294–320. [Google Scholar] [CrossRef] [Green Version]
  52. Sharfman, M. The construct validity of the Kinder, Lydenberg and Domini social performance ratings data. J. Bus. Ethics 1996, 15, 287–296. [Google Scholar] [CrossRef]
  53. Margolis, J.D.; Walsh, J.P. Misery loves companies: Rethinking social initiatives by business. Adm. Sci. Q. 2003, 48, 268–305. [Google Scholar] [CrossRef] [Green Version]
  54. Hsu, K.T. The advertising effects of corporate social responsibility on corporate reputation and brand equity: Evidence from the life insurance industry in Taiwan. J. Bus. Ethics 2012, 109, 189–201. [Google Scholar] [CrossRef]
  55. Remišová, A.; Búciová, Z. Measuring corporate social responsibility towards employees. J. East. Eur. Manag. Stud. 2012, 17, 273–291. [Google Scholar] [CrossRef] [Green Version]
  56. Fryzel, B.; Seppala, N. The effect of CSR evaluations on affective attachment to CSR in different identity orientation firms. Bus. Ethics A Eur. Rev. 2016, 25, 310–326. [Google Scholar] [CrossRef]
  57. Peloza, J.; Shang, J. How can corporate social responsibility activities create value for stakeholders? A systematic review. Acad. Mark. Sci. J. 2011, 39, 117–135. [Google Scholar] [CrossRef]
  58. Schreck, P. Reviewing the business case for corporate social responsibility: New evidence and analysis. J. Bus. Ethics 2011, 103, 167–188. [Google Scholar] [CrossRef]
  59. European Commission. Corporate Social Responsibility: Communication from the Commission to the European Parliament the Council. 2011. The European Economic and Social Committee and the Committee of the regions. Available online: http://eur-lex.europa.eu/legal-content/EN/TXT/?uri=celex%3A52011DC0681Brussels (accessed on 25 May 2012).
  60. Corporate Citizenship. Inclusive Business-The Next Frontier for Corporate Responsibility; Corporate Citizenship: London, UK, 2012. [Google Scholar]
  61. Lu, J.; Ren, L.; He, Y.; Lin, W.; Streimikis, J. Linking Corporate Social Responsibility with Reputation and Brand of the Firm. Amfiteatru Econ. 2019, 21, 442–460. [Google Scholar] [CrossRef]
  62. Swiatkiewicz, O. Market Communication: Ethical and Praxeological Dimensions. Econ. Sociol. 2018, 11, 184–199. [Google Scholar] [CrossRef]
  63. Taran, Z.; Mirkin, B. Exploring patterns of corporate social responsibility using a complementary K-means clustering criterion. Bus. Res. 2020, 1–28. [Google Scholar] [CrossRef] [Green Version]
  64. Lőrinczy, M.; Sroka, W. Theoretical assumptions of the ethical business model. In New Approaches and Tendencies in Entrepreneurial Management. International Conference Proceedings; Nicolescu, O., Plesoianu, G., Costin-Cirstea, A., Eds.; Cambridge Scholars Publishing: Cambridge, MA, USA, 2017; pp. 198–215. [Google Scholar]
  65. Papasolomou-Doukakis, I.; Krambia-Kapardis, M.; Katsioloudes, M. Corporate social responsibility: The way forward? Maybe not! A preliminary study in Cyprus. Eur. Bus. Rev. 2005, 17, 27–263. [Google Scholar] [CrossRef]
  66. Vătămănescu, E.M.; Gazzola, P.; Dincă, V.M.; Pezzetti, R. Mapping Entrepreneurs’ Orientation towards Sustainability in Interaction versus Network Marketing Practices. Sustainability 2017, 9, 1580. [Google Scholar] [CrossRef] [Green Version]
  67. Gazzola, P.; Vatamanescu, E.M.; Andrei, A.G.; Marrapodi, C. Users’ motivations to participate in the sharing economy: Moving from profits toward sustainable development. Corp. Soc. Responsib. Environ. Manag. 2019, 26, 741–751. [Google Scholar] [CrossRef]
  68. Küskü, F. From necessity to responsibility: Evidence for corporate environmental citizenship activities from a developing country perspective. Corp. Soc. Responsib. Environ. Manag. 2007, 14, 74–87. [Google Scholar] [CrossRef]
  69. Kuznetsov, A.; Kuznetsova, O.; Warren, R. CSR and legitimacy of business in transition economies: The case of Russia. Scand. J. Manag. 2009, 25, 37–45. [Google Scholar] [CrossRef] [Green Version]
  70. Crișan-Mitra, C.; Dinu, V.; Postelnicu, C.; Dabija, D.C. Corporate Practice of Sustainable Development on an Emerging Market. Transform. Bus. Econ. 2016, 15, 228–243. [Google Scholar]
  71. Androniceanu, A. Social Responsibility, an Essential Strategic Option for a Sustainable Development in the Field of Bio-Economy. Amfiteatru Econ. 2019, 21, 503–519. [Google Scholar] [CrossRef]
  72. Özen, Ş.; Küskü, F. Corporate environmental citizenship variation in developing countries: An institutional framework. J. Bus. Ethics 2009, 89, 297–313. [Google Scholar] [CrossRef]
  73. Ozdora-Aksak, E.; Atakan-Duman, S. Gaining legitimacy through CSR: An analysis of Turkey’s 30 largest corporations. Bus. Ethics A Eur. Rev. 2016, 25, 238–257. [Google Scholar] [CrossRef] [Green Version]
  74. Tiron-Tudor, A.; Nistor, C.S.; Ștefănescu, C.A.; Zanellato, G. Encompassing Non-Financial Reporting in A Coercive Framework for Enhancing Social Responsibility: Romanian Listed Companies’ Case. Amfiteatru Econ. 2019, 21, 590–606. [Google Scholar] [CrossRef]
  75. Leonidou, L.C.; Katsikeas, C.S.; Fotiadis, T.A.; Christodoulides, P. Antecedents and consequences of an eco-friendly export marketing strategy: The moderating role of foreign public concern and competitive intensity. J. Int. Mark. 2013, 21, 22–46. [Google Scholar] [CrossRef]
  76. Idemudia, U. Corporate social responsibility and developing countries: Moving the critical CSR research agenda in Africa forward. Prog. Dev. Stud. 2011, 11, 1–18. [Google Scholar] [CrossRef]
  77. Chedrawi, C.; Osta, A.; Osta, S. CSR in the Lebanese banking sector: A neo-institutional approach to stakeholders’ legitimacy. J. Asia Bus. Stud. 2020. [Google Scholar] [CrossRef]
  78. Dabija, D.C.; Băbuț, R. Enhancing Apparel Store Patronage through Retailers’ Attributes and Sustainability. A Generational Approach. Sustainability 2019, 11, 4532. [Google Scholar] [CrossRef] [Green Version]
  79. Obucina, V. Romania Shows Fast Economic Growth after 10 Years in the EU. 2020. Available online: https://financialobserver.eu/cse-and-cis/romania/romania-shows-fast-economic-growth-after-10-yearsin-eu (accessed on 12 January 2020).
  80. Speed Test. 2020. Available online: https://www.speedtest.net/global-index (accessed on 11 March 2020).
  81. EIR. The Environmental Implementation Review 2019. Country Report Romania 2019. Available online: https://ec.europa.eu/environment/eir/pdf/report_ro_en.pdf (accessed on 21 January 2020).
  82. Dabija, D.C.; Bejan, B.; Tipi, N. Generation X versus Millennials Communication Behavior on Social Media when Purchasing Food versus Tourist Services. Econ. Manag. 2018, 21, 191–205. [Google Scholar] [CrossRef]
  83. Crișan-Mitra, C.; Borza, A. Social entrepreneurship and corporate social responsibilities. Int. Bus. Res. 2012, 5, 106–113. [Google Scholar] [CrossRef]
  84. Turker, D. Measuring corporate social responsibility: A scale development study. J. Bus. Ethics 2009, 85, 411–427. [Google Scholar] [CrossRef]
  85. Idemudia, U.; Kwakyewah, C. Analysis of the Canadian national corporate social responsibility strategy: Insights and implications. Corp. Soc. Responsib. Environ. Manag. 2018, 25, 928–938. [Google Scholar] [CrossRef]
  86. Egbeleke, A.A. From Carroll’s Pyramid to Elkington TBL: A Move towards Integrated Impact Assessment Driven Corporate Responsibility and Sustainability Performance Reporting System. Int. J. Bus. Manag. Res. 2013, 3, 93–104. [Google Scholar]
  87. De Colle, S.; Henriques, A.; Sarasvathy, S. The paradox of corporate social responsibility standards. J. Bus. Ethics 2014, 125, 177–191. [Google Scholar] [CrossRef]
  88. Gobal Reporting Initiative. 2015. Available online: https://www.globalreporting.org/resourcelibrary/GRIG4-Part1-Reporting-Principles-and-Standard-Disclosures.pdf (accessed on 11 January 2015).
  89. Hutton, J.G.; Goodman, M.B.; Alexander, J.B.; Genest, C.M. Reputation management: The new face of corporate public relations? Public Relat. Rev. 2011, 27, 247–261. [Google Scholar] [CrossRef]
  90. Crișan-Mitra, C.; Dabija, D.C.; Dinu, V. Social Entrepreneurship in Romania: Significance and Models. Montenegrin J. Econ. 2015, 11, 65–77. [Google Scholar] [CrossRef]
  91. Koch, A. SWOT does not need to be recalled: It needs to be enhanced. Swineburne Res. Bank 2000, 14, 74–87. [Google Scholar]
  92. Humphrey, A. SWOT Analysis for Management Consulting; SRI Alumni Newsletter; SRI International: Menlo Park, CA, USA, 2005. [Google Scholar]
  93. ListaFirme.ro. 2018. List of Romanian Companies. Available online: https://www.listafirme.ro/stare-firme.asp?gclid=CjwKCAjw4871BRAjEiwAbxXi2zGS38VxHFGdXbbgdES7WYyvZd44zjfI5zZEy199EhLifHIlpNsI7BoCYX0QAvD_BwE (accessed on 12 February 2018).
  94. Law no. 346/2004. Available online: http://legislatie.just.ro/Public/DetaliiDocument/53946 (accessed on 21 February 2020).
  95. Statistical Yearbook, 2019. Statistical Yearbook of Romania for 2019. Available online: http://www.insse.ro/cms/sites/default/files/field/publicatii/anuarul_statistic_al_romaniei_carte_ro.pdf (accessed on 21 December 2019).
  96. Dillman, D.A. Mail and Internet Surveys: The Tailored Design Method, 2nd ed.; John Wiley & Sons: New York, NY, USA, 2002. [Google Scholar]
  97. Enachescu, D. Data Maining, Metode si Aplicatii; Editura Academiei Române: Bucharest, Romania, 2009. [Google Scholar]
  98. Culic, I. Metode Avansate în Cercetarea Social—Analiza Multivariată de Interdependență; Polirom: Iași, Romania, 2004. [Google Scholar]
  99. Drugan, T.; Achimas, A.; Tigan, S. Biostatistics; SRIMA: Cluj-Napoca, Romania, 2005. [Google Scholar]
  100. Brown, T.A. Confirmatory Factor Analysis for Applied Research; Guilford: New York, NY, USA, 2006. [Google Scholar]
  101. Robinson, J.P.; Shaver, P.R.; Wrightsman, L.S. Criteria for scale selection and evaluation. In Measures of Social Psychological Attitudes; Robinson, J.P., Shaver, P.R., Wrightsman, L.S., Eds.; San Diego Academic Press: San Diego, CA, USA, 1999; pp. 1–35. [Google Scholar]
  102. Popa, M. Statistica pentru psihologi. Teorie și aplicații SPSS; Colecția Collegium, Psihologie; Polirom: Bucuresti, Romania, 2008. [Google Scholar]
  103. Opariuc, C.D. Analiza Componentelor Principale pentru date Categoriale (CATPCA). 2012. Available online: rpru.files.wordpress.com/2013/04/vol10_2_2012.pdf (accessed on 13 May 2020).
  104. Ralambondrainy, H. A conceptual version of the k-means algorithm. Pattern Recognit. Lett. 1995, 16, 1147–1157. [Google Scholar] [CrossRef]
  105. Dragoş, C.M. ROC curve for discrete choice models an application to the Romanian car market. Appl. Econ. Lett. 2010, 17, 75–79. [Google Scholar] [CrossRef]
  106. Fleiss, J.L.; Levin, B.; Paik, M.C. Statistical Methods for Rates and Proportions, 3rd ed.; Wiley: Hoboken, NJ, USA, 2003. [Google Scholar]
  107. Cohen, J. A coefficient of agreement for nominal scales. Educ. Psychol. Meas. 1960, 20, 37–46. [Google Scholar] [CrossRef]
  108. Rankin, G.; Stokes, M. Reliability of assessment tools in rehabilitation: An illustration of appropriate statistical analyses. Clin. Rehabil. 1998, 12, 187–199. [Google Scholar] [CrossRef] [PubMed]
  109. Pimonenko, T.; Bilan, Y.; Horák, J.; Starchenko, L.; Gajda, W. Green Brand of Companies and Greenwashing under Sustainable Development Goals. Sustainability 2020, 12, 1679. [Google Scholar] [CrossRef] [Green Version]
  110. Dunbar, R.L.; Starbuck, W.H. Learning to design organizations and learning from designing them. Organ. Sci. 2006, 17, 171–178. [Google Scholar] [CrossRef] [Green Version]
  111. George, G.; Howard-Grenville, J.; Joshi, A.; Tihanyi, L. Understanding and tackling societal grand challenges through management research. Acad. Manag. J. 2016, 59, 1880–1895. [Google Scholar] [CrossRef]
  112. Coles, J.L.; Li, Z.F. An Empirical Assessment of Empirical Corporate Finance. SSRN J. 2020. [Google Scholar] [CrossRef] [Green Version]
  113. Coles, J.L.; Li, Z.F. Managerial Attributes, Incentives, and Performance. Rev. Corp. Financ. Stud. 2020. [Google Scholar] [CrossRef]
  114. Nelling, E.; Webb, E. Corporate social Responsibility and financial performance: The “virtuous circle” revisited. Rev. Quant. Finan Acc. 2009, 32, 197–209. [Google Scholar] [CrossRef]
  115. Hong, B.; Li, Z.F.; Minor, D. Corporate Governance and Executive Compensation for Corporate Social Responsibility. J. Bus. Ethics 2016, 136, 199–213. [Google Scholar] [CrossRef] [Green Version]
  116. Hou, T.C.T. The relationship between corporate social responsibility and sustainable financial performance: Firm-level evidence from Taiwan. Corp. Soc. Responsib. Environ. Manag. 2019, 26, 19–29. [Google Scholar] [CrossRef] [Green Version]
  117. Li, Z.F.; Thibodeau, C. CSR-Contingent Executive Compensation Incentive and Earnings Management. Sustainability 2019, 11, 3421. [Google Scholar] [CrossRef] [Green Version]
  118. Jamali, D.; Neville, B. Convergence versus divergence of CSR in developing countries: An embedded multi-layered institutional lens. J. Bus. Ethics 2011, 102, 599–621. [Google Scholar] [CrossRef]
Figure 1. Research instrument structure [97,98]. PCA: principal components analysis; ROC: receiver operating characteristic.
Sustainability 12 04077 g001
Figure 2. Cluster analysis results: typologies. Source: Own research
Sustainability 12 04077 g002
Figure 3. ROC curve. Source: Own research.
Sustainability 12 04077 g003
Table 1. Factor analysis.
Indicators/factorsLoadingEV %Rotation Method: Varimax % of Var.
Procurement practices0.65052.53%20.20%
Degree to which employees are involved in the available forms of participation in profits0.666
The pressure of clients regarding social and environmental protection0.853
Governmental/NGO pressure0.882
Training programs on codes of ethics for employees0.793
Past anti-corruption/bribery policies0.919
External economic conditions0.793
Economic performance (e.g., turnover, profitability, level of indebtedness)0.8268.52%17.567%
Social practices (company’s contributions to the local community, community rights, jobs creation, etc.)0.771
The degree of companies’ internationalization0.858
Fraud and false advertising0.726
The use of eco labels (e.g., Fair Trade)0.780
Motivating and retaining talented employees0.772
Industry trend regarding sustainable development0.910
Companies’ image and reputation in the market0.7206.76%16.854%
Market presence (e.g., market share, sales gained in the social campaign)0.873
Consumer education process promoted by the company0.730
Certification schemes 0.844
Declaring harmful effects on the environment0.884
Equal remuneration for women and men0.9236.39%11.885%
Committees, forums, panels, departments, etc. involved in CSR0.893
Reporting method used for CSP (format and verification)0.909
Supplier environmental assessment0.9214.95%9.208%
Shareholders’ satisfaction regarding the social impact of CSR0.819
Business partners human rights assessment0.852
Board independence0.9043.71%7.127%,
Return of socially responsible investments 0.915
Notes: EV: eigenvariance; % of var: percentage of variance. NGO: non-governmental organization; CSR: corporate social responsibility; CSP: corporate social performance. Factors in the order of their extraction. Extraction method: principal axis factoring. Rotation method: varimax with Kaiser normalization; rotation converged in 11 iterations.

