Energy Poverty in European Union: Assessment Difficulties, Effects on the Quality of Life, Mitigation Measures. Some Evidences from Romania


Abstract
1. Introduction
2. Energy Poverty and Quality of Life
- -
- for the cold season, but also in the hot season, when energy is needed to operate the air conditioning equipment in order to reduce the temperature in the living spaces [26]; the problem became more stringent with the climate changes and the temperatures increase;
- -
- countries in temperate and cold areas and also in hot areas, where the population needs energy for cooling purposes [27].
3. Assessment Difficulties
- -
- Approximately 3.75 million households in Romania use biomass, usually firewood, as the main heating source (about 90% in rural areas and 15% in urban areas), spending 10.50 EUR/month on average for this type of fuel.
- -
- Less than half of Romania’s households are connected to the natural gas network (44.2%) and around 2.97 million homes (i.e., a third of the total homes in the country) use natural gas directly as their source of heating.
- -
- Although the end-price of natural gas and electric power is considerably lower in Romania than the European average, Romania has the lowest consumption level of electric energy per capita in the entire European Union-37.5% of the EU average (approximately 0.6 MW h/person/year than the EU28’s average of 1.6 MW h/person/year). And this is although there are approximately 287,000 homes in Romania not yet connected to the grid.
- -
- Approximately 422,000 homes (i.e., 4.73% of total homes) have informal access to electrical power, which means these houses are built without building permits;
- -
- On average, Romanian households spend around 20 EUR/month on power, and around 12 EUR/month on natural gas.
- -
- Around 14% of Romania’s population is unable to adequately heat their homes (UE average is 8.7%), and around 15% of households have difficulties paying electricity bills;
- -
- Around one million households in Romania benefit from some form of social assistance: heating benefits (emergency ordinance 70/2011), respectively social tariffs for electricity (Order no. 176/20,154 of NAER);
- -
- Heating benefits (covering only approximately 5% of the population) are the only social benefits not included in the national information system. Over 50% of the amount of heating benefits cover heating with firewood; support for heating with electricity has a weight of only 2% of the total (i.e., approximately 8000 households). In addition, 56% of the granted benefit goes towards the poorest 20% of the households. Although almost a quarter of the benefits is directed towards the poorest households, with an income of up to 155 RON (approximately 32 EUR) per family member, data reveals that approximately 70% of the households with this income do not receive any benefit;
- -
- Twelve percent of Romania’s population benefits from social tariffs, but 42% of the households applying for this tariff do not correctly dimension their consumption and exceed the minimum consumption threshold provided by law; consequently, the tariffs in their case are above the social level
- -
- According to the EU’s Observer of Energy Poverty, the main indicators for identifying energy poverty are low absolute energy expenditure, arrears on utility bills, high share of energy expenditure in income and the inability to keep the home adequately warm. A series of secondary indicators can be added, the European Commission recommend list with 180 indicators which are adapted to specific regional/local coordinates.
- -
- There is a ‘hidden’ energy poverty represented by households with very low energy bills expenditures because they limit their consumption partially, or almost totally. M/2 is used to estimate this type of energy poverty. The M/2 indicator indicates the share of households whose absolute energy expenditure is below half of the national median (the median of absolute energy expenses of households).
4. Micro-Solutions for Combating Energy Poverty. Examples of Good Practices in Europe
4.1. Spain-The Ni un Hogar Sin Energia (No Home without Energy) Project
4.2. UK-The Plymouth Energy Community Initiative
4.3. Belgium-The Papillon Project
4.4. Germany-The Program for the Reduction of Interruptions in Electricity Supply
5. Cross-Country Analysis
- ➢
- electricity prices for households, medium size, EUR/Kwh, (PR);
- ➢
- inability to keep the home adequately warm,%, (WARM);
- ➢
- arrears on utility bills between,%, (ARR);
- ➢
- gross domestic product, million EUR, (GDP);
- ➢
- share of renewable energy in gross final energy consumption,%, (RENEW).
6. Subsidies-Sustainability’s Motor in the Tackle Energy Poverty?
- ➢
- The proposed model is addressed to the governmental factors of analysis and decisions, at the level of the Ministry of Energy;
- ➢
- It is desired that all citizens have access to at least one of the green energy sources;
- ➢
- It is required, according to the provisions of the European norms, the reduction of the greenhouse gas emissions by 20% compared to the level of 1990;
- ➢
- In addition, in accordance with the European provisions, it is desired to increase to 20% the share of renewable energy sources in the final energy consumption;
- ➢
- In the same context it is desired to reduce by 20% the primary energy consumption by improving the energy efficiency.
- (i)
- Up to 500 m representing surface geothermal;
- (ii)
- Over 500 m representing geothermal depth.
- (i)
- The use of renewable resources is addressed not only to the production of energy, but through the particular way of generation it also reformulates the development model by decentralizing the sources;
- (ii)
- Reduced costs per unit of energy produced;
- (iii)
- Zero emission of polluting substances and greenhouse gases, due to the fact that they do not burn fuels;
- (iv)
- Green energy source, no waste, is produced. To capture and harness this type of energy, wind turbines will be used to generate electricity.
- ➢
- 1 operator of the National Transport System-SNTGN Transgaz SA Medias;
- ➢
- 6 natural gas producers: OMV Petrom SA, SNGN Romgaz SA, SC Amromco SRL, SC Foraj Sonde SA, SC Raffles Energy SRL, Stratum Energy Romania LLC Wilmington Bucharest Branch;
- ➢
- 2 operators for underground storage depots: SNGN Romgaz-Underground Storage Branch of Ploiesti Natural Gas, SC Depomures GDF Suez;
- ➢
- 38 natural gas distribution and supply companies-the largest being SC Distrigaz Sud Retele SRL and SC Delgaz Grid SRL;
- ➢
- 75 suppliers operating in the wholesale market.
- ➢
- the competitive segment comprising:
- ➢
- the wholesale market that operates on the basis of:
- ✓
- bilateral contracts between economic operators in the field of natural gas;
- ✓
- transactions on centralized markets, administered by the natural gas market operator or the equilibrium market operator as appropriate;
- ✓
- other types of transactions or contracts.
- ➢
- the retail market where suppliers sell natural gas to final customers through contracts at negotiated prices.
- ➢
- the regulated segment that includes the activities of a natural monopoly, the activities related to them and the supply at regulated prices and based on the framework contracts approved by ANRE.
7. Conclusions
- ➢
- Increasing the quality of life by reducing the effects of the energy poverty phenomenon;
- ➢
- Protecting the environment by reducing the effects of the use of polluting resources.
Author Contributions
Conflicts of Interest
References
- Nussbaumer, P.; Bazilian, M.; Modi, V. Measuring energy poverty: Focusing on what matters. Renew. Sustain. Energy Rev. 2012, 16, 231–243. [Google Scholar] [CrossRef]
- González-Eguino, M. Energy poverty: An overview. Renew. Sustain. Energy Rev. 2015, 47, 377–385. [Google Scholar] [CrossRef]
- Kaygusuz, K. Energy services and energy poverty for sustainable rural development. Renew. Sustain. Energy Rev. 2011, 15, 936–947. [Google Scholar] [CrossRef]
- Zamfir, C.; Dumitru, M.; Mihăilescu, A.; Stanciu, M.; Zamfir, E.; Bădescu, I.; Serban, A. SărăciaEnergetică: Impactul Social Al ReformeiPreturilorEnergieiAsupraStandardului De Viată. Qual. Life (1018–0389)/Calit. Vietii 2015, 26, 313–342. [Google Scholar]
- EEN. EnR Position Paper on Energy Poverty in the European Union; European Energy Network: Roma, Italy, 2019. [Google Scholar]
- Stern, D.I. The Role of Energy in Economic Growth. CCEP Working Paper 3.10; Centre for Climate Economics & Policy, Crawford School of Economics and Government, The Australian National University: Canberra, Australia, 2010; pp. 1–50.
- Pirlogea, C.; Cicea, C. Econometric perspective of the energy consumption and economic growth relation in European Union. Renew. Sustain. Energy Rev. 2012, 16, 5718–5726. [Google Scholar] [CrossRef]
- Andrei, J.V.; Mieila, M.; Panait, M. The impact and determinants of the energy paradigm on economic growth in European Union. PLoS ONE 2017, 12, e0173282. [Google Scholar] [CrossRef] [PubMed]
- Popescu, G.H.; Mieila, M.; Nica, E.; Andrei, J.V. The emergence of the effects and determinants of the energy paradigm changes on European Union economy. Renew. Sustain. Energy Rev. 2018, 81, 768–774. [Google Scholar] [CrossRef]
- Popescu, G.H.; Andrei, J.V.; Nica, E.; Mieilă, M.; Panait, M. Analysis on the impact of investments, energy use and domestic material consumption in changing the Romanian economic paradigm. Technol. Econ. Dev. Econ. 2019, 25, 59–81. [Google Scholar] [CrossRef]
- Odugbesan, J.A.; Rjoub, H. Relationship among Economic Growth, Energy Consumption, CO2 Emission, and Urbanization: Evidence from MINT Countries. SAGE Open 2020, 10, 22158244020914648. [Google Scholar] [CrossRef]
- Raimi, L.; Towobola, W.L.; Madueke, L.I. Redressing the energy challenge of gas flaring in Nigeria: The MEEs approach. J. Sustain. Dev. Stud. 2013, 2, 242–257. [Google Scholar]
- Nica, E. Energy security and sustainable growth: Evidence from China. Econ. Manag. Financ. Mark. 2016, 11, 59–65. [Google Scholar]
- Sovacool, B.K. The political economy of energy poverty: A review of key challenges. Energy Sustain. Dev. 2012, 16, 272–282. [Google Scholar] [CrossRef]
- Sovacool, B.K. Design principles for renewable energy programs in developing countries. Energy Environ. Sci. 2012, 5, 9157–9162. [Google Scholar] [CrossRef]
- Dusmanescu, D.; Andrei, J.; Subic, J. Scenario for implementation of renewable energy sources in Romania. Procedia Econ. Financ. 2014, 8, 300–305. [Google Scholar] [CrossRef]
- Voica, M.C.; Panait, M. Challenges Imposed by Renewable Energy Paradigms of the Romanian Economy from the European Perspective. Econ. Insights Trends Chall. 2019, Vol.VIII(LXXI), 49–60. [Google Scholar]
- Armeanu, D.Ş.; Vintilă, G.; Gherghina, Ş.C. Does renewable energy drive sustainable economic growth? multivariate panel data evidence for EU-28 countries. Energies 2017, 10, 381. [Google Scholar] [CrossRef]
- Thomson, H.; Bouzarovski, S.; Snell, C. Rethinking the measurement of energy poverty in Europe: A critical analysis of indicators and data. Indoor Built Environ. 2017, 26, 879–901. [Google Scholar] [CrossRef]
- European Environment Agency. COM 2015/80 A Framework Strategy for a Resilient Energy Union with a Forward-Looking Climate Change Policy; European Environment Agency: Copenhagen, Denmark, 2015. [Google Scholar]
- Vollero, A.; Siano, A.; Palazzo, M.; Elving, W. Corporate Communication and CSR; comparing Italian and Dutch energy companies on anti-greenwashing strategies. In Proceedings of the 1st International CSR Communication Conference, Amsterdam, The Netherlands, 26–28 October 2011. [Google Scholar]
- Panaitescu, C.; Petrescu, M.G. Employment of mobile wastewater treatment plants in accidental pollution and operating risks evaluation. Fresen. Environ. Bull. 2016, 25, 4517–4524. [Google Scholar]
- Bucuroiu, R.; Petrescu, M.G. New software for identification and evaluation of environmental and waste management in the companies. Theor. Appl. Econ. 2017, 24, 295–306. [Google Scholar]
- Machado, C.; Davim, J.P. Green and Lean Management; Springer International Publishing: Berlin/Heidelberg, Germany, 2017. [Google Scholar]
- Ferri, M.A.; Palazzo, M. An Italian Business Model for Engaging Organizations to Social Wellness: A Focus on the for Benefit Companies. Int. J. Bus. Manag. 2018, 13. [Google Scholar] [CrossRef][Green Version]
- Herrero, S.T.; Ürge-Vorsatz, D. Investing in energy efficiency in buildings with district heating. In Proceedings of the Cohesion Policy Investing in Energy Efficiency Buildings Conference, Brussels, Belgium, 29–30 November 2011. [Google Scholar]
- Thomson, H.; Snell, C.; Bouzarovski, S. Health, well-being and energy poverty in Europe: A comparative study of 32 European countries. Int. J. Environ. Res. Public Health 2017, 14, 584. [Google Scholar] [CrossRef] [PubMed]
- Murafa, C. The energy performance contract-key towards energy efficiency in Europe? In Proceedings of the International Conference on Business Excellence, Bucharest, Romania, 30–31 July 2017. [Google Scholar]
- Maxim, A.; Mihai, C.; Apostoaie, C.M.; Maxim, A. Energy poverty in Southern and Eastern Europe: Peculiar regional issues. Eur. J. Sustain. Dev. 2017, 6, 247. [Google Scholar] [CrossRef][Green Version]
- Bouzarovski, S.; Petrova, S. A global perspective on domestic energy deprivation: Overcoming the energy poverty-fuel poverty binary. Energy Res. Soc. Sci. 2015, 10, 31–40. [Google Scholar] [CrossRef]
- Bouzarovski, S.; Tirado Herrero, S. Geographies of injustice: The socio-spatial determinants of energy poverty in Poland, the Czech Republic and Hungary. Post-Communist Econ. 2017, 29, 27–50. [Google Scholar] [CrossRef]
- Tirado, S.; Jiménez Meneses, L. Energy poverty, crisis and austerity in Spain. People Place Policy 2016, 10, 42–56. [Google Scholar] [CrossRef]
- Mshelia, H.I. Energy Access for All: The role of clean energy in alleviating energy poverty. Energy Access All 2012, 33, 43. [Google Scholar]
- Druică, E.; Goschin, Z.; Ianole-Călin, R. Energy Poverty and Life Satisfaction: Structural Mechanisms and Their Implications. Energies 2019, 12, 3988. [Google Scholar] [CrossRef]
- Pachauri, S.; Rao, N.D. Gender impacts and determinants of energy poverty: Are we asking the right questions? Curr. Opin. Environ. Sustain. 2013, 5, 205–215. [Google Scholar] [CrossRef]
- Kimemia, D.K.; Van Niekerk, A. Energy poverty, shack fires and childhood burns. South. Afr. Med. J. 2017, 107, 289–291. [Google Scholar] [CrossRef]
- Bouzarovski, S. Energy poverty in the European Union: Landscapes of vulnerability. Wiley Interdiscip. Rev. Energy Environ. 2014, 3, 276–289. [Google Scholar] [CrossRef]
- Maxim, A.; Mihai, C.; Apostoaie, C.M.; Popescu, C.; Istrate, C.; Bostan, I. Implications and measurement of energy poverty across the European Union. Sustainability 2016, 8, 483. [Google Scholar] [CrossRef]
- European Parliament and of the Council. Directive (Eu) 2018/2002 of the European Parliament and of the Council of 11 December 2018 Amending Directive 2012/27/EU on Energy Efficiency; European Parliament and of the Council: Brussels, Belgium, 2018. [Google Scholar]
- European Parliament and of the Council. Directive 2012/27/EU of the European Parliament and of the Council of 25 October 2012 on Energy Efficiency; European Parliament and of the Council: Brussels, Belgium, 2012. [Google Scholar]
- INS 2019. Condițiile De Viată Ale Populației Din România în 2018; INS Publishing House: Bucharest, Romania, 2019. [Google Scholar]
- EUROSTAT. Available online: https://ec.europa.eu/eurostat (accessed on 7 January 2020).
- INS. Available online: https://insse.ro/cms/ (accessed on 14 January 2020).
- ANRE. Available online: https://www.anre.ro/en (accessed on 8 January 2020).
- The Energy Efficiency Awareness Program/Campania de constientizare privind eficiența energetică a Commissiei Europene-DG JUST. Available online: https://www.anre.ro/ro/eficienta-energetica/informatii-de-interes-public/info-eficienta-energetica1386850500/proiecte/campania-de-crestere-a-gradului-de-constientizare-privind-eficienta-energetica-dg-just-in-parteneriat-cu-anre (accessed on 7 January 2020).
- EU-Energy Poverty Observatory. Available online: https://www.energypoverty.eu/ (accessed on 1 February 2020).
- Ecodes-Tiempo de Actuar. Available online: https://ecodes.org/ (accessed on 9 February 2020).
- Ni un Hogar Sin Energia. Available online: https://niunhogarsinenergia.org/ (accessed on 5 February 2020).
- Plymouth Energy Community (PEC). Available online: https://plymouthenergycommunity.com/ (accessed on 11 February 2020).
- Vlaanderen-Circulair. Available online: https://vlaanderen-circulair.be/ (accessed on 15 February 2020).
- Samenlevingsopbouw West Vlaanderen. Available online: https://www.samenlevingsopbouwwvl.be/ (accessed on 15 February 2020).
- Verbraucherzentrale Nordrhein-Westfalen. Available online: https://www.verbraucherzentrale.nrw/ (accessed on 19 February 2020).
- Granger, C. Investigating Causal Relations by Econometric Models and Cross-spectral Methods. Econometrica 1969, 37, 424–438. [Google Scholar] [CrossRef]
- Engle, R.F.; Granger, C.W. Co-integration and error correction: Representation, estimation, and testing. Econom. J. Econom. Soc. 1987, 55, 251–276. [Google Scholar] [CrossRef]
- Kao, C. Spurious regression and residual-based tests for co-integration in panel data. J. Econom. 1999, 90, 1–44. [Google Scholar] [CrossRef]
- Sovacool, B.K. A qualitative factor analysis of renewable energy and Sustainable Energy for All (SE4ALL) in the Asia-Pacific. Energy Policy 2013, 59, 393–403. [Google Scholar] [CrossRef]
- González, A.M.; Sandoval, H.; Acosta, P.; Henao, F. On the acceptance and sustainability of renewable energy projects-A systems thinking perspective. Sustainability 2016, 8, 1171. [Google Scholar] [CrossRef]
- Llera-Sastresa, E.; Scarpellini, S.; Rivera-Torres, P.; Aranda, J.; Zabalza-Bribián, I.; Aranda-Usón, A. Energy vulnerability composite index in social housing, from a household energy poverty perspective. Sustainability 2017, 9, 691. [Google Scholar] [CrossRef]
- Cebotari, S.; Benedek, J. Renewable energy project as a source of innovation in rural communities: Lessons from the periphery. Sustainability 2017, 9, 509. [Google Scholar] [CrossRef]
- Andrei, J.; Mieila, M.; Popescu, G.H.; Nica, E.; Cristina, M. The impact and determinants of environmental taxation on economic growth communities in Romania. Energies 2016, 9, 902. [Google Scholar] [CrossRef]
- Ljubojev, N.; Dukić-Mijatović, M.; Vojinović, Ž. Renewable energy resources in agriculture: Potential and legal framework in the Republic of Serbia. Ekonomikapoljoprivrede 2018, 65, 1227–1239. [Google Scholar] [CrossRef]
- Nosek, R.; Holubcik, M.; Jandacka, J. The impact of bark content of wood biomass on biofuel properties. BioResources 2016, 11, 44–53. [Google Scholar] [CrossRef]
- Istudor, N.; Ursacescu, M.; Sendroiu, C.; Radu, I. Theoretical framework of organizational intelligence: A managerial approach to promote renewable energy in rural economies. Energies 2016, 9, 639. [Google Scholar] [CrossRef]
- Dusmanescu, D. Aspects Regarding Implementation of Renewable Energy Sources in Romania up to 2050. Int. J. Sustain. Econ. Manag. 2013, 2, 1–21. [Google Scholar] [CrossRef][Green Version]
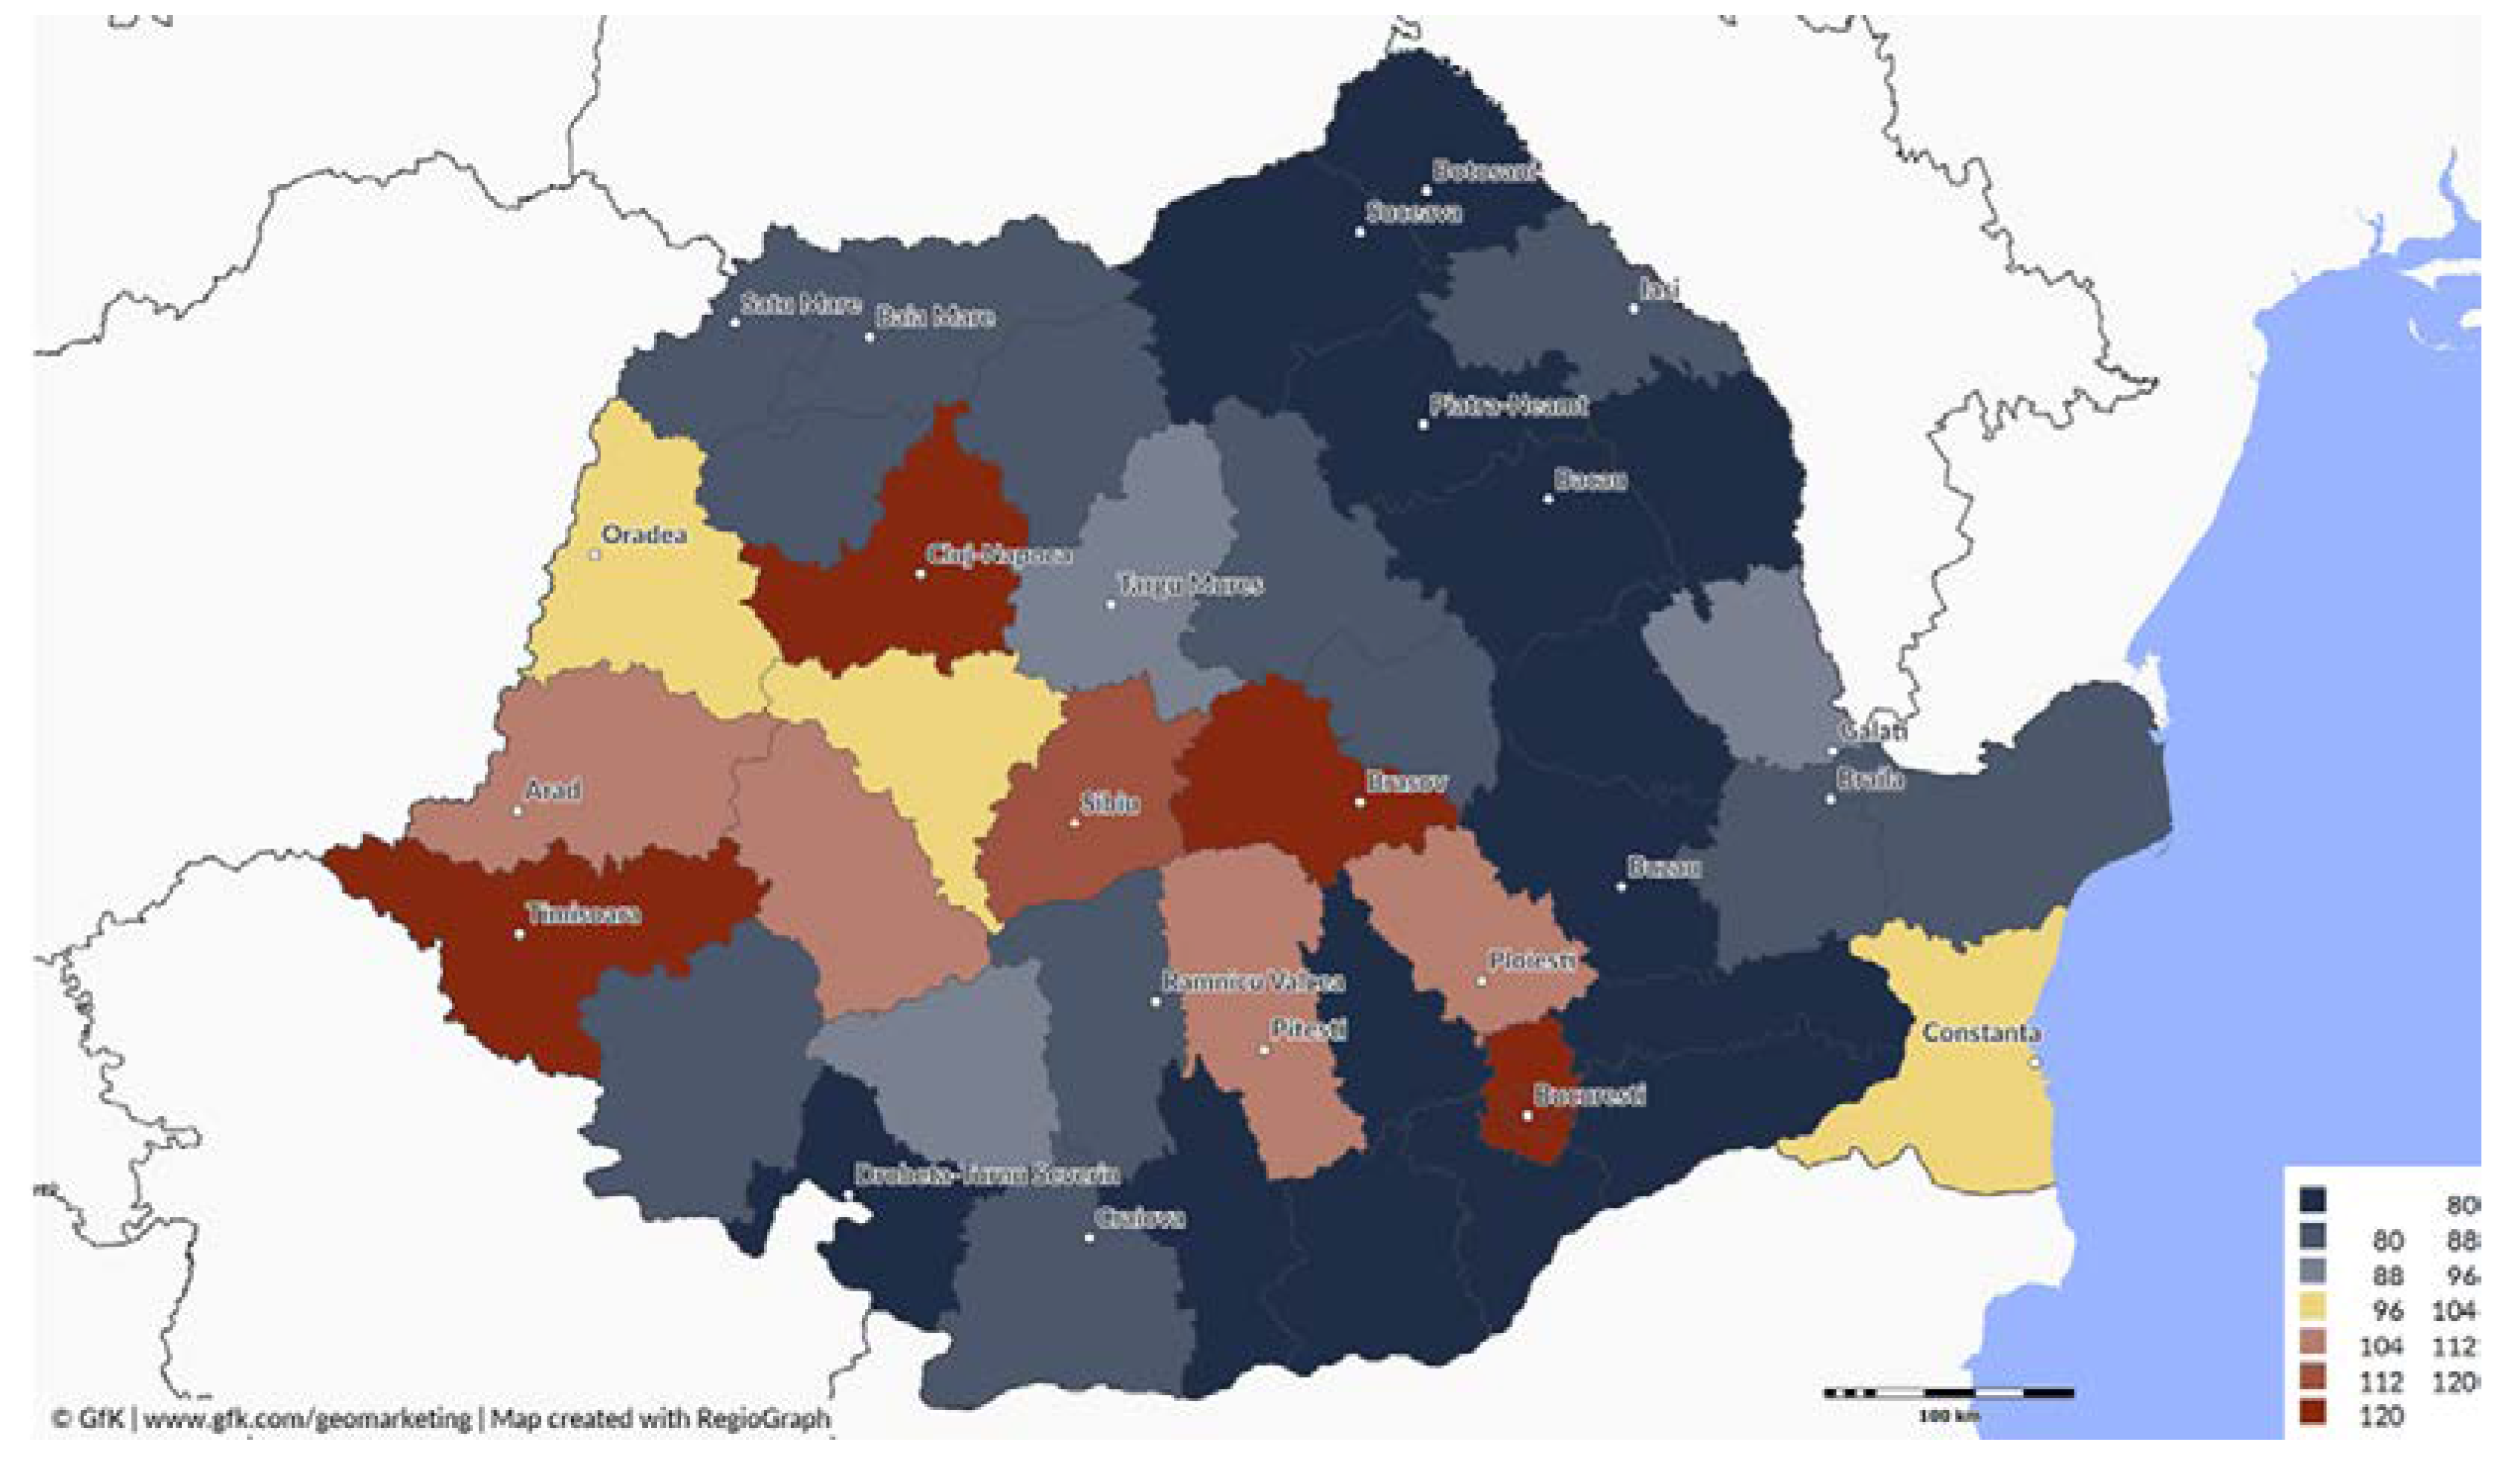
- GfK Press Related, the Purchasing Power of Europeans is 14,739 Euros per Person in 2019, of Romanians 5881 Euros, Bucharest, 23 October 2019. Available online: https://www.gfk.com/ro/noutati/comunicate-de-presa/puterea-de-cumparare-a-europenilor-este-de-14739-de-euro-de-persoana-in-2019-a-romanilor-de-5881/ (accessed on 19 February 2020).
- GfK Press Related, the Purchasing Power of Europeans is 14,739 Euros per Person in 2019, of Romanians 5881 Euros, Bucharest, 23 October 2019. Available online: https://www.gfk.com/fileadmin/user_upload/country_one_pager/RO/images/GfK_Puterea_de_cumparare_Romania_2019__1120x750__pt_site.jpg (accessed on 17 February 2020).
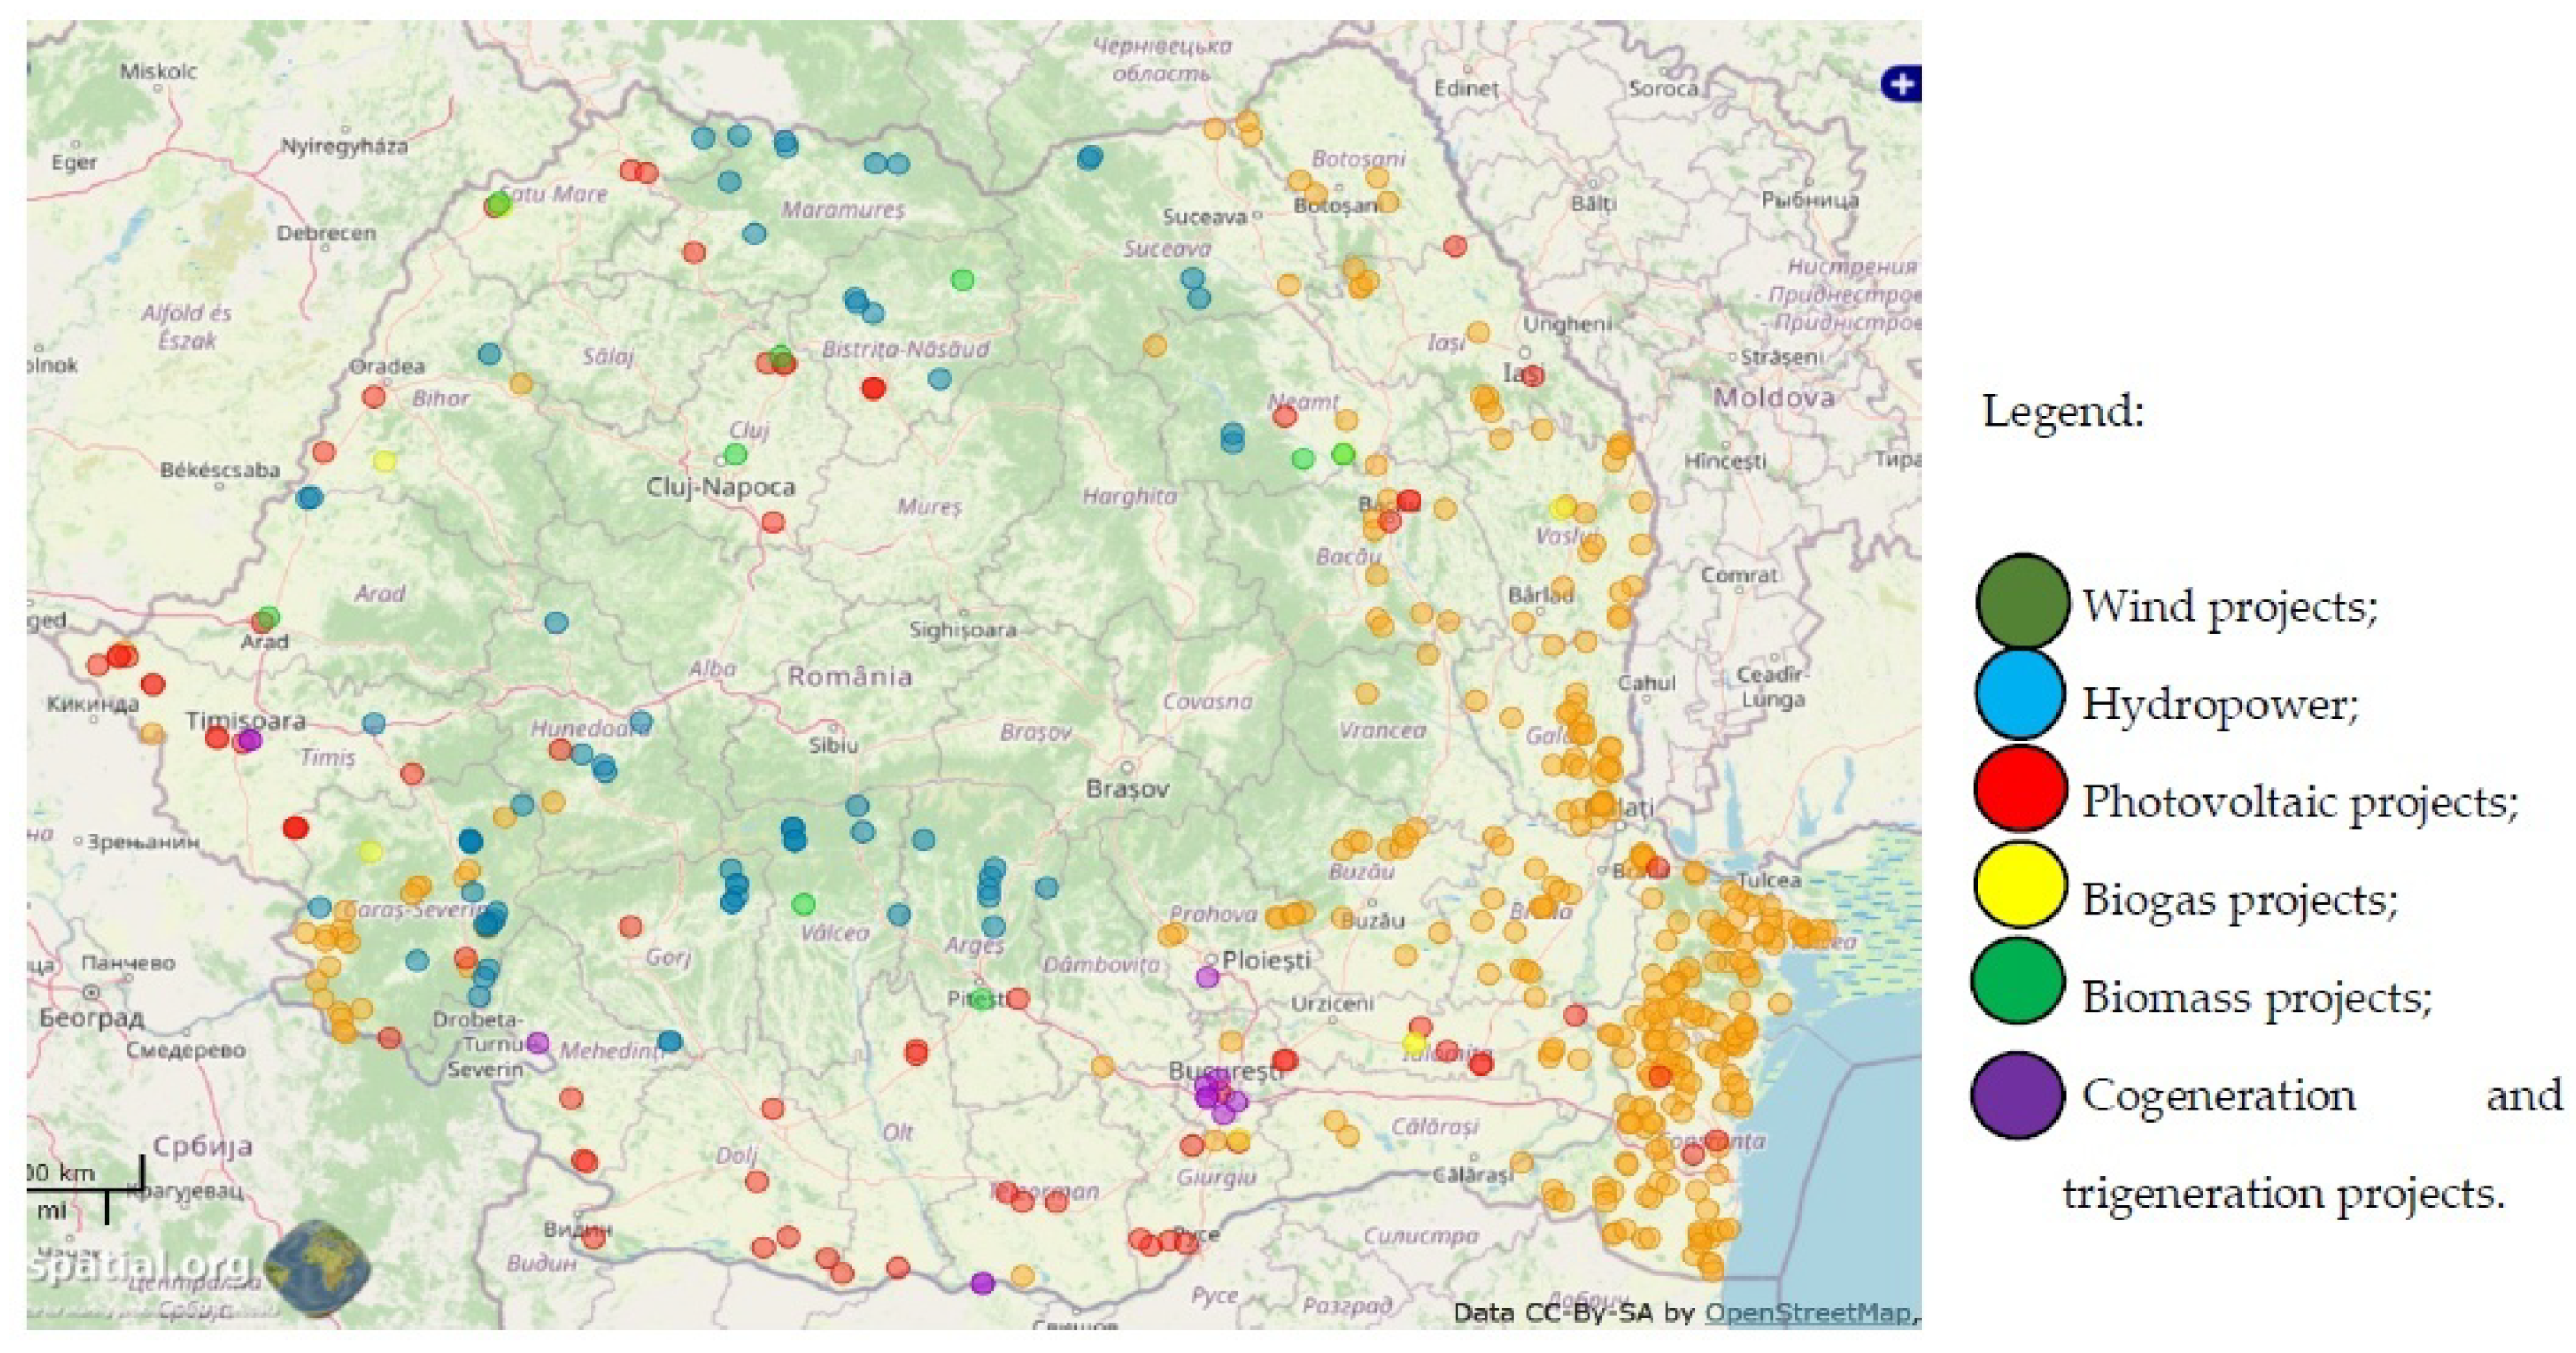
- Public Statistics for Renewable Energy Projects in Romania: Interactive Map of Renewable Energy Projects in Romania. Available online: https://www.fabricadecercetare.ro/regenerabil/ (accessed on 16 February 2020).
- Antal, C.; Popa, F.; Mos, M.; Tigan, D.; Popa, B.; Muresan, V. Advanced concepts and solutions for geothermal heating applied in Oradea, Romania. In Proceedings of the IOP Conference Series: Materials Science and Engineering, Hunedoara, Romania, 25–27 May 2016; Volume 163. Available online: https://www.researchgate.net/figure/Repartition-of-geothermal-resources-in-Romania_fig1_312284159 (accessed on 16 February 2020).
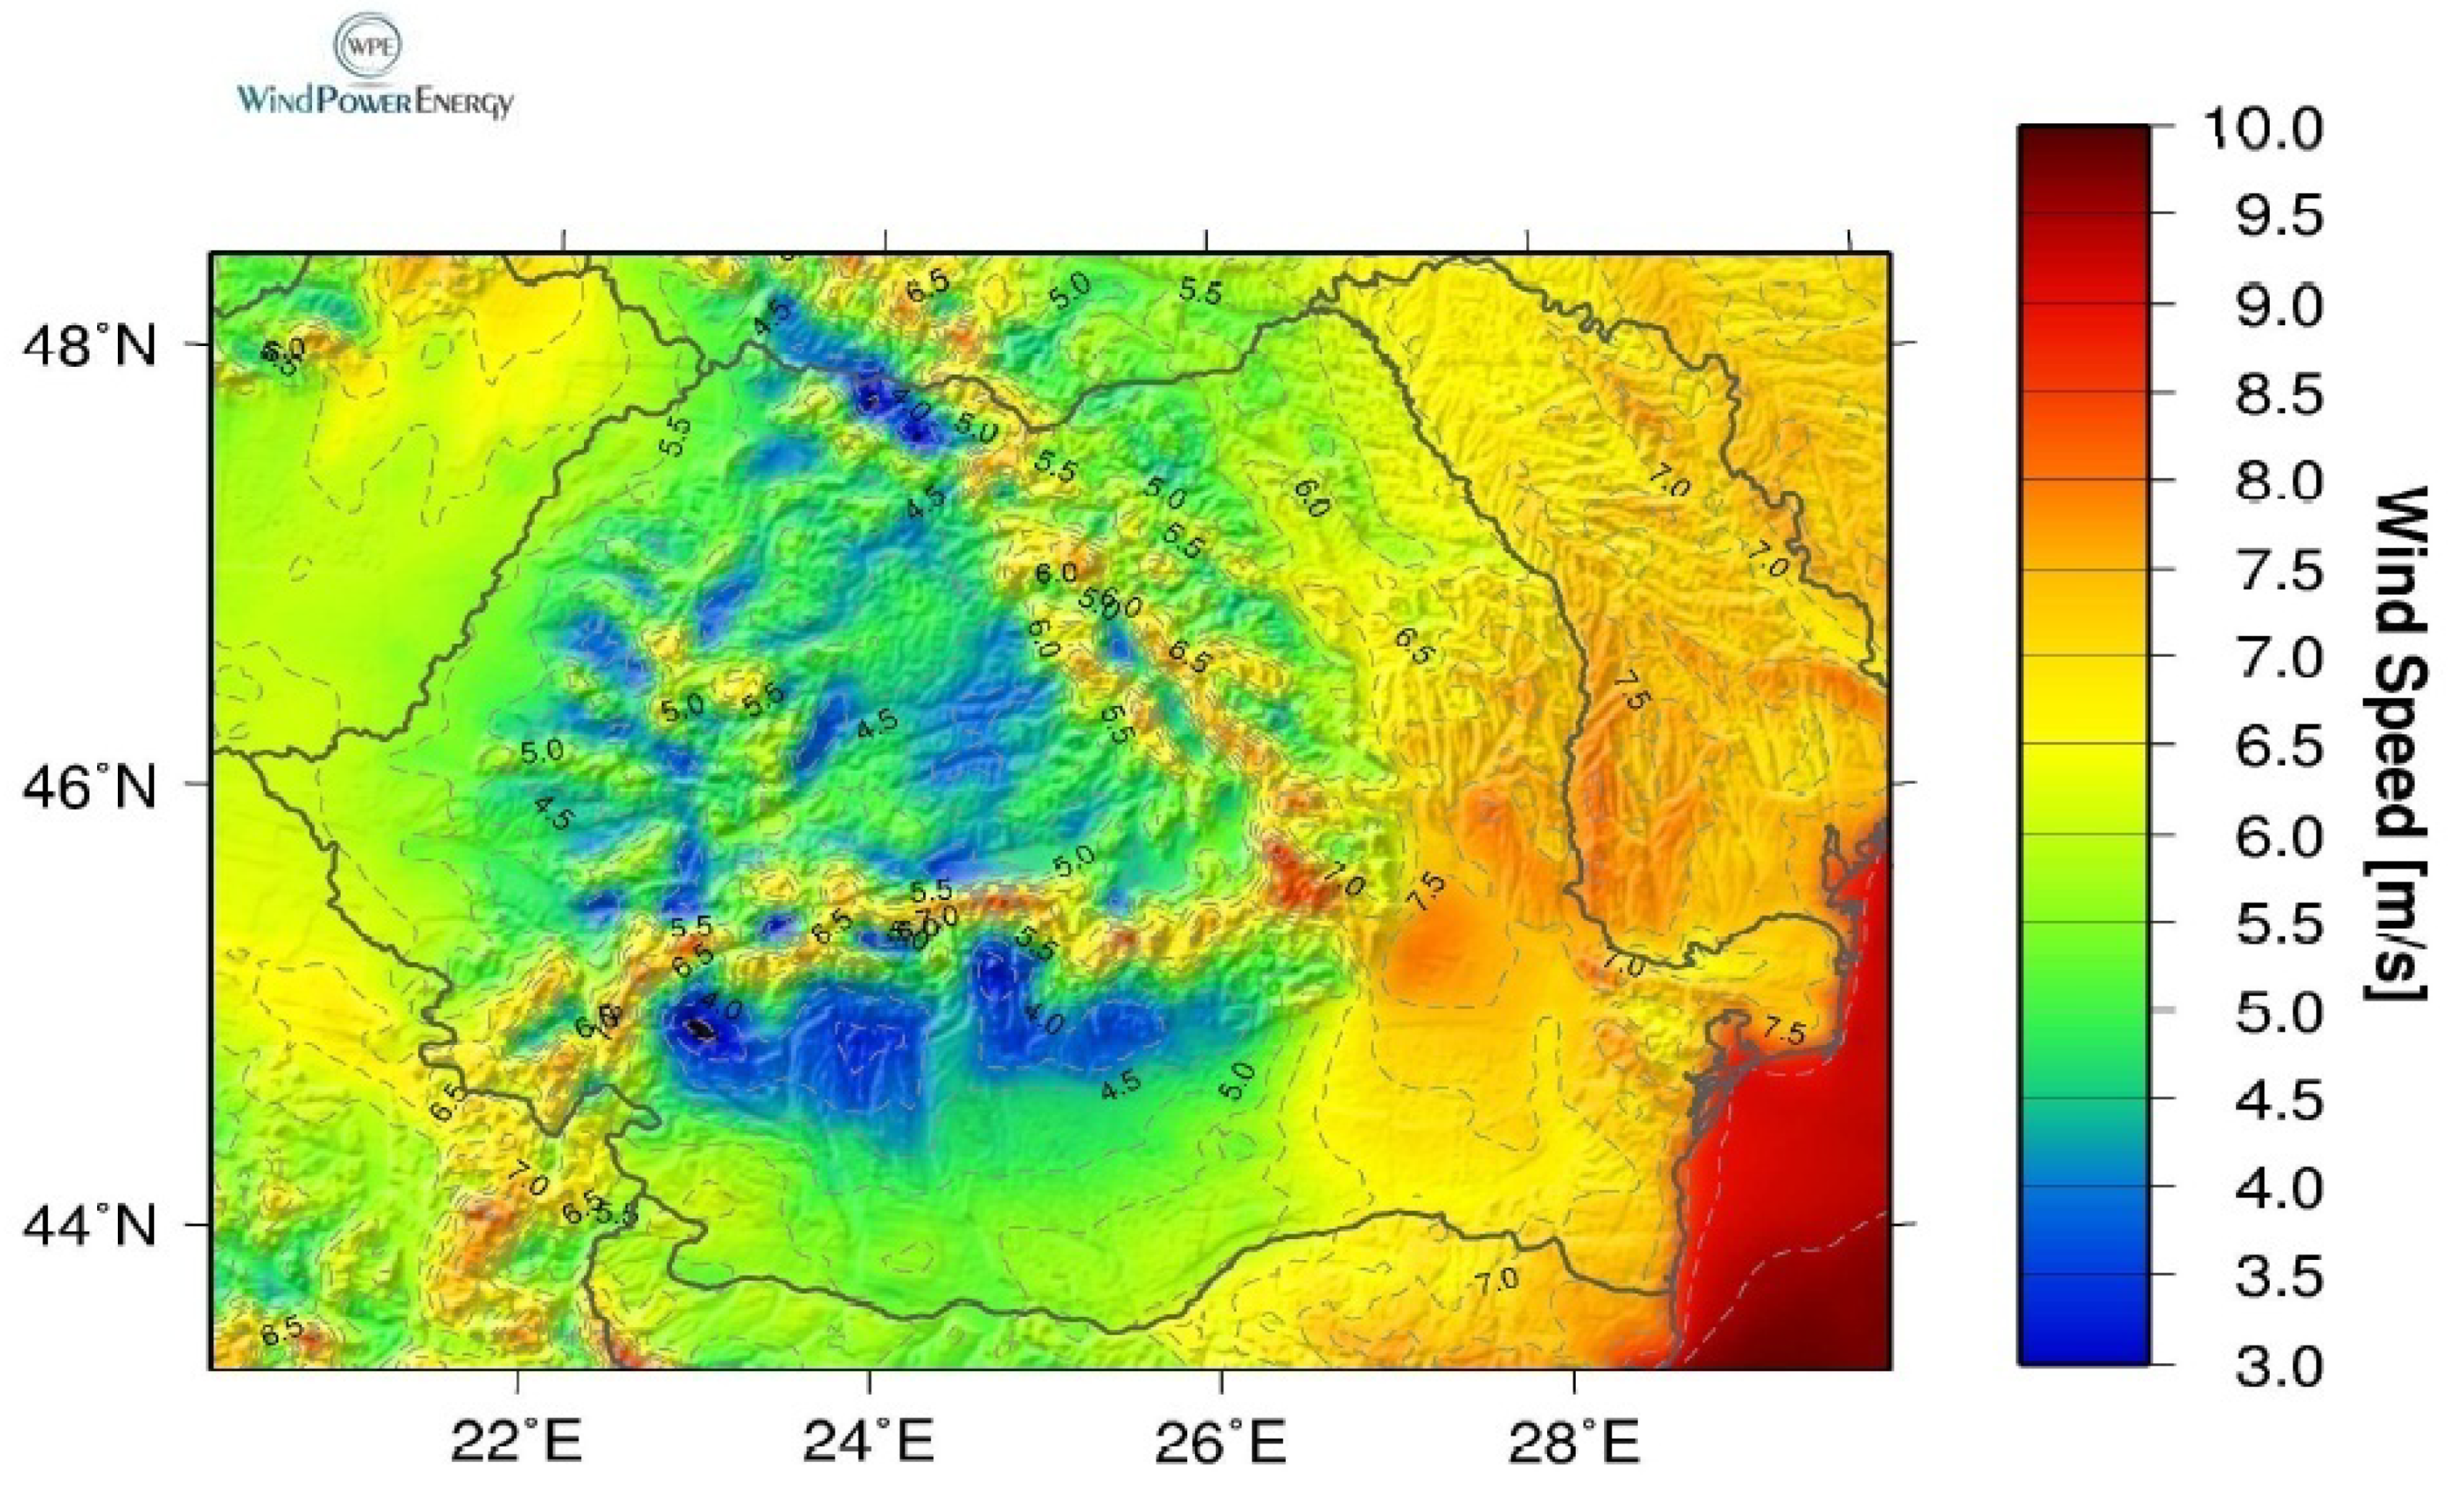
- Lascu, M. Press Related, Wind Energy-Wind Map of Romania, Potential of 14,000 MW, 24 March 2011. Available online: http://energielive.ro/energie-eoliana-harta-de-vant-a-romaniei-potential-de-14-000-mw/harta-vant-romania/ (accessed on 16 February 2020).
- SNTGN TRANSGAZ SA Medias, Press Related, Development Plan of the National Natural Gas Transmission Network 2017–2026, 30 April 2020. Available online: https://www.transgaz.ro/sites/default/files/uploads/users/admin/plan_de_dez_2017_-_2026.pdf (accessed on 16 February 2020).
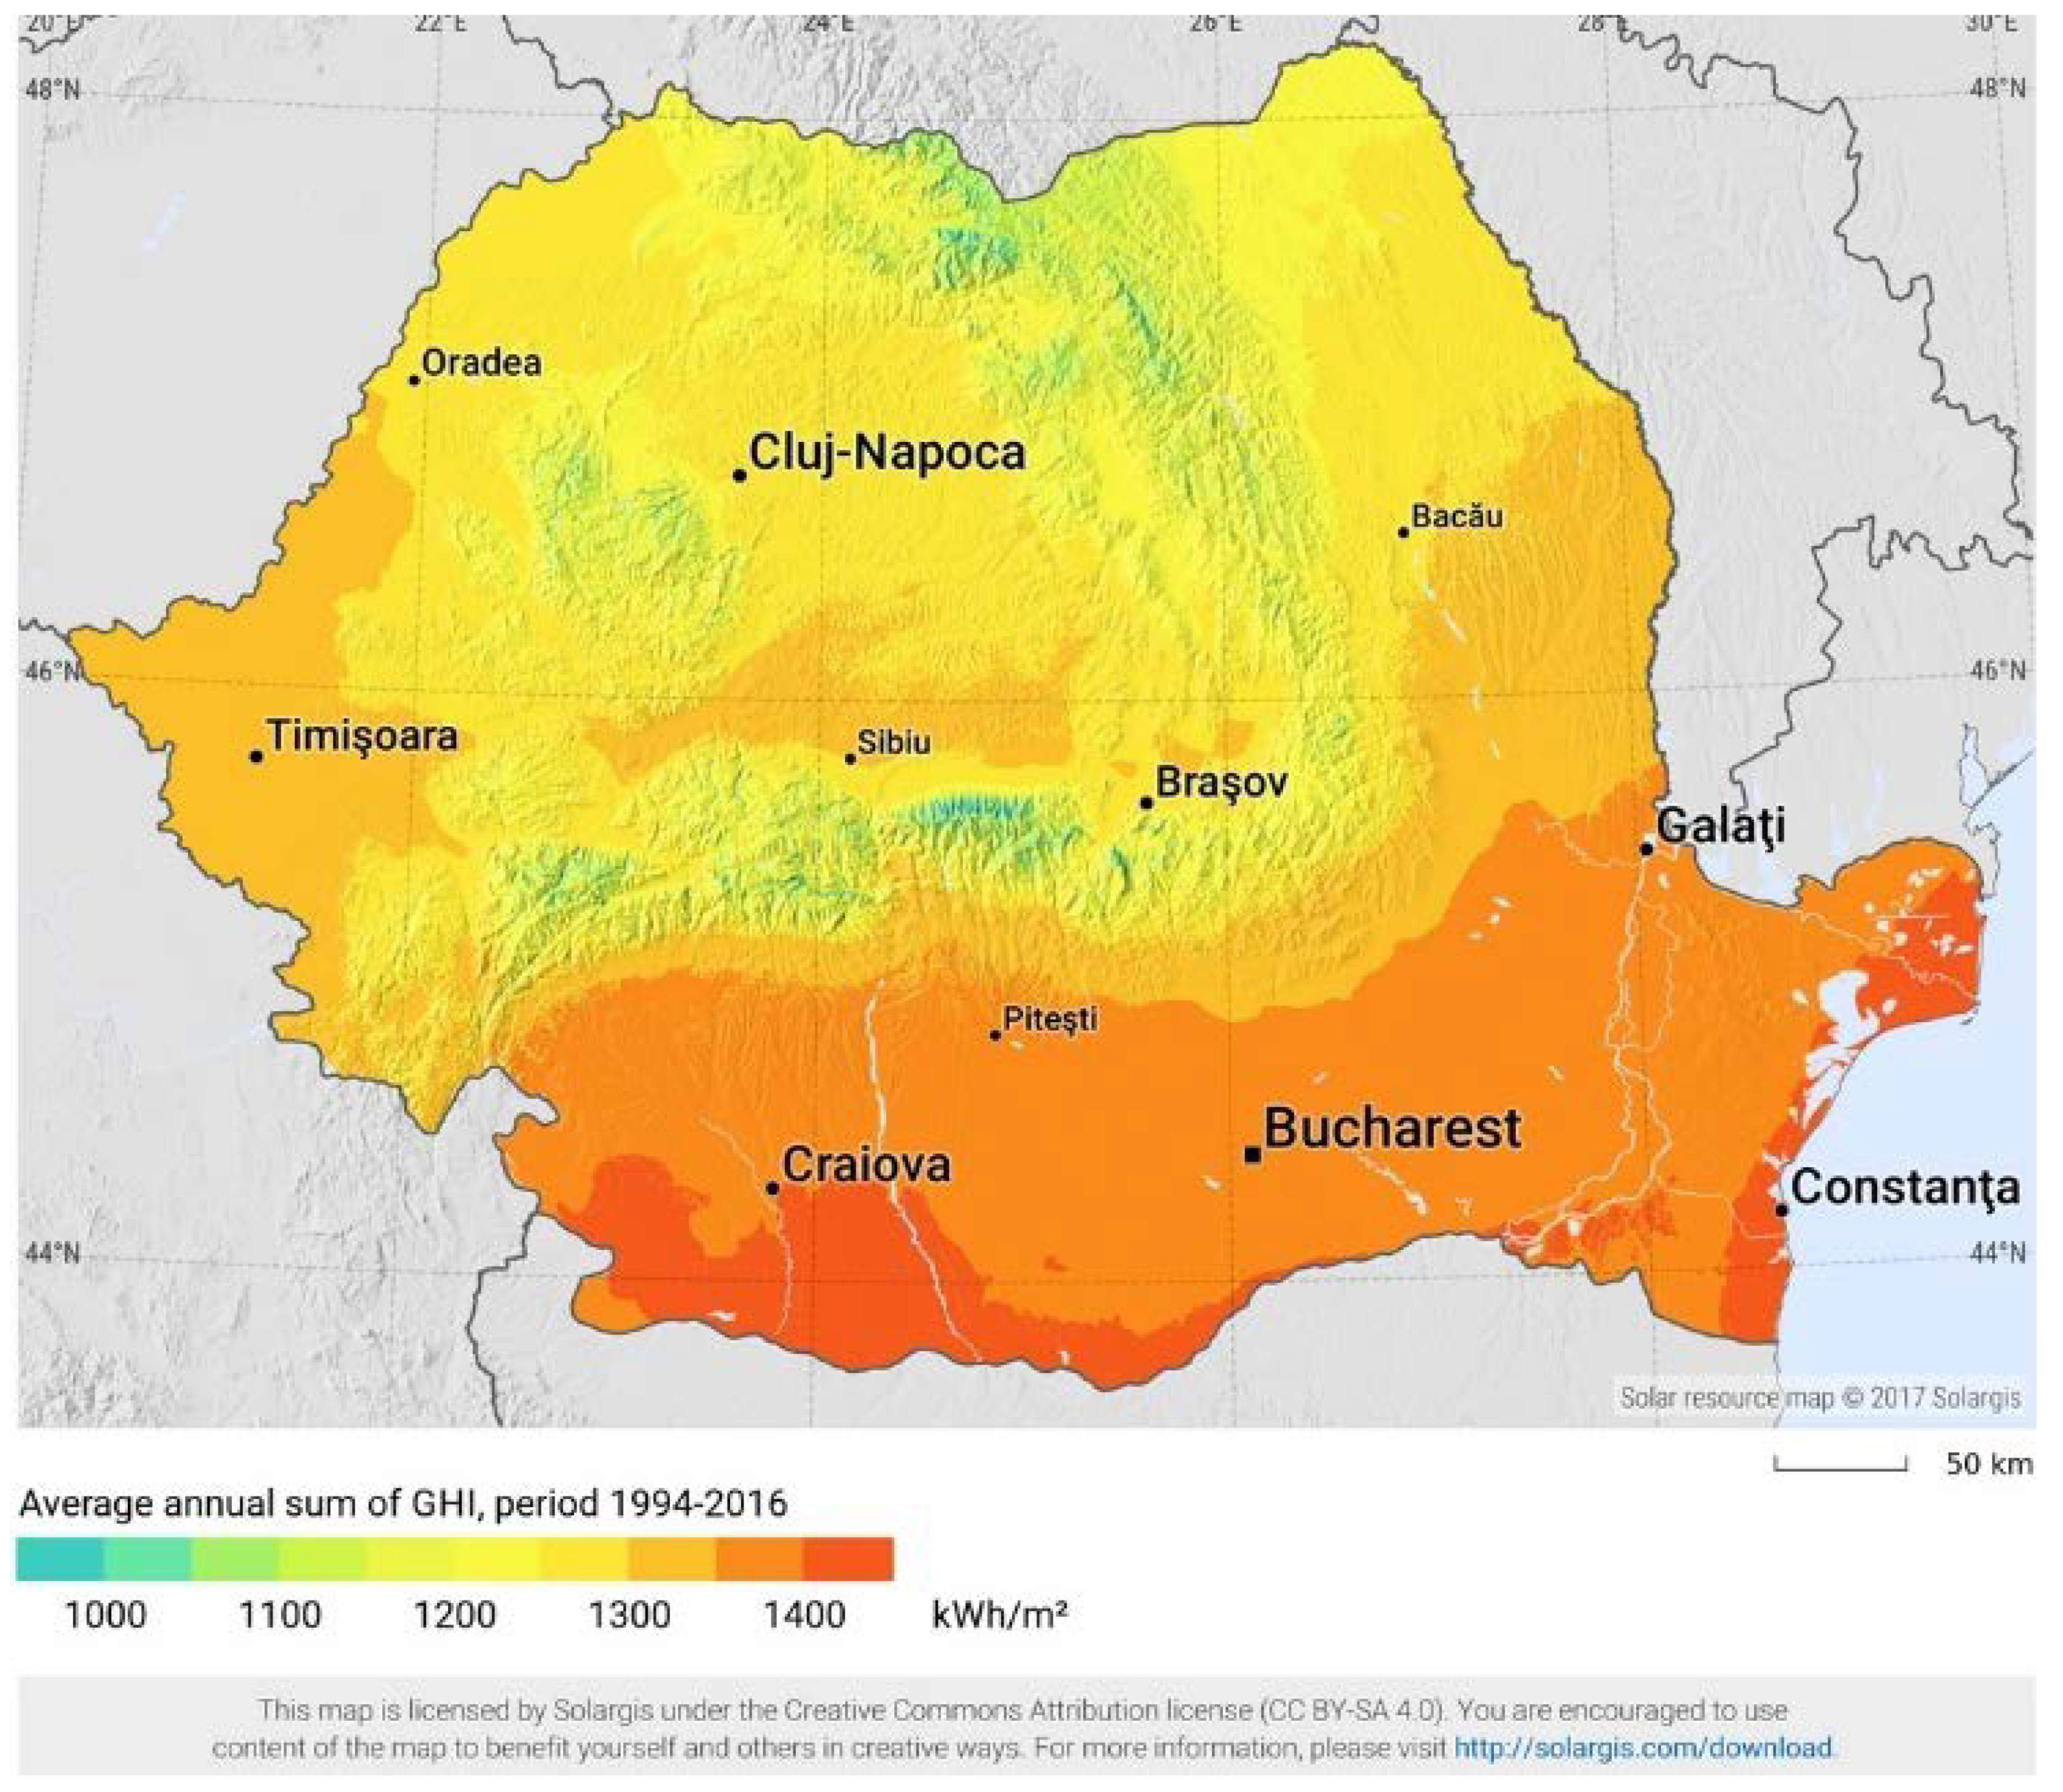
- Dusmanescu, D. Solar Energy Potential as Support for Sustainable Development of Romanian Economy. In Agricultural Management Strategies in a Changing Economy; IGI Global, Hershey: Dauphin County, PA, USA, 2015; pp. 225–252. [Google Scholar]
- Gabriela, R.I.; Catalin, P. Renewable Energy Strategies: Where European Union Headed. Ann. Econ. Ser. 2015, 102–107. [Google Scholar]
- Paun, D. Sustainability and financial performance of companies in the energy sector in Romania. Sustainability 2017, 9, 1722. [Google Scholar] [CrossRef]
- Dias, R.A.; Mattos, C.R.; Balestieri, J.A. Energy education: Breaking up the rational energy use barriers. Energy Policy 2004, 32, 1339–1347. [Google Scholar] [CrossRef]
- Jennings, P. New directions in renewable energy education. Renew. Energy 2009, 34, 435–439. [Google Scholar] [CrossRef]
- Kaygusuz, K. Energy for sustainable development: A case of developing countries. Renew. Sustain. Energy Rev. 2012, 16, 1116–1126. [Google Scholar] [CrossRef]
- Cîrstea, Ş.D.; Martiş, C.S.; Cîrstea, A.; Constantinescu-Dobra, A.; Fülöp, M.T. Current Situation and Future Perspectives of the Romanian Renewable Energy. Energies 2018, 11, 3289. [Google Scholar] [CrossRef]
- Meyer, S.; Laurence, H.; Bart, D.; Middlemiss, L.; Maréchal, K. Capturing the multifaceted nature of energy poverty: Lessons from Belgium. Energy Res. Soc. Sci. 2018, 40, 273–283. [Google Scholar] [CrossRef]
- Petrescu, A.G.; Bîlcan, F.R.; Petrescu, M.; Holban Oncioiu, I.; Türkeș, M.C.; Căpuşneanu, S. Assessing the Benefits of the Sustainability Reporting Practices in the Top Romanian Companies. Sustainability 2020, 12, 3470. [Google Scholar] [CrossRef]
- Ghosh, B.C.; Alam, K.J.; Osmani, M.A.G. Economic growth, CO2 emissions and energy consumption: The case of Bangladesh. Int. J. Bus. Econ. Res. 2014, 3, 220–227. [Google Scholar] [CrossRef]
- Oncioiu, I.; Petrescu, A.G.; Bîlcan, F.R.; Petrescu, M.; Fülöp, M.T.; Topor, D.I. The Influence of Corporate Governance Systems on a Company’s Market Value. Sustainability 2020, 12, 3114. [Google Scholar] [CrossRef]


| S1-2009 | S1-2010 | S1-2011 | S1-2012 | S1-2013 | S1-2014 | S1-2015 | S1-2016 | S1-2017 | S1-2018 | S1-2019 | |
|---|---|---|---|---|---|---|---|---|---|---|---|
| EU28 | 0.2487 | 0.2644 | 0.2725 | 0.2769 | 0.3011 | 0.3145 | 0.3252 | 0.3290 | 0.3398 | 0.3487 | 0.3948 |
| BE | 0.2628 | 0.2930 | 0.3034 | 0.2921 | 0.2907 | 0.2661 | 0.2641 | 0.4088 | 0.4988 | 0.4300 | 0.4742 |
| BG | 0.0844 | 0.0823 | 0.0840 | 0.0857 | 0.0957 | 0.0851 | 0.0969 | 0.0978 | 0.0977 | 0.1000 | 0.1014 |
| CZ | 0.2517 | 0.2612 | 0.2883 | 0.2915 | 0.2922 | 0.2587 | 0.2578 | 0.2670 | 0.2693 | 0.2878 | 0.3204 |
| DK | 0.2991 | 0.2973 | 0.3215 | 0.3308 | 0.3304 | 0.3325 | 0.3865 | 0.3843 | 0.3767 | 0.3838 | 0.3662 |
| DE | 0.3599 | 0.3664 | 0.3835 | 0.3917 | 0.4257 | 0.4329 | 0.4366 | 0.4555 | 0.4742 | 0.4731 | 0.4985 |
| EE | 0.0945 | 0.0995 | 0.1008 | 0.1143 | 0.1424 | 0.1347 | 0.1347 | 0.1247 | 0.1237 | 0.1537 | 0.1644 |
| IE | 0.4330 | 0.4034 | 0.4262 | 0.5466 | 0.6076 | 0.6475 | 0.6970 | 0.4091 | 0.4151 | 0.3842 | 0.3633 |
| EL | 0.1049 | 0.1175 | 0.1580 | 0.1818 | 0.2071 | 0.2302 | 0.2629 | 0.2642 | 0.2300 | 0.2303 | 0.2276 |
| ES | 0.3097 | 0.3870 | 0.3584 | 0.3418 | 0.3714 | 0.4760 | 0.5072 | 0.5215 | 0.5735 | 0.5952 | 0.6570 |
| FR | 0.2169 | 0.2276 | 0.2422 | 0.2411 | 0.2828 | 0.2678 | 0.2870 | 0.2821 | 0.3203 | 0.3468 | 0.3817 |
| HR | 0.2059 | 0.1896 | 0.1822 | 0.2229 | 0.2386 | 0.2286 | 0.2156 | 0.2266 | 0.2035 | 0.2176 | 0.2182 |
| IT | 0.2935 | 0.2833 | 0.2654 | 0.2571 | 0.2789 | 0.2935 | 0.2957 | 0.3135 | 0.3496 | 0.3063 | 0.5561 |
| CY | 0.1393 | 0.2120 | 0.2353 | 0.3180 | 0.3073 | 0.2638 | 0.2274 | 0.1860 | 0.2262 | 0.2976 | 0.3333 |
| LV | 0.1053 | 0.1050 | 0.1168 | 0.1171 | 0.1168 | 0.1164 | 0.1501 | 0.1614 | 0.1900 | 0.2270 | 0.2055 |
| LT | 0.1011 | 0.1212 | 0.1278 | 0.1315 | 0.1421 | 0.1367 | 0.1287 | 0.1261 | 0.1137 | 0.1121 | 0.1303 |
| LU | 0.2684 | 0.2454 | 0.2492 | 0.2492 | 0.2390 | 0.2357 | 0.2397 | 0.2328 | 0.2681 | 0.2913 | 0.3456 |
| HU | 0.1411 | 0.1973 | 0.1887 | 0.1693 | 0.1572 | 0.1369 | 0.1280 | 0.1262 | 0.1274 | 0.1182 | 0.1162 |
| MT | 0.2483 | 0.4235 | 0.4278 | 0.4385 | 0.4265 | 0.3882 | 0.3738 | 0.3522 | 0.4047 | 0.3677 | 0.3573 |
| NL | - | - | - | - | - | - | - | - | −0.1168 | −0.0260 | 0.0792 |
| AT | 0.2727 | 0.2538 | 0.2946 | 0.2978 | 0.3181 | 0.3175 | 0.3550 | 0.3695 | 0.3699 | 0.3652 | 0.3796 |
| PL | 0.1447 | 0.1729 | 0.1889 | 0.1797 | 0.1879 | 0.1845 | 0.1836 | 0.1602 | 0.1881 | 0.1724 | 0.1780 |
| PT | 0.3309 | 0.3379 | 0.3330 | 0.3914 | 0.3251 | 0.3989 | 0.3874 | 0.3819 | 0.3883 | 0.4077 | 0.3759 |
| RO | 0.0982 | 0.1039 | 0.1084 | 0.1085 | 0.1357 | 0.1334 | 0.1366 | 0.1302 | 0.1213 | 0.1332 | 0.1340 |
| SI | 0.2656 | 0.2610 | 0.2300 | 0.2212 | 0.2394 | 0.2527 | 0.2192 | 0.1865 | 0.2638 | 0.3395 | 0.3358 |
| SK | 0.2349 | 0.2246 | 0.2320 | 0.2563 | 0.2734 | 0.2389 | 0.2447 | 0.2154 | 0.2400 | 0.2460 | 0.2556 |
| FI | 0.2429 | 0.2505 | 0.2790 | 0.2851 | 0.2949 | 0.2967 | 0.3039 | 0.3091 | 0.3352 | 0.3446 | 0.3712 |
| SE | 0.2550 | 0.3443 | 0.3635 | 0.3524 | 0.3728 | 0.3554 | 0.3408 | 0.3642 | 0.3745 | 0.4057 | 0.4121 |
| UK | 0.1578 | 0.1470 | 0.1523 | 0.1821 | 0.2031 | 0.2404 | 0.2566 | 0.2480 | 0.2581 | 0.2720 | 0.3042 |
| IS | - | - | - | 0.2015 | 0.3111 | 0.3242 | 0.3302 | 0.3495 | 0.4048 | 0.3791 | 0.3409 |
| LI | - | - | - | - | - | 0.1541 | 0.1852 | 0.1729 | 0.1800 | - | - |
| NO | 0.3705 | 0.4573 | 0.4738 | 0.4567 | 0.4636 | 0.4124 | 0.4041 | 0.3729 | 0.3965 | 0.4144 | 0.4328 |
| ME | - | - | 0.1044 | 0.1247 | 0.2129 | 0.2260 | 0.2229 | 0.2065 | 0.1781 | 0.1819 | 0.1817 |
| MK | - | - | - | - | 0.0836 | 0.0812 | 0.0840 | 0.0829 | 0.0829 | 0.0802 | 0.0800 |
| AL | - | - | 0.1152 | 0.1163 | 0.1156 | 0.1156 | 0.0812 | 0.0824 | 0.0844 | - | - |
| RS | - | - | - | - | 0.2081 | 0.1646 | 0.1460 | 0.2420 | 0.2439 | 0.2568 | 0.2586 |
| TR | 0.1144 | 0.1341 | 0.1217 | 0.1329 | 0.1500 | 0.1194 | 0.1361 | 0.1266 | 0.1047 | 0.0916 | 0.0847 |
| BA | - | - | - | 0.2164 | 0.2270 | 0.2269 | 0.2447 | 0.2130 | 0.2224 | 0.2206 | 0.2090 |
| XK | - | - | - | - | 0.0804 | 0.0803 | 0.0914 | 0.0872 | 0.0941 | 0.0927 | 0.0789 |
| MD | - | - | - | - | - | - | 0.0794 | 0.0940 | 0.0942 | 0.0993 | 0.0912 |
| UA | - | - | - | - | - | - | - | 0.0249(p) | 0.0393 | 0.0308 | 0.0339 |
| 2009 | 2010 | 2011 | 2012 | 2013 | 2014 | 2015 | 2016 | 2017 | 2018 | |
|---|---|---|---|---|---|---|---|---|---|---|
| European Union-27 countries (from 2020) | - | 9.6 | 9.6 | 10.1 | 10.4 | 10.3 | 9.4 | 8.4 | 7.3 | 6.8 |
| European Union-28 countries (2013–2020) | - | 9.1 | 9.0 | 9.9 | 10.2 | 9.9 | 9.1 | 8.1 | 7.0 | 6.6 |
| European Union-27 countries (2007–2013) | 8.9 | 9.0 | 8.9 | 9.8 | 10.0 | 9.8 | 8.9 | 7.9 | 6.9 | 6.5 |
| Euro area (EA11-1999, EA12-2001, EA13-2007, EA15-2008, EA16-2009, EA17-2011, EA18-2014, EA19-2015) | - | - | 7.4 | 7.7 | 8.0 | 8.5 | 8.4 | 7.3 | 6.1 | 6.0 |
| Euro area-19 countries (from 2015) | 7.3 | 7.4 | 7.5 | 7.9 | 8.1 | 8.6 | 8.4 | 7.3 | 6.1 | 6.0 |
| Euro area-18 countries (2014) | 7.2 | 7.4 | 7.5 | 7.8 | 8.1 | 8.5 | 8.4 | 7.2 | 6.1 | 5.9 |
| Belgium | 5.9 | 5.8 | 6.0 | 6.1 | 5.0 | 5.8 | 5.1 | 5.0 | 4.0 | 4.5 |
| Bulgaria | 32.1 | 31.6 | 28.6 | 28.4 | 34.0 | 32.9 | 31.4 | 31.7 | 31.1 | 30.1 |
| Czech Republic | 4.0 | 4.2 | 4.3 | 4.1 | 4.0 | 4.7 | 3.0 | 3.0 | 2.1 | 2.1 |
| Denmark | 2.6 | 3.2 | 3.4 | 3.5 | 3.6 | 4.6 | 3.4 | 2.5 | 3.5 | 5.1 |
| Germany (until 1990 former territory of the FRG) | 3.6 | 3.5 | 3.9 | 3.4 | 3.6 | 4.2 | 4.0 | 3.0 | 2.8 | 3.0 |
| Estonia | 10.0 | 11.0 | 11.8 | 10.9 | 10.4 | 10.0 | 7.9 | 7.9 | 6.3 | 6.5 |
| Ireland | 11.2 | 12.6 | 14.8 | 17.4 | 17.9 | 18.2 | 15.2 | 11.9 | 9.9 | 8.6 |
| Greece | 18.9 | 18.8 | 23.3 | 31.8 | 35.2 | 37.3 | 42.0 | 42.2 | 38.5 | 35.6 |
| Spain | 6.3 | 7.5 | 5.7 | 7.5 | 8.3 | 9.2 | 8.8 | 7.8 | 7.4 | 7.2 |
| France | 7.5 | 7.1 | 7.1 | 6.7 | 6.2 | 6.3 | 5.9 | 6.1 | 6.1 | 6.4 |
| Croatia | - | 28.0 | 27.5 | 28.9 | 30.4 | 29.1 | 28.7 | 25.3 | 21.0 | 17.5 |
| Italy | 11.3 | 11.2 | 12.0 | 11.7 | 11.9 | 12.2 | 12.6 | 8.9 | 4.8 | 4.5 |
| Cyprus | 13.3 | 16.3 | 16.9 | 18.4 | 21.9 | 20.5 | 20.1 | 15.4 | 13.7 | 12.2 |
| Latvia | 17.8 | 22.5 | 23.4 | 22.4 | 20.7 | 19.6 | 16.7 | 13.2 | 11.9 | 11.6 |
| Lithuania | 8.4 | 10.9 | 11.8 | 12.6 | 13.2 | 10.4 | 8.4 | 9.7 | 7.9 | 9.2 |
| Luxembourg | 2.3 | 2.1 | 2.2 | 2.2 | 3.1 | 3.2 | 2.4 | 4.0 | 1.7 | 3.6 |
| Hungary | 20.7 | 22.1 | 22.7 | 24.4 | 25.0 | 22.3 | 19.4 | 16.2 | 13.9 | 11.1 |
| Malta | 7.9 | 6.8 | 8.6 | 10.1 | 11.6 | 14.6 | 10.2 | 9.5 | 5.6 | 6.9 |
| The Netherlands | 2.1 | 2.1 | 2.4 | 2.3 | 2.4 | 3.0 | 2.7 | 2.0 | 2.1 | 1.5 |
| Austria | 4.0 | 4.4 | 4.0 | 3.8 | 4.6 | 3.5 | 3.5 | 4.2 | 3.6 | 2.4 |
| Poland | 12.5 | 13.9 | 12.9 | 14.1 | 14.0 | 14.4 | 9.2 | 9.5 | 8.5 | 6.3 |
| Portugal | 6.1 | 6.4 | 6.7 | 6.3 | 8.2 | 8.5 | 7.8 | 7.3 | 5.6 | 4.5 |
| Romania | 25.1 | 26.5 | 27.3 | 29.7 | 29.7 | 21.5 | 17.4 | 18.0 | 15.9 | 14.4 |
| Slovenia | 16.9 | 18.0 | 17.3 | 19.3 | 19.7 | 20.3 | 17.5 | 15.9 | 14.3 | 12.5 |
| Slovakia | 11.3 | 9.6 | 6.4 | 5.8 | 5.9 | 6.1 | 5.7 | 5.7 | 5.5 | 7.9 |
| Finland | 7.5 | 6.9 | 7.8 | 7.9 | 8.4 | 7.9 | 7.5 | 7.7 | 7.8 | 7.7 |
| Sweden | 5.4 | 5.2 | 4.6 | 4.3 | 4.7 | 3.6 | 3.2 | 2.6 | 2.2 | 2.2 |
| United Kingdom | - | 5.6 | 5.0 | 8.9 | 8.7 | 7.2 | 7.0 | 5.7 | 5.0 | 5.4 |
| Iceland | 3.9 | 7.0 | 7.5 | 7.0 | 7.5 | 7.5 | 6.6 | 6.0 | - | - |
| Norway | 6.5 | 6.3 | 6.9 | 4.6 | 4.5 | 3.1 | 3.2 | 2.4 | 3.0 | 2.7 |
| Switzerland | 5.6 | 4.8 | 3.5 | 3.6 | 3.0 | 4.2 | 3.6 | 4.5 | 3.6 | 4.1 |
| Montenegro | - | - | - | - | 37.3 | 52.3 | 38.4 | 34.8 | 31.6 | - |
| North Macedonia | - | 39.3 | 36.2 | 38.9 | 39.6 | 38.8 | 40.1 | 41.0 | 38.6 | 36.9 |
| Serbia | - | - | - | - | 36.7 | 41.4 | 34.8 | 34.8 | 18.1 | 28.4 |
| Turkey | 39.7 | - | 44.0 | 41.8 | 39.8 | 35.8 | 33.2 | 29.0 | 26.3 | - |
| The Classic Model | The Papillon Model | |
|---|---|---|
| Energy consumption | 591 kWh | 204 kWh |
| Energy cost 10 years (0,36 €/kWh) | 2128 € | 735 € |
| Repair | 300 € | included |
| Provision new appliance | 500 € | - |
| Rental fee | - | 694 € |
| Total cost | 2928 € | 1429 € |
| Variable | Method | Level | 1st Difference | ||||
|---|---|---|---|---|---|---|---|
| Statistic | Prob | Obs | Statistic | Prob | Obs | ||
| ARR | Levin, Lin & Chu | −1.13972 | 0.1272 | 199 | −6.23052 | 0.0000 | 171 |
| Im, Pesaran and Shin W-stat | 0.85448 | 0.8036 | 199 | −1.52648 | 0.0634 | 171 | |
| ADF-Fisher chi-squared | 50.7773 | 0.6723 | 199 | 77.4935 | 0.0302 | 171 | |
| PP-Fisher chi-squared | 51.2924 | 0.6534 | 227 | 140.190 | 0.0000 | 199 | |
| GDP | Levin, Lin & Chu | 10.3967 | 1.0000 | 222 | −10.1537 | 0.0000 | 194 |
| Im, Pesaran and Shin W-stat | 9.54792 | 1.0000 | 222 | −1.33694 | 0.0906 | 194 | |
| ADF-Fisher chi-squared | 12.8363 | 1.0000 | 222 | 74.6374 | 0.0487 | 194 | |
| PP-Fisher chi-squared | 20.7650 | 1.0000 | 250 | 69.7879 | 0.1019 | 222 | |
| PR | Levin, Lin & Chu | −9.87802 | 0.0000 | 224 | - | - | - |
| Im, Pesaran and Shin W-stat | −3.51807 | 0.0002 | 224 | - | - | - | |
| ADF-Fisher chi-squared | 111.535 | 0.0000 | 224 | - | - | - | |
| PP-Fisher chi-squared | 110.542 | 0.0000 | 252 | - | - | - | |
| RENEW | Levin, Lin & Chu | −8.19314 | 0.0000 | 196 | −6.47698 | 0.0000 | 168 |
| Im, Pesaran and Shin W-stat | −0.70777 | 0.2395 | 196 | −2.08310 | 0.0186 | 168 | |
| ADF-Fisher chi-squared | 82.1251 | 0.0130 | 196 | 85.0848 | 0.0073 | 168 | |
| PP-Fisher chi-squared | 74.6963 | 0.0482 | 224 | 130.768 | 0.0000 | 196 | |
| WARM | Levin, Lin & Chu | −0.79261 | 0.2140 | 202 | −83.8692 | 0.0000 | 174 |
| Im, Pesaran and Shin W-stat | 1.58888 | 0.9440 | 202 | −8.78641 | 0.0000 | 174 | |
| ADF-Fisher chi-squared | 42.0318 | 0.9169 | 202 | 87.8995 | 0.0041 | 174 | |
| PP-Fisher chi-squared | 50.3423 | 0.6880 | 230 | 187.726 | 0.0000 | 202 | |
| ARR | GDP | PR | RENEW | WARM | |
|---|---|---|---|---|---|
| ARR | - | −0.756816 | 0.026646 | −0.542304 | 0.958573 |
| GDP | - | 0.597827 | 0.954403 | −0.882561 | |
| PR | - | 0.776807 | −0.174426 | ||
| RENEW | - | −0.727907 | |||
| WARM | - |
| Null Hypothesis: X Does Not Granger Cause Y | Lag1 | Lag2 | Lag 4 | ||||||
|---|---|---|---|---|---|---|---|---|---|
| Obs | F-Statistic | Prob. | Obs | F-Statistic | Prob. | Obs | F-Statistic | Prob. | |
| GDP → ARR | 199 | 0.65741 | 0.4185 | 171 | 0.12821 | 0.8798 | 115 | 0.63582 | 0.6381 |
| ARR → GDP | 0.70168 | 0.4032 | 0.81076 | 0.4463 | 2.05587 | 0.0918 | |||
| PR → ARR | 199 | 4.50500 | 0.0351 | 171 | 2.27040 | 0.1065 | 115 | 2.91410 | 0.0248 |
| ARR → PR | 0.00374 | 0.9513 | 0.26519 | 0.7674 | 0.50699 | 0.7307 | |||
| RENEW → ARR | 196 | 0.85506 | 0.3563 | 168 | 2.08921 | 0.1271 | 112 | 1.30609 | 0.2727 |
| ARR → RENEW | 1.88433 | 0.1714 | 0.10233 | 0.9028 | 0.32235 | 0.8624 | |||
| WARM → ARR | 199 | 10.7082 | 0.0013 | 171 | 14.4907 | 0.000002 | 115 | 3.54172 | 0.0094 |
| ARR → WARM | 2.07083 | 0.1517 | 0.01139 | 0.9887 | 0.92337 | 0.4533 | |||
| PR → GDP | 222 | 0.16866 | 0.6817 | 194 | 0.02139 | 0.9788 | 138 | 0.16035 | 0.9580 |
| GDP → PR | 0.04526 | 0.8317 | 0.06253 | 0.9394 | 2.50856 | 0.0451 | |||
| RENEW → GDP | 196 | 0.18214 | 0.6700 | 168 | 0.51432 | 0.5989 | 112 | 0.68400 | 0.6046 |
| GDP → RENEW | 0.00550 | 0.9409 | 0.06587 | 0.9363 | 0.60201 | 0.6620 | |||
| WARM → GDP | 202 | 0.08995 | 0.7645 | 174 | 0.52699 | 0.5913 | 118 | 0.59411 | 0.6676 |
| GDP → WARM | 0.03966 | 0.8423 | 0.03294 | 0.9676 | 0.15206 | 0.9617 | |||
| RENEW → PR | 196 | 0.09995 | 0.7522 | 168 | 2.44530 | 0.0899 | 112 | 0.31634 | 0.8665 |
| PR → RENEW | 6.85317 | 0.0096 | 2.07078 | 0.1294 | 0.74513 | 0.5634 | |||
| WARM → PR | 202 | 0.05949 | 0.8075 | 174 | 0.04344 | 0.9575 | 118 | 1.75279 | 0.1437 |
| PR → WARM | 4.07290 | 0.0449 | 0.88235 | 0.4157 | 1.69942 | 0.1553 | |||
| WARM → RENEW | 196 | 0.90347 | 0.3430 | 168 | 1.69796 | 0.1863 | 112 | 0.69011 | 0.6004 |
| RENEW → WARM | 0.97074 | 0.3257 | 0.39134 | 0.6768 | 1.17125 | 0.3279 | |||
| Kao Residual Co-Integration Test | ||||
|---|---|---|---|---|
| t-Statistic | Prob. | |||
| ADF | −4.820553 | 0.0000 | ||
| Residual variance | 4.219468 | - | ||
| HAC variance | 1.937356 | - | ||
| Augmented Dickey-Fuller Test Equation | ||||
| Variable | Coefficient | Std. Error | t-Statistic | Prob. |
| RESID(-1) | −0.950714 | 0.071779 | −13.24495 | 0.0000 |
| R-squared | 0.473336 | Mean dependent var | −0.045481 | |
| Adjusted R-squared | 0.473336 | S.D. dependent var | 2.106597 | |
| S.E. of regression | 1.528791 | Akaike info criteria | 3.691921 | |
| Sum squared resid. | 455.7545 | Schwarz criterion | 3.708646 | |
| Log likelihood | −360.8082 | Hannan-Quinn criteria | 3.698692 | |
| Durbin-Watson stat | 2.076981 | |||
| Romanian’s Counties | Net Income Lei* per Habitant | Sun Power kWh/m2 | Wind m/s | Geothermal T (°C) | Natural Gas |
|---|---|---|---|---|---|
| Alba | 2023 | 1300 | 7 | 1131.06 | |
| Arad | 2133 | 1370 | 5 | 80 | 137.06 |
| Arges | 2222 | 1320 | 5 | 265.89 | |
| Bacau | 2047 | 1300 | 8 | 358.46 | |
| Bihor | 1900 | 1290 | 7 | 85 | 220 |
| Bistrita-Nasaud | 1871 | 1250 | 9 | 501 | |
| Botosani | 1921 | 1270 | 7 | 52.9 | |
| Braila | 1840 | 1390 | 9 | 100.12 | |
| Brasov | 2383 | 1300 | 8 | 912.22 | |
| Buzau | 1890 | 1390 | 8 | 342.04 | |
| Calarasi | 2013 | 1400 | 6 | 31.76 | |
| Caras-Severin | 1912 | 1300 | 7 | 199.31 | |
| Cluj | 2670 | 1290 | 3 | 533.83 | |
| Constanta | 2126 | 1450 | 10 | 103.77 | |
| Covasna | 1837 | 1290 | 5 | 159.76 | |
| Dambovita | 1946 | 1370 | 4 | 1232.65 | |
| Dolj | 2082 | 1400 | 5 | 171.9 | |
| Galati | 2193 | 1410 | 8 | 137.51 | |
| Giurgiu | 1895 | 1420 | 6 | 115.93 | |
| Gorj | 2193 | 1300 | 3 | 891.04 | |
| Harghita | 1791 | 1250 | 5 | 436.95 | |
| Hunedoara | 1966 | 1220 | 5 | 555.65 | |
| Ialomita | 1824 | 1390 | 8 | 106.52 | |
| Iasi | 2278 | 1280 | 7 | 467.89 | |
| Ilfov | 2913 | 1400 | 5 | 45 | 676.99 |
| Maramures | 1837 | 1190 | 4 | 692.66 | |
| Mehedinti | 2161 | 1390 | 5 | 10.57 | |
| Mures | 2128 | 1320 | 4 | 2733.31 | |
| Neamt | 1883 | 1330 | 6 | 212.2 | |
| Olt | 2148 | 1400 | 6 | 299.06 | |
| Prahova | 2189 | 1370 | 4 | 1526.99 | |
| Salaj | 1915 | 1300 | 5 | 252.44 | |
| Satu Mare | 1936 | 1330 | 5 | 80 | 269.88 |
| Sibiu | 2468 | 1290 | 4 | 929.12 | |
| Suceava | 1833 | 1240 | 6 | 183.89 | |
| Teleorman | 1780 | 1400 | 4 | 21.28 | |
| Timis | 2501 | 1340 | 5 | 75 | 234.37 |
| Tulcea | 1937 | 1400 | 9 | 33.74 | |
| Vaslui | 1882 | 1380 | 8 | 91.52 | |
| Valcea | 1870 | 1370 | 5 | 362.01 | |
| Vrancea | 1890 | 1380 | 6 | 46 |
| Romanian’s Counties | Solutions for Improving Access to Energy/Combating Energy Poverty |
|---|---|
| Alba | In addition to extend the natural gas distribution networks, subsidies can be granted for the installation of technologies that harness the force of the wind (wind energy) and sunshine (solar energy). |
| Arad | In addition to extend the natural gas distribution networks, subsidies may be granted for the installation of technologies that harness the force of the wind (wind energy), the heat of the ground water (geothermal energy), and the sun (solar energy). |
| Arges | In addition to extend the natural gas distribution networks, subsidies can be granted for the installation of technologies that harness the sun (solar energy). |
| Bacau | In addition to extend the natural gas distribution networks, subsidies can be granted for the installation of technologies that harness the force of the wind (wind energy). |
| Bihor | In addition to expand the natural gas distribution networks, subsidies can be granted for the installation of technologies that harness the heat of the water from the earth (geothermal energy). |
| Bistrita-Nasaud | In addition to extend the natural gas distribution networks, subsidies can be granted for the installation of technologies that harness the force of the wind (wind energy). |
| Botosani | In addition to extend the natural gas distribution networks, subsidies can be granted for the installation of technologies that harness the sun (solar energy). |
| Braila | In addition to extend the natural gas distribution networks, subsidies can be granted for the installation of technologies that harness the force of the wind (wind energy). |
| Brasov | In addition to extend the natural gas distribution networks, subsidies can be granted for the installation of technologies that harness the force of the wind (wind energy). |
| Buzău | In addition to extend the natural gas distribution networks, subsidies can be granted for the installation of technologies that harness the sun (solar energy). |
| Calarasi | In addition to extend the natural gas distribution networks, subsidies can be granted for the installation of technologies that harness the sun (solar energy). |
| Caras-Severin | In addition to extend the natural gas distribution networks, subsidies can be granted for the installation of technologies that harness the force of the wind (wind energy). |
| Cluj | In addition to extend the natural gas distribution networks, subsidies can be granted for the installation of technologies that harness the force of the wind (wind energy) and sunshine (solar energy). |
| Constanta | In addition to extend the natural gas distribution networks, subsidies can be granted for the installation of technologies that harness the sun (solar energy) and wind power (wind energy). |
| Covasna | In addition to extend the natural gas distribution networks, subsidies can be granted for the installation of technologies that harness the force of the wind (wind energy). |
| Dambovita | In addition to extend the natural gas distribution networks, subsidies can be granted for the installation of technologies that harness the sun (solar energy). |
| Dolj | In addition to extend the natural gas distribution networks, subsidies can be granted for the installation of technologies that harness the sun (solar energy). |
| Galati | In addition to extend the natural gas distribution networks, subsidies can be granted for the installation of technologies that harness the force of the wind (wind energy). |
| Giurgiu | In addition to extend the natural gas distribution networks, subsidies can be granted for the installation of technologies that harness the sun (solar energy). |
| Gorj | In addition to extend the natural gas distribution networks, subsidies can be granted for the installation of technologies that harness the force of the wind (wind energy). |
| Harghita | In addition to extend the natural gas distribution networks, subsidies can be granted for the installation of technologies that harness the force of the wind (wind energy). |
| Hunedoara | In addition to extend the natural gas distribution networks, subsidies can be granted for the installation of technologies that harness the force of the wind (wind energy). |
| Ialomita | In addition to extend the natural gas distribution networks, subsidies can be granted for the installation of technologies that harness the sun (solar energy) and wind power (wind energy). |
| Iasi | In addition to extend the natural gas distribution networks, subsidies can be granted for the installation of technologies that harness the sun (solar energy). |
| Ilfov | In addition to expand the natural gas distribution networks, subsidies can be awarded for the installation of technologies that harness the heat of the water from the earth (geothermal energy) and solar (solar energy). |
| Maramures | In addition to expand the natural gas distribution networks, subsidies can be granted for the installation of technologies that harness the heat of the water from the earth (geothermal energy). |
| Mehedinti | In addition to extend the natural gas distribution networks, subsidies can be granted for the installation of technologies that harness the force of the wind (wind energy). |
| Mures | In addition to extend the natural gas distribution networks, subsidies can be granted for the installation of technologies that harness the force of the wind (wind energy) and sunshine (solar energy). |
| Neamt | In addition to extend the natural gas distribution networks, subsidies can be granted for the installation of technologies that harness the force of the wind (wind energy). |
| Olt | In addition to extend the natural gas distribution networks, subsidies can be granted for the installation of technologies that harness the sun (solar energy). |
| Prahova | In addition to extend the natural gas distribution networks, subsidies can be granted for the installation of technologies that harness the sun (solar energy). |
| Salaj | In addition to expand the natural gas distribution networks, subsidies can be granted for the installation of technologies that harness the heat of the water from the earth (geothermal energy). |
| Satu mare | In addition to expand the natural gas distribution networks, subsidies can be granted for the installation of technologies that harness the heat of the water from the earth (geothermal energy). |
| Sibiu | In addition to extend the natural gas distribution networks, subsidies can be granted for the installation of technologies that harness the sun (solar energy) and wind power (wind energy). |
| Suceava | In addition to extend the natural gas distribution networks, subsidies can be granted for the installation of technologies that harness the sun (solar energy). |
| Teleorman | In addition to extend the natural gas distribution networks, subsidies can be granted for the installation of technologies that harness the sun (solar energy). |
| Timis | In addition to extend the natural gas distribution networks, subsidies can be granted for the installation of technologies that harness the heat of the water from the earth (geothermal energy), and sunshine (solar energy). |
| Tulcea | In addition to extend the natural gas distribution networks, subsidies can be granted for the installation of technologies that harness the sun (solar energy) and wind power (wind energy). |
| Vaslui | In addition to extend the natural gas distribution networks, subsidies can be granted for the installation of technologies that harness the force of the wind (wind energy). |
| Valcea | In addition to extend the natural gas distribution networks, subsidies can be granted for the installation of technologies that harness the sun (solar energy). |
| Vrancea | In addition to extend the natural gas distribution networks, subsidies can be granted for the installation of technologies that harness the force of the wind (wind energy). |
© 2020 by the authors. Licensee MDPI, Basel, Switzerland. This article is an open access article distributed under the terms and conditions of the Creative Commons Attribution (CC BY) license (http://creativecommons.org/licenses/by/4.0/).
Share and Cite
Neacsa, A.; Panait, M.; Muresan, J.D.; Voica, M.C. Energy Poverty in European Union: Assessment Difficulties, Effects on the Quality of Life, Mitigation Measures. Some Evidences from Romania. Sustainability 2020, 12, 4036. https://doi.org/10.3390/su12104036
Neacsa A, Panait M, Muresan JD, Voica MC. Energy Poverty in European Union: Assessment Difficulties, Effects on the Quality of Life, Mitigation Measures. Some Evidences from Romania. Sustainability. 2020; 12(10):4036. https://doi.org/10.3390/su12104036
Chicago/Turabian StyleNeacsa, Adrian, Mirela Panait, Jianu Daniel Muresan, and Marian Catalin Voica. 2020. "Energy Poverty in European Union: Assessment Difficulties, Effects on the Quality of Life, Mitigation Measures. Some Evidences from Romania" Sustainability 12, no. 10: 4036. https://doi.org/10.3390/su12104036
APA StyleNeacsa, A., Panait, M., Muresan, J. D., & Voica, M. C. (2020). Energy Poverty in European Union: Assessment Difficulties, Effects on the Quality of Life, Mitigation Measures. Some Evidences from Romania. Sustainability, 12(10), 4036. https://doi.org/10.3390/su12104036