Article

Comparing Water Use Forecasting Model Selection Criteria: The Case of Commercial, Institutional, and Industrial Sector in Southern California

1
Department of Economics, University of Nevada, Reno, NV 89557, USA
2
Department of Agricultural Economics, University of Kentucky, Lexington, KY 40506, USA
*
Author to whom correspondence should be addressed.
Sustainability 2020, 12(10), 3995; https://doi.org/10.3390/su12103995
Submission received: 14 April 2020 / Revised: 1 May 2020 / Accepted: 2 May 2020 / Published: 13 May 2020
(This article belongs to the Section Economic and Business Aspects of Sustainability)

Abstract

:
The United States is one of the largest per capita water withdrawers in the world, and certain parts of it, especially the western region, have long experienced water scarcity. Historically, the U.S. relied on large water infrastructure investments and planning to solve its water scarcity problems. These large-scale investments as well as water planning activities rely on water forecast studies conducted by water managing agencies. These forecasts, while key to the sustainable management of water, are usually done using historical growth extrapolation, conventional econometric approaches, or legacy software packages and often do not utilize methods common in the field of statistical learning. The objective of this study is to illustrate the extent to which forecast outcomes for commercial, institutional and industrial water use may be improved with a relatively simple adjustment to forecast model selection. To do so, we estimate over 352 thousand regression models with retailer level panel data from the largest utility in the U.S., featuring a rich set of variables to model commercial, institutional, and industrial water use in Southern California. Out-of-sample forecasting performances of those models that rank within the top 5% based on various in- and out-of-sample goodness-of-fit criteria were compared. We demonstrate that models with the best in-sample fit yeild, on average, larger forecast errors for out-of-sample forecast exercises and are subject to a significant degree of variation in forecasts. We find that out-of-sample forecast error and the variability in the forecast values can be reduced by an order of magnitude with a relatively straightforward change in the model selection criteria even when the forecast modelers do not have access to “big data” or utilize state-of-the-art machine learning techniques.

1. Introduction

The United States (U.S.) is one of the largest per capita water withdrawers in the world [1]. It has a large water supply overall; however, water scarcity is still a challenge as water is not present where, when, and in the form it is needed. A large portion of the Western U.S. has been vulnerable to drought, and this also portion constitutes the areas with the fastest population growth [2]. Water is an essential input for most sectors in the economy; hence, its scarcity has caused the U.S. to be historically dependent on large water infrastructure investments as well as extensive planning, both of which rely on water use forecasts [3,4]. The severity of droughts is expected to be exacerbated by the changing climate [5,6], which increases the importance of reliable forecasts for sustainable water management. California, by far the largest U.S. state both by population [7] and by economic activity measured using gross domestic product (GDP) [8], requires all water utilities serving more than 3000 users to formulate an Urban Water Management Plan (UWMP) every five years [9]. UWMPs guide important water infrastructure investment and policy decisions.
Water use is studied within three broad sectors, which are agriculture, residential, and commercial, institutional, and industrial (CII). For definition and terminology, see [10]. These studies are conducted both within academia and by water utilities where there are two overarching objectives: forecasting water use and estimation of policy parameters such as responsiveness to price or other interventions such as social comparisons and subsidies on low flow equipment.
Advances in computational power and the size of data collected in different contexts has meant increased interest in statistical learning in a variety of fields, and especially in the field of forecasting. While we see some examples of such methods being used in water studies by academic researchers, there is evidence that it is not the norm [11]; further, the ones conducted by water utilities rely on extrapolation based on historical growth, conventional econometric methods, and black-box software packages (see the literature review section for more detail).
A prominent idea in the field of statistical learning is the distinction between the training error and test error. The former refers to the error within the training sample, whereas the latter is the measure of error that results from using a statistical learning method to predict the outcome on a new observation that was not used in the training process. Training error can be easily calculated by applying the model to the observations used in its training, a concept referred to as in-sample goodness-of-fit in the field of econometrics. Training error often differs from test error rate, and in particular, the former can significantly underestimate the latter [12]. The statistical learning field offers a class of methods that estimate the test error by holding out a subset of the training observations from the model fitting process and then applying the model to those observations that are held out. This is known as the validation set approach, namely allocating the available set of observations into two parts, a training set and a validation (or hold-out) set. The model is fit on the training set, and the fitted model is used to predict the outcomes in the validation set. The resulting validation set error, typically assessed using mean squared error, gives an estimate of the test error. For a more detailed explanation of the concepts, see James, Witten, Hastie, et al. [13].
The main objective of this study is to demonstrate, within the context of CII water use, how current practices prevalent in water forecast studies published by many utilities as well as academic researchers can be prone to large forecast errors and how these forecasts can be significantly improved with a relatively straightforward adjustment. Specifically, we estimate a large set of models and implement the validation set method described above. Then we rank the models based on their performance in forecasting data points that are outside of the training sample, which is also known as out-of-sample performance. Afterward, we compare the forecast performances of the models that are selected in this fashion to those of the ones that would be selected based on more conventional metrics that are widely used in econometric studies.
The context within which we conduct our study is the CII water use in the Metropolitan Water District of Southern California (MWDSC), the largest water utility in the U.S. by population served and treated water delivery [14]. The output of our analysis is a distribution of CII water use forecasts in Southern California.
Studying CII water use is important for an array of reasons. First, it remains an understudied component of urban water demand and management mostly due to lack of data, and because of the variety of different activities in the sector. Due to differences in drivers of water use, it is not appropriate to rely on findings from the residential or agricultural sector to forecast CII water use. For example, it is shown that although the amount of water use in the commercial sector is somewhat sensitive to water price, it is not as sensitive as residential water use [15].
Second, while CII water use is not as large a portion of publicly supplied water in the U.S. [16] as are residential and agriculture sectors, in terms of overall water use, it still has a sizeable share because self-supply of water is common in the CII sector [17]. The portion of CII water use via self-supply, however, may become smaller since water shortages in the western U.S. have led to state governments becoming more involved in water resource management. For example, in California, lawmakers passed a landmark legislation in 2014 that aims to regulate, for the first time, sustainable groundwater management [2]. This trend towards a centralized management mechanism further increases the importance of planning and forecasting within the CII sector, at least from the perspective of public water suppliers. Additionally, changing trends in the economic landscape of both developed and developing countries, a shift towards commercial activities in developed countries, and increasing industrial activities gaining pace in developing nations [18] are likely to increase the relative importance of CII sectors in total water use. As an example, the majority of the water used in industrial activities in California is, for the time, being self-supplied, while commercial water is supplied by public utilities [17]. Therefore, in addition to the institutional changes mentioned above, the shift from industrial towards commercial activities in the economic mix is another reason we may see the CII sector take up a greater share of publicly supplied water in the U.S.
Third, the CII sector already makes up a considerable portion of water use in other parts of the world, which makes this study relevant in the international context as well. In Europe, the industrial sector accounts for 23% of total water use, with significant variability in water use patterns across countries [19].
Finally, water-saving measures are likely to be a crucial part of overall water management in the face of droughts induced by climate change, rising population, and the surge in per capita demand due to globally increasing life standards [20,21]. The commercial sector can be an important avenue to save water, for example, through various rebate programs [22,23,24]. Effective implementation and credible evaluation of such programs will require reliable water use forecasts in the CII sector, which will also improve the success of water plans and budgets.

1.1. Current State of the Literature

There is a large body of literature studying urban water use, which can be divided into two main groups. The first group comprises studies that look at the effect of price and various other factors on water demand as well as determine the weight of different determining components. For a meta-analysis on earlier work, see Espey [25]. Estimating the effect of price on quantity demanded poses an econometric challenge, known as the simultaneity problem because quantity demanded and price affect each other simultaneously. Said differently, since the suppliers can set the price depending on what they expect the demand to be, the price is not an actual “independent variable”. Therefore a price response parameter recovered from observational data cannot easily offer a credible estimate of the price effect. In order to overcome this challenge, more recent studies have used experimental methods to investigate the effect of price as well as other factors like social norms and comparisons [26,27,28,29]. Quasi-experimental methods like difference-in-difference and regression discontinuity design are also being more commonly used in recent years to avoid the simultaneity bias, where methods to study the effect of price and interventions such as low flow equipment on demand. Romano, Salvati, and Guerrini [30], and Morote, Hernández, and Rico [31] are examples of studies that study the individual determinants of urban water demand from Italy and Spain. An accessible account of experimental and quasi-experimental econometric methods can be found in Angrist and Pischke [32].
Though not as numerous as residential water forecast studies, we do see examples of papers that specifically focus on water use in the CII sector. Using survey data from large manufacturing plants in New Jersey, Derooy [33] calculated a price elasticity of 0.89. Ziegler and Bell [34] did a similar study for self-supplied firms in Arkansas. Within the context of Canadian manufacturing firms, Renzetti [35] used instrumental methods for price to avoid the simultaneity problem in their estimations for the price elasticity of water use. Using a system of simultaneous equations method, Babin, Willis, and Allen [36] examined the relationship of water intake and the utilization of other outputs (the degree of substitutability). Using data from 51 industrial plants in France and both seemingly unrelated regression and the feasible generalized least squared methodology, Reynaud [37] demonstrates how the elasticity of water use varies across water sources. As an alternative to an econometric method, Calloway, Schwartz, and Thompson [38] develop a linear programming model in order to analyze the effects of water quality policy on the use of water in ammonia production and on the cost of ammonia.
Another strand of studies pertains to water demand forecasting, to which our study contributes. In these studies, credible identification of parameters in the face of omitted variable type problems (such as the simultaneity problem explained above) is not necessarily the main objective. Rather, the priority is to generate accurate water use forecasts for the future in order to formulate policies and guide infrastructure investment decisions financed by tax or rate payer funds. For example, Alhumoud [39] uses 50 years of annual country-level data from Kuwait and time-series methods to generate forecasts 20 years into the future. His model selection method is based on the Box-Jenkins method. Using monthly household-level data from California, Brekke, and Larsen [40] demonstrate that modeling water demand via stepwise regression is an accessible alternative to the trend analysis method that is widely used in smaller suburban utilities. We also see examples of studies that use decision support systems (DSSs) from different geographies like China, the U.K., and California [41,42,43]. DSSs are used as a part of integrated frameworks that provide forecast output for different scenarios. Other urban water forecast works from the U.K. include Khatri and Vairavamoorthy [44], that use time series methods and ten years of monthly water use data from Birmingham, and Williamson, Mitchell, and McDonald [45], that use imputed household water use data and multilinear regression method. For thorough qualitative and quantitative reviews of models and methods, see Donkor, Mazzuchi, and Soyer [46] and Sebri [47], respectively.
In recent years, we see a surge in the studies that utilize state-of-the-art machine learning techniques in urban water use forecasting. Usually, these studies compare the forecast performances of different modeling methods using actual water use data from different parts of the world. Unlike any of the papers cited above, it is common to see out-of-sample forecast performance being used in these studies. For example, with water use data from South Africa, Oyebode and Ighravwe [48] provide a comparison of the performances of artificial neural networks (ANNs) (with two different algorithms), support vector machines (SVMs), and multiple linear regression methods. They find that evolutionary ANN performs better than the rest of the methods, while regression method outperformed ANN with the conjugate gradient algorithm. House-Peters and Chang [49] use data from Canada to compare the wavelet-bootstrap-neural-network (WBNN) method with moving average and bootstrap-based neural networks. Moving average, exponential smoothing, and ANN models are compared in Kofinas, Mellios, Papageorgiou, et al. [50] who have 3 years of time series data from a touristic island in Greece. Using urban water data use from southeastern Spain, Herrera, Torgo, Izquierdo, et al. [51] demonstrate that the SVM performs better than multivariate adaptive regression splines and random forests. In his detailed meta-analysis, Sebri [47] shows that forecast methods make a difference in the forecast errors. He states that ANN, Box-Jenkins, and SVM methods, on average, result in lower forecast errors than methods such as multilinear regression or Kalsman filter. Other recent examples of forecast papers that perform a comparison among different techniques including machine learning algorithms, time series, etc. include Adamowski and Karapataki [52] and Ghiassi, Zimbra, and Saidane [53].
While advanced machine learning and big-data methods can offer advantages, they may not be immediately accessible to smaller water utilities, who may or may not employ in-house data analysts with these skills [40]. Water Resources Municipal and Industrial Needs (IWR-MAIN) is a software that has been widely used by utilities to forecast water demand. In this method, the size of each CII sector is estimated using total employment, and CII water use is estimated based on the Standard Industrial Classification (SIC) of sectors. The method uses regression analysis to determine water intensity of each sector where the explanatory variables are the number of employees, the price of the water and sewer services, and whether or not there was a water conservation program [54]. A nationwide survey of over 3 thousand establishments and surveys from manufacturers from the U.S. Census Bureau and the California Department of Water Resources were utilized to improve the model [55]. The main intuition of this approach is to estimate a “water use coefficient" for each sector, multiply that by the forecasted size of the sector, and then sum up the estimated water use across all sectors. A summary of the historical progression of the IWR-MAIN model can be found in Morales, Heaney, Friedman, et al. [56].
Further, the current version of IWR-MAIN and its application among California utilities is discussed in a 2019 report by Dziegielewski et. al. [57]. The approach of IWR-MAIN has inspired similar applications by other utilities. For example, using establishment-level water billing and employment data from Idaho, Cook, Urban, Maupin, et al. [58] calculate the standard industrial classification (SIC) level employment coefficients, which are a weighted average of the per-employee water consumption for the SICs. Then, under various growth scenarios and employment forecasts, they use these coefficients to project water use into future periods. For an example, Morales, Heaney, Friedman, et al. [56] present a CII water use estimation methodology using a rich database of parcel-level consumer attributes and water use billing from Florida.
In addition to software packages, regression-based econometric models are currently being used by the utilities for forecast purposes. See Buck, Auffhammer, Soldati, et al. [11] for a summary of methods being used by a group of large California utilities; they show out-of-sample performance is not commonly used as a model selection criterion and forecast modelers typically only consider a narrow set of models.
In this paper, we show that the forecast performance among models of CII water use can be significantly improved with a relatively small adjustment in the model selection methodology, even if the state-of-the-art machine learning algorithms are not used. Using a model space of 352,116 models, we look at how the models that yield the best results based on R-squared and/or other common in-sample-fit criteria such as adjusted R-Squared, Akaike information criterion (AIC), and Bayesian information criterion (BIC) perform when forecasting out-of-sample. AIC and BIC or Schwarz Criterion are methods of comparing alternative specifications by adjusting the summed squared residuals for the sample size and the number of independent variables [59]. See Table 4 for the formulas. We then compare them to those models that would be selected under three different out-of-sample criteria we define.

1.2. Preview of the Results

The out-of-sample fit criteria are defined following Auffhammer and Steinhauser [60], which are also commonly used in evaluating models in the field of machine learning. Models are generated through inclusion and exclusion of different key covariates and the actual versus logged values of the dependent variable. The dependent variable is the water retailer (utility) level total annual CII water use. Covariates include median tier price, manufacturing and service sector employment in the service area of the retailer, and weather variables (maximum temperature, degree days, and precipitation). Degree days are defined as the difference between the daily temperature mean, (high temperature plus low temperature divided by two) and 65 °F. In other words, the temperature mean is above 65 °F, we subtract 65 from the mean, and the result is “degree days” [61].
In order to account for the fact that the demand for CII water is derived, together with other factors of production, we also included real U.S. GDP as a proxy for the overall purchasing power in the economy.
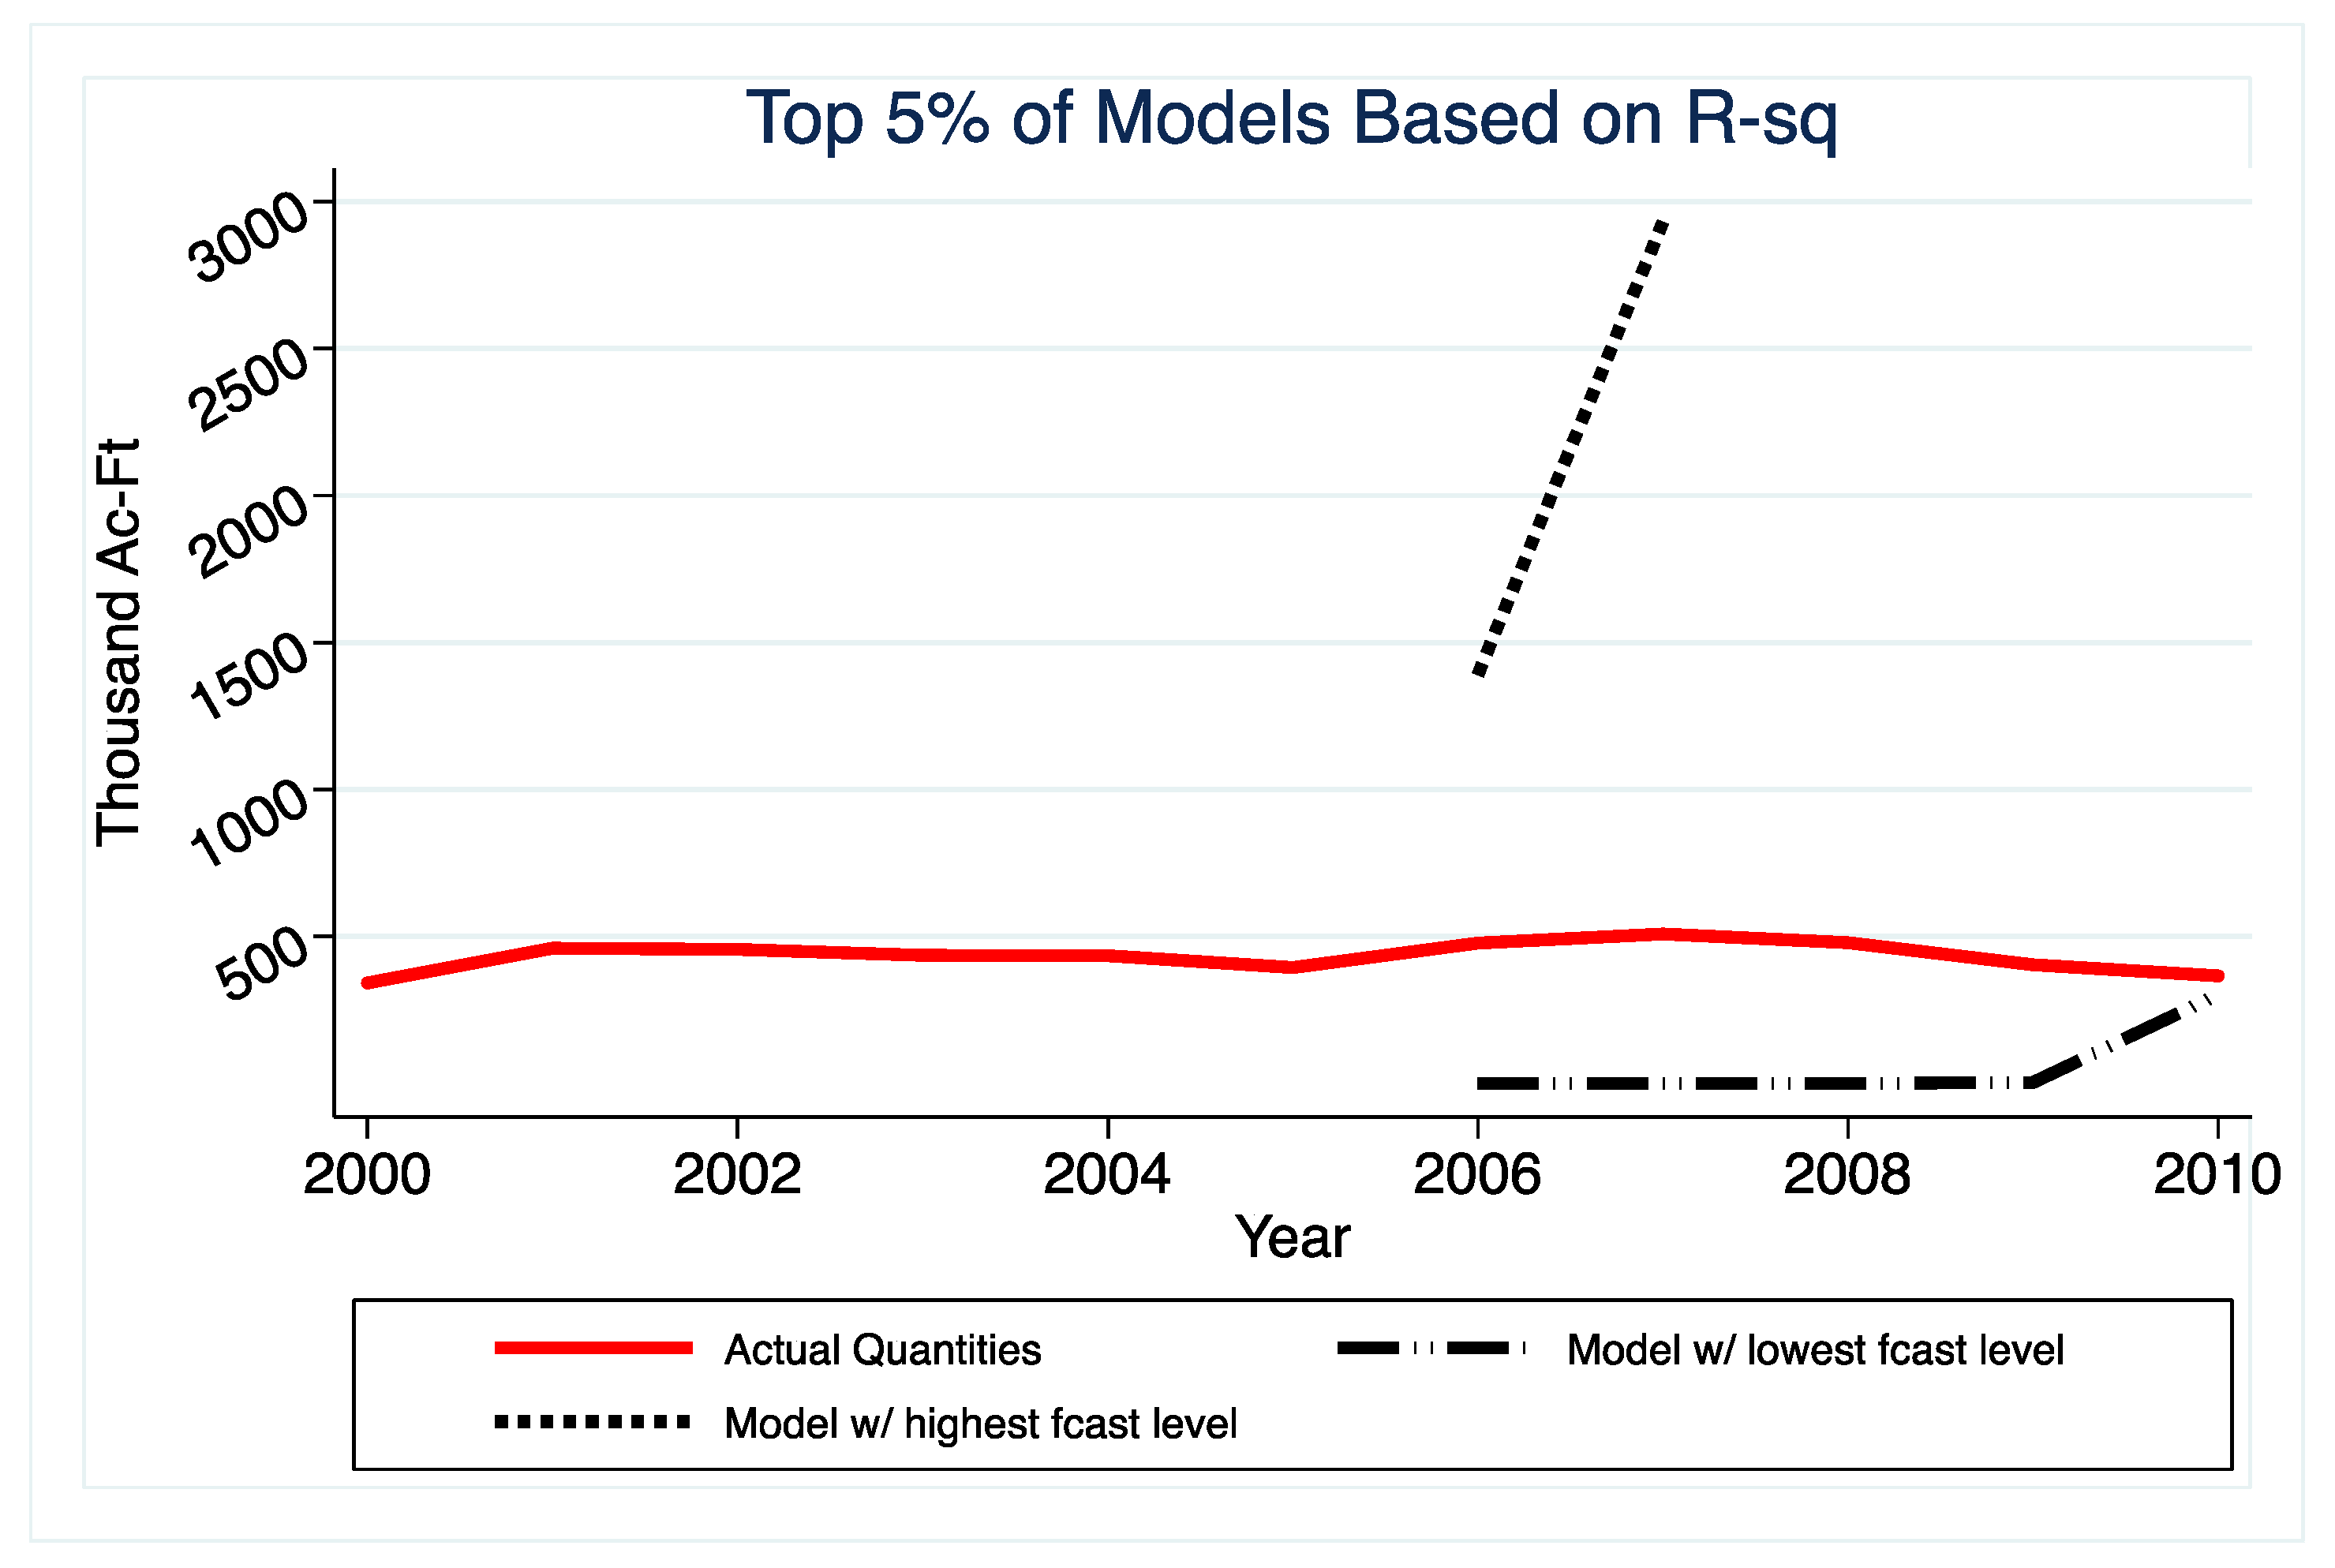
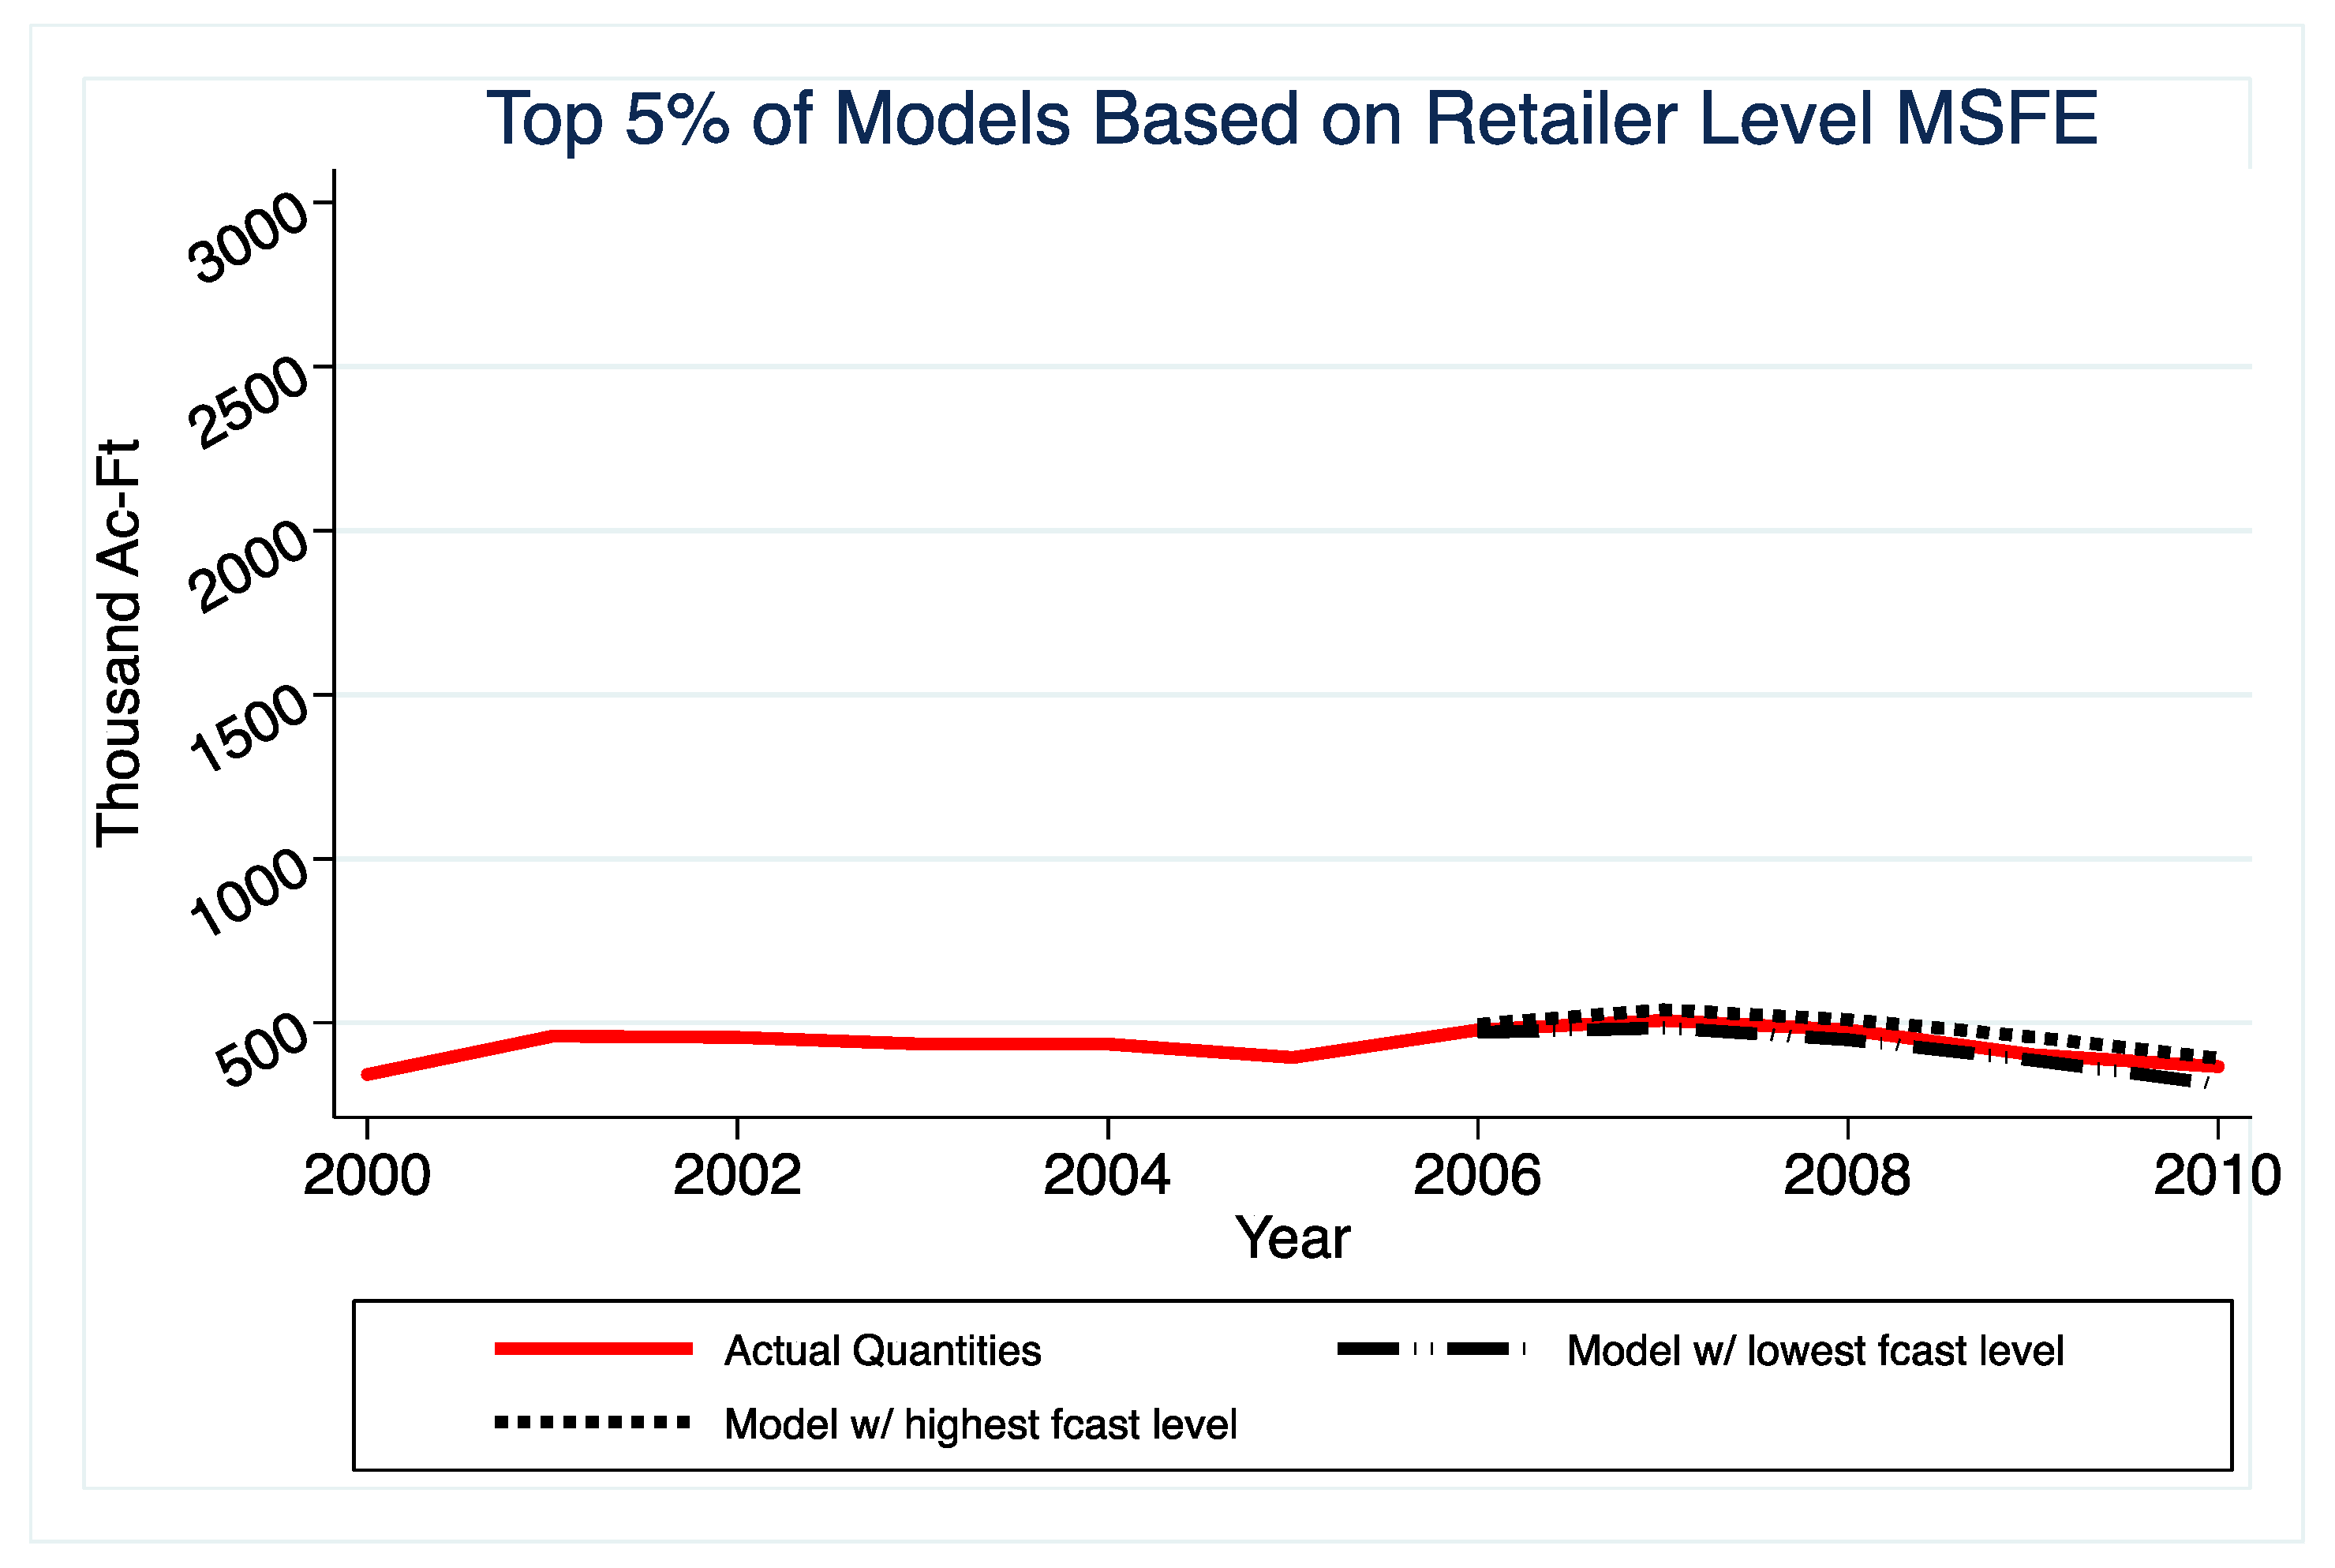
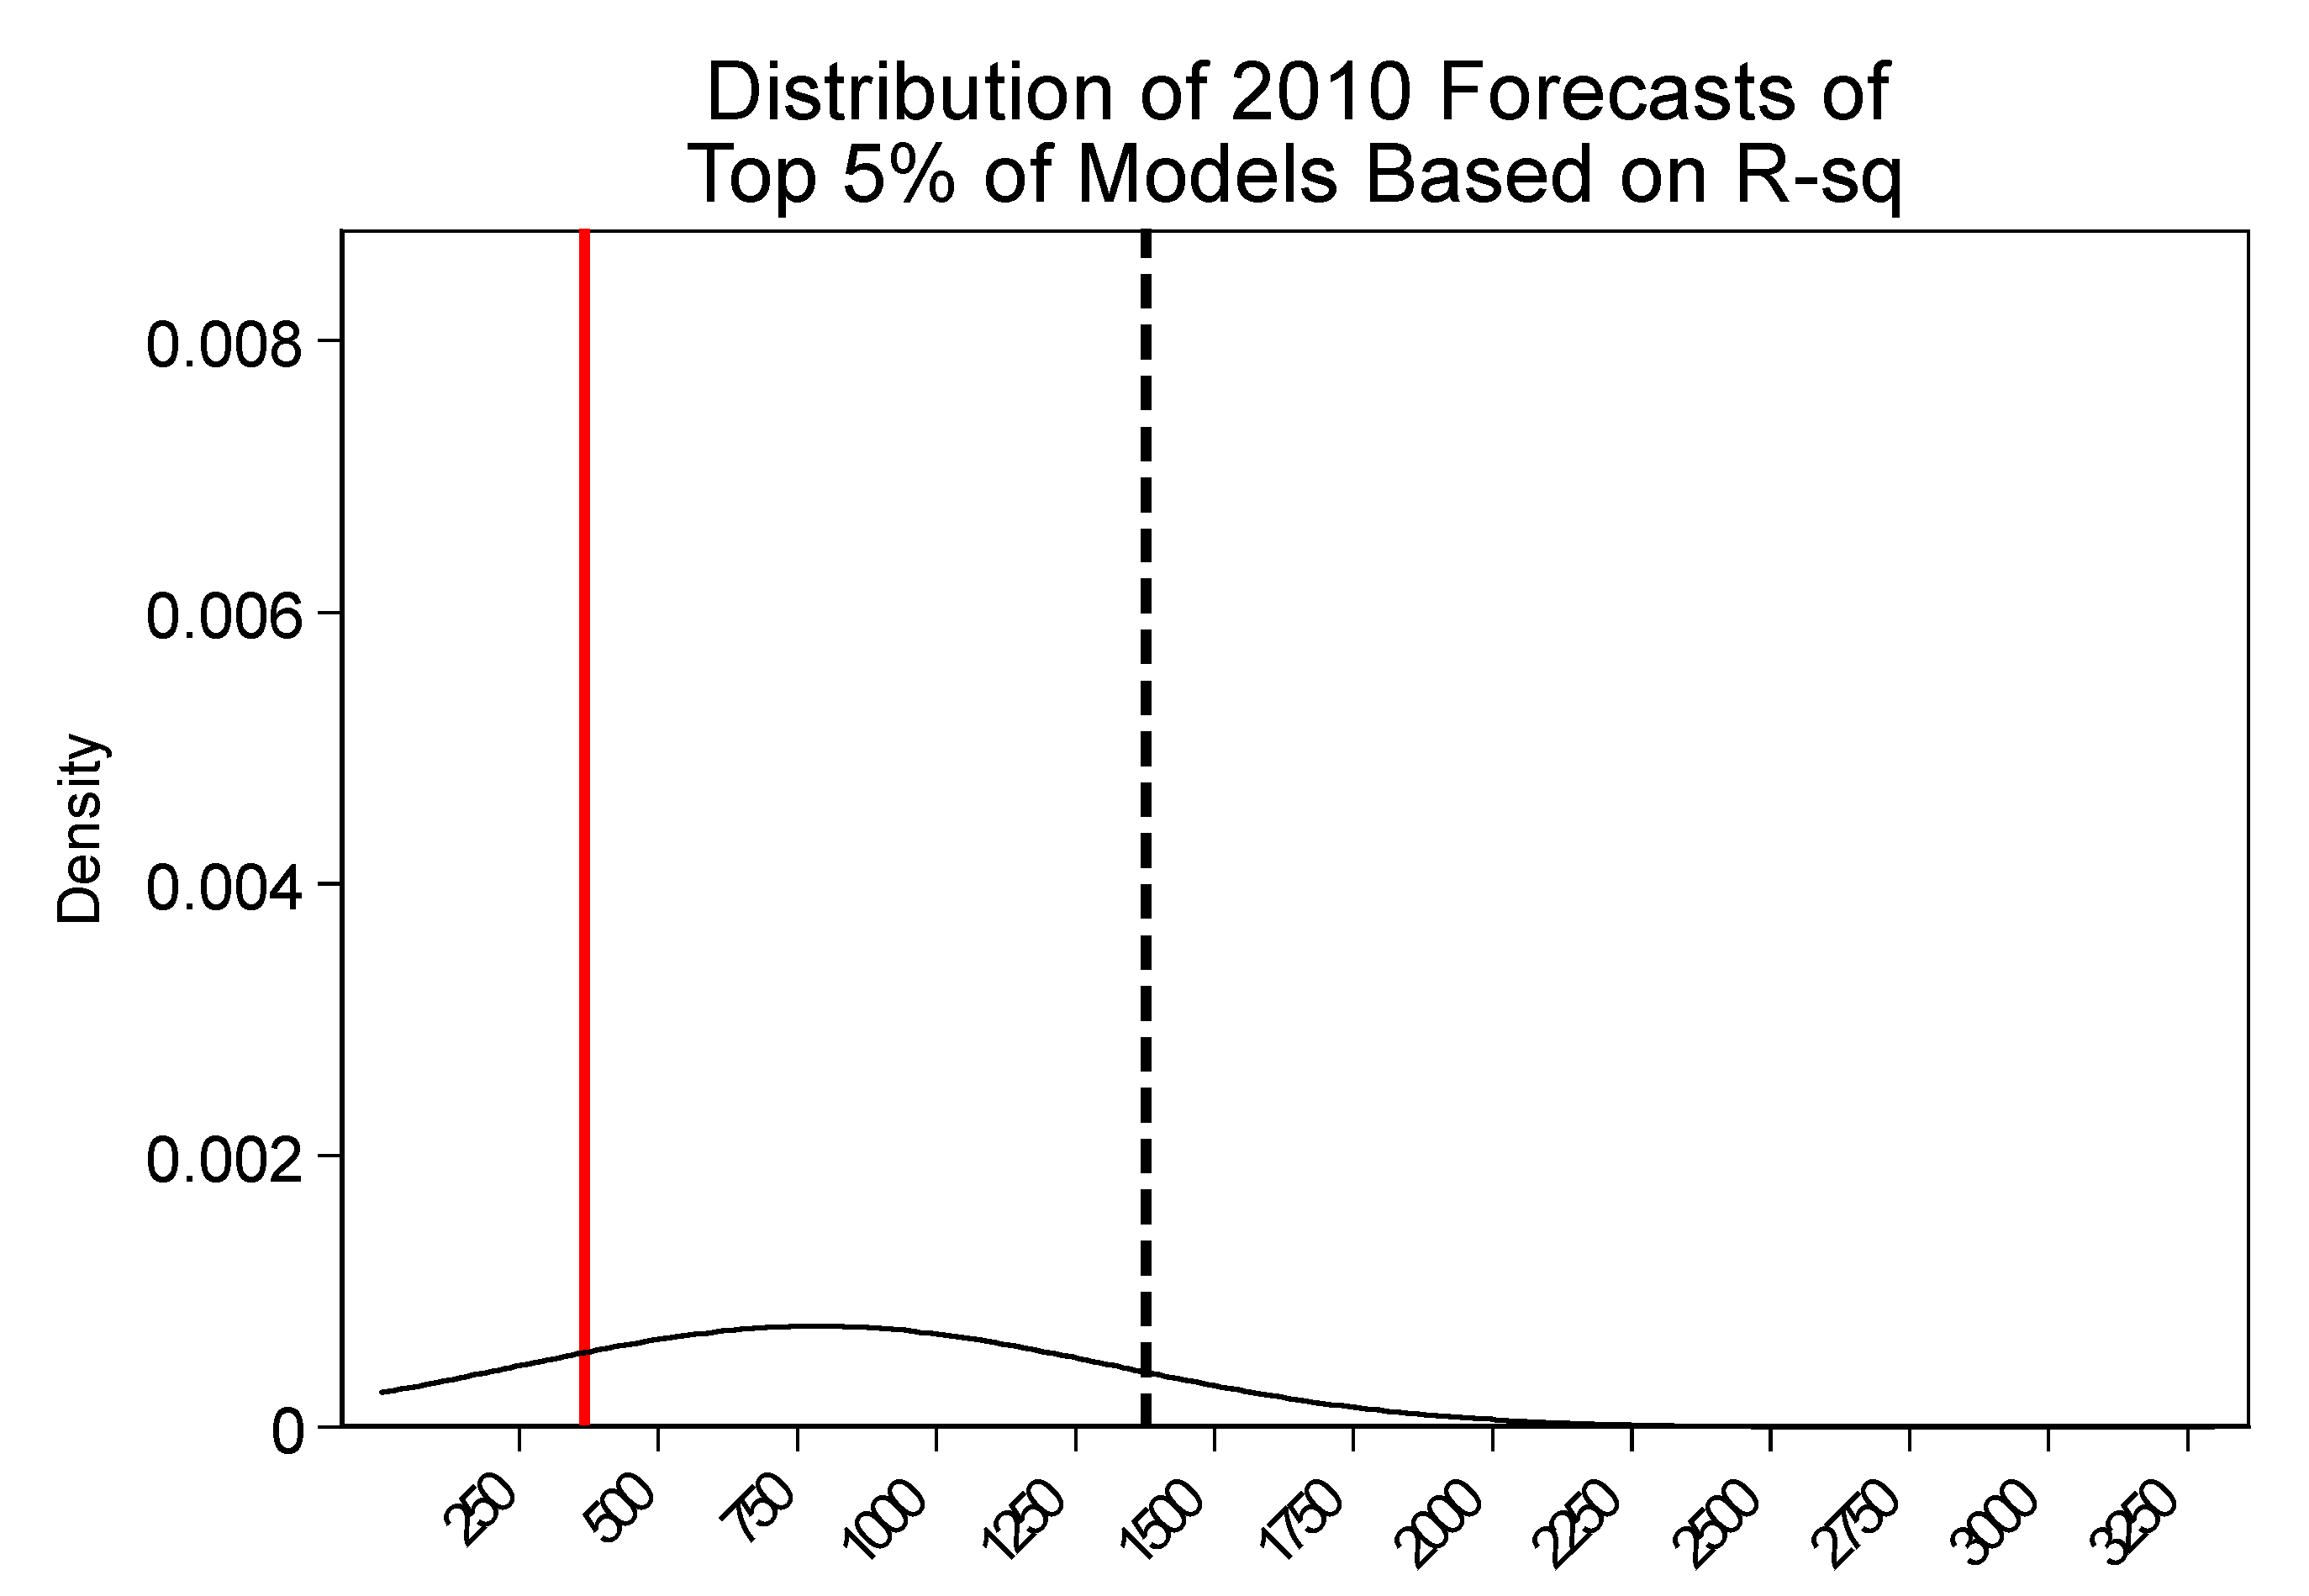
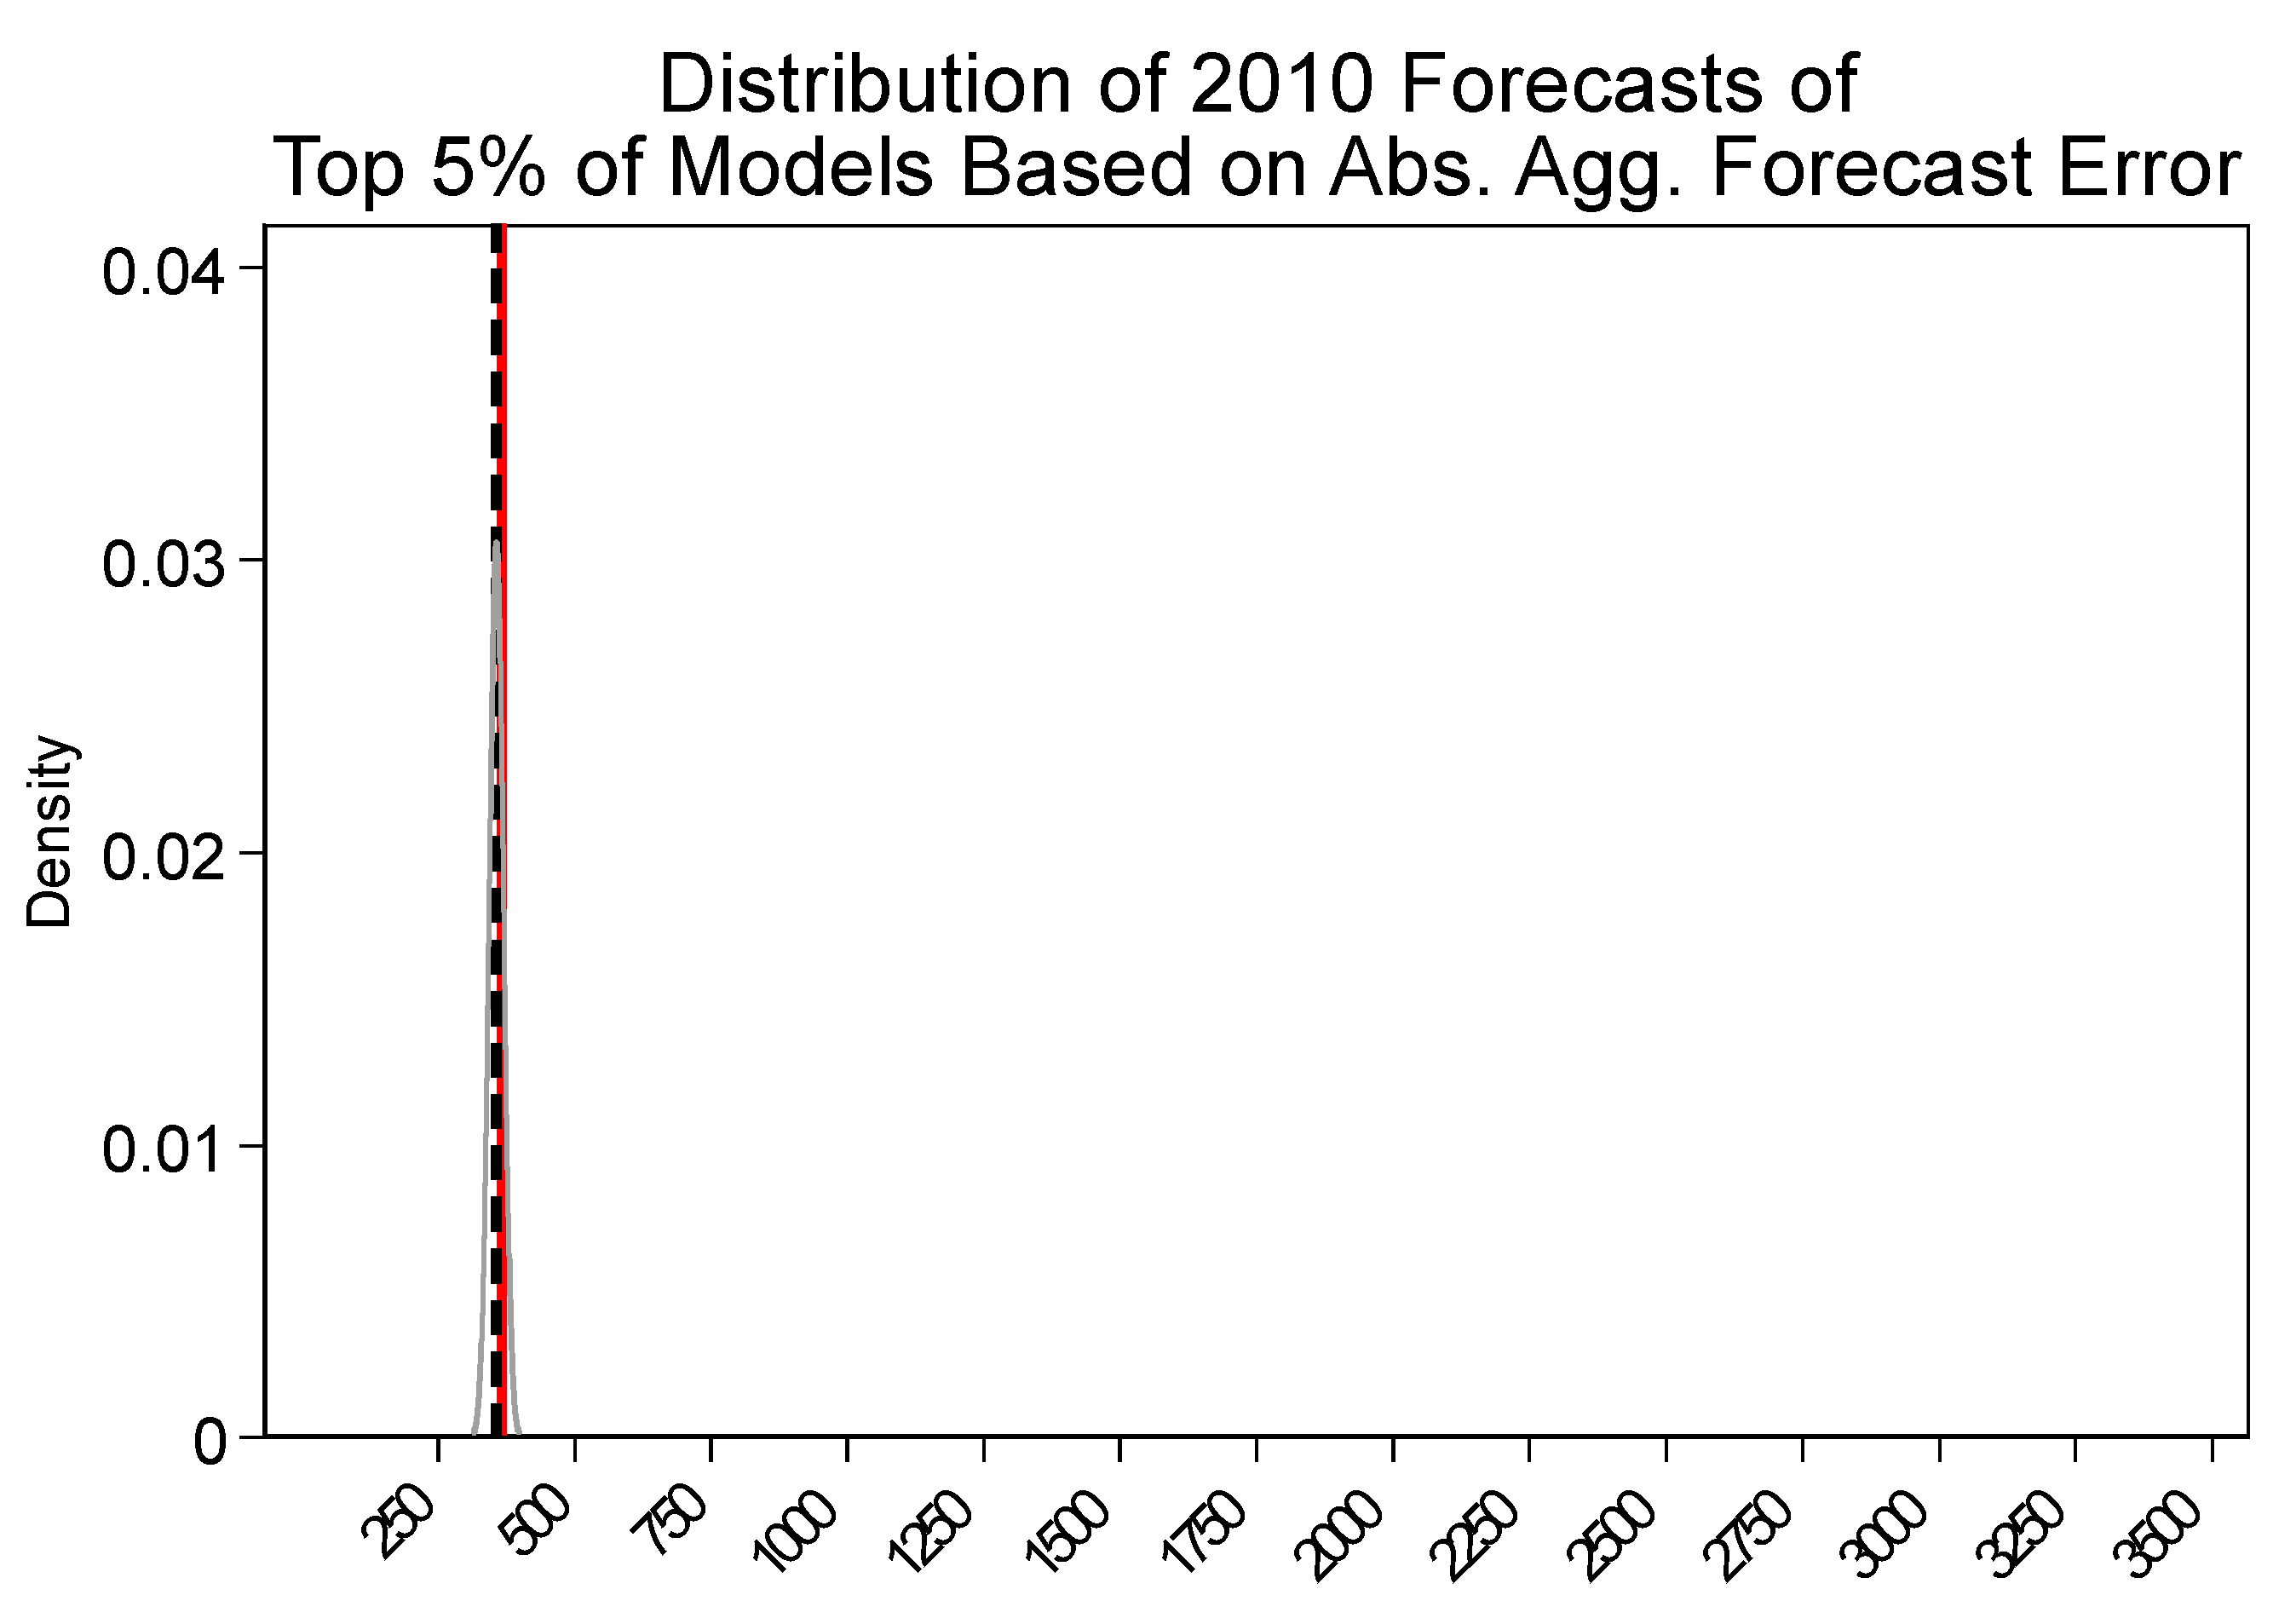
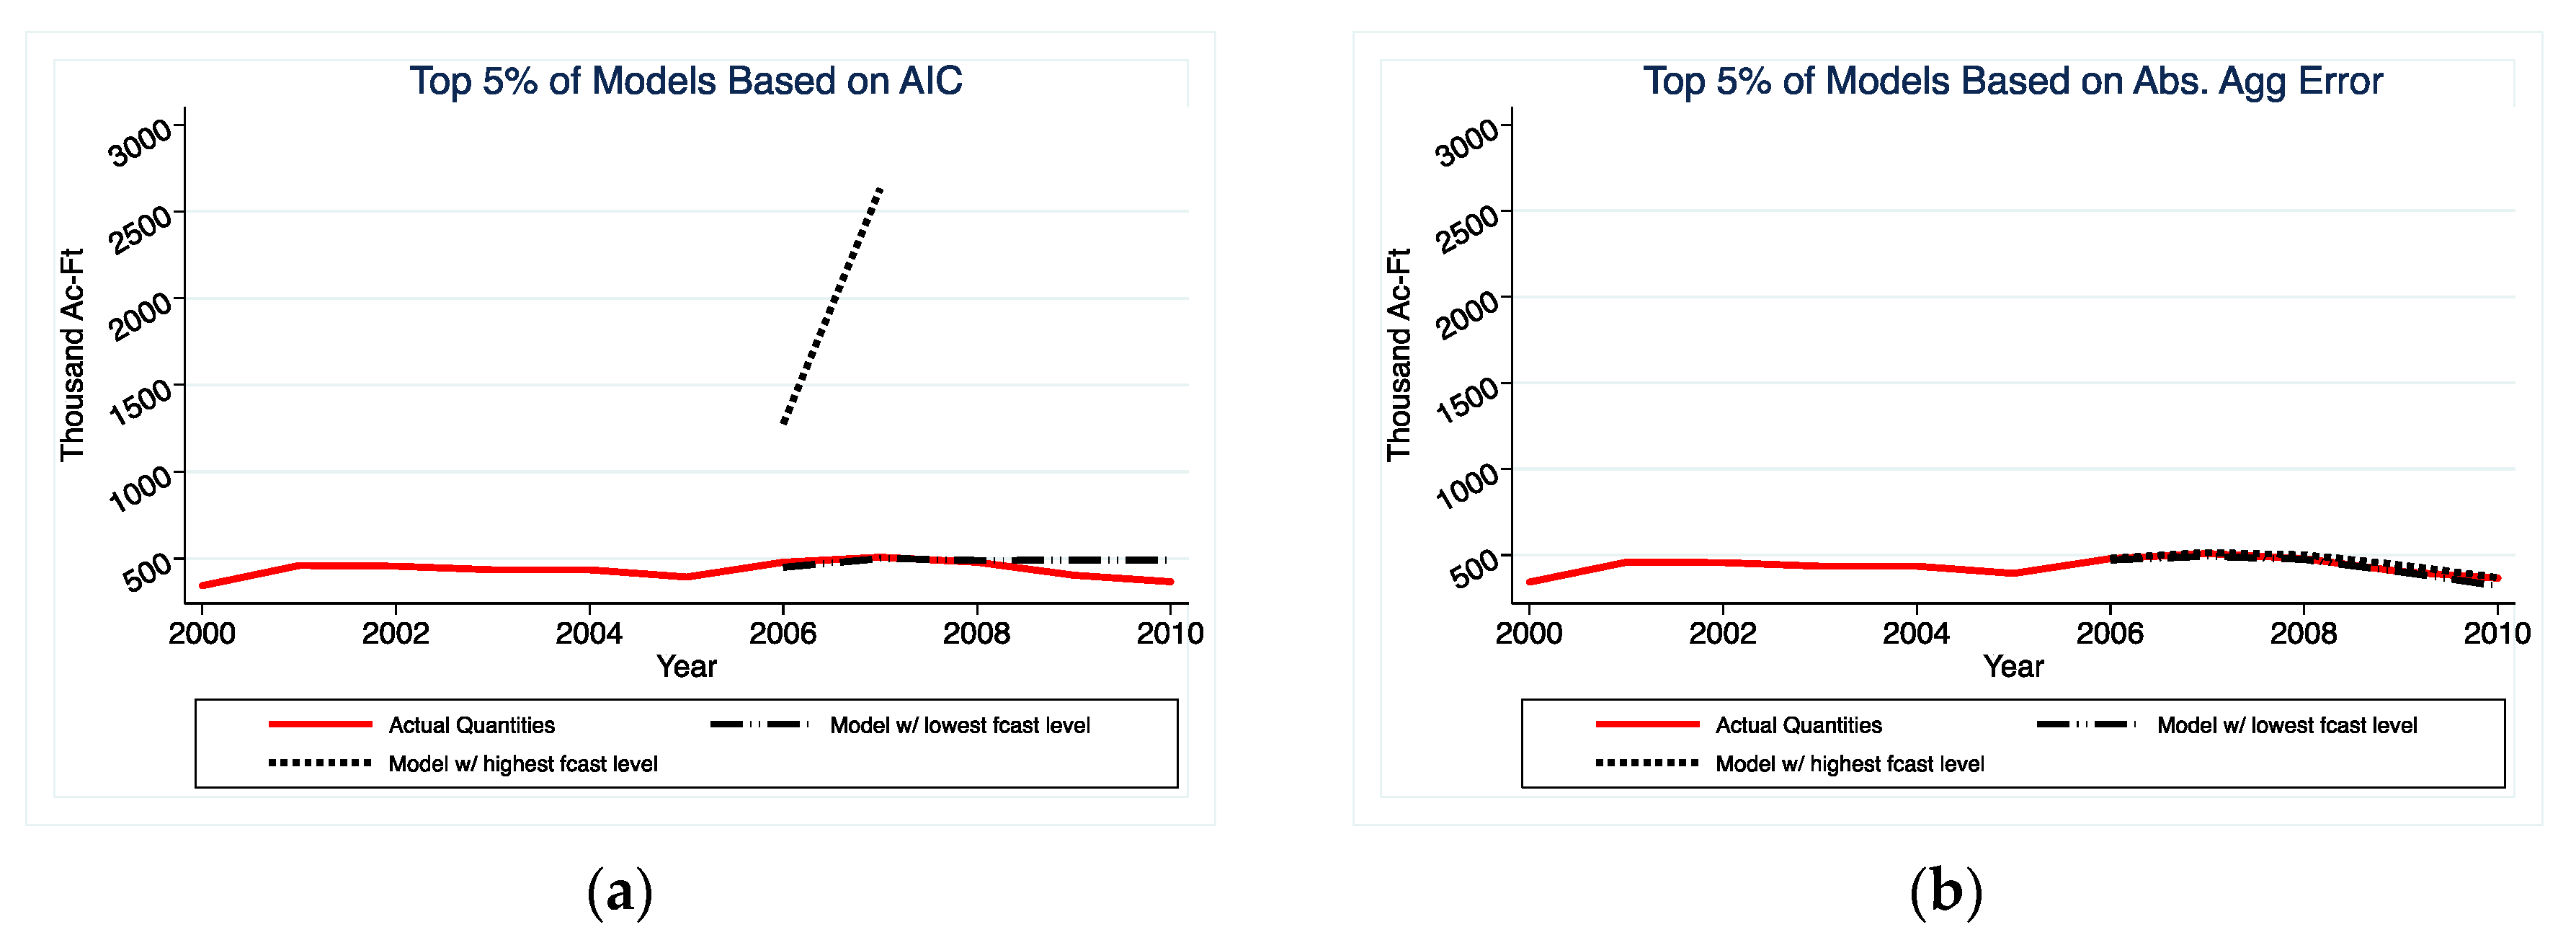
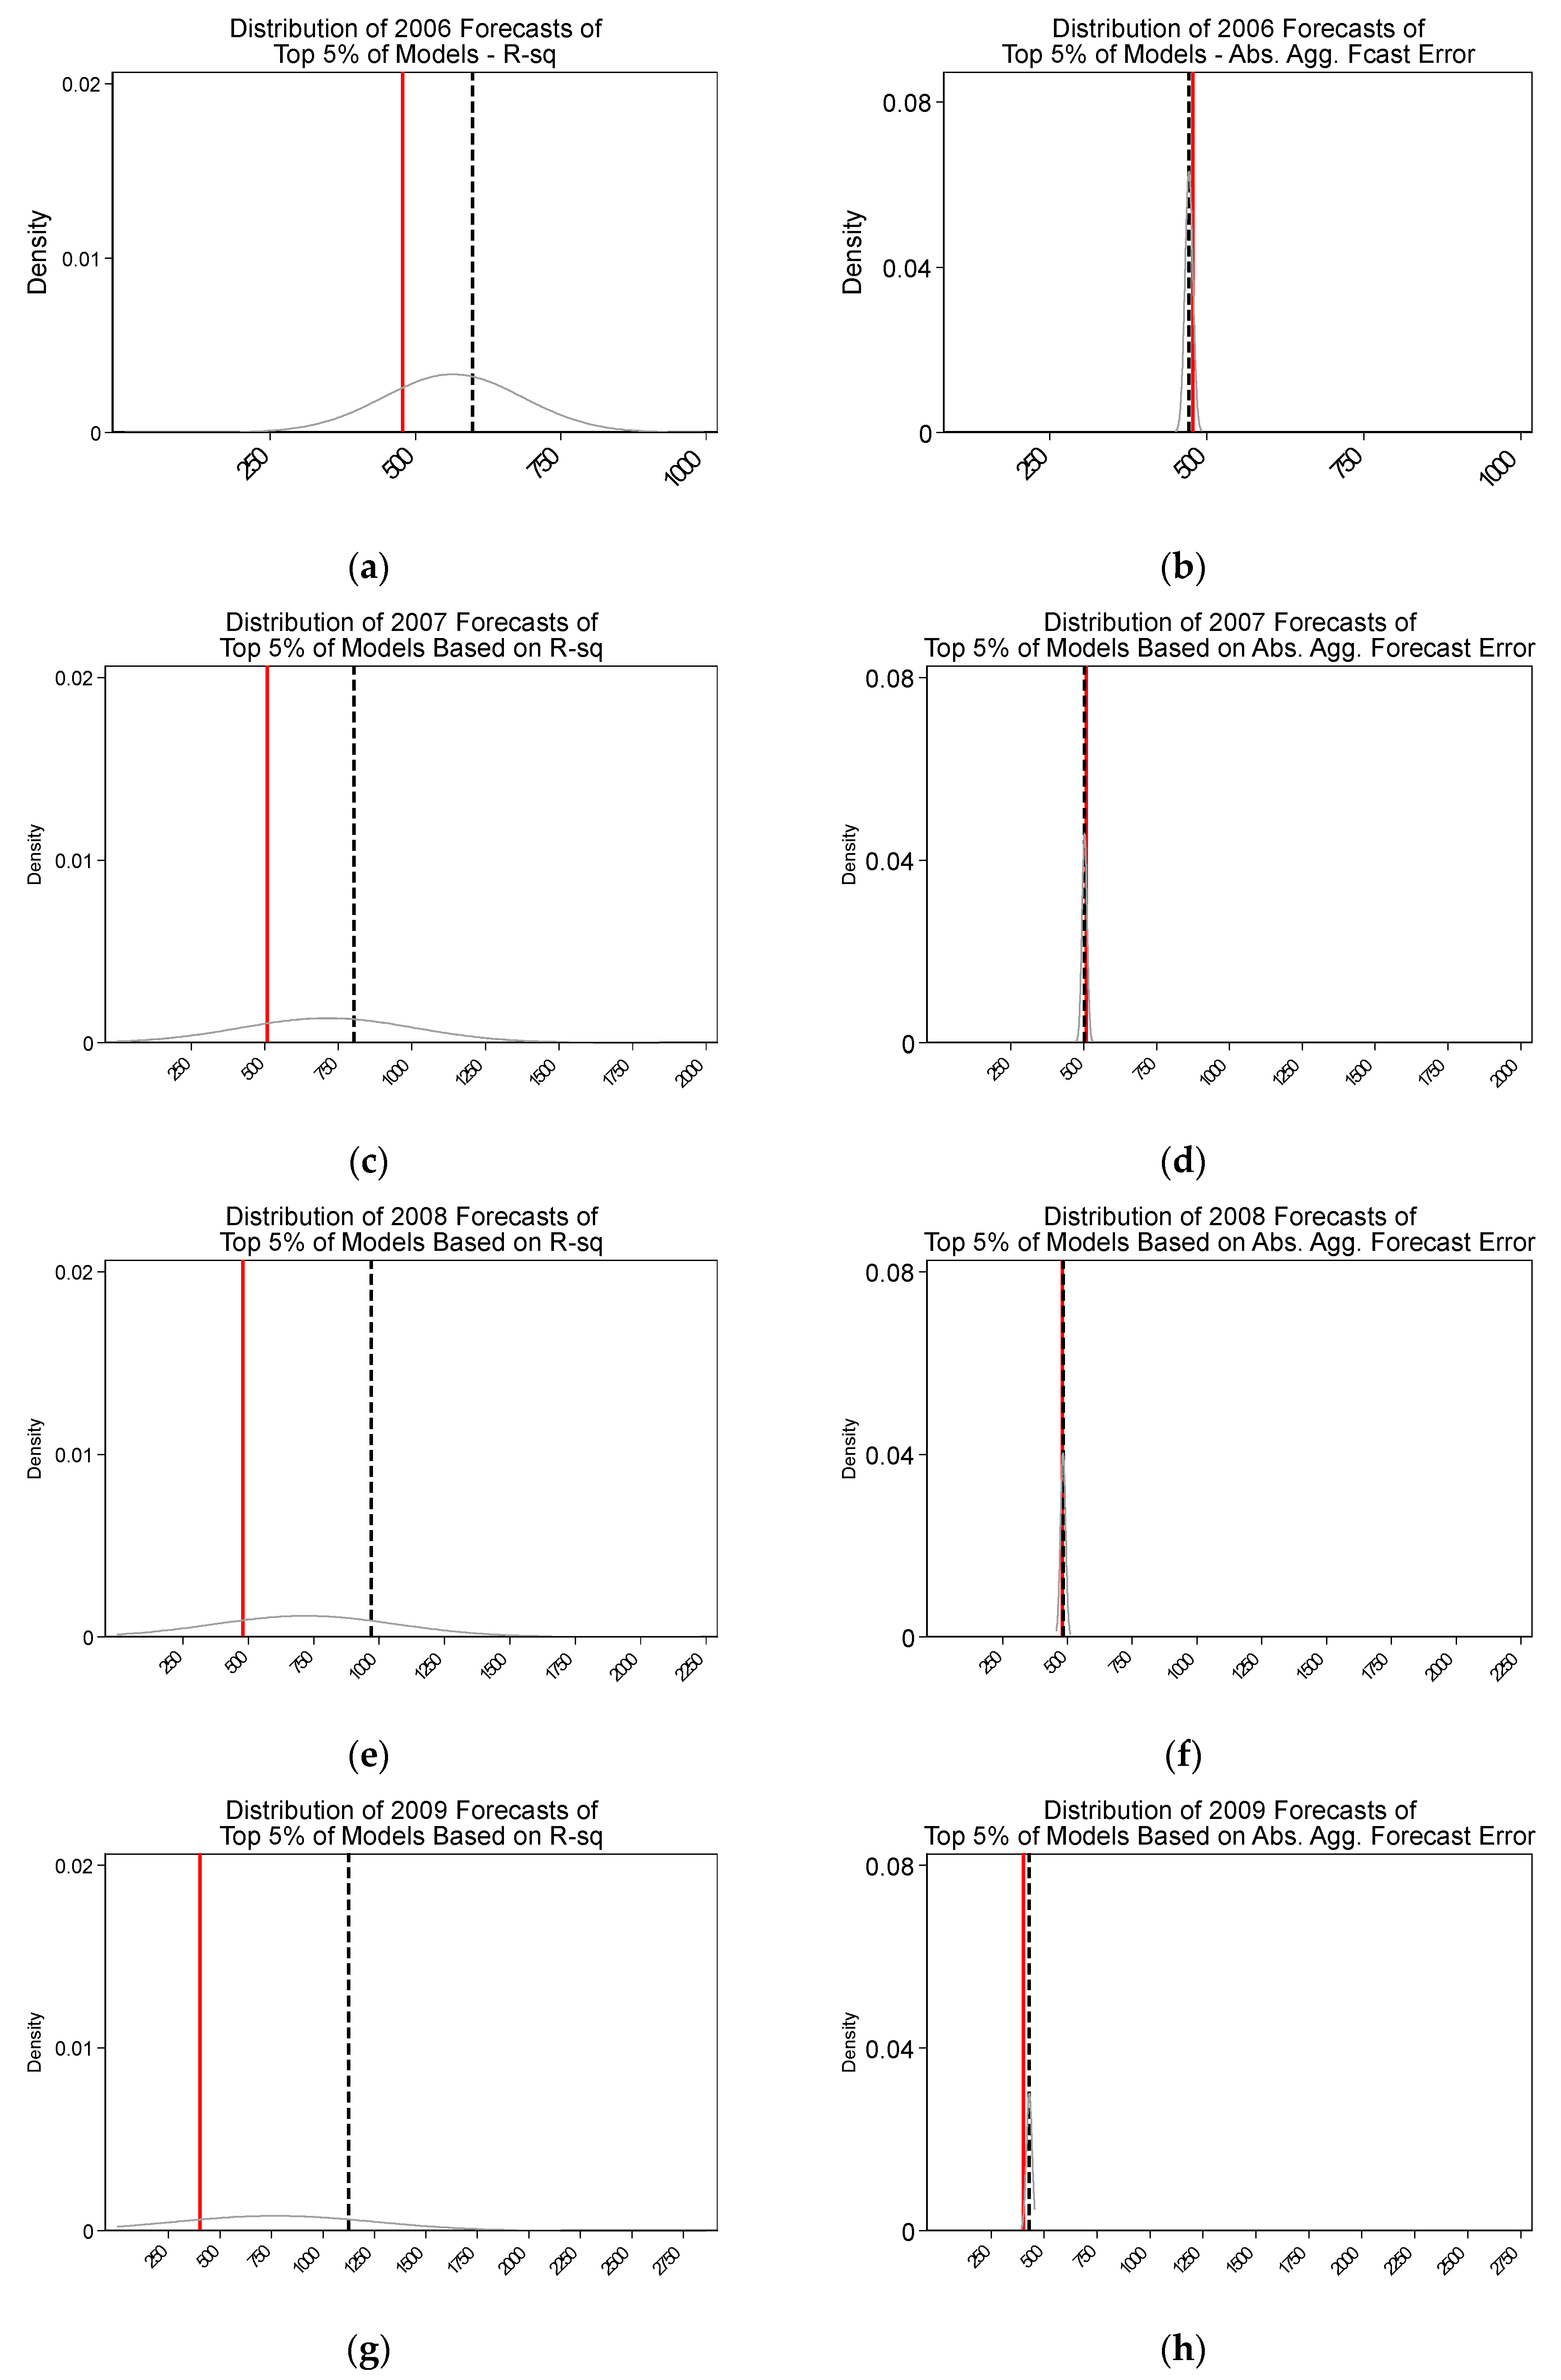
The results indicate that selecting models solely based on in-sample fit will yield poorly performing models when forecasting CII water use out-of-sample. Specifically, we demonstrate that the predictions that are generated by the highest R-squared models are highly dispersed around the actual value, relative to those that are generated by the models with the lowest absolute error. While it is known that models selected on in-sample fit can perform poorly out-of-sample, this paper brings the magnitude of the problem in the CII water forecast context to the attention of water planners. Equally important, the analysis contrasts variation in forecasts generated by prediction models that were selected based on different criteria. This highlights that decision-makers should consider a range of forecasts generated by a suite of the “best”-performing models.
These findings suggest that water planners, the forecasts of whom are often used to guide water policy, can avoid large errors by taking out-of-sample prediction performance into account when selecting models to forecast CII water use, which is a relatively small adjustment to their procedures.
The path followed in this paper is similar to the one used in Auffhammer and Steinhauser [60] for forecasting CO2 emissions. They use 41 years of state-level data to test about 27,000 models and compare the out-of-sample forecasting performances of benchmark models from the related literature and the ones that they find to be best under the aggregate error criterion. They find that benchmark models, which are calibrated against in-sample performance criterion, are likely to overestimate CO2 emissions, which might be consequential in climate policy and international agreements.
In a similar spirit, this study compares the out-of-sample performances of the models that would be selected under various in- and out-of-sample criteria given the available dataset. Our findings highlight that the model selection criteria determine CII water use forecast performance.
The rest of the paper proceeds as follows: the geographical scope of the study, summary of the data, econometric model, and the details of performance criteria are provided in Section 2. Section 3 presents and discusses the results, and Section 4 concludes.

2. Data and Methods

2.1. Geographical Scope

The geographical scope of this study is defined by the boundaries of the MWDSC, the largest water utility in the U.S. serving more than 18 million people [14,62]. For a geographical reference, see the map of the region published by the Southern California Association of Governments [63]. The dataset used here is a subset of a larger dataset collected for a study about forecasting single-family residential (SFR) sector water use [11]. Data collection effort, therefore, was focused on the retailers that reported more than 3000 single-family residential accounts as it is estimated that these retailers account for about 99% of this sector. One hundred fifty-three retailers were contacted within the realm of the study. CII data were obtained from 75 retailers and has 709 observations from 25 of the 26 member agencies that are under MWDSC. The only unrepresented member agency is San Marino, which has one of the lowest CII sectors of all member agencies. Table A1 in the Appendix A lists the agencies and the associated retailers. The water retailers in the study are located in Los Angeles, Orange, Riverside, San Bernardino, San Diego, and Ventura counties.

2.2. Data Sources

The rate schedules were received directly from retailers, while the water use figures are mostly based on monthly data in the Public Water System Statistics (PWSS) augmented with data received from retailers and aggregated to the calendar year [64]. For the price measure, we use the median tier of the rate schedule.
Location-specific data on average precipitation were obtained through the use of the geographical information and mapping software system, ArcGIS. Spatially referenced boundaries of state and private water districts were obtained from the Cal-Atlas geospatial clearinghouse [65]. These boundaries allowed visualization of each water district polygon using ArcGIS. The points at the centroid of each water system polygon were then geo-referenced. Based on the resulting set of points, the local precipitation data were extracted from rasters provided by the PRISM Climate Group from Oregon State University [66].
In those cases where the retailer level district boundaries were not available, zip codes were used as a geographical proxy. Retailers were assigned to representative zip codes on a case-by-case basis. The centroid of each zip code polygon was geo-referenced, and based on the resulting set of points, local precipitation data were extracted. The precipitation variable in our dataset is in millimeters of rainfall per year.
Data on temperature were obtained in the same manner as the precipitation data described above. Rasters for the temperature data (in degrees Celsius) were obtained from the PRISM Climate Group. The year-round maximum and minimum temperatures are used to calculate retailer-specific cooling degree.
Total employees within a retailer are computed based on two data sources. Historical annual employment is provided by the metropolitan water district at the member-agency-level from 1990 to 2010. To calculate employment at the retailer level, we used the Census Zip Code Business Statistics (ZCBS), which reports historical employment estimates at the zip code level from 2004 to 2010. The ZCBS only provides employment numbers based on the majority of sectors (largely excludes non-service oriented government positions) so total employment is not complete. Therefore, we only use the ZCBS to calculate the share of employment within a member agency due to a particular retailer. We calculate the relevant share using a crosswalk between zip codes and retailer level boundaries, and zip codes and member-agency-level boundaries. Finally, to compute a historically based retailer level total employment measure, we multiplied the share of employment within a member agency by the total employment in the member agency obtained from MWD (based on Employment Development Department data). For years prior to 2004, when ZCBS is unavailable, we assume the retailer level average employment shares from 2004 to 2006. That is, for each retailer, we assume their share of total employment within a member agency is constant between 1994 and 2003.
A variable measuring GDP is also included in the universe of considered regression models. Unlike the residential sector, water demand in the CII sector is derived, together with other inputs, as a part of the production process. In other words, water demand in CII is indirectly caused by the consumption for the goods and services that these sectors offer to consumers. Therefore, CII water use should not only depend on its own price but also on total consumption in the economy, which ultimately depends on income. A national, rather than regional, measure of GDP is utilized as CII water customers may provide goods and services to locations outside of California.
The real GDP data are obtained from the publicly available international macroeconomic data series provided at the USDA website [67]. All monetary figures in this study are standardized to 2000 dollars in order to account for the effect of inflation.
Table 1 and Table 2 present the summary statistics of the variables in the training and the forecasting subsamples, respectively. The training sample is composed of data from the years 2000–2005, while the forecast sample is composed of data from the years 2006–2010.

2.3. Econometric Model

In the regression models, we follow the general form provided in Equation (1):
q t a r = β   p r i c e t a r + μ   m a n . e m p . t a r + σ   s e r v . e m p t a r + τ   t m a x t a r + π   p r e c i p t a r + γ   c d d t a r + α a + η t + ϵ t a r        
where
  • q t a r is the annual water use in the CII sector in year t served by the retailer r that is under agency a ;
  •   p r i c e t a r is the median tier price charged;
  • m a n . e m p . t a r is the number of manufacturing employees;
  • s e r v . e m p t a r is the total number of service employees;
  • t m a x t a r is the average maximum temperature;
  • p r e c i p t a r is the average annual precipitation;
  • c d d t a r is the cooling degree days;
  • α a is the agency fixed effects;
  • η t represent the time fixed effects. (Year indicators or GDP. Note that the year indicators and GDP cannot be used at the same time due to perfect collinearity);
  • ϵ t a r is the stochastic error term.
The model universe was created using different permutations of dependent and independent variables (and their actual and logged values). There are three main avenues through which new models are added to the model space. A first avenue is the inclusion versus exclusion of the main variables: price, number of employees in the manufacturing and service sectors in the retailers’ boundaries, maximum temperature, degree days, precipitation, and GDP, as well as lagged dependent variables (up to two lags). The second variation is due to the inclusion of variables accounting for heterogeneity with respect to time and the institutions corresponding to different locations and levels of governance. These include agency indicators, time trends (up to cubic time trend), and year indicators. Finally, further variations are generated using logged vs. level dependent variables as well as total quantity versus per employee quantity as the dependent variable. Table 3 summarizes the details. As a result of these permutations, we ended up with 352,116 models.
For the regression analyses, the data set is divided into two subsets: training and forecast samples. Data from the years 2000–2005 are used to train (estimate) the models and the years 2006–2010 are used as the forecast sample to measure out-of-sample performances.
For each model, effectiveness in terms of both common in-sample performance measures including R-squared, adjusted R-squared, AIC score, BIC score, and three out of sample performance measures (explained below) are calculated. Afterwards the models are sorted based on their performances with respect to each of these criteria, and then the out-sample performances of the top 1% in each category are compared.

2.4. Model Performance Criteria

Many different performance criteria can be chosen based on the forecasting and planning goals such as aggregating absolute or squared errors across different geographical or institutional boundaries. In this paper, we studied three different out-of-sample performance measures: mean squared forecasting error at both retailer and agency levels and the overall absolute aggregate error. Table 4 provides the formulations for in- and out-of-sample performance criteria, and in the following paragraphs we explain them in detail.
The first out-of-sample criterion is the retail level mean squared forecast error (MSFE) (the third one from the bottom of Table 4). Here, q t a r is the annual CII water use in year t for retailer r that belongs to agency a in the forecasting sample. q t a r ¯ is the forecasted quantity for the same data point. R t a r is the number of retailers for which data was available in agency a in year t , A t is the number of agencies in the sample in year t , and N is the total number of data points in the forecast sample (N = 310).
The second criterion is the counterpart of the first one at the agency level. We first aggregate the differences between the actual numbers and forecasted numbers at the agency level for each forecast year. Afterward, we take the mean of the squared forecast error over agencies (M = 101).
The final out-of-sample performance criterion is the absolute aggregate forecasting error. We calculate it as follows. All the quantities (both forecasted and actual) are aggregated over the forecast sample for each year, the aggregate of the forecasts is subtracted from the aggregate of the actual numbers, and then the average of the absolute value of the aggregate error is taken over the years.
One important detail to note is the comparability of the performance criteria across the models with different dependent variables (i.e., level vs. logged). It is important to establish this comparability of the goodness-of-fit measures across the models to be able to make meaningful statements about their relative performances. In order to do that, the performance measures for the models with a logged dependent variable had to be transformed in the following manner [68]. After the models with a logged dependent variable are estimated, the fitted values are exponentiated. Then, the actual quantities are regressed (without a constant term) on these exponentiated values. The fitted values are obtained from this second regression. These fitted values are used to calculate the prediction errors. The square of the correlation coefficient between the actual and the fitted within the training sample is comparable to R-squared.
A separate forecast adjustment is made due to the existence of models both with total quantity and quantity per employee as dependent variables. AIC and BIC scores are calculated using the sum of squared errors (see Table 4 for the formula). Therefore, unlike R-squared and adjusted R-squared, the magnitude will depend on the scale of the variables for AIC and BIC scores. For this reason, the scale of the error needs to be adjusted for a fair comparison of different models. All AIC and BIC scores are calculated using the deviance from the actual total quantity and the total quantity implied by the model. In other words, if the model is logged, the AIC and BIC scores are calculated from the squared errors obtained from the fitted values described above. If the dependent variable is per employee water quantity, the predicted total quantity is obtained by multiplying the fitted value by the total employee number. Finally, the models are ranked based on each one of the criteria in our list.

3. Results and Discussion

Table 5 summarizes and compares the performances of the top 5% of models in each criterion for the models where the dependent variable is the total quantity. Every column (except for the first column) refers to a subset of all of the models in our model universe. Each row gives the mean and standard deviation of the performance measures of the top 5% models based on the criteria listed in that row within the subset given by the column. For example, the numbers in the first row of the second column present the mean and the standard deviation of the “Retail Level MSFE" of the models that rank in the top 5% in terms of the “Retail Level MSFE" category among only models that use a level dependent variable (as opposed to logged dependent variable). This categorization allows us to observe the association between the inclusion of certain variables in a model and forecast performance. We see that in models for which the dependent variable is total quantity, log models (3rd versus 1st and 2nd columns) displayed better out-of-sample performance on average, while in-sample performances were similar for models across all categories.
One notable result is that models without any lagged variables did much worse than models with lagged variables overall (comparing columns 1 versus 5) for almost all criteria. This is not surprising given the serially correlated nature of water use. Additionally, we see that, though it may reduce the noise, adding agency fixed effects did not improve forecasting performance.
Since the data are annual, we were forced to choose between year indicators variables and the (lagged) per capita GDP since including more than one of these covariates at the same time would result in perfect collinearity. In the models that use year fixed effects, the projection needs special consideration as we do not have a clear way to forecast the year fixed effects for future years. For simplicity, we treated all years in the forecast sample as the end year of the training sample.
Comparing the final two columns, we see that the performance of the models with year fixed effects and per capita GDP are fairly comparable for both in- and out-of-sample criteria. Therefore, in addition to providing a proxy for the size of the economy in forecasting indirect demand for water, measures of GPD appear to largely capture year fixed effects. The results are very similar for models in which the dependent variable is quantity per employee (Table A2 in the Appendix B).
Table 6 compares the absolute aggregate error of the models ranked within the top 5% of our criteria. For example, the number on the second row and the first column of Table 6 is the mean of the aggregate forecast error (in thousand acre-feet) of the models that are in the top 5% based on the “Retailer Level MSFE" criteria. We see that the models that score high based on in-sample-fit criteria did poorly in aggregate compared to the models that are selected based on the out-of-sample criteria. While the qualitative result was expected given the selection criteria, the key point is the magnitude of the difference between the mean of the aggregate error under different categories. The models that score high in the out-of-sample performance criteria yielded much lower absolute errors (12.72 for the absolute aggregate error (in 1000-Acre feet)), and a narrower distribution (standard deviation of 1.66) whereas the models that had the highest R-squared value, for example, did poorly, on average (mean absolute aggregate error: 535.90 (in 1000-Acre feet)), and the dispersion of their performance was almost two orders of magnitude larger (standard deviation of 918.88). The results are similar for the comparison of the models for which the dependent variable was quantity per employee (Table A3 in the Appendix B).
Figure 1 and Figure 2 help visualize the point made in Table 6. In these graphs, the black dashed lines represent the highest and lowest forecasts generated by the models that ranked among the top 5% based on R-squared and retailer level MSFE, respectively, while the red solid line shows the actual values. Graphs for the rest of the criteria carry the same message and are provided in Figure A1 of the Appendix B.
Notice the wide gap between the lowest and the highest CII water use forecasts in the graph displaying forecasts from the models with the top R-squared scores. We see in these figures that the CII water use forecasts generated by the models that are selected based on in-sample criteria are much more widely dispersed compared to those that are selected based on out-of-sample forecast criteria, signifying a large uncertainty in the forecast accuracy due to model choice.
To provide further visual insight, Figure 3 and Figure 4 show the actual aggregate (represented with the red spike) and the histogram of the aggregate of forecasts for the models that are within the top 5% of the R-squared and absolute aggregate error criteria for year 2010. The graphs for the other years have very similar characteristics. They are provided in Figure A2 in the Appendix B.
Here, in addition to the dispersion, we also see that the average of the forecasts generated by models chosen with in-sample goodness-of-fit are also further away from the true value.

4. Conclusions

The historic mismatch between the location of water supply and demand has shaped water infrastructure investment decisions and planning activities in the United States, one of the largest water users in the world—both in terms of total and per capita water use. These decisions are often guided by water forecast studies from utilities that rely on conventional econometric methods and/or black box software packages when generating CII water use forecasts. Splitting a dataset into a training set and validation set is a prominent idea in the field of statistical learning. This improves the accuracy of out-of-sample forecasts because forecasting, by definition, requires using the model to estimate new data points. In this paper, we demonstrate that using the out-of-sample forecast performance criteria can significantly improve CII water use forecast accuracy and reduce forecast uncertainty due to modeling. Our study context is water use within the commercial, institutional, and industrial sector under MWDSC—the largest water utility in the U.S. CII water use is an understudied component of overall water demand due to lack of data and its complex nature. Yet its share of publicly provided water-use is expected to grow as water governing institutions evolve. As CII water use becomes a more significant portion of public water deliveries, then so too will its place in water-saving conservation policies designed to adjust to changes in water supply conditions, for example, in response to climate change.
Using over 352,000 models and rich panel data, CII water use forecasting performances of models selected based on in-sample and out-of-sample goodness-of-fit criteria were compared. Note that finding the best forecast method or studying the relative importance of different variables in explaining CII water use are not the objectives of this paper as these topics are very well documented both in academic papers and studies conducted by utilities from all around the world. While machine learning methods and large data sets offer advantages in forecasting, they might not yet be accessible to some utilities, especially smaller suburban utilities. The goal of our study is to demonstrate that a relatively straightforward adjustment to the model selection criteria significantly improves the forecast performance even when no advanced machine learning methods besides regression models are used and the dataset is composed of a few hundred observations.
Policymakers and planners who rely on water consumption forecasts for the CII sector, therefore, should pay attention to the out-of-sample performance of the models that are being utilized in their analyses. If a water governing body chooses to use econometric methods using the data available from the local region, they should avoid selecting models of CII water use based on in-sample-fit as this may result in suboptimal results in terms of the accuracy of forecasts for the CII sector. Further, decision-makers would be wise to consider uncertainty in forecasts, which may be considerable, especially in the CII sector. Instead of considering forecasts from one single model, we advise considering projections from a suite of models based on their out-of-sample forecasting accuracy in training data sets.

Author Contributions

D.U. wrote the STATA code for the formal analysis and visualization, conducted the literature review, and wrote and revised the manuscript; S.B. formulated the methodology, curated the data, and edited the manuscript. All authors have read and agreed to the published version of the manuscript.

Funding

This research received no external funding.

Acknowledgments

We thank seminar participants in the Department of Agricultural Economics at the University of Kentucky for thoughtful comments and feedback.

Conflicts of Interest

The authors declare no conflict of interest.

Appendix A

Table A1. Agencies and retailers included in the study.
Member AgencyRetailerYears Data are Available
AnaheimAnaheim2001–2003, 2007–2008
Beverly HillsBeverly Hills2000–2003
BurbankBurbank1994, 1996–1998, 2000–2008
Calleguas MWDWestlake1996–1998, 2000–2010
Camarillo1998, 2000–2010
Camrosa WD1994–1995, 2000–2008
Oxnard2003–2008
Simi Valley2003–2004, 2007–2010
Thousand Oaks2000–2002,2004–2007
Central Basin MWDEast Los Angeles1996–1998, 2000–2010
Cerritos1996–1998, 2000–2004, 2006–2010
Downey2006–2010
Lakewood2000–2003, 2005–2010
Orchards Dale WD1996–1997, 2000–2010
Paramount2005–2010
Pico Riviera2001, 2008–2010
Pico WD1994, 1996–1998, 2000–2003, 2005–2007
Whittier/ La Mirada1995–1998, 2000–2010
Vernon2002–2010
ComptonCompton2008–2010
Eastern MWDEastern MWD2004–2010
Rancho California WD1997–1998, 2000–2010
Foothill MWDLa Canada ID2002–2010
FullertonFullerton1994, 1996–1997, 2000–2010
GlendaleGlendale1998, 2004-2010
IEUAOntario1997-1998, 2000–2003, 2005–2009
Upland2000, 2002–2008, 2010
Las Virgenes MWDLas Virgenes MWD1994, 1996–1997, 2000–2010
Long BeachLong Beach1996–1998, 2000–2010
Los AngelesLos Angeles1996–1998, 2000–2010
MWDOCBuena Park1994, 1996–1997, 2000–2010
Fountain Valley1994, 1996–1997, 2000–2010
Garden Grove2006–2010
Huntington Beach2001–2010
Mesa Consolidated WD1996, 1998, 2000, 2006, 2008–2010
Westminster1996–1997, 2000–2010
Yorba Linda WD1994, 1996–1998, 2000–2010
PasadenaPasadena2007–2010
San Diego CWACarlsbad MWD2001–2003, 2005–2010
City San Diego2001–2004, 2006–2010
Escondido1998, 2000–2010
Fallbrook PUD2000–2001, 2003–2010
Helix2001–2010
Oceanside2000–2010
Olivenhain MWD2000–2010
Otay, Padre Dam MWD Eastern1998, 2000–2003, 2007
Poway2000–2001, 2005–2010
Rainbow MWD2003–2005, 2008, 2010
Ramona MWD1998, 2000, 2001–2010
Rincon del Diablo MWD2001–2004, 2006–2010
San Dieguito WD2004–2005
Santa Fe ID1997, 2000–2010
Sweetwater Authority2000–2010
Vallecitos WD2000–2010
Valley Center MWD2001–2007
Vista ID2000–2010
San FernandoSan Fernando2000–2001, 2003–2005, 2007, 2009–2010
Santa AnaSanta Ana2001–2003, 2009–2010
Santa MonicaSanta Monica1994, 1996–1997, 2000–2010
Three Valleys MWDCovina2001–2009
Pomona2000–2010
Walnut Valley WD2000–2010
TorranceTorrance1994–1995, 2000–2001
Upper San Gabriel Valley MWDAlhambra2000–2007, 2009–2010
Arcadia2008–2010
Azusa2001–2010
Monrovia2006–2010
West Basin MWDHermosa Redango1996–1998, 2000–2003, 2005–2010
El Segundo2004–2005, 2007–2008
Western MWDCorona, Elsinore Valley MWD1996–1998, 2001–2003, 2005–2006, 2008–2010
Jurupa CSD2000–2003, 2007–2010
Norco2001–2010
Western MWD2000–2010

Appendix B

Table A2. Summary Statistics of the Results from Top 5% of the Models—Dependent Variable: Quantity Per Employee.
All ModelsLevels OnlyLogs OnlyNo Agency FENo LagsYear FELagged GDP
Retail Level MSFE1.8701.9561.8361.85614.871.7812.230
(0.228)(0.265)(0.210)(0.218)(2.998)(0.158)(0.311)
Agency Level MFSE6.7817.4416.5186.79553.766.4179.195
(1.006)(1.039)(0.953)(0.986)(9.968)(0.621)(1.095)
Absolute Aggregate Error13.6314.5013.2813.4425.3712.8021.11
(2.340)(2.636)(2.197)(2.140)(7.135)(1.640)(3.512)
R Squared0.8820.8800.8820.8760.4580.8800.882
(0.00154)(0.000300)(0.00141)(0.000824)(0.00922)(0.000672)(0.00157)
Adj. R Squared0.8720.8710.8730.8730.4040.8710.872
(0.00123)(0.000237)(0.00116)(0.00116)(0.00948)(0.000332)(0.00128)
AIC16.1516.0716.2616.2116.5916.0416.25
(0.0966)(0.0921)(0.113)(0.0550)(0.128)(0.0906)(0.0674)
BIC16.3616.2916.4816.3316.8016.2916.42
(0.0554)(0.0448)(0.0443)(0.0462)(0.105)(0.0481)(0.0555)
Table A3. Aggregate Forecast Error (in 1000 Acre-Feet) of the Top 5% of the Models—Dependent Variable: Quantity Per Employee.
MeanSDMin.Max.
Absolute Aggregate Error13.632.3403.4417.07
Retailer Level Average MSFE15.984.5226.2435.92
Agency Level MFSE15.043.4756.2427.65
R Squared204.18466.2916.743535.92
Adjusted R Squared69.16265.5476.743496.91
AIC563.10892.6939.183539.80
BIC546.46883.9179.243539.80
Figure A1. Distribution of the forecasts around the actual value. Panel (a) depicts the distribution of the models selected based on the AIC criterion while (b) has that of the ones selected based on lowest absolute aggregate error.
Sustainability 12 03995 g0a1
Figure A2. Distribution of the forecasts around the actual value. Dependent variable is total quantity. Criteria: R-Squared on the left panels vs. Aggregate Absolute Error Criteria on the right panels. (a) Distribution of 2006 forecasts of top R-squared models; (b) distribution of 2006 forecasts of top absolute aggregate error models; (c) distribution of 2007 forecasts of top R-squared models; (d) distribution of 2007 forecasts of top absolute aggregate error models; (e) distribution of 2008 forecasts of top R-squared models; (f) distribution of 2008 forecasts of top absolute aggregate error models; (g) distribution of 2009 forecasts of top R-squared models; (h) distribution of 2009 forecasts of top absolute aggregate error models.
Sustainability 12 03995 g0a2

References

  1. Food and Agriculture Organization of the United Nations (FAO). AQUASTAT: Water Use, Water Withdrawal by Sector, Total Water Withdrawal per Capita; Aquastat, Food and Agriculture Organization of the United Nations: Rome, Italy, 2014. [Google Scholar]
  2. Kearney, M.S.; Harris, B.H.; Hershbein, B.; Jácome, E.; Nantz, G. In Times of Drought: Nine Economic Facts about Water in the United States. The Hamilton Project; Brookings Institution: Washington, DC, USA, 2014. [Google Scholar]
  3. Glennon, R.J. Unquenchable: America’s Water Crisis and What to Do About It; Island Press: Washington, DC, USA, 2010. [Google Scholar]
  4. Zetland, D. The End of Abundance: Economic Solutions to Water Scarcity; Aguanomics Press: Amsterdam, The Netherlands, 2011. [Google Scholar]
  5. Cook, E.R.; Seager, R.; Heim, R.R., Jr.; Vose, R.S.; Herweijer, C.; Woodhouse, C. Megadroughts in North America: Placing IPCC projections of hydroclimatic change in a long-term palaeoclimate context. J. Quat. Sci. 2010, 25, 48–61. [Google Scholar] [CrossRef] [Green Version]
  6. Diffenbaugh, N.S.; Swain, D.L.; Touma, D. Anthropogenic warming has increased drought risk in California. Proc. Natl. Acad. Sci. USA 2015, 112, 3931–3936. [Google Scholar] [CrossRef] [PubMed] [Green Version]
  7. State Population Totals and Components of Change: 2010–2019. United States Census Bureau. Available online: https://www.census.gov/data/tables/time-series/demo/popest/2010s-state-total.html#par_textimage_1574439295 (accessed on 13 March 2020).
  8. Regional Data: GDP and Personal Income. US Bureau of Economic Analysis. Available online: https://apps.bea.gov/itable/iTable.cfm?ReqID=70&step=1#reqid=70&step=1&isuri=1 (accessed on 12 March 2020).
  9. California Water Code: Urban Water Management Planning. In 10610. Available online: https://www.ci.ceres.ca.us/DocumentCenter/View/149/2015-Urban-Water-Management-Plan-Appendices-PDF (accessed on 3 May 2020).
  10. USGS. Water-Use Terminology. Available online: https://www.usgs.gov/mission-areas/water-resources/science/water-use-terminology?qt-science_center_objects=0#qt-science_center_objects (accessed on 14 March 2020).
  11. Buck, S.; Auffhammer, M.; Soldati, H.; Sunding, D. Forecasting Residential Water Consumption in California: Rethinking Model Selection. Water Resour. Res. 2020, 56, e2018WR023965. [Google Scholar] [CrossRef]
  12. McCracken, M.W.; West, K. Inference about predictive ability. In A Companion to Economic Forecasting; Clements, M.P., Hendry, D.F., Eds.; Wiley: Hoboken, NJ, USA, 2002; pp. 299–321. [Google Scholar]
  13. James, G.; Witten, D.; Hastie, T.; Tibshirani, R. An Introduction to Statistical Learning; Springer: Berlin, Germany, 2013; Volume 112. [Google Scholar]
  14. Zetland, D. Conflict and cooperation within an organization: A case study of the Metropolitan Water District of Southern California. SSRN Electron. J. 2008. [Google Scholar] [CrossRef]
  15. Schneider, M.L.; Whitlatch, E.E. User-specific water demand elasticities. J. Water Resour. Plan. Manag. 1991, 117, 52–73. [Google Scholar] [CrossRef]
  16. Maupin, M.A.; Kenny, J.F.; Susan, H.; Lovelace, J.K.; Barber, N.L.; Linsey, K.S. Estimated use of water in the United States in 2010. Available online: https://pubs.usgs.gov/circ/1405/ (accessed on 3 May 2020).
  17. USGS. Industrial Water Use; United States Geological Service: Preston, WV, USA, 2015.
  18. Bell, M.; Pavitt, K. Technological accumulation and industrial growth: Contrasts between developed and developing countries. Technol. Glob. Econ. Perform. 1997, 83137, 83–137. [Google Scholar]
  19. De Bono, A.; Del Pietro, D.; Giuliani, G.; Harayama, A.; Le Sourd, G.; Rizzolio, D. Freshwater in Europe–Facts, Figures and Maps; United Nations Environment Programme: Geneva, Switzerland, 2004. [Google Scholar]
  20. Dai, A. Increasing drought under global warming in observations and models. Nat. Clim. Chang. 2013, 3, 52–58. [Google Scholar] [CrossRef]
  21. Griffin, R.C. Water Resource Economics: The Analysis of Scarcity, Policies, and Projects; MIT press: Cambridge, MA, USA, 2016. [Google Scholar]
  22. Gleick, P.H.; Srinivasan, V.; Henges-Jeck, C.; Wolff, G. Urban water conservation: A case study of commercial and industrial water use in California. In The World’s Water 2004-2005: The Biennial Report on Freshwater Resources; Island Press: Washington, DA, USA, 2004; p. 131. [Google Scholar]
  23. Seneviratne, M. A Practical Approach to Water Conservation for Commercial and Industrial Facilities; Elsevier: Armsterdam, The Netherlands, 2007. [Google Scholar]
  24. VanSchenkhof, M. An Investigation of Water Usage in Casual Dining Restaurants in Kansas; Kansas State University: Manhattan, KS, USA, 2011. [Google Scholar]
  25. Espey, M.; Espey, J.; Shaw, W.D. Price elasticity of residential demand for water: A meta-analysis. Water Resour. Res. 1997, 33, 1369–1374. [Google Scholar] [CrossRef]
  26. Brent, D.A.; Cook, J.H.; Olsen, S. Social comparisons, household water use, and participation in utility conservation programs: Evidence from three randomized trials. J. Assoc. Environ. Resour. Econ. 2015, 2, 597–627. [Google Scholar] [CrossRef]
  27. Brent, D.A.; Ward, M.B. Price perceptions in water demand. J. Environ. Econ. Manag. 2019, 98, 102266. [Google Scholar] [CrossRef]
  28. Jaime Torres, M.M.; Carlsson, F. Social Norms and Information Diffusion in Water-saving Programs: Evidence from a Randomized Field Experiment in Colombia. Available online: https://www.semanticscholar.org/paper/Social-Norms-and-Information-Diffusion-in-from-a-in-Torres-Carlsson/9c9fb67b281dc82aeab6faec55be2a9a0fc8baab (accessed on 3 May 2020).
  29. Ferraro, P.J.; Miranda, J.J.; Price, M.K. The persistence of treatment effects with norm-based policy instruments: Evidence from a randomized environmental policy experiment. Am. Econ. Rev. 2011, 101, 318–322. [Google Scholar] [CrossRef] [Green Version]
  30. Romano, G.; Salvati, N.; Guerrini, A. Estimating the determinants of residential water demand in Italy. Water 2014, 6, 2929–2945. [Google Scholar] [CrossRef]
  31. Morote, Á.-F.; Hernández, M.; Rico, A.-M. Causes of domestic water consumption trends in the city of Alicante: Exploring the links between the housing bubble, the types of housing and the socio-economic factors. Water 2016, 8, 374. [Google Scholar] [CrossRef] [Green Version]
  32. Angrist, J.D.; Pischke, J.-S. Mostly Harmless Econometrics: An Empiricist’s Companion; Princeton University Press: Princeton, NJ, USA, 2008. [Google Scholar]
  33. Derooy, J. Price responsiveness for industrial demand for water. Water Resour. Res. 1974, 10, 403–406. [Google Scholar] [CrossRef]
  34. Ziegler, J.A.; Bell, S.E. Estimating demand for intake water by self-supplied firms. Water Resour. Res. 1984, 20, 4–8. [Google Scholar] [CrossRef]
  35. Renzetti, S. Estimating the structure of industrial water demands: The case of Canadian manufacturing. Land Econ. 1992, 68, 396–404. [Google Scholar] [CrossRef] [Green Version]
  36. Babin, F.G.; Willis, C.E.; Allen, P.G. Estimation of substitution possibilities between water and other production inputs. Am. J. Agric. Econ. 1982, 64, 148–151. [Google Scholar] [CrossRef]
  37. Reynaud, A. An econometric estimation of industrial water demand in France. Environ. Resour. Econ. 2003, 25, 213–232. [Google Scholar] [CrossRef]
  38. Calloway, J.A.; Schwartz, A.K.; Thompson, R.G. Industrial economic model of water use and waste treatment for ammonia. Water Resour. Res. 1974, 10, 650–658. [Google Scholar] [CrossRef]
  39. Alhumoud, J.M. Freshwater consumption in Kuwait: Analysis and forecasting. J. Water Supply Res. Technol. AQUA 2008, 57, 279–288. [Google Scholar] [CrossRef]
  40. Brekke, L.; Larsen, M.D.; Ausburn, M.; Takaichi, L. Suburban water demand modeling using stepwise regression. J. Am. Water Work. Assoc. 2002, 94, 65–75. [Google Scholar] [CrossRef]
  41. Feng, S.; Li, L.X.; Duan, Z.G.; Zhang, J.L. Assessing the impacts of South-to-North Water Transfer Project with decision support systems. Decis. Support Syst. 2007, 42, 1989–2003. [Google Scholar] [CrossRef]
  42. Froukh, M.L. Decision-support system for domestic water demand forecasting and management. Water Resour. Manag. 2001, 15, 363–382. [Google Scholar] [CrossRef]
  43. Levin, E.R.; Maddaus, W.O.; Sandkulla, N.M.; Pohl, H. Forecasting wholesale demand and conservation savings. J. Am. Water Work. Assoc. 2006, 98, 102–111. [Google Scholar] [CrossRef]
  44. Khatri, K.; Vairavamoorthy, K. Water demand forecasting for the city of the future against the uncertainties and the global change pressures: Case of Birmingham. In Proceedings of the World Environmental and Water Resources Congress 2009, Kansas, MI, USA, 17–21 May 2009; pp. 1–15. [Google Scholar]
  45. Williamson, P.; Mitchell, G.; McDonald, A. Domestic water demand forecasting: A static microsimulation approach. Water Environ. J. 2002, 16, 243–248. [Google Scholar] [CrossRef]
  46. Donkor, E.A.; Mazzuchi, T.A.; Soyer, R.; Alan Roberson, J. Urban water demand forecasting: Review of methods and models. J. Water Resour. Plan. Manag. 2014, 140, 146–159. [Google Scholar] [CrossRef]
  47. Sebri, M. Forecasting urban water demand: A meta-regression analysis. J. Environ. Manag. 2016, 183, 777–785. [Google Scholar] [CrossRef]
  48. Oyebode, O.; Ighravwe, D.E. Urban Water Demand Forecasting: A Comparative Evaluation of Conventional and Soft Computing Techniques. Resources 2019, 8, 156. [Google Scholar] [CrossRef] [Green Version]
  49. House-Peters, L.A.; Chang, H. Urban water demand modeling: Review of concepts, methods, and organizing principles. Water Resour. Res. 2011, 47. [Google Scholar] [CrossRef] [Green Version]
  50. Kofinas, D.; Mellios, N.; Papageorgiou, E.; Laspidou, C. Urban water demand forecasting for the island of Skiathos. Procedia Eng. 2014, 89, 1023–1030. [Google Scholar] [CrossRef] [Green Version]
  51. Herrera, M.; Torgo, L.; Izquierdo, J.; Pérez-García, R. Predictive models for forecasting hourly urban water demand. J. Hydrol. 2010, 387, 141–150. [Google Scholar] [CrossRef]
  52. Adamowski, J.; Karapataki, C. Comparison of multivariate regression and artificial neural networks for peak urban water-demand forecasting: Evaluation of different ANN learning algorithms. J. Hydrol. Eng. 2010, 15, 729–743. [Google Scholar] [CrossRef] [Green Version]
  53. Ghiassi, M.; Zimbra, D.K.; Saidane, H. Urban water demand forecasting with a dynamic artificial neural network model. J. Water Resour. Plan. Manag. 2008, 134, 138–146. [Google Scholar] [CrossRef]
  54. Boland, J.J. Assessing urban water use and the role of water conservation measures under climate uncertainty. Clim. Chang. 1997, 37, 157–176. [Google Scholar] [CrossRef]
  55. Dziegielewski, B.; Boland, J.J. Forecasting urban water-use: The IWR-MAIN model. Water Resour. Bull. 1989, 25, 101–109. [Google Scholar] [CrossRef]
  56. Morales, M.A.; Heaney, J.P.; Friedman, K.R.; Martin, J.M. Estimating commercial, industrial, and institutional water use on the basis of heated building area. J. Am. Water Work. Assoc. 2011, 103, 84–96. [Google Scholar] [CrossRef]
  57. Dziegielewski, B.; Kiefer, J.; Optiz, E.; Davis, W.; Rogers, C. Description of Analytical Tools: IWR-main Water Demand Management Suite; California Department of Water Resources, Sacramento: Sacramento, CA, USA, 2019.
  58. Cook, Z.; Urban, S.; Maupin, M.; Pratt, R.; Church, J. Domestic, Commercial, Municipal and Industrial Water Demand Assessment and Forecast in Ada and Canyon Counties, Idaho; Idaho Department of Water Resources: Boise, ID, USA, 2001.
  59. Studenmund, A.H. Using Econometrics: A Practical Guide; Pearson: London, UK, 2000. [Google Scholar]
  60. Auffhammer, M.; Steinhauser, R. Forecasting the path of US CO2 emissions using state-level information. Rev. Econ. Stat. 2012, 94, 172–185. [Google Scholar] [CrossRef] [Green Version]
  61. What Are Heating and Cooling Degree Days. National Weather Service. Available online: https://www.weather.gov/key/climate_heat_cool (accessed on 12 January 2020).
  62. MWDSC. 2015 Urban Water Management Plan; Metropolitan Water District: Los Angeles, CA, USA, 2016. Available online: http://mwdh2o.com/pdf_about_your_water/2.4.2_regional_urban_water_management_plan.pdf (accessed on 3 May 2020).
  63. Shobhit, K. Metropolitan Water District Service Areas. Available online: http://sustain.scag.ca.gov/Lists/Maps/DispForm.aspx?ID=6 (accessed on 3 May 2020).
  64. Public Water Systems Statistics Surveys. California Department of Water Resources. Available online: https://water.ca.gov/Programs/Water-Use-And-Efficiency/Land-And-Water-Use/Public-Water-Systems-Statistics-Surveys (accessed on 13 January 2020).
  65. Cal-Atlas Geospatial Clearinghouse. California Geographic Information Association. Available online: https://cgia.org/cgia-collaboration/gis-data-sharing/cal-atlas-geospatial-clearinghouse/ (accessed on 3 May 2020).
  66. PRISM Climate Data. Oregon State University. Available online: http://www.prism.oregonstate.edu/ (accessed on 3 May 2020).
  67. International Macroeconomic Data Set. United States Department of Agriculture Economic Research Service. Available online: https://catalog.data.gov/dataset/international-macroeconomic-data-set (accessed on 3 May 2020).
  68. Wooldridge, J.M. Introductory Econometrics: A Modern Approach, 2nd ed.; South-Western College Pub.: Cincinnati, OH, USA, 2002. [Google Scholar]
Figure 1. Highest and lowest projections generated by top R-squared models versus the actual value. Dependent variable is total quantity.
Sustainability 12 03995 g001
Figure 2. Highest and lowest projections generated by best models based on retailer level mean squared forecast error (MSFE) versus the actual value. Dependent variable is total quantity.
Sustainability 12 03995 g002
Figure 3. Distribution of the 2010 forecasts generated by top (highest) R-squared models around the actual value (red solid line). The average of the forecasts are denoted by the black dotted line.
Sustainability 12 03995 g003
Figure 4. Distribution of the 2010 forecasts generated by top (lowest) absolute aggregate error models around the actual value (red solid line). The average of the forecasts is denoted by the black dotted line.
Sustainability 12 03995 g004
Table 1. Summary Statistics of the Training Sample. MWDSC Years: 2000–2005.
VariableMeanStd.Min.Max.
Water Quantity (1000 Acre-feet)7.7323.620.07182.24
Real GDP (in Year 2000 $Billion)16,992.49764.2716,102.6618,249.53
Price (in Year 2000 $)1.330.420.442.48
Manufacturing Employment9472.2727,108.5231.56225,540.53
Service Employment29,425.8993,287.3206.14682,037.75
Max Temp. (C)24.191.7319.928.85
Cooling Degree Days1.170.4113.27
Precipitation (mm Per Year)373.92157.34102.81900.13
Number of Observations326
Table 2. Summary Statistics of the Training Sample. MWDSC Years: 2006–2010.
VariableMeanStd.Min.Max.
Water Quantity (1000 Acre-feet)7.2122.30.05181.84
Real GDP (in Year 2000 $Billion)18,857.88214.4918,486.0719,069.42
Price (in Year 2000 $)1.470.510.473.73
Manufacturing Employment8078.821,815.7428.53171,248.09
Service Employment31,226.6794,688.02216.71719,254.69
Max Temp. (C)24.441.6820.4628.24
Cooling Degree Days1.440.6213.44
Precipitation (mm Per Year)339.76182.32102.15909.27
Number of Observations310
Table 3. Variables Used to Define the Model Universe.
Main Variables
Price
Number of employees in the manufacturing sector (both linear and squared form)
Number of employees in the service sector (both linear and squared form)
Average maximum temperature Cooling degree days Precipitation
GDP
Lagged dependent variable (up to two lags)
Temporal and Institutional Heterogeneity
Agency fixed effects
Time trend (up to cubic) and year fixed effects
Additional
Levels vs. logs of both dependent and independent variables
Total quantity vs. quantity per employee as the dependent variable
Number of employees in the service sector (both linear and squared form)
Table 4. Summary of the In-Sample and Out-of-sample Criteria Used for Model Selection.
In Sample Performance CriteriaFormulation
R-Squared 1 t = 2000 2005 a = 1 A t r = 1 R t a ϵ t a r 2 t = 2000 2005 a = 1 A t r = 1 R t a ( q t a r q ¯ t a r ) 2
Adjusted R-Squared 1 N 1 N k ( 1 R 2 )
AIC n ( t = 2000 2005 a = 1 A t r = 1 R t a ϵ t a r 2 N ) + 2 k N
BIC l n ( t = 2000 2005 a = 1 A t r = 1 R t a ϵ t a r 2 N ) + k N ln ( N )
In the formulas above, k refers to the number of explanatory variables, N is the number of observations, and ϵ t a r 2 is the squared forecast error.
Out-of-sample performance criteriaExplanationFormulation
Retailer level MSFESquared forecast errors are calculated at the retailer level and then averaged. 1 N t = 2006 2010 a = 1 A t r = 1 R t a ( q t a r q ¯ t a r ) 2
Agency level MSFEForecasts are first added up at the agency level; then forecast errors are squared and averaged. 1 M t = 2006 2010 a = 1 A t ( r = 1 R t a q t a r q ¯ t a r ) 2
Absolute Aggregate Forecast ErrorForecasts are added up at the overall aggregate level; then the absolute value of the aggregate forecast error is calculated. | t = 2006 2010 a = 1 A t r = 1 R t a q t a r q ¯ t a r |
Table 5. Averages and Standard Deviations (in parenthesis) Statistics of the Errors Calculated from Top 5% of the Models—Dependent Variable: Total Quantity.
All ModelsLevels OnlyLogs OnlyNo Agency FENo LagsYear FELagged GDP
Retail MSFE1.8583.8161.7701.83712.931.8192.111
(0.228)(0.624)(0.194)(0.211)(2.417)(0.158)(0.322)
Agency MFSE6.39628.126.0656.27349.746.1877.598
(0.844)(7.287)(0.705)(0.807)(10.99)(0.556)(1.118)
Abs. Agg. Error12.7240.5212.1613.2830.0612.5014.69
(1.659)(9.608)(1.541)(1.505)(9.154)(1.054)(2.478)
R Squared0.9870.9880.9820.9830.9870.9880.987
(0.000664)(0.000291)(0.00190)(0.000794)(0.000833)(0.00033)(0.00125)
Adj. R Squared0.9860.9870.9800.9830.9860.9860.985
(0.000727)(0.000301)(0.00181)(0.000768)(0.000915)(0.000348)(0.00130)
AIC15.9515.9116.4216.1015.9715.9315.99
(0.0458)(0.0224)(0.0464)(0.0436)(0.0627)(0.0267)(0.0834)
BIC16.2316.1816.5216.2016.2716.2516.25
(0.0410)(0.0340)(0.0385)(0.0370)(0.0203)(0.0424)(0.0447)
Table 6. Aggregate Forecast Error (in 1000 Acre-Feet) of the Top 5% of the Models Dependent Variable: Total Quantity.
MeanSDMin.Max.
Absolute Aggregate Error12.721.664.3214.84
Retailer Level Average MSFE15.253.107.3832.11
Agency Level MFSE14.852.727.3826.00
R Squared535.90918.8826.094598.55
Adjusted R Squared388.46678.7226.094472.80
AIC307.15479.8539.904032.11
BIC148.00121.5930.911253.92

