1. Introduction
The increasing market orientation of the Common Agricultural Policy (CAP) provides a role for value-added diversification strategies as an alternative for ensuring the economic viability of small farms [
1]. This is a pressing need, as illustrated by the rapid abandonment of dairy farmers in Asturias, one of the regions taken into account in this study, since the start of this century. Concretely, over the period 2000–2017, the number of dairy farmers in that particular region fell from 7809 to 1863 [
2]. The abandonment of agricultural activity can also have social costs, such as rural depopulation, and negative environmental impacts [
3,
4]. In this context, the efficiency of diversification initiatives could be an important condition to guarantee the sustainability (economic, social and environmental) of the farms that adopt them [
5].
Despite the importance and relevance of diversification initiatives, there is scarce empirical evidence about the factors that influence their success. The previous literature points out that successful diversification requires farmers to develop their strategic and marketing skills and adopt a more entrepreneurial attitude [
6,
7,
8]. At the same time, societal demands and specialized political initiatives require diversification strategies that better balance multiple sustainability goals [
9]. The question then arises as to how different marketing strategies and environmentally friendly initiatives for adding value to agri-food products influence the economic success of on-farm diversification.
Although there is a substantial body of literature on diversification in farms [
10,
11,
12], empirical studies analyzing its influence on farm economic performance are scarcer [
7,
13,
14,
15]. Most studies analyze the economic impact of diversification without distinguishing between different types of activities, instead considering diversification as a pool of income-earning opportunities simultaneous to core agricultural production. Nevertheless, the fostering of specialized policy initiatives requires empirical evidence on specific diversification strategies. Although studies on specific, individual types of diversification such as agri-tourism [
16] or production-related activities exist [
17], much less work has been done on value–added initiatives and this work has mainly been qualitative [
1,
18]. As far as we are aware, there are no quantitative studies analyzing the factors that influence the success of value-added initiatives in terms of their contribution to economic efficiency.
Value-added diversification includes the processing or packaging of an agricultural product. Besides increasing revenues, a value-added strategy reduces direct price competition and extends the shelf life of products [
10]. The general strategy consists of producing for niche markets and using diverse marketing channels to generate higher added value. Farmers produce a mix of high-quality products which are typically from the same production sector, but which are aimed at different and specific market segments [
1]. Direct marketing strategies (DMS) include, for example, direct retailing to end consumers, restaurants or grocery stores. The focus is on economies of scope and niche markets rather than economies of scale and commodity markets, with creativity playing a key role in the business models [
18].
This type of strategy is very relevant to sustainability for several reasons. First, the agricultural sector is a dynamic setting characterized by the continued survival of relatively small producers, and there is initial evidence that value-added strategies can be financially viable at a small-scale level [
19]. Second, value-added strategies normally meet social sustainability objectives such as maintenance of the rural population, landscape maintenance, native species maintenance, and the development of quality products integrated into sustainable food systems. In some cases, farmers become agents of rural change by connecting local economies with national and global ones [
17]. Specifically, adding value with quality schemes such as ‘protected designation of origin’ (PDO) or with organic labels guarantees adherence to sustainability criteria such as registered quality products, development and growth in the rural areas where they are produced, and the protection of local knowledge, skills and jobs, all of which are components of societal and environmental sustainability [
20]. In this sense, diversified organic farming can be seen as an element of sustainable farming strategies for the 21st century [
21]. Finally, the recent literature advocates the promotion of diversification initiatives as an alternative to scale enlargement and specialization strategies, which are more economically vulnerable when prices are volatile [
1,
18].
The fact that value-added strategies can contribute to social and environmental sustainability makes it appropriate to analyze the factors that influence their economic success, without which they cannot survive. Empirical evidence is necessary to support the statement that “diversification and economies of scope contribute significantly to more resilient pathways of development” [
1]. This is essential for the formulation of precise and non-generalist policies, which is especially relevant in contexts where there may be some conflict or tradeoff between the objective of economic profitability and other (non-economic) sustainability criteria [
14,
20,
22,
23,
24]. In this setting there are few studies that have analyzed the relationship between efficiency and sustainability [
15,
25] and this paper aims to contribute to this area of the literature.
More generally, the study of sustainability must be addressed from a holistic point of view, comprising not only societal and environmental dimensions, but also the managerial aspect [
26,
27]. Indeed, the previous literature shows that the managerial and marketing factors considered in recent work as an additional aspect of farm sustainability [
26] cannot be neglected if diversification initiatives are to be carried out successfully. In light of this, we study how key operational, marketing and sustainability factors influence the efficiency of the diversification initiative.
Concretely, we examine how product diversification, the use of diverse marketing channels, the use of quality schemes (protected designation of origin or PDO) or organic labels, the proportion of family labor and the characteristics of the manager (gender, age, education) influence efficiency. For this purpose, we use a unique database of new value-added ventures implemented by 49 Spanish dairy farms located in the four Atlantic coast regions of northern Spain (Asturias, Cantabria, Galicia and the Basque Country). We construct a production frontier using a Data Envelopment Analysis (DEA) model with which technical efficiency can be estimated. Determinants of efficiency are analyzed with a two-step procedure using a double bootstrap, proposed by Simar and Wilson [
28].
The study of the dairy sector is particularly relevant in this context as milk price reductions and the declining global trend in liquid milk consumption points to product differentiation as a potentially crucial strategy for the economic survival of farms.
2. Materials and Methods
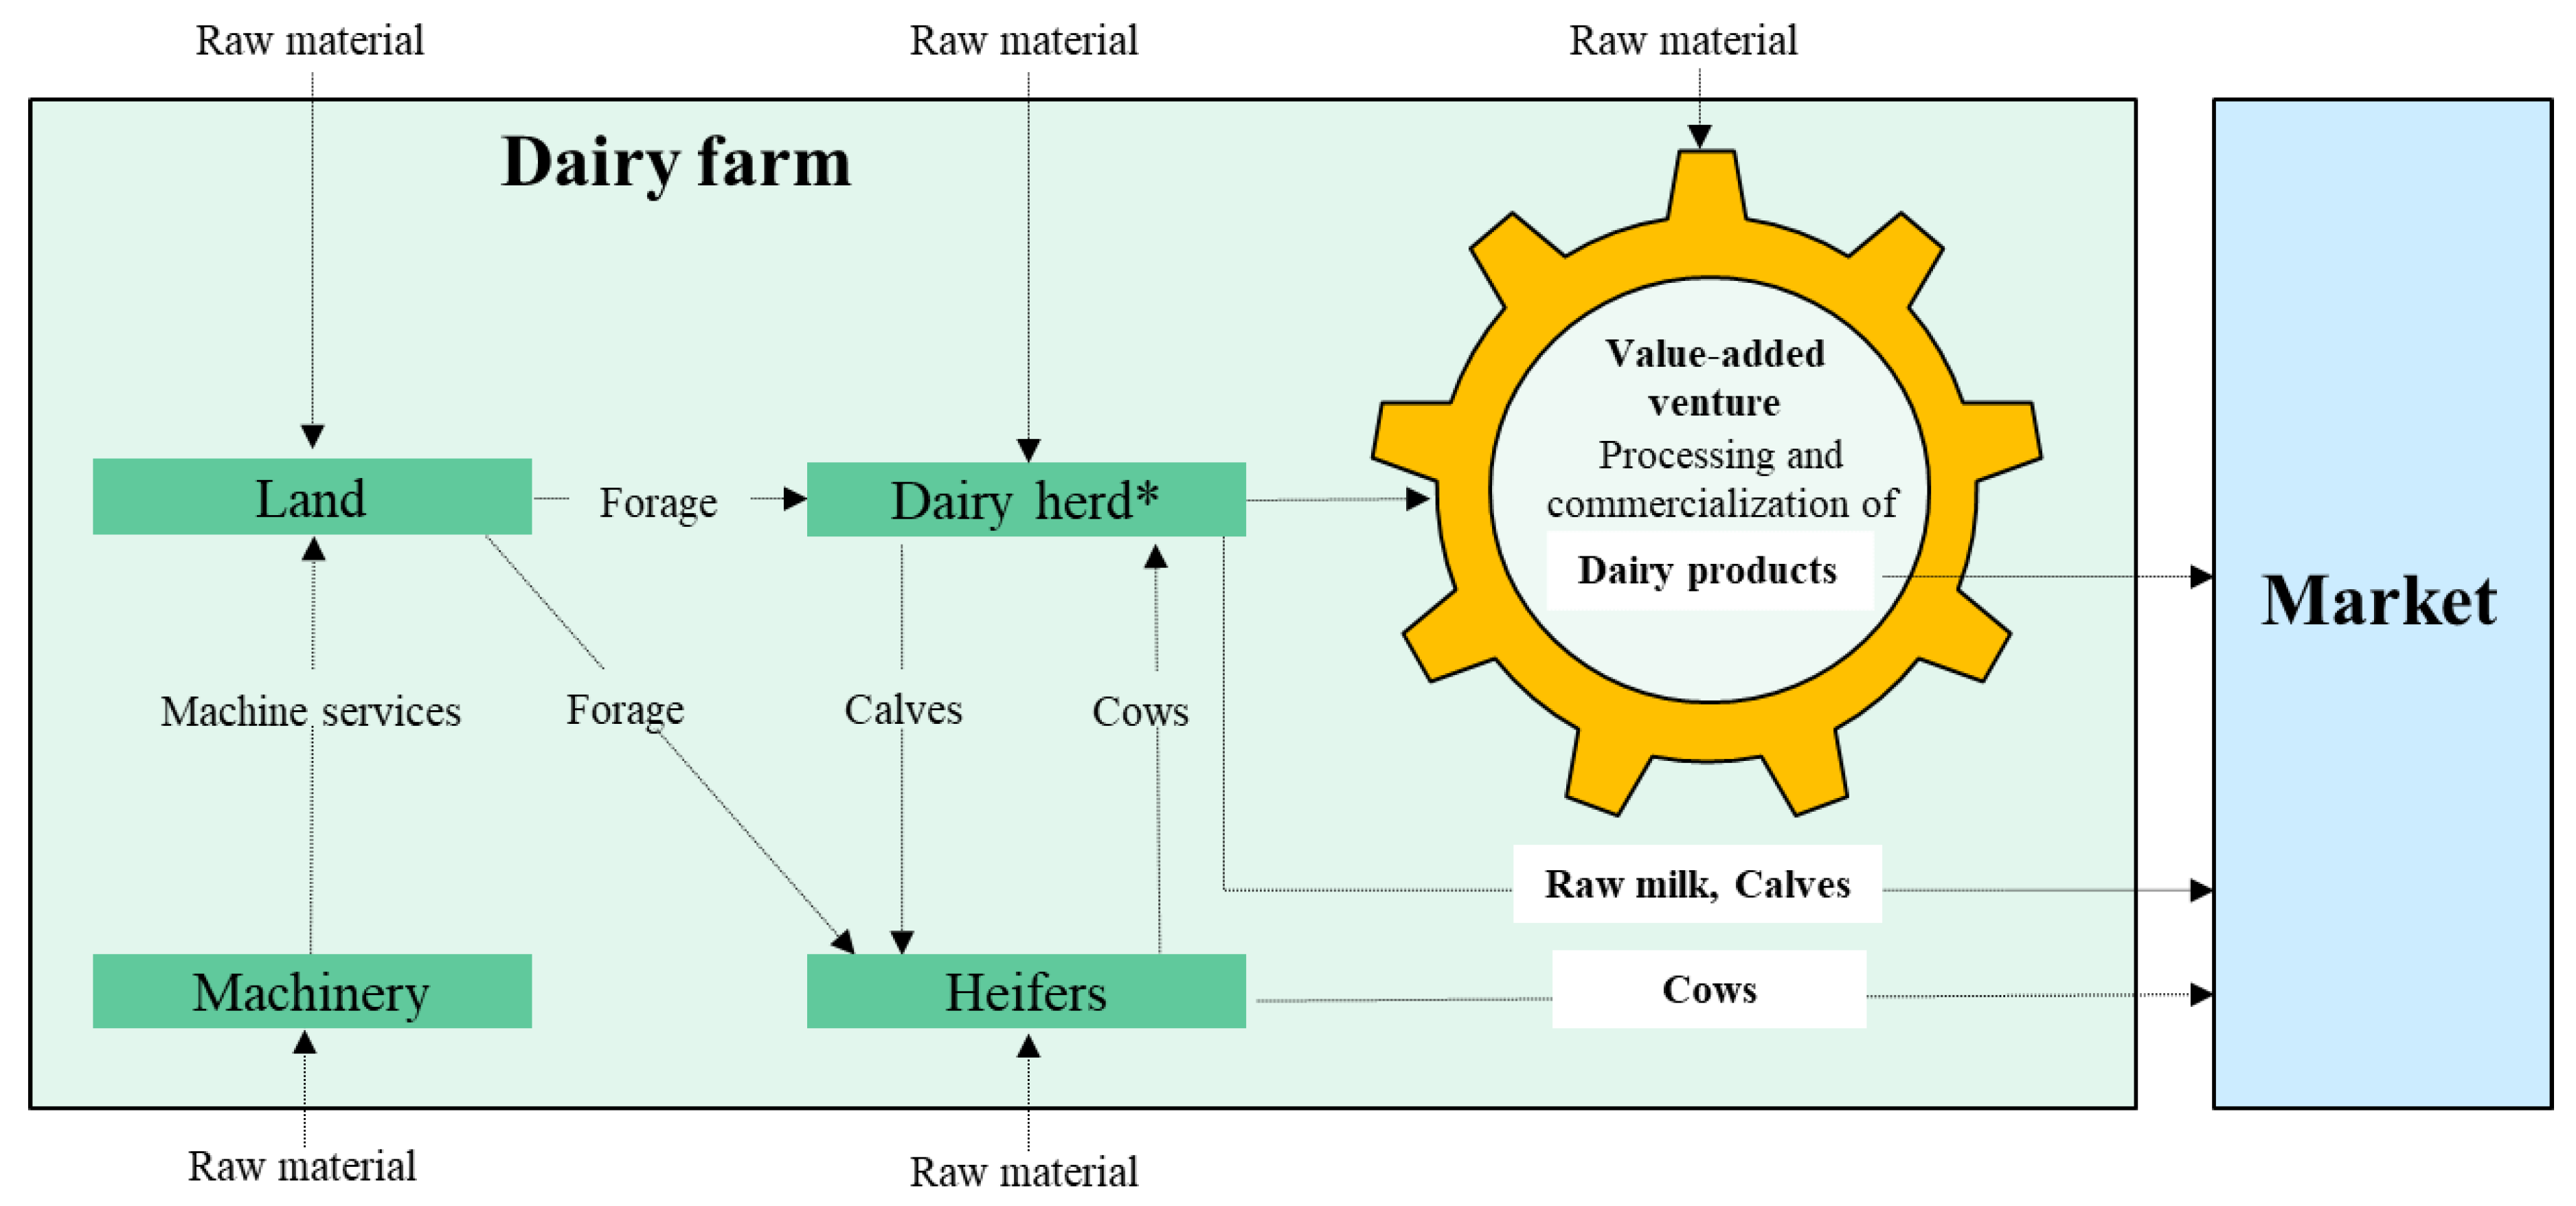
Figure 1 describes the production process of the farms that make up the sample. This work analyzes the efficiency of the value-added initiatives developed by the farm, represented in the graph by a cogwheel. Since we have data available on the costs of production and distribution associated with the activities of processing and commercialization of the dairy products, we can measure the specific efficiency of the value-added venture.
2.1. Sample and Data Collection
Although most of the milk production in the Spanish dairy sector is sold directly to the processing industry, a certain number of farmers have embarked upon diversification strategies.
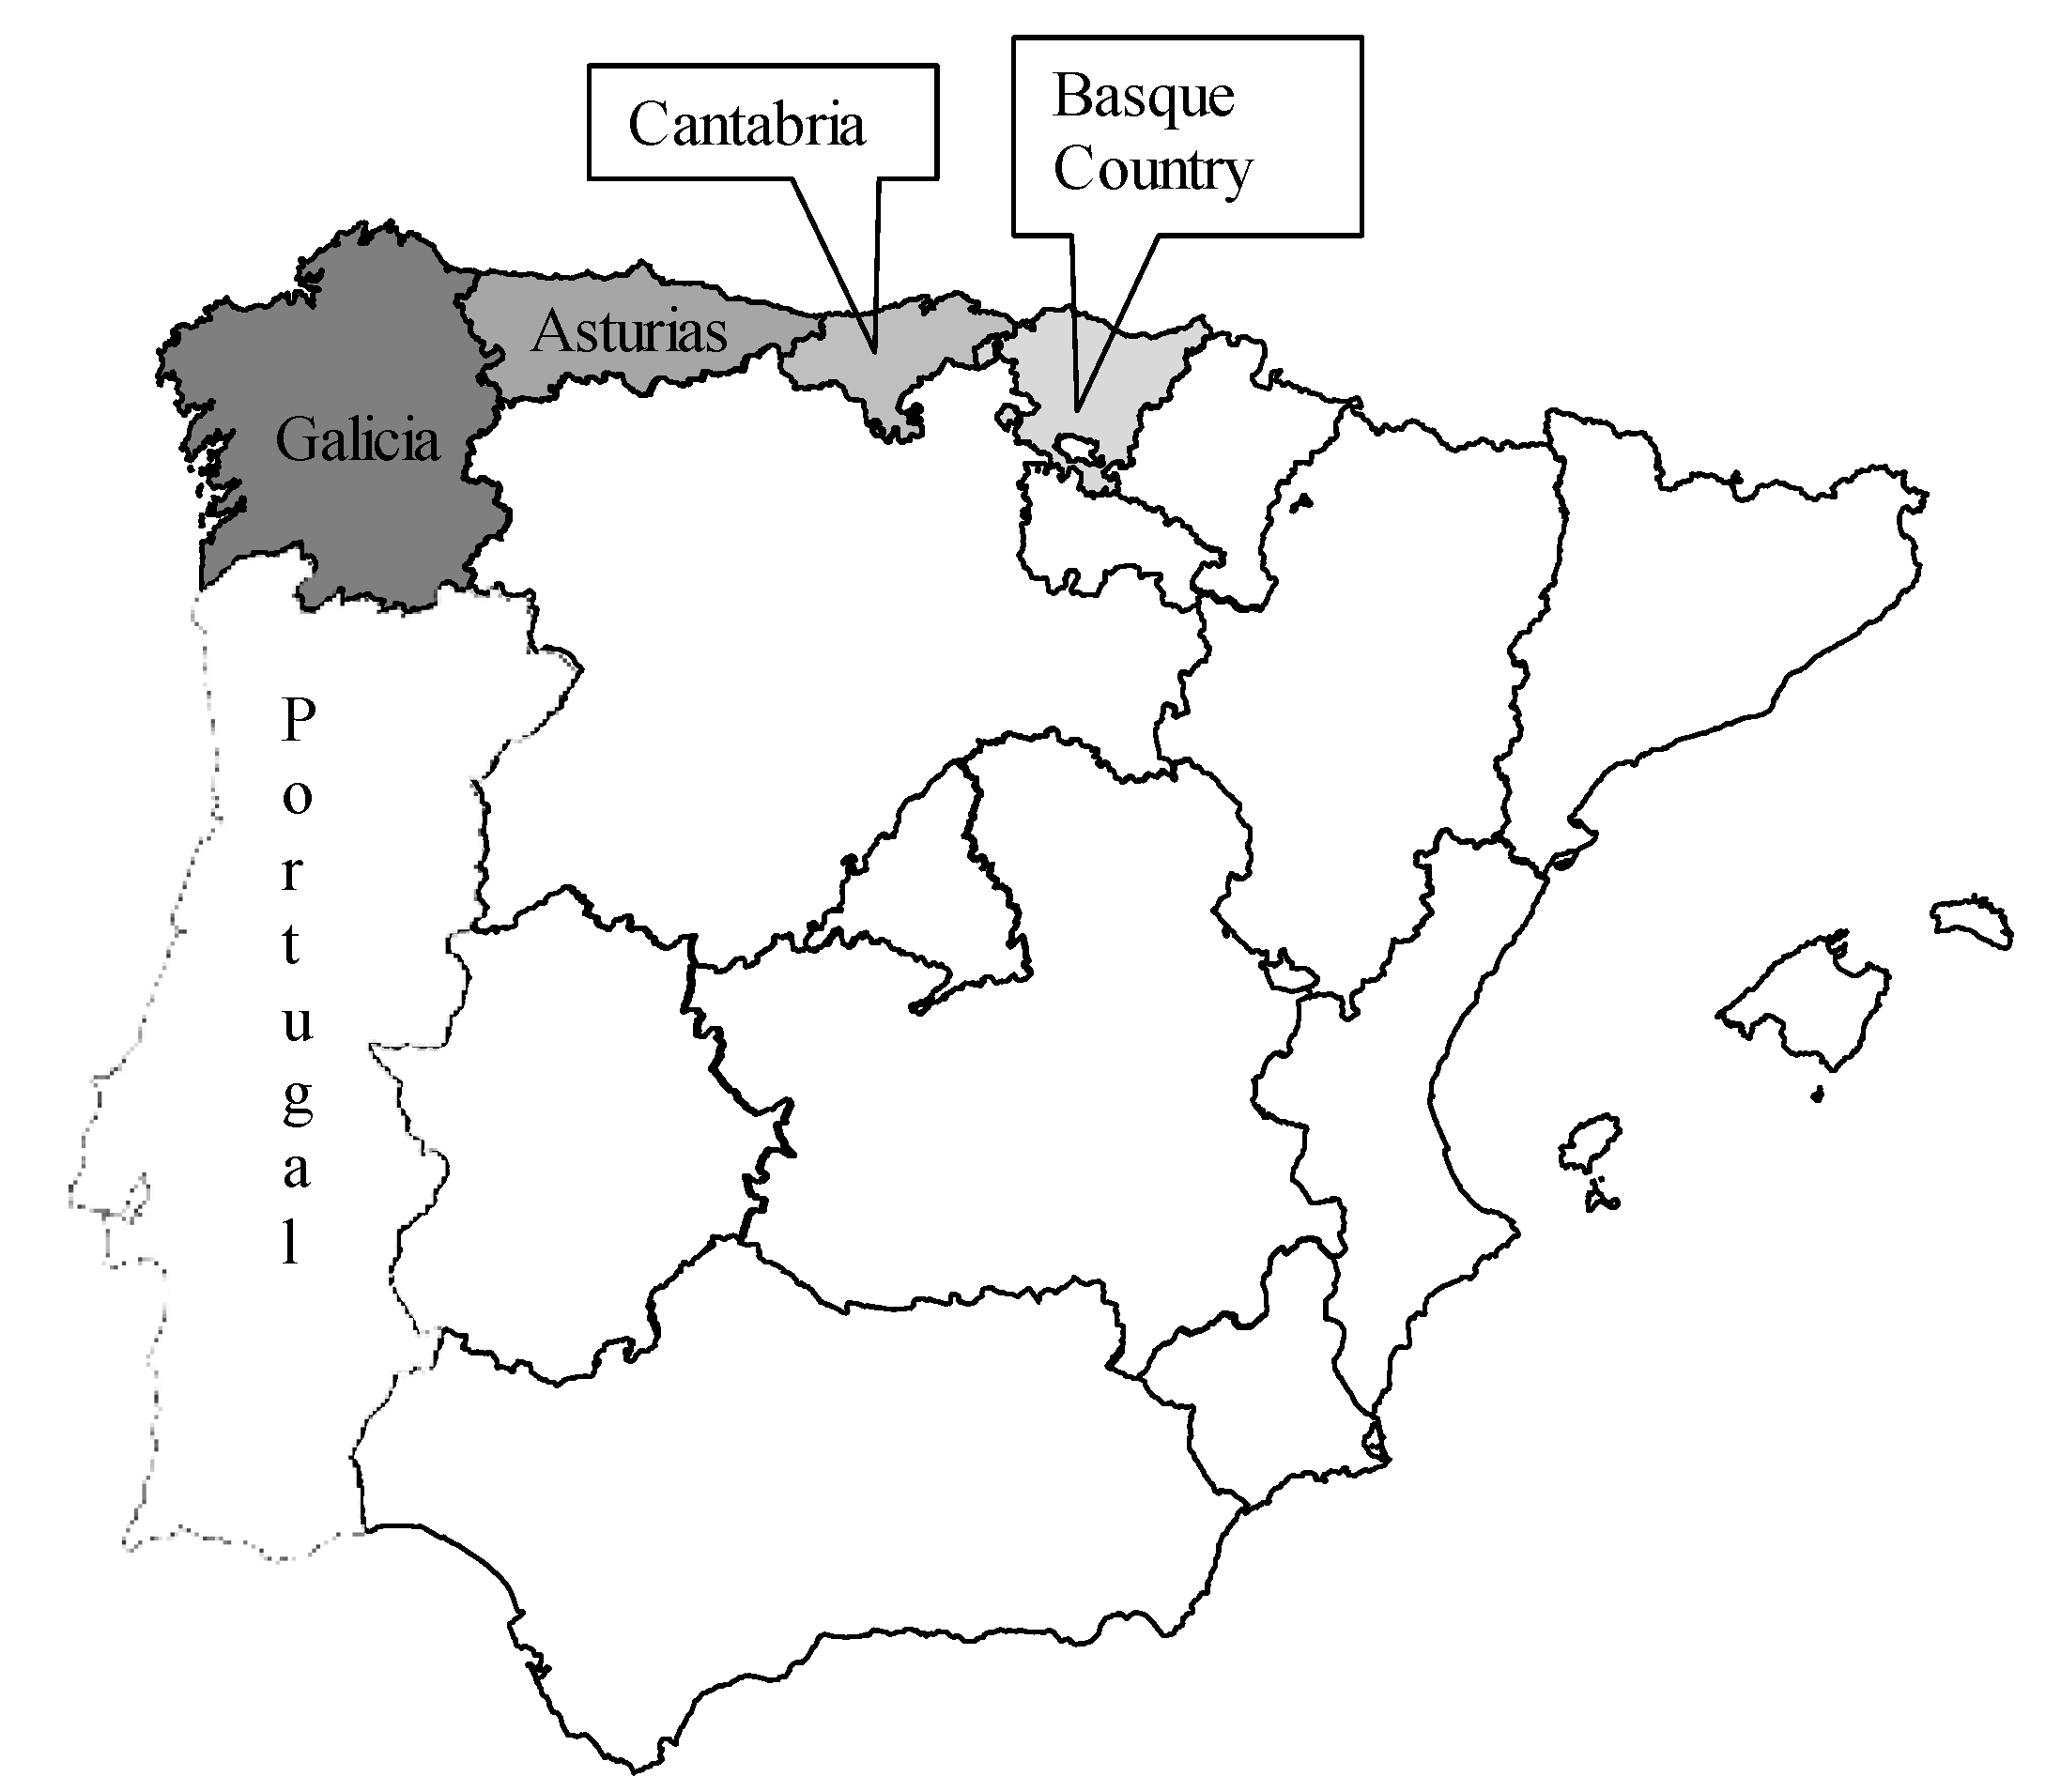
No specific register exists for dairy farms that engage in both the production as well as the commercialization of dairy products. For this reason, we resorted to identifying them via searches on the Internet and enquiries to different agents of the dairy sector (cooperatives, advisors, producer organizations, regulatory councils and certification bodies of the different PDO and of organic agriculture, etc.). The study centered on the four Atlantic coast regions of northern Spain (Asturias, Cantabria, Galicia and the Basque Country) where, according to statistics published by the Ministry of Agriculture, Food and Environment (available at
www.magrama.gob.es), 79% of dairy farmers and 59% of Spanish dairy production were located in 2013 (
Figure 2).
The design of the questionnaire used in this study involved a series of prior interviews conducted with more than 20 dairy farmers during the last months of 2011. The objective of these interviews was to present the study, request collaboration and acquire as much information as possible on the commercial activities being carried out by the farmers. The study also benefitted from the collaboration of a group of 25 Spanish experts possessing in-depth knowledge of the dairy sector (including farm advisers, scientists, farm union staff, representatives from government, policy-making, supply chains or rural economic development areas), who advised on the factors to be taken into account when valuing the success of the various types of farming diversification initiatives. For these experts, the key factors were the management ability of farmers and the differentiation of their production in the market via several strategies such as packaging, direct contact with consumers, sales in specialized shops, PDO, organic labelling, and the attributes of the local and traditional product. This expert assessment proved very useful for the elaboration of the questionnaire used in face-to-face interviews.
Collaboration was requested from the 80 dairy farmers identified, of which 49 finally participated. Each of the farmers was interviewed with the questionnaire on their own farm, a process lasting an average of two hours. The data, collected in 2012, refers to the year 2011.
For the DEA model used to estimate technical efficiency, we selected inputs and outputs based on existing studies that used firm-level financial data, especially those analyzing the case of agri-food firms [
29,
30,
31]. To construct our output variable, we needed to aggregate different outputs such as fresh milk, cheese and yogurt, among others. To do so, we used total sales revenue, in line with previous studies [
29,
30,
31].
As inputs, the existing literature uses variables that reflect the labor, investment and consumption of raw materials. To capture these expenses, we used four variables that reflect the resources used in the value-added venture to process milk and to market the different products obtained: the number of workers; the depreciation costs; the total amount of other variable costs that do not include the raw milk, such as other raw materials and packaging; and the total amount of other general fixed costs related to processing and marketing activities (which do not include labor and depreciation).
The variables used as determinants of efficiency were selected based on both the previous literature on farm sustainability and the opinions of the 25 Spanish experts consulted. These variables determining efficiency reflect the managerial strategy and socio-environmental sustainability dimensions of the value-added initiative. It should be noted that the definition and evaluation of farm sustainability is an issue on which a consensus has not yet been reached in the literature. Various analytical frameworks or sustainability templates have been developed for the farm sector [
22,
32]. These are indicator-based methods for the holistic assessment of sustainability of production at the farm level, where the indicators enable the sector to quantify and aggregate global progress across various criteria. While these methodologies facilitate relative standardization and generalized application, the diversity of spatial and temporal scales gives rise to a range of ways to analyze sustainability in the farm context, “…which in many cases are related to the objectives of the studies themselves or the innate characteristics of the field” [
32]. The variables that we have selected to capture different components of sustainability that can influence the efficiency of the diversification initiative, as well as certain relevant control variables, are presented in
Table 1. As we pointed out previously, our analysis is limited exclusively to value-added initiatives carried out on the farm. Therefore, all the data on income, costs, inputs and outputs refer exclusively to the diversification activity.
Table 1 shows descriptive statistics of the variables used in the empirical analysis. Some aspects can be highlighted:
The average value of sales per farm is €256,808. In total, 87.2% of the milk used for the elaboration of the different products is cow milk, the remainder being goat or sheep milk;
The average number of workers per farm dedicated to activities related to the processing and commercialization of products is 3.1, and these workers account for 64% of employment in the sample farms;
The sales channels ordered by their shares are: direct sales (35.2%), grocery stores (30%), restaurants (21%) and large retail (13.8%);
Cheese products represent 54.1% of total sales, followed by fresh milk (22.5%), other dairy products (12.1%) and yogurt (11.3%);
We use a Herfindahl index (HHI) as a measure of product concentration. This is calculated by summing the squares of the sales shares of the four products (fresh milk, cheese, yogurt, other dairy products) in each value-added venture. It can range from 0.25 to one, and the average value was 0.8457;
The average value of the number of product references is 5.9. This indicates the total number of variants of the products in terms of size, format, maturity and composition;
Products with an organic label account for an average of 26.8% of value-added venture sales, while sales with a PDO label represent an average of 22.1% of the sales per venture;
Family labor represents more than half of total labor and 30.6% of the ventures are managed by a female. The average age of managers is 42.9 years and 28.5% of them have university education.
In the
Appendix A, we present a table with the correlations between the variables used. Correlations between the variables are generally weak: in only two cases were the correlations slightly greater than 0.5 (in absolute terms).
2.2. Efficiency Analysis
Although the sustainability literature typically identifies economic performance with profitability, competitiveness or some other financial measure at farm level [
24], we use efficiency, since it can be considered a more meaningful and reliable measure of firm performance [
33,
34,
35]. Efficiency is a long-run determinant of competitiveness and can be crucial to farm survival in times of market contractions and crises. In this sense, efficiency is a measure more in keeping with the concepts of economic resilience and sustainability.
Technical efficiency is estimated by the distance to a production frontier. To estimate the production frontier, a parametric stochastic frontier analysis (SFA) or non-parametric DEA can be used. DEA is more appropriate for relatively small samples such as ours, and has the added advantage that it does not impose any structure on the functional form of the frontier [
36]. Following the rule suggested by [
37], we have a sufficient sample size to apply the DEA methodology with four inputs and one output (49 ≥ max {4 × 1, 3 × (4 + 1)}).
Efficiency can be measured using an input orientation, which measures the extent to which inputs can be reduced given the amount of output produced, or using an output orientation, which measures the extent to which outputs can be increased given the endowment of inputs. The choice here depends on the objectives of the firms and the nature of their production. In our sample, we consider that farms seek to generate the maximum possible value from existing inputs and the resources invested in value-added initiatives comprising processing and commercialization activities. Indeed, in our sample, several farms process all of the milk produced on the farm, requiring them to buy additional milk from other suppliers. It therefore seems reasonable for us to choose an output orientation to measure efficiency.
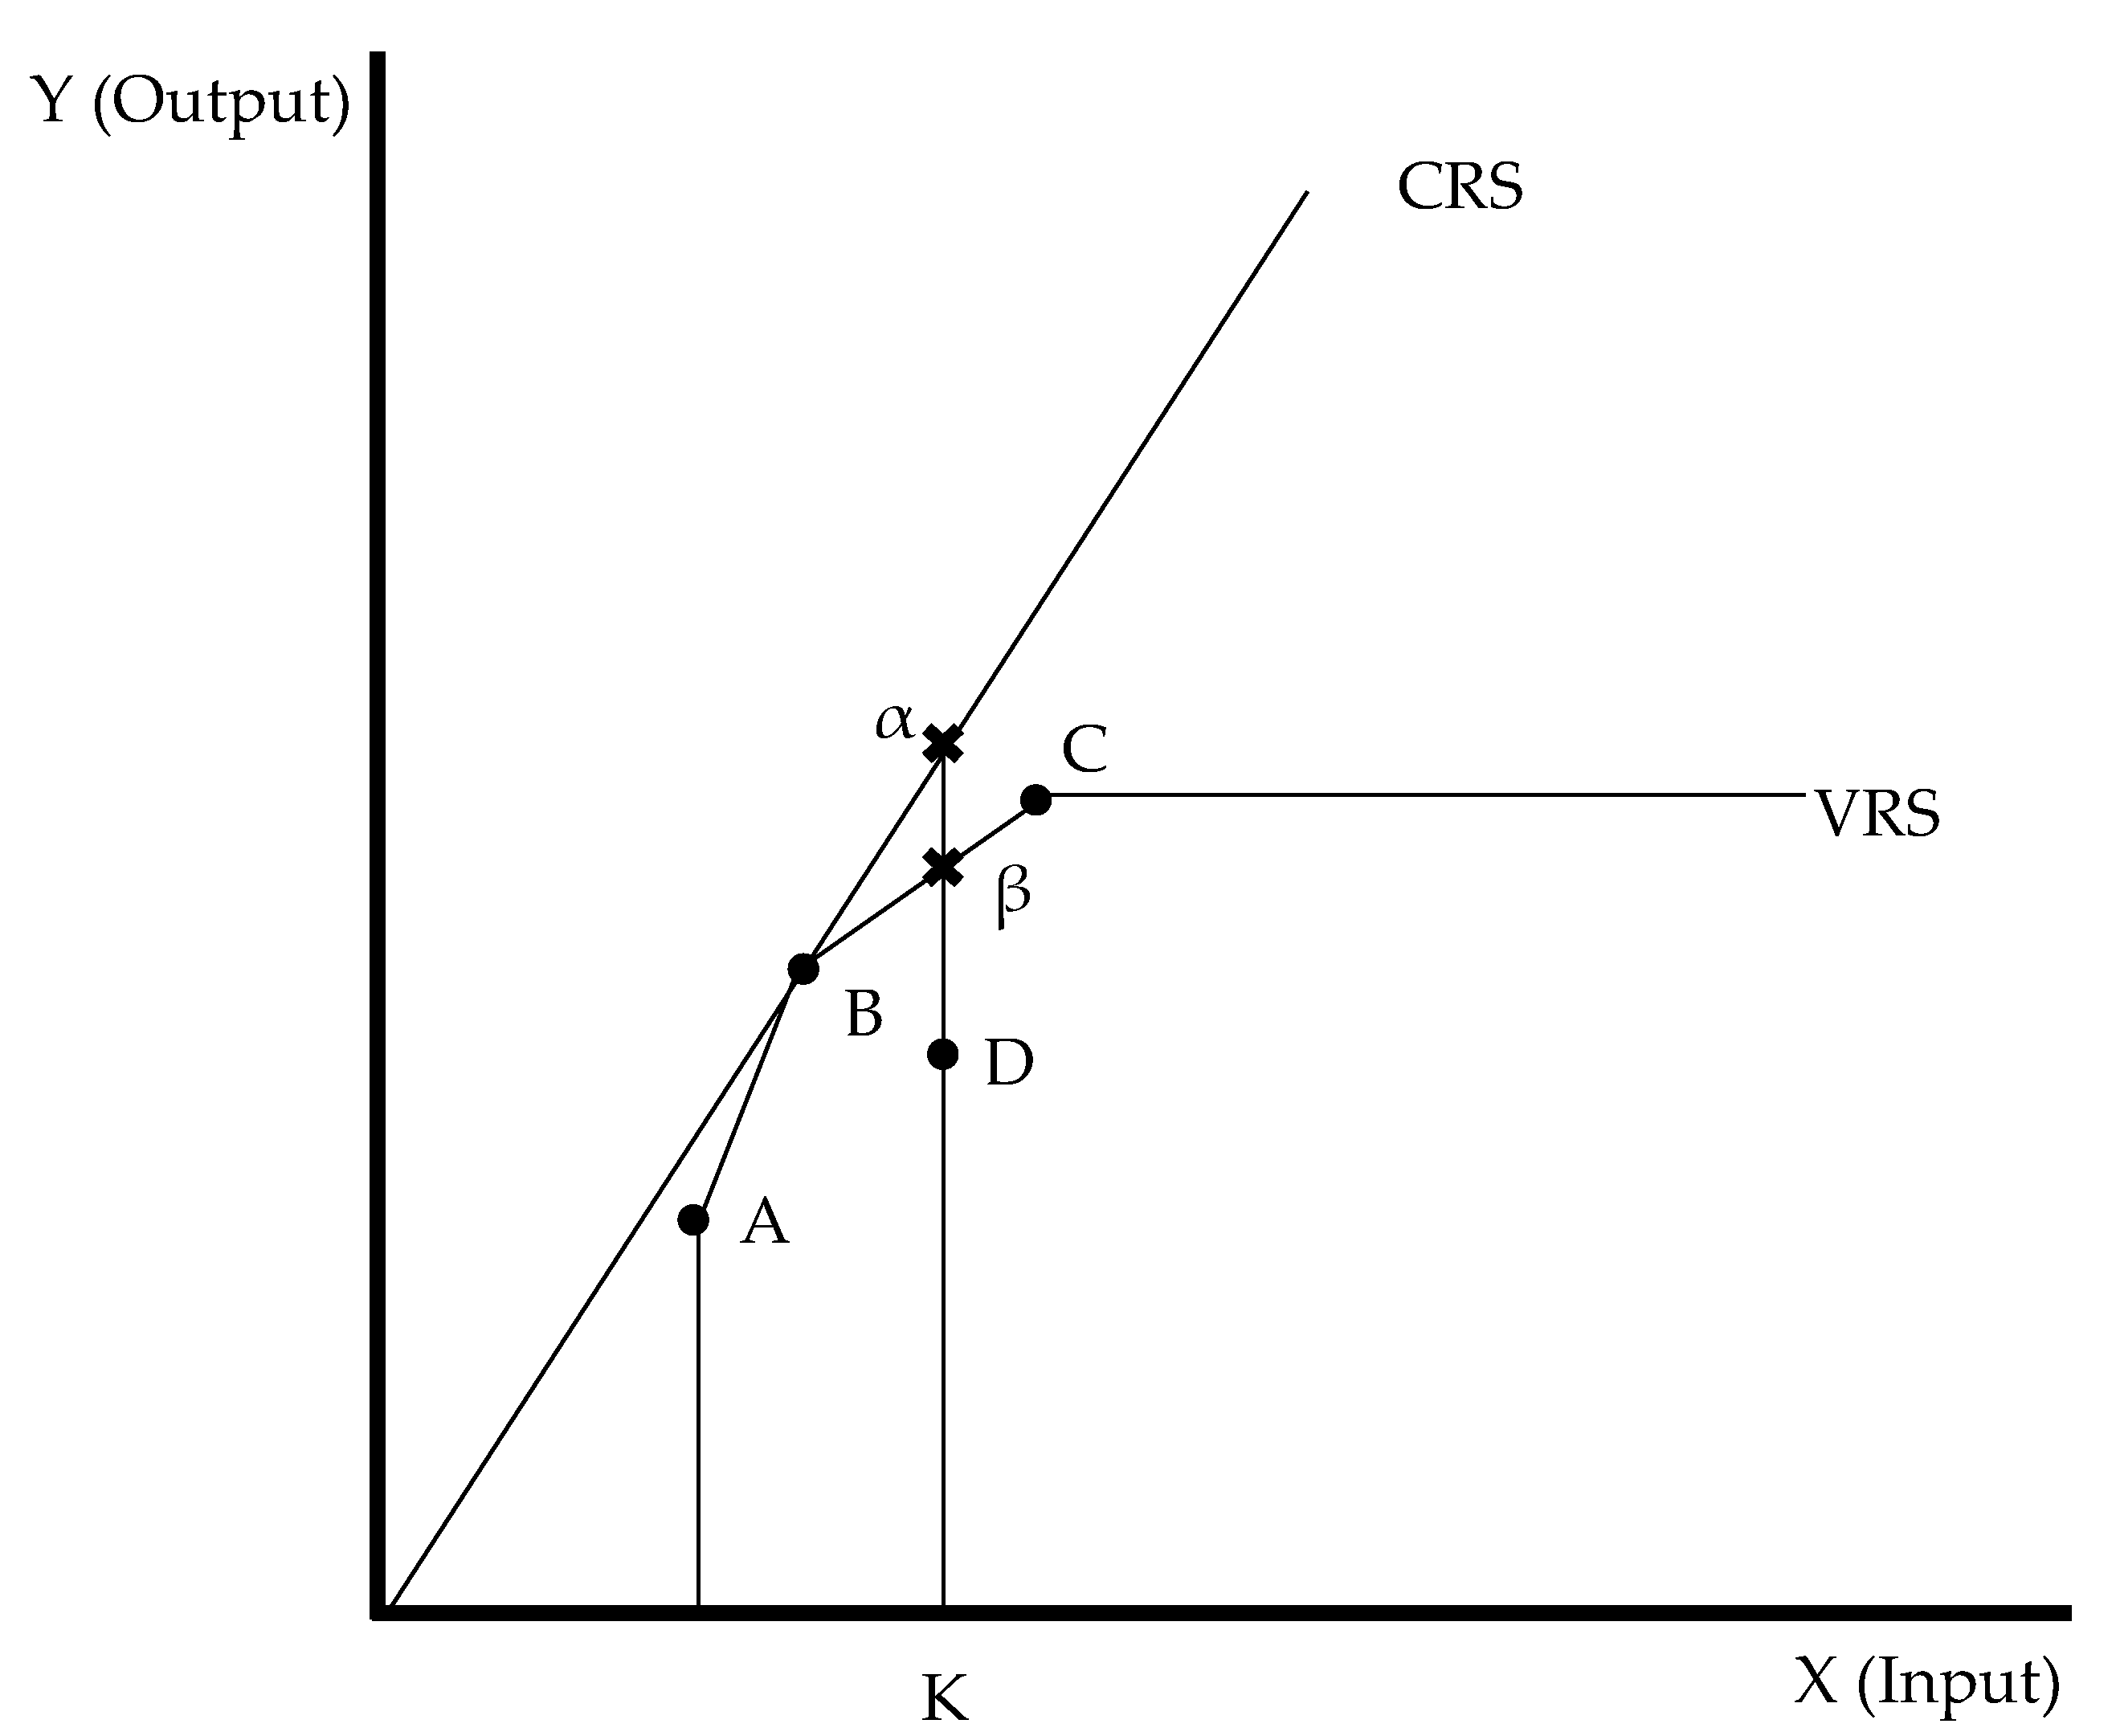
In DEA models, the production frontier, and hence efficiency, can be calculated under the assumptions of constant returns to scale (CRS) [
38] or variable returns to scale (VRS) [
39].
Figure 3 illustrates the frontiers and the efficiency calculations under CRS and VRS assumptions for the simplest case of an output (y) being produced with a single input (x):
Points on the reference frontier (CRS or VRS) are efficient, while those below the frontier are inefficient. Thus, for the CRS frontier, firm B is efficient, whereas firms A, C and D are inefficient. For the VRS frontier, on the other hand, firms A, B and C are efficient, while firm D is inefficient. Output-oriented efficiency is calculated as the ratio of actual output to maximum output attainable so that efficiency scores range from zero to one, with a value of one representing efficiency in production and values lower than one representing the degree of inefficiency. Focusing on firm D, which is inefficient under both CRS and VRS specifications, efficiency under CRS
can be calculated as:
Under VRS, efficiency for firm D is calculated as:
Assuming we are analyzing a set of
I observed units using
N inputs to produce one output, efficiency under the assumption of CRS is calculated by solving the following program [
40] for each observed unit:
where subscript
refers to the evaluated unit, subscript
refers to the set of observed units and subscript n refers to each input among the different
N inputs used in production.
are the weights associated with each unit to construct a linear combination of all (or only a subset) of them. Finally,
are the observed efficiency scores.
Under VRS, efficiency is calculated using the following program [
40]:
which differs from the CRS specification by the incorporation of the additional convexity constraint (Equation (4e)). We calculate efficiency scores under both CRS and VRS assumptions. Once this has been done, we relate these scores to a series of explanatory variables in order to analyze the factors that influence efficiency performance. The following equation is estimated to determine the effect of efficiency determinants on farms’ efficiency scores:
where
are the efficiency scores,
are the variables considered as efficiency determinants,
is the error term, and the
s are the parameters to be estimated. Subscript
i refers to the observed units. It should be highlighted that the efficient units in the sample may not achieve the best potential performance in a finite sample. If this is the case, the observed efficiency scores will be upwardly biased and two major problems arise in the estimation of Equation (5): the error term would be serially correlated, and some correlation among the efficiency determinants and the error term arises [
28]. Therefore, the estimation of Equation (5) by ordinary least squares would be biased. In order to deal with these problems, we carried out a two-step procedure with a double bootstrap proposed by [
28]. In the first stage, the efficiency values corrected by the bias were determined (2000 replications), while in the second stage we studied the factors that could influence the efficiency levels by employing a truncated bootstrap regression (2000 replications) [
41].
3. Results
Empirical implementation of the econometric methodology described above has been carried out using the Stata 14.2 package (StataCorp LLC, College Station, TX, USA). The results obtained are presented in
Table 2, where it can be seen that there is substantial variability in the efficiency scores of the analyzed ventures. According to the CRS model, there are eight efficient ventures, while there are 13 with the VRS model.
The analysis of the factors that determine efficiency show the effects of variables that reflect business management as well as environmental and social aspects of the farms, as described in
Section 2. The results in
Table 3 and
Table 4 should be interpreted by taking into account the fact that positive coefficients indicate increases in inefficiency, whereas negative coefficients indicate reductions in inefficiency, i.e., efficiency improvements.
In order to check the robustness of the results, two models are estimated: the first for the entire sample (49 cases) and the second for initiatives in which cow’s milk accounts for more than 50% of total processed milk (43 cases).
Comparing the results from the CRS- and VRS-based models, in
Table 3, it can be seen that they are very similar. The coefficients of the efficiency determinants have the same sign in every case, with the exception of the variable capturing the gender of the manager, which in any case is highly insignificant. The coefficients have similar levels of significance across the models except for the percentage of family labor and the Cantabria region dummy variable. The percentage of family labor is not significant at any conventional level in the CRS model, but is significant at the 5% level in the VRS model, while the control variable for Cantabria is not significant in the CRS model but is significant in the VRS model at the 10% level. In our discussion of the results, we can therefore focus on the VRS model.
Beginning with the managerial and marketing variables, the results show that the processing of fresh milk is more positively associated with efficiency than the production of the reference category products, which consist of more elaborated cheese, yogurt and other products (for example, rice pudding and ice cream). The Herfindahl index also has a negative coefficient, indicating that a greater concentration of processing and marketing is positively correlated with efficiency. A higher number of product references or variants is also positively correlated with efficiency. The results also show that the sale of products to final consumers and grocery stores are more positively associated with efficiency than distribution through large commercial areas (reference category). The percentage of cow’s milk showed no significant relation to efficiency.
In terms of environmental and social variables, the production and sale of organic products and the production and sale of certified products in a PDO are both positively correlated with efficiency. Of the three variables capturing the characteristics of the manager, namely their gender, age and whether they have university education, only the level of university education of the manager is positively correlated with the efficiency of the venture. The percentage of family labor is negatively associated with efficiency (though it should be recalled that this relationship was not found to be significant in the CRS model).
As for the control variables, initiatives in the region of Galicia were found to be relatively inefficient compared to those in the reference region (Basque Country). A positive association with efficiency, at the 10% level of significance, is found for initiatives located in Cantabria in the VRS model (though not in the CRS model), while, in the case of Asturias, no significant relations are found. Finally, the age of the new venture is positively related to efficiency.
Table 4 presents the results of the estimates made for ventures that are based mainly on the processing of cow’s milk. For this, the 43 cases in which cow’s milk accounts for more than 50% of processed milk have been selected.
The results in
Table 4 are very similar to those obtained from the total sample (
Table 3), especially in the case of the CRS model. Compared to the results for the total sample, the number of product references, the university education of the manager and the regional variable for Cantabria remain significant in the CRS model but are no longer significant in the VRS model. On the other hand, the percentage of sales to restaurants and being located in Asturias both have a significant positive correlation with efficiency in the VRS model with the reduced sample, whereas no relationship was found for these variables when the full sample was used. Finally, whereas the percentage of family labor was only significant in the VRS model when the full sample was used (being negatively correlated with efficiency), it is significant in both the VRS and CRS models when using the reduced sample.
To further analyze the results, we note that incomes from the sale of high value-added products can be raised by increasing the sales volume and/or increasing the unit profit margin (income minus variable costs) [
19]. These reflect different strategic marketing choices. To illustrate these,
Figure 4 below represents the 49 farm enterprises in the ‘sales volume-unit margin’ space, which allows us to compare diversification pathways based on sales volume with those based on achieving a high unit profit margin.
In
Figure 4, four quadrants have been identified that reflect four combinations of sales volume (liters processed) and unit margins (value added per liter of milk processed). To delimit the quadrants, we use the 40th percentiles of the margin per liter (0.62 €/liter) and the liters processed (85,000 L). To improve the visibility of the figure, we set a maximum for the unit margin of €3/liter and a maximum of 700,000 L for the production volume.
Figure 4 also shows the number of cases in each quadrant and the average (corrected) efficiency scores (both CRS and VRS) of the four groups.
It can be observed that Quadrant II, which includes ventures that work with high unit margins and low volume, is the one with the lowest average level of efficiency, whereas the highest levels of efficiency are reported in Quadrant III (high unit margin and high volume) and Quadrant IV (low unit margin and high volume). The application of the Mann–Whitney test identifies significant statistical differences between the efficiencies of Quadrants I and IV (
p = 10%) in the VRS model. The test also identifies significant differences between Quadrants II and IV (
p = 1%) and Quadrants II and III (
p = 10%) in the last two cases in both models CRS and VRS. These results illustrate the difficulties in achieving efficiency faced by ventures following a strategy based on high-margin production and low volume.
Figure 4 identifies the initiatives that only use cow’s milk and those that use several types of milk (cow, sheep and goat). There are no significant differences in efficiency between the two groups.
4. Discussion and Conclusions
This work sheds light on the level of efficiency of value-added ventures implemented in the dairy sector in Spain, as well as identifying a series of factors that determine this efficiency. Our study highlights the diversity of the sector and provides evidence of the variety of managerial strategies that allow producers to be efficient and sustainable at a small-scale level. Our results are in line with previous studies that conclude that diversification and economies of scope contribute significantly to more resilient pathways of development [
1,
18]. While these previous works were based on case studies, our work uses evidence from the DEA methodology applied to a sample of diversified farms.
The success of agricultural diversification initiatives is crucial to guaranteeing the economic viability of small farms, as well as contributing to the generation of additional employment and the maintenance of the population in rural areas. Moreover, these initiatives contribute to the maintenance of the environment and the enhancement of cultural and traditional aspects inherent to rural areas. Our work supports the idea that there are variables associated with high value-added ventures on farms that favor the economic, social and environmental sustainability of the farms.
Qualitative studies on “value-added” or “product differentiation” diversification initiatives have suggested that farmers employ different business strategies. This paper considers the effect of direct sales, PDO and organic labelling on the efficiency of the new venture and provides valuable insights. We primarily sought to uncover evidence on how producers’ efficiency may rely on their ability to manage and exploit a new set of comparative advantages in increasingly differentiated markets.
Our results show that sales of fresh milk are associated with greater levels of efficiency than the processing and sale of more elaborated products such as cheese, yogurt and other products. This result implies that the managerial challenges associated with the complexity of producing and commercializing several types of products are considerable. This result is in line with Katchova [
17], who argues that diversified farms have lower efficiency than specialized ones because diversified farms support less-profitable activities by cross-subsidizing them with more profitable activities and/or they accept lower profits in return for risk reduction. In fact, regarding product specialization our results show that efficiency improves with increased concentration in a single product. However, we also found that number of product references (variants of the products in terms of size, format, maturity or composition) has a positive relationship with efficiency. This seems to indicate that the use of several variants of the product permits operators to cover the needs of different customer segments, thereby contributing to higher sales for a given endowment of resources.
Complementing the previous results, we use our computed efficiency scores to compare the commercialization strategies followed by each venture in terms of sales volume (liters) and unit margin. Our findings illustrate the difficulties in achieving efficiency faced by ventures that follow a strategy based on high-margin low-volume production.
Regarding the distribution channel of the product, we find that direct sales to end consumers and grocery stores had a positive and significant association with efficiency. This means that efficiency rises with increased use of these DMS. This supports the notion that this type of strategy allows a farm operator to capture a larger share of the consumers’ food income budget by eliminating intermediaries in the supply chain [
42]. Previous research has suggested that farmers involved in DMS are more likely to achieve higher income levels [
43,
44]. Our results are consistent with previous studies which have found that sales to local grocery stores, restaurants, and/or other retailers and regional distributors had a rather significant positive impact on gross cash income [
45].
Concerning environmental and social variables, we found that organic labelling has a positive and significant relationship with efficiency. Several studies have shown that organic labelling has a positive impact on the price of dairy products for a variety of reasons, including the perceptions of consumers about the health and environmental benefits from organically produced foods and other quality attributes such as freshness and taste [
44,
45,
46,
47,
48,
49]. In line with this, other authors have found that farmers who are more environmentally aware tend to make more efficient use of inputs than those who are less environmentally aware [
50]. Other studies have found that organic production and other environmental certifications have a significant and positive impact on profitability [
20]. They argue that “the concept of organic production is founded on a more sustainable approach based on the criteria of good agricultural practices, implying the efficient use of means and factors”.
As expected, PDO certification had a positive association with efficiency, emphasizing the importance of this quality indicator. Since the PDO label is an instrument that reduces the asymmetric information problem between producers and consumers, if the collective reputation of the product is good then this label will be a powerful tool for signaling quality [
51]. On the other hand, belonging to a PDO involves complying with a series of production standards shared by all the producers registered in the PDO, which may encourage greater technical efficiency. In the context of the present work, one should take into consideration that the PDO variable encompasses several denominations of the origin of cheese with heterogeneous prices, costs and margins; indicator variables (dummies) for each PDO were not used as there was a small number of observations for some of them.
The gender variable is not significant. Previous research has found significant relationships between gender and productivity, but the results are contradictory, probably because the nature of the relationship depends on the type of activity analyzed [
52,
53]. Moreover, many of these studies consider the gender of the survey respondent rather than the gender of the decision maker [
54]. While previous studies have found the age of the farmer to be related to efficiency [
53], we find no such relationship in our models.
Regarding the university education of the manager, we find a positive relationship between educational attainment and efficiency. This result is in line with the academic literature, which has demonstrated a strong correlation between the number of years of education completed and farm profit [
55]. A possible explanation could be that farmers with more education may more readily adapt to new market opportunities. Other studies have found that completing higher levels of education leads to higher adoption of both the best management practices and novel technologies. A possible reason underlying these relationships is that better-educated farmers may be more aware of specific practices as a result of having better contacts and stronger professional networks [
54].
We also found that a greater share of family labor is negatively associated with efficiency. This result seems to contradict previous studies [
56], which found that family businesses seem to perform better. Our result may reflect the need to hire external workers in order to be able to achieve a greater volume of sales and thereby take greater advantage of the investment in machinery and facilities.
Finally, we found that the age of the new venture is positively related to efficiency, which would indicate a learning effect. We also find that efficiency varies significantly across geographical regions. This is an expected result given that the dairy sector is not homogeneous across the Cantabrian coast due to regional differences in the level of income, the weight of the dairy sector, the dispersal of the population or the appreciation of the inhabitants for their native products.
The findings of this study have a number of implications for farm managers and policymakers who are concerned with the sustainability of the small farm sector in the long-term. Although our paper supports the idea that value-added diversification contributes to more resilient pathways of development, our results qualify this statement by underlining the importance of good management of marketing and operational factors in the achievement of economic sustainability. On the one hand, product differentiation and the exploitation of niche markets that meet new consumer demands can contribute to the economic sustainability of farms of any scale in highly competitive markets. It seems that management alternatives must be considered to ensure that product diversification can be carried out efficiently. In a similar vein, the growth processes of these farms must be properly managed in order not to undermine their efficiency and sustainability. On the other hand, the design of public policies must take into account the factors that favor and that harm the efficiency and sustainability of farms. Our results show that participating in quality schemes such as PDO or organic labelling is positively related to farm efficiency and sustainability.
Finally, this work suffers from a number of limitations and there are possible lines of development that should be considered in future research. For example, the sample is small and refers to the year 2011, and hence the results should be interpreted with due caution. In spite of this, it provides an important lesson by underlining the importance of developing management accounting systems in the context of farm diversification initiatives. The formal and systematic collection of variables such as those used in this work permits better management of these initiatives and a framework for benchmarking. The construction of such datasets allows a systematic evaluation of the effectiveness of diversification initiatives that farmers can use to improve the sustainability of their farms. These kinds of information systems are necessary to identify the sources of variation in technical efficiency between farmers, and provide a useful tool to guide economic policy recommendations. In future research, we plan to update our survey and thereby obtain a panel dataset, which would permit the improved identification of the relationships and an assessment of how they have evolved over time. It would be particularly interesting to consider more explanatory factors such as, for example, direct information about the potential environmental impacts of value-added initiatives. We hope that our work will encourage researchers from other regions and countries to carry out similar quantitative studies so that comparisons can be made over time and across space about factors related to the successful implementation of diversification initiatives.


