Article

Unburnable and Unleakable Carbon in Western Amazon: Using VIIRS Nightfire Data to Map Gas Flaring and Policy Compliance in the Yasuní Biosphere Reserve

by
Francesco Facchinelli
1,*,
Salvatore Eugenio Pappalardo
2,*,
Daniele Codato
2,
Alberto Diantini
2,
Giuseppe Della Fera
2,
Edoardo Crescini
1 and
Massimo De Marchi
2
1
Interuniversity Department of Regional and Urban Studies and Planning (DIST), University of Turin, Viale Pier Andrea Mattioli, 10125 Torino, Italy
2
Department of Civil, Environmental and Architectural Engineering, University of Padova, Via Marzolo, 35131 Padova, Italy
*
Authors to whom correspondence should be addressed.
Sustainability 2020, 12(1), 58; https://doi.org/10.3390/su12010058
Submission received: 7 November 2019 / Revised: 6 December 2019 / Accepted: 18 December 2019 / Published: 19 December 2019

Abstract

:
In the Amazon Rainforest, a unique post-carbon plan to mitigate global warming and to protect the exceptional bio-cultural diversity was experimented in 2007–2013 by the Ecuadorian government. To preserve the rainforest ecosystems within the Yasuní-ITT oil block, the release of 410 million metric tons of CO2 would have been avoided. The neologism “yasunization” emerged as an Amazonian narrative on “unburnable carbon” to be replicated worldwide. Considering the unburnable carbon, petroleum-associated gas flaring represents the unleakable part. Flaring is an irrational practice that consists of burning waste gases, representing not only a leak of energy but also a pollution source. The general aim of the paper is to monitor gas flaring as a tool, revealing, at the same time, the implementation of environmental technologies in the oil sector and the compliance of sustainable policies in the Amazon region and the Yasuní Biosphere Reserve. Specific objectives are: (i) identifying and estimating gas flaring over seven years (2012–2018); (ii) mapping new flaring sites; iii) estimating potentially affected areas among ecosystems and local communities. We processed National Oceanic and Atmospheric Administration (NOAA) Nightfire annual dataset, based on the elaboration of imagery from the Visible Infrared Imaging Radiometer Suite (VIIRS) and developed a GIS-based novel simple method to identify new flaring sites from daily detections. We found that 23.5% of gas flaring sites and 18.4% of volumes of all oil industries operating in Ecuador are located within the Yasuní Biosphere Reserve (YBR). Moreover, we detected 34 additional flaring sites not included in the NOAA dataset—12 in the YBR and one in Tiputini field, a key area for biological and cultural diversity conservation. We also found that at least 10 indigenous communities, 18 populated centers and 10 schools are located in the potentially affected area. Gas flaring can be used as a policy indicator to monitor the implementation of sustainable development practices in complex territories.

1. Introduction

1.1. Leaving Fossil Fuel Underground: From the Yasuní-ITT Initiative to Unburnable Carbon Areas

The Ecuadorian Amazon Region (EAR) is widely considered as one of the most biologically and culturally diverse areas on the planet [1,2,3,4]. Although it represents only 2% of the Amazon basin, different studies on tropical ecosystems confirm an exceptional biological richness across several taxa (amphibians, birds, reptiles, mammals, and plants) and high levels of regional endemisms. Such high levels of biodiversity officially make Ecuador one of the 17 megadiverse countries in the world [5,6]. Furthermore, the EAR encompasses indigenous territories of different ethnic groups, including indigenous groups in “voluntary isolation”, clans of semi-nomadic hunters and collectors (the Tagaeri and Taromenane) which are presently facing the same survival due to numerous external pressures, most of which are related to extractive activities [7,8]. In spite of its exceptional bio-cultural diversity, the EAR today is under extensive and intensive oil industry operations, which began in 1970 when huge hydrocarbon reserves were discovered in the Northeastern sector [9,10]. Total fossil fuel reserves are estimated by Organization of the Petroleum Exporting Countries (OPEC) to be 8.3 billion barrels and this is the reason why 70% of the EAR surface is divided into oil concessions [11]. The Ecuadorian Amazon is a strategic region for the national economy: with an average production of 500,000 barrels per day, the oil sector in the EAR represents up to 50% of its export and one-third of its fiscal revenues in the latest boom years, 2003–2014 [12].
Besides economic benefits for oil operators and the Ecuadorian State, the socio-environmental sustainability of fossil fuel development in the EAR in recent decades is broadly questionable [1,2,13]. Direct and indirect socio-environmental impacts in the EAR are widely demonstrated: direct effects include deforestation and forest degradation due to drilling platforms, pipelines, access roads, seismic prospection and chemical contamination of water bodies from wastewater discharges, oil spills, venting and flaring of associated petroleum gas [2,4,13,14,15,16,17]. Indirect effects are mainly related to the opening of roads for oil exploration and transportation, which turns terrestrial communications infrastructures into the main vector for colonization of primary forest and indigenous territories [18,19,20].
Despite the historic extractive-based economy and the constant expansion of the fossil fuel frontier within the EAR, Ecuador is one of the unique countries in the world recognizing the right to nature (article n. 71, Derechos a la Pachamama”) in the National Constitution renewed in 2008. At the same time, the innovative constitution is based on the principle of Good Living “Buen Vivir”, “Sumak Kausai” the Ecuadorian cultural declination of the sustainable development concept [21,22,23].
In 2007, an effort to protect the exceptional bio-cultural diversity and mitigate the global warming associated with fossil fuel production was presented to the United Nations by the Ecuadorian Presidency. This innovative political experimentation, called the Yasuní-ITT Initiative, aimed to keep almost 1 billion barrels of crude petroleum locked underground, in the oil fields of Ishpingo, Tiputini and Tambococha, located within the core area of the UNESCO Yasuní Biosphere Reserve (RBY) [24,25,26]. The Yasuní-ITT Initiative would have avoided the release of 410 million metric tons of CO2 into the atmosphere, preserving an important sector of the EAR. In exchange, the international community would have had to contribute with a compensation of US$ 3.6 billion, equivalent to 50% of the earnings estimated from exploiting the oil fields. [27,28]. The initiative received relevant support from international institutions and countries, opening the political and academic debate about leaving fossil fuels underground in highly biologically and culturally sensitive areas. Moreover, this international initiative opened possible alternatives for post-carbon and energy transition mechanisms to prevent greenhouse gas emissions and suggested the “yasunization” concept as a possibility to replicate this model in other countries [29]. Unfortunately, in 2013, the Yasuní-ITT Initiative was officially retired by Ecuadorian President Rafael Correa, due to several reasons: limited financing, intense political pressures and economic drivers [30,31]. The moratorium on fossil fuel exploitation in the Yasuní-ITT block was therefore abandoned and an oil production plan within the Tiputini and Tambococha oil fields was implemented in 2014 by Petroamazonas EP, a national oil company. As a result of the national and international attention raised from the Yasuní-ITT Initiative, fossil fuel operations in the core area of the RBY were claimed to be more sustainable, minimizing ecological impacts and adopting advanced new technologies [32,33,34]. In the Environmental Impact Assessment approved by the Ecuadorian Environmental Ministry (MAE), oil operations in this highly biologically and culturally sensitive area are framed in respect to many international agreements and protocols and environmental legislation such as the Convention of the Biological Diversity (CBD, 1995), the Kyoto Protocol (1994), the International Labour Organization 169 Convention (1991) and the UNESCO agreement on Cultural and Natural Heritage, while, at the same time, avoiding impacting practice such as gas flaring. [35].

1.2. Unburnable Carbon and Unleakable Gas Flaring

Reduction of fossil fuel production and climate change are undoubtedly the biggest challenges that Science and Society must face in the era of the Anthropocene. To avoid critical changes in the Earth System, approximately 30% of oil, 50% of natural gas and 80% of coal global reserves should remain “locked” underground. Such an estimated amount of fossil fuels is required to keep global warming below 2 °C within 2050, referred to as pre-industrial temperatures [36,37,38]. However, based on a more recent climate change assessment at the 48th Intergovernmental Panel on Climate Changesession [39], Conference of the Parties24 (Katowice, Poland) re-set the global warming targets to a limit of 1.5 °C within 2035, highlighting, once again, the need to accomplish with drastic reductions in greenhouse gases (GHG) emissions and to find sustainable alternative pathways to new fossil fuel development at national and international levels [40]. Through the combination of the “yasunization” concept with the quantitative estimation of fossil fuel reserves that should remain underground, the ecological economic concept of “unburnable carbon” (or “unburnable fossil fuel”) was recently introduced in the scientific and international debate about climatic-energy policies. It refers to the global amount of fossil carbon that must remain unburnable, introducing a policy relevant paradigm to discuss climate change mitigation and compensation strategies related to fossil fuel reserves to be kept underground [41,42,43].
Within the global amount of unburnable carbon, the uncombusted carbon-based GHG such as CH4 and CO2 associated with the extraction, distribution and consumption of fossil fuel reserves are not taken into account. Hendrick et al. (2016) defined such uncombusted gases as “unleakable carbon”, referring to ‘fugitive’, ‘leaked’, ‘vented’, ‘flared’, or ‘unintended’ GHG emissions [42]. The role of the unleakable carbon in global warming is crucial: as demonstrated, CH4 has a global warming potential 86 times greater than CO2 over a 20 year time horizon, making it one of the most powerful GHGs [44]. Gas flaring is an irrational industrial practice that consists of burning waste gases on site, mostly CH4, along with fossil fuel extraction and energy production processes. It is diffused worldwide, particularly in developing countries, where oil companies do not invest in infrastructures to capture, store and re-use gas from fossil fuel extraction. With over 140 BCM of flared gas globally every year, an amount sufficient to satisfy the energetic necessities for the whole African continent for the same period, this represents not only a huge leak of extracted fossil energy but also a relevant source of pollution, both at local and global scales [45,46]. In fact, it is a significant source of GHG, contributing approximately 350 Mt CO2 emissions worldwide and it accounts for approximately 1% of global warming due to anthropogenic emissions [47,48]. Moreover, the Global Emission Inventory estimates that flaring emits 4% of global black carbon emissions, at 230 Gg yr−1—three times more than on-road gasoline vehicles (80 Gg yr−1) [49].
Despite several international calls promoted within the World Bank’s Global Gas Flaring Reduction initiative [50], such as the “Zero Routine Flaring by 2030” Initiative [51], the volume of gas flared annually seems to be stabilized on a plateau at approximately 140 BCM [52,53].
If, on one hand, the quantitative estimation mainly based on geological and economic criteria is even more consolidated, the spatial and geographical dimension of potential unburnable carbon areas is still an open issue. Codato et al. [11] argued the urgent need to define and to adopt geographical criteria within the environmental policies for identifying unburnable carbon areas, starting from high biologically and culturally sensitive regions in the world, which are affected by socio-environmental impacts of fossil energy production. Geographical criteria should be firstly based on spatial analyses of overlaps among fossil fuel operations, biodiversity conservation projects and human rights protection [11,54].

1.3. Remote Sensing to Monitor Gas Flaring in the World

Generally, information and data about gas flaring (position, volumes and chemical composition, burning efficiency) are critical. They are mainly provided only by fossil fuel companies, with lack of direct measurements, standardized procedures and third-party control. Moreover, in some countries there is a lack of public reports or data inaccuracies due to wrong assumptions for estimating combustion efficiencies [46,52,55]. However, international policies and agreements, the increasing global awareness of GHG emissions and socio-environmental impacts of gas flaring have made remote sensing technologies together with open satellite data a powerful tool for monitoring gas flaring activities and their impacts worldwide: from mapping out new flare sites, to assessing and estimating volumes of flared gas.
In the past, gas flares have been detected in satellite imaging for decades: the widest archive of images is collected by the Operational Linescan System (OLS), operated by the U.S. Air Force Defense Meteorological Satellite Program (DMSP). Different techniques such as Landsat Flare Detection Method (LFDM), derived from nighttime thermal imagery from moderate-resolution imaging spectroradiometer (MODIS), were used to detect and to estimate flare gas in oil production area of Nigeria [56]. A MODIS-based method called robust satellite techniques (RST) was adopted for the Niger Delta region and in an individual flaring site in Italy by Faruolo et al. (2014; 2018); MODIS-based regression models for flared volume estimation between satellite data and oil company reports showed good levels of accuracy [55,57]. A study based on Landsat 8 using daytime data was performed in Canada [58].
In 2009, Elvidge et al. built, the first worldwide dataset of gas flaring activities over a long period, using night-time imagery from the DSMP and Google Earth for detection confirmation [52].After that, many studies attempted to employ different kinds of satellite data to monitor gas flaring activities and, sometimes, model their emissions and the related impacts [59,60,61].
Elvidge et al. also developed a method that uses night-time low-resolution (750 m) imagery from the Visible Infrared Imaging Radiometer Suite (VIIRS), analyzed with a multiband fixed threshold algorithm based on shortwave infrared channels called Nightfire, which permits extrapolation of much information [62]. In this way, they created annual databases on global gas flaring freely available online which have been employed as source of data, both for the comparison with different methods and for the investigation of potential impacts [63,64,65].
Recently, Caisero et al. (2018, 2019) successfully adapted the VIIRS Nightfire algorithm to the observations of the Sea and Land Surface Temperature Radiometer (SLSTR) on board of the Copernicus satellite Sentinel-3A, increasing the opportunity to use remote sensing to monitor gas flaring [60,66].

1.4. Geographical Framework: The Ecuadorian Amazon Region and the Yasuni Biosphere Reserve

The study area encompasses the whole EAR, from the piedmont of Andean range to lowlands of the Amazon rainforest, with a special focus on the Yasuní Biosphere Reserve (YBR). The EAR is part of the Western Amazon, a global biodiversity hotspot that hosts most of the Amazonian biodiversity [24,67,68,69,70,71,72]. The EAR is 45% of the Ecuadorian territory, it extends for 116,588 km2, including the Province of Napo (10.7% of RAE), Sucumbíos (15.5%), Orellana (18.6%), Pastaza (25.4%), Morona Santiago (20.6%) and Zamora Chinchipe (9,1%). In total, 70% of the EAR surface is divided by oil concessions (oil blocks) for fossil fuel exploration and production (Figure 1) [3].
The YBR was instituted by the UNESCO Man and Biosphere Program (MAB) in 1989 [73] in order to protect both the exceptional biological diversity and the indigenous populations [67,71,72]. MAB protocols aim to integrate biodiversity conservation, sustainable development and scientific research through a geographic zonation, according to different degrees of protection. As stated by MAB protocols, the importance of the Biosphere Reserve zonation model is paramount to ensure “conservation, sustainable use of resources and knowledge generation through integrated zonation and collaborative management”. The first important zone is the Core Area which justifies the creation of the Biosphere Reserve and defines the highest level of protection. It is a “securely protected sites for conserving biological diversity, monitoring minimally disturbed ecosystems and undertaking non-destructive research and other low-impact uses (such as education)”. Around the Core Area, there is the Buffer Zone which allows low-impact anthropic activities and ecological practices such as ecotourism and environmental education. The third degree of protection is represented by the Transition Area, which plays a central function in sustainable development and local community engagement [74].
In 2011, through the “Programa Yasuní” the zonation of YBR was established by the Ecuadorian Ministry of Environment (MAE), with the support of MDG’s funds. Hence, the RBY (27,700 km2) was geographically defined in the three MAB protection zones: Core Area (14,520 km2), the Buffer Zone (9,780 km2) and the Transition Area (3,400 km2) (Figure 1) [75].
Fossil fuel extraction impacts in the Western Amazon related to oil exploration, opening and building of roads in the primary tropical forest, and contamination due to oil spills or wastewater management are well documented and assessed, both on ecological and human systems [13,15,76,77,78,79,80]. These include, but are not only limited to: contamination of water, air and soil, with consequent effects on biodiversity and indigenous health [14,16,17,81,82,83,84,85], deforestation and disturbance on fauna, which cause habitat loss and animal migration [14,16,17,83,84,85]. Additionally, there is a pendent lawsuit since 1993 for the extensive damages due to the extensive contamination produced from the extractive company Texaco (actually Chevron-Texaco) in the Northern part of the EAR [83].
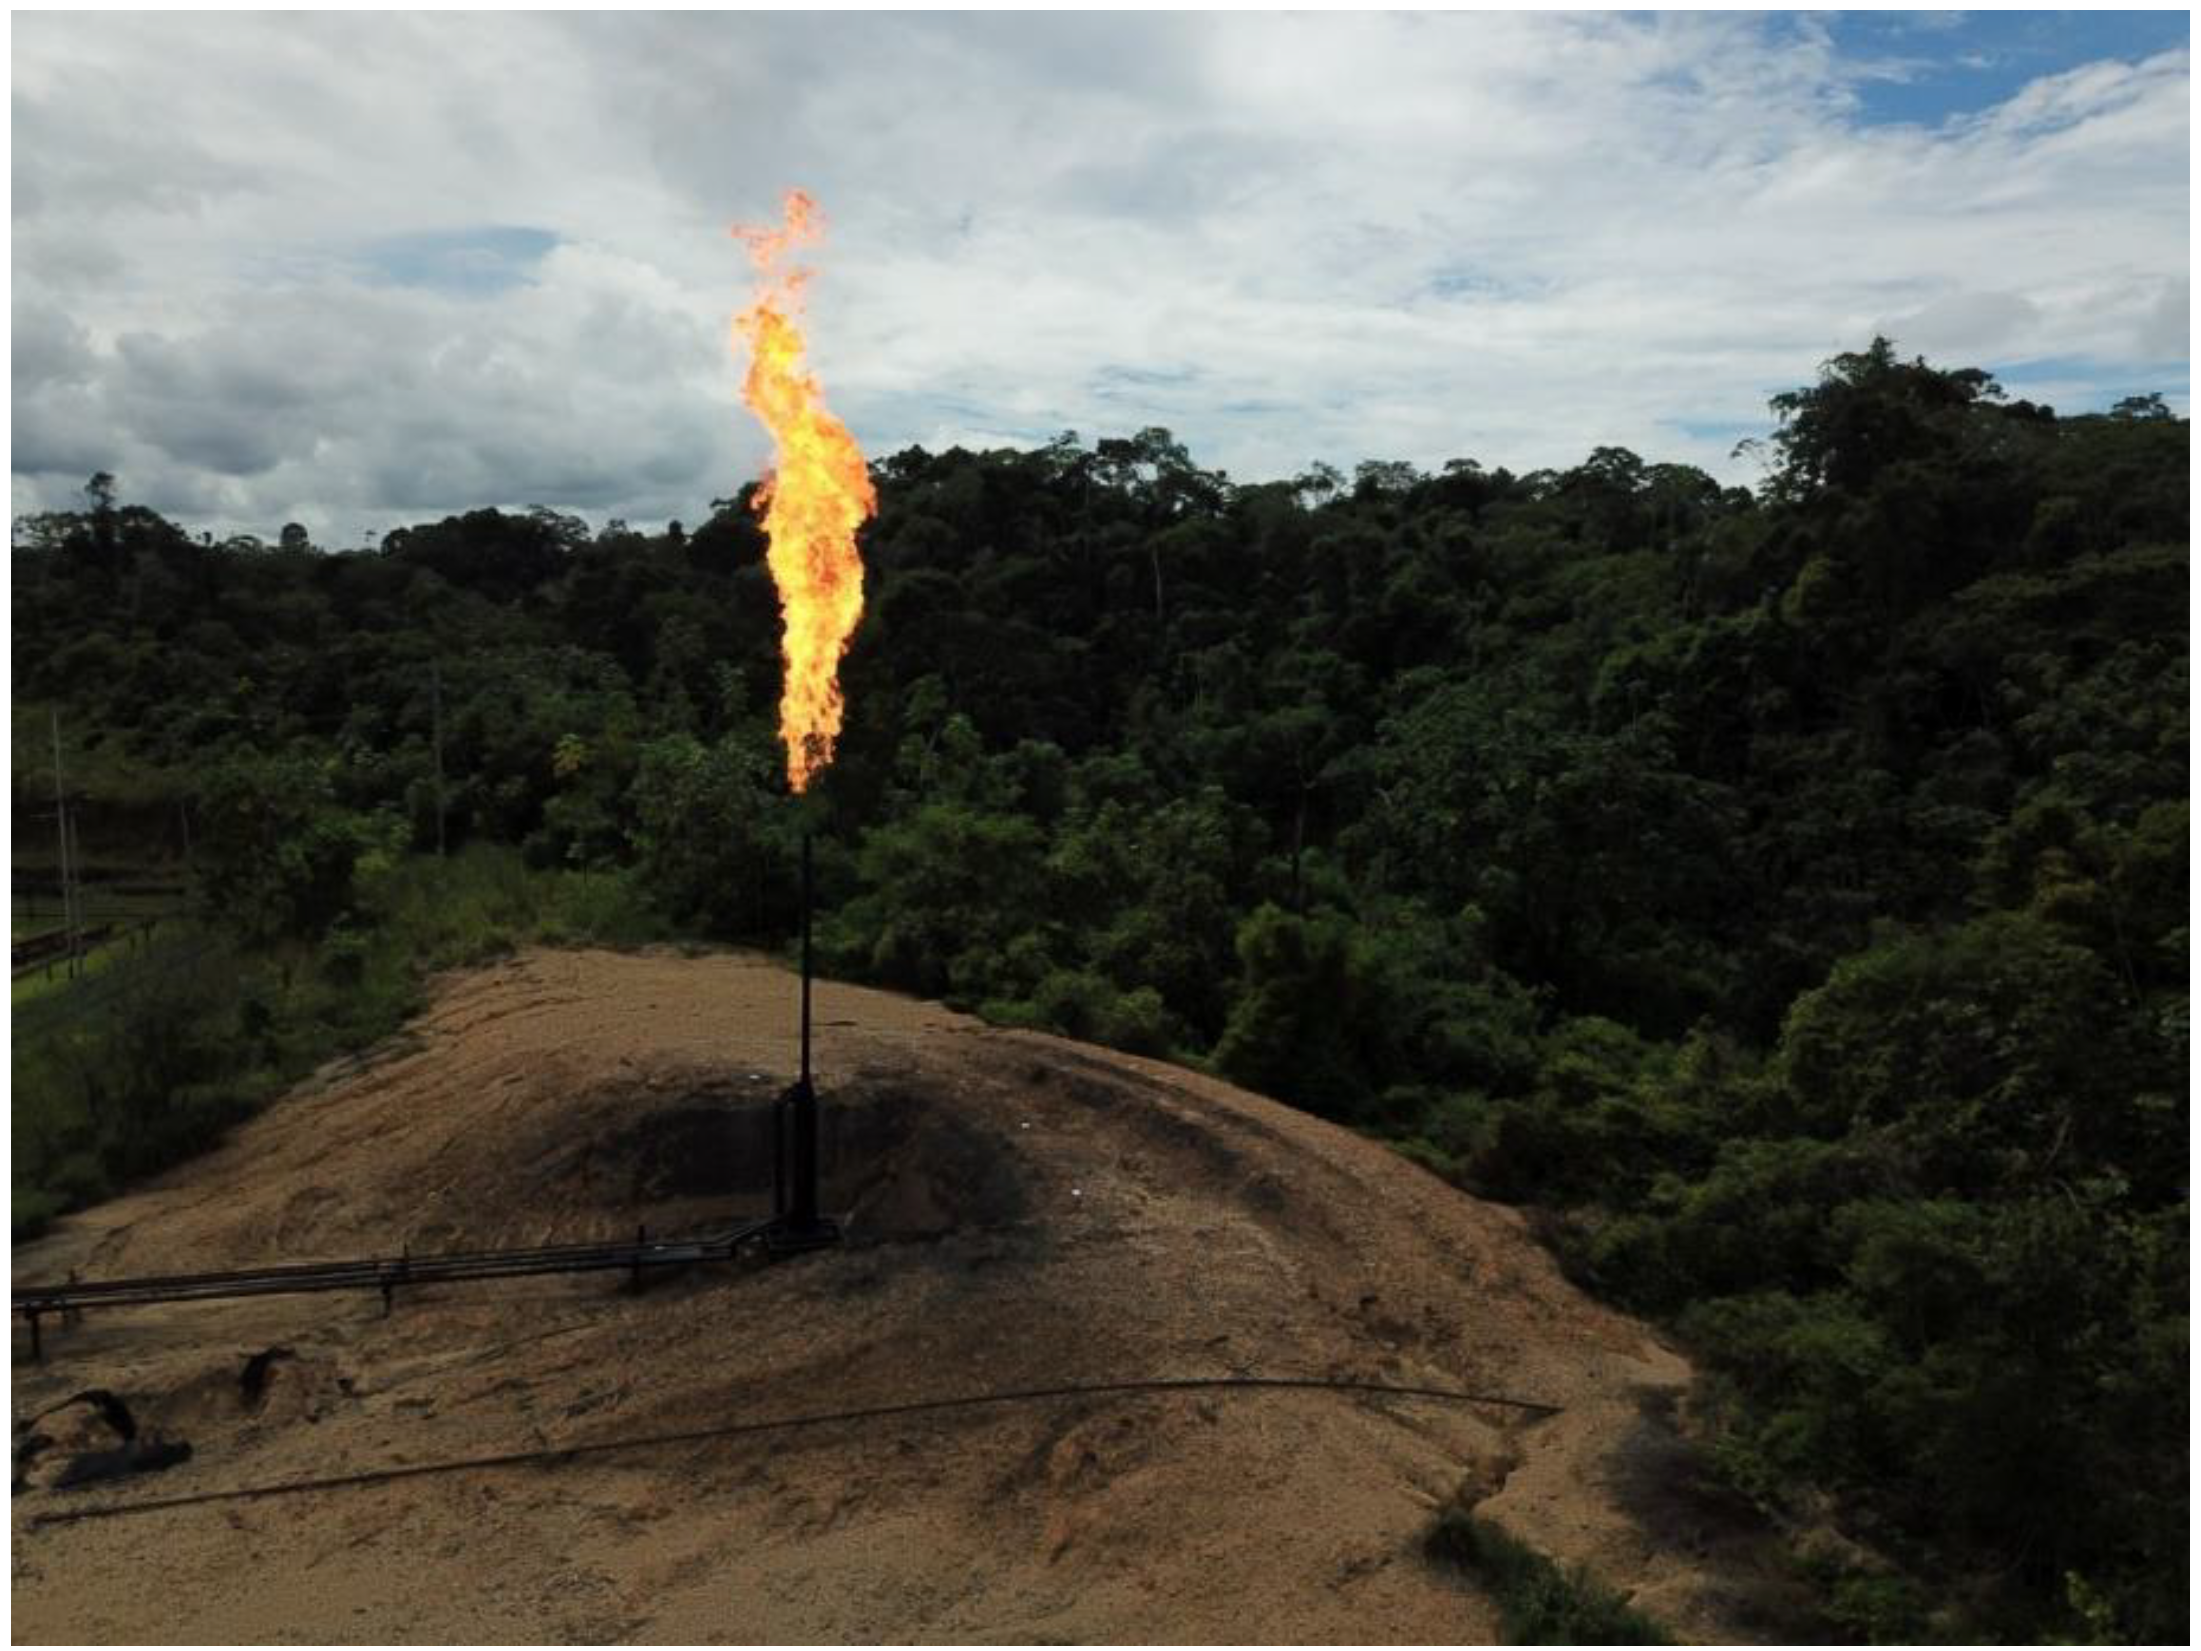
In the area, gas flaring has been a widely diffused practice for several decades (Figure 2) [86], especially in the Amazonian provinces of Sucumbíos and Orellana, where spatial distribution and volumes of flared gas have not yet been deeply investigated. The only estimates of this phenomenon were made from Durango-Cordero et al. but are not adequate for the assessment of the current situation, as the dataset is updated to 2012 [87]. We took into account all gas flaring sites in the EAR, including also mid-stream sites [87], which are classified by Eldvidge et al. 2012 as downstream flare stacks [88]. A typical gas flaring related to oil production in the EAR is represented in Figure 2 (Auca oil field).

1.5. Aims of the Study

The general aim is to use open satellite data to monitor gas flaring activities in the Amazonian Region of Ecuador, and the implementation of more sustainable technologies and policies in remote areas, characterized by very high ecological and cultural diversity. The specific aims are: i) to identify and estimate gas flaring activities over seven years (2012–2018); ii) to map new gas flaring sites; iii) to estimate potentially affected areas among ecosystems and local communities. The fourth aim of this work intends to focus on the geographical and policy dimension of gas flaring in relation with the places in which fossil fuel are extracted, an area of research that needs further expansion.

2. Materials and Methods

2.1. Territorial Data Collection

A spatial dataset of vector shapefiles of the main geographical features was acquired from public national geoportals and institutions. Specifically, we used geospatial data about ecosystems, oil fields and the Yasuní Biosphere Reserve, acquired from the Ecuadorian Ministry of Environment (MAE) [89]. Data includes streets, administrative boundaries, indigenous communities, schools, oil blocks and cities acquired from the geoportal of the Geographical Military Institute (IGM Ecuador) [90]. A preliminary geographical analysis of the Amazonian territory was therefore performed in order to frame the spatial relationships among ecosystems, oil production and human settlements.

2.2. Socio-Environmental Impacts and Metrics for Potential Impacts on Ecosystems and Local Communities

Direct and indirect impacts of gas flaring on ecosystems and human life are related to various factors: chemical emissions, extreme heat islands, light and noise. Beyond GHG, chemical emissions include many pollutants such as sour gas with H2S and SO2, volatile organic compounds (VOCs,) Polycyclic Aromatic Hydrocarbons, NOX and soot (black carbon). As known, all of them play crucial roles in the Earth climatic processes [45,91]. Moreover, VOCs such as benzopyrene, benzene, carbon disulfide, carbonyl sulfide and toluene are among the 250 identified toxins, including carcinogens, which are released in the process. Depending on flare height, volume flared and operation mode, gas flaring may diversely affect both ecosystems and local communities. Impacts on the environment are mainly related to local extreme temperature anomalies and chemical pollution, which directly and indirectly affect soil systems, surface and shallow water and biodiversity, with effects at different distances from the gas flaring source [45,46,91,92].
According to distance from the source, the heat island produced by the flared gas is a key driver of soil degradation processes, causing burnout of organic matter and, consequently, affecting soil flora and fauna [93]. Additionally, it releases in the air substances as H2S, NO2 and SO2, which react with water, causing acid rains [46,94]. Moreover, alteration of microclimatic conditions can directly affect agroecosystems and local communities, as reported in an experimental study case in the Niger Delta: around Ovade flare site, maize yields decreased by 76.4%, 70% and 58% at 500 m, 1 km and 2 km, respectively [95].
In order to assess sensible sites potentially threatened from ongoing gas flaring activities, we firstly determined potentially affected areas using fixed distance buffers from the sources of pollution, represented by the ongoing active flare sites (See Section 2.4); secondly, we investigated sensible sites (specifically ecosystems, YBR areas, indigenous communities, schools and cities) adopting data mentioned in Section 2.1. The sensible areas were divided into sites with environmental impacts (ecosystems and YBR) and sites with social impacts (indigenous communities, schools and cities). Thus, a bibliographic survey about socio-environmental impacts was performed in order to analyses and select metrics distances. The results sorted on the basis of the target (humans or environment) are summarized in Table 1.
Unfortunately, there is a lack of scientific data reporting gas flaring impacts in the Amazon rainforest. Moreover, depending on different characteristics on the flare stacks, the geographical context and the examined parameter, there is high variability in the metric distances for socio-environmental impacts. Hence, we decided to perform different scenario simulations using both the maximum and the minimum distances to model a precautional and a conservative potential assessment. According to different studies (Table 1), the resulting distances were 5000 and 650 m for human settlements and 2000 and 650 m for ecosystems

2.3. NOAA Nightfire for the Detection of Gas Flaring

We analyzed and validated the dataset provided by the Earth Observation Group (NOAA) of the National Centre for Environmental Information of United States, using the annual dataset from 2012 to 2018, and daily detections. The annual dataset is derived from the modelling of satellite images based on the Nightfire algorithm from the Visible Infrared Imaging Radiometer Suite (VIIRS), carried on the Suomi National Polar orbiting Partnership (Suomi-NPP) satellite, launched in October 2011 from the NOAA [63,102].
The NOAA dataset we used is represented by open data, updated daily, and based on:
  • An annual dataset, which includes confirmed gas flaring sites from 2012 to 2018 and, for each flare, a data report of average temperature, amount of flared gas, number of usable images without cloud coverage (clear observations), and detection frequency. The included sites are extracted from daily detections using as discriminants: i) the number of detections in a 15 arc second grid, eliminating single and double detections; ii) if the estimation of the temperature was possible; iii) where temperature estimation was not possible, proximity to other flare sites and Google Earth Pro validation;
  • Daily detections, which include all the sites where values above the threshold were found in the M10 band (Shortwave Infrared, 1.58 μm–1.64 μm). Estimations about temperature, radiative heat intensity, volumes of flared gas (under standard conditions) and derived parameters are provided [103,104].

2.4. Daily Detection Data Processing for Near Real-Time Monitoring of Gas Flaring Activities

In order to identify new gas flaring sites, we also processed daily detection data from 01/01/2017 to 15/04/2019. All the spatial analyses and scenario simulations were performed in an open source GIS environment (QGIS software, Version 3.4 Madeira). The whole workflow showing the main functions and geo-processes is summarized in Figure 3.
The daily detection data were firstly clustered (Element 2 in Figure 3), setting 3 as the minimum size and 423 m as the radius maximum distance. We selected values based on:
  • The minimum number of repeated detections that Elvidge et al. need in order to identify a site as a gas flaring site [63];
  • The centroid of a VIIRS pixel [63], and thus we calculated the radius of a circle with the same area of a VIIRS pixel at nadir (750 m).
The resulting cloud point vector file was processed by a kernel density function in order to obtain a 25 m resolution raster layer representative of differences in the density of the point clusters (Element 3 in Figure 3). The radius used was 423 m, and the kernel shape was quartic. The latter was chosen because it offered a good compromise between decadence at the edges, allowing separation of different clusters and width of the decay curve, so maintaining the consistency of the detection cluster.
Then, a local maximum extraction was performed on the heatmap (Element 4 in Figure 3). The obtained local maximum locations were then aggregated if they were at a distance <423 m between one another and then substituted with their centroids (Elements 5 and 6 in Figure 3).
Thereafter, a sampling of the detection clusters was made in order to correlate them to the nearest of the provisional locations. All centroids in a 423 m from sites included in the annual NOAA dataset were considered as duplicates and eliminated and substituted. (Elements 7 and 8 in Figure 3). The second field was adopted to filter all the centroids with a distance of <423 m. After the detection clustering, a merge of the remaining centroids and of the annual dataset as hubs were performed (Element 9 in Figure 3). The resulting detections were then filtered, taking only those nearer than 423 m to the centroids of the heatmap’s local maximum; hence, they were therefore used to calculate new centroids based on the detection clusters (Element 10 and 11 in Figure 3). Clusters with ≤ 2 detections were then excluded from the process (Element 12 in Figure 3). The remaining points were considered as the additional flare sites identified from the process (Element 13 in Figure 3) and merged with the sites of the annual dataset which were previously identified as active. It is important to note that, being the VIIRS geometrical resolution of 750 m, it is not possible to discriminate flares which are nearer than this distance. Therefore, we adopted the term “gas flaring sites” instead of “flares” or “gas flaring plants”. This can also suggest that the number of flares may be higher than the number of gas flaring sites detected.

2.5. Spatial Validation of Identified New Flare Sites

In order to assess the reliability of our method, we performed a cross validation process using high-resolution satellite imagery and ground truth GPS surveys to check additional gas flaring sites (Element 13 in Figure 3) as well as flares in annual datasets of 2012–2016 not included in 2017 and 2018, which had associated detections (Element 14 in Figure 3). Firstly, satellite imagery from Google Earth Pro (GEP) was adopted for preliminary screening of the identified sites, eliminating false signals due to two volcanoes and a swamp. Thus, these sites were not included in the validation process. The resulting gas flaring sites were considered as new gas flaring sites identified with our method and underwent the validation process. Therefore, all the remaining sites were checked through Google Earth Pro, reporting also the date of the available imagery and all cases of impossibility to adequately check the flare’s presence (e.g., low resolution or clouds). Thus, a ground truth spatial validation campaign was performed in the months of May and June 2019. For each site, GPS points and geo-referenced photos were collected (Element 15 in Figure 3). Alternatively, in cases with a lack of accessibility, Unmanned Aerial Vehicles were used to take georeferenced photos of the ongoing gas flaring activities and GPS position. An example is shown in Figure 2. Due to the lack of updated GEP images and the possible mistakes in photointerpretation, we also surveyed flaring sites that were not recorded as active by the satellite. Due to some limitations in terms of accessibility, we were not able to access all the sites identified by the elaboration of daily detections. In these cases, we considered them as present in case of positive response by photointerpretation. The resulting sites were then merged with the 2018 annual dataset from the NOAA and considered as currently active gas flaring sites (Element 16 in Figure 3).

3. Results and discussion

3.1. Gas Flaring Monitoring in the Ecuadorian Amazon Region over Seven Years (2012–2018)

Firstly, analysis of the annual dataset provided from the NOAA shows that almost all the gas flaring sites in Ecuador are located in the EAR. Only three upstream sites and one downstream site, accounting respectively for 11 and 80 million cubic meter (MCM) of flared gas in the whole period (on a total of 6888 MCM in 106 sites, meaning respectively 0.16% and 1.15%) are in other regions. Moreover, GIS analysis shows an increasing trend in flaring activities, with a rate of +17.2% over the last 7 years, which brings Ecuador from the 33rd position to the 28th among the gas flaring countries for the volumes of flared gas.
In the EAR, 102 gas flaring sites over the 7 years considered were identified; among them, 38 were active over all seven years with a total amount of flared gas of 6888 MCM.
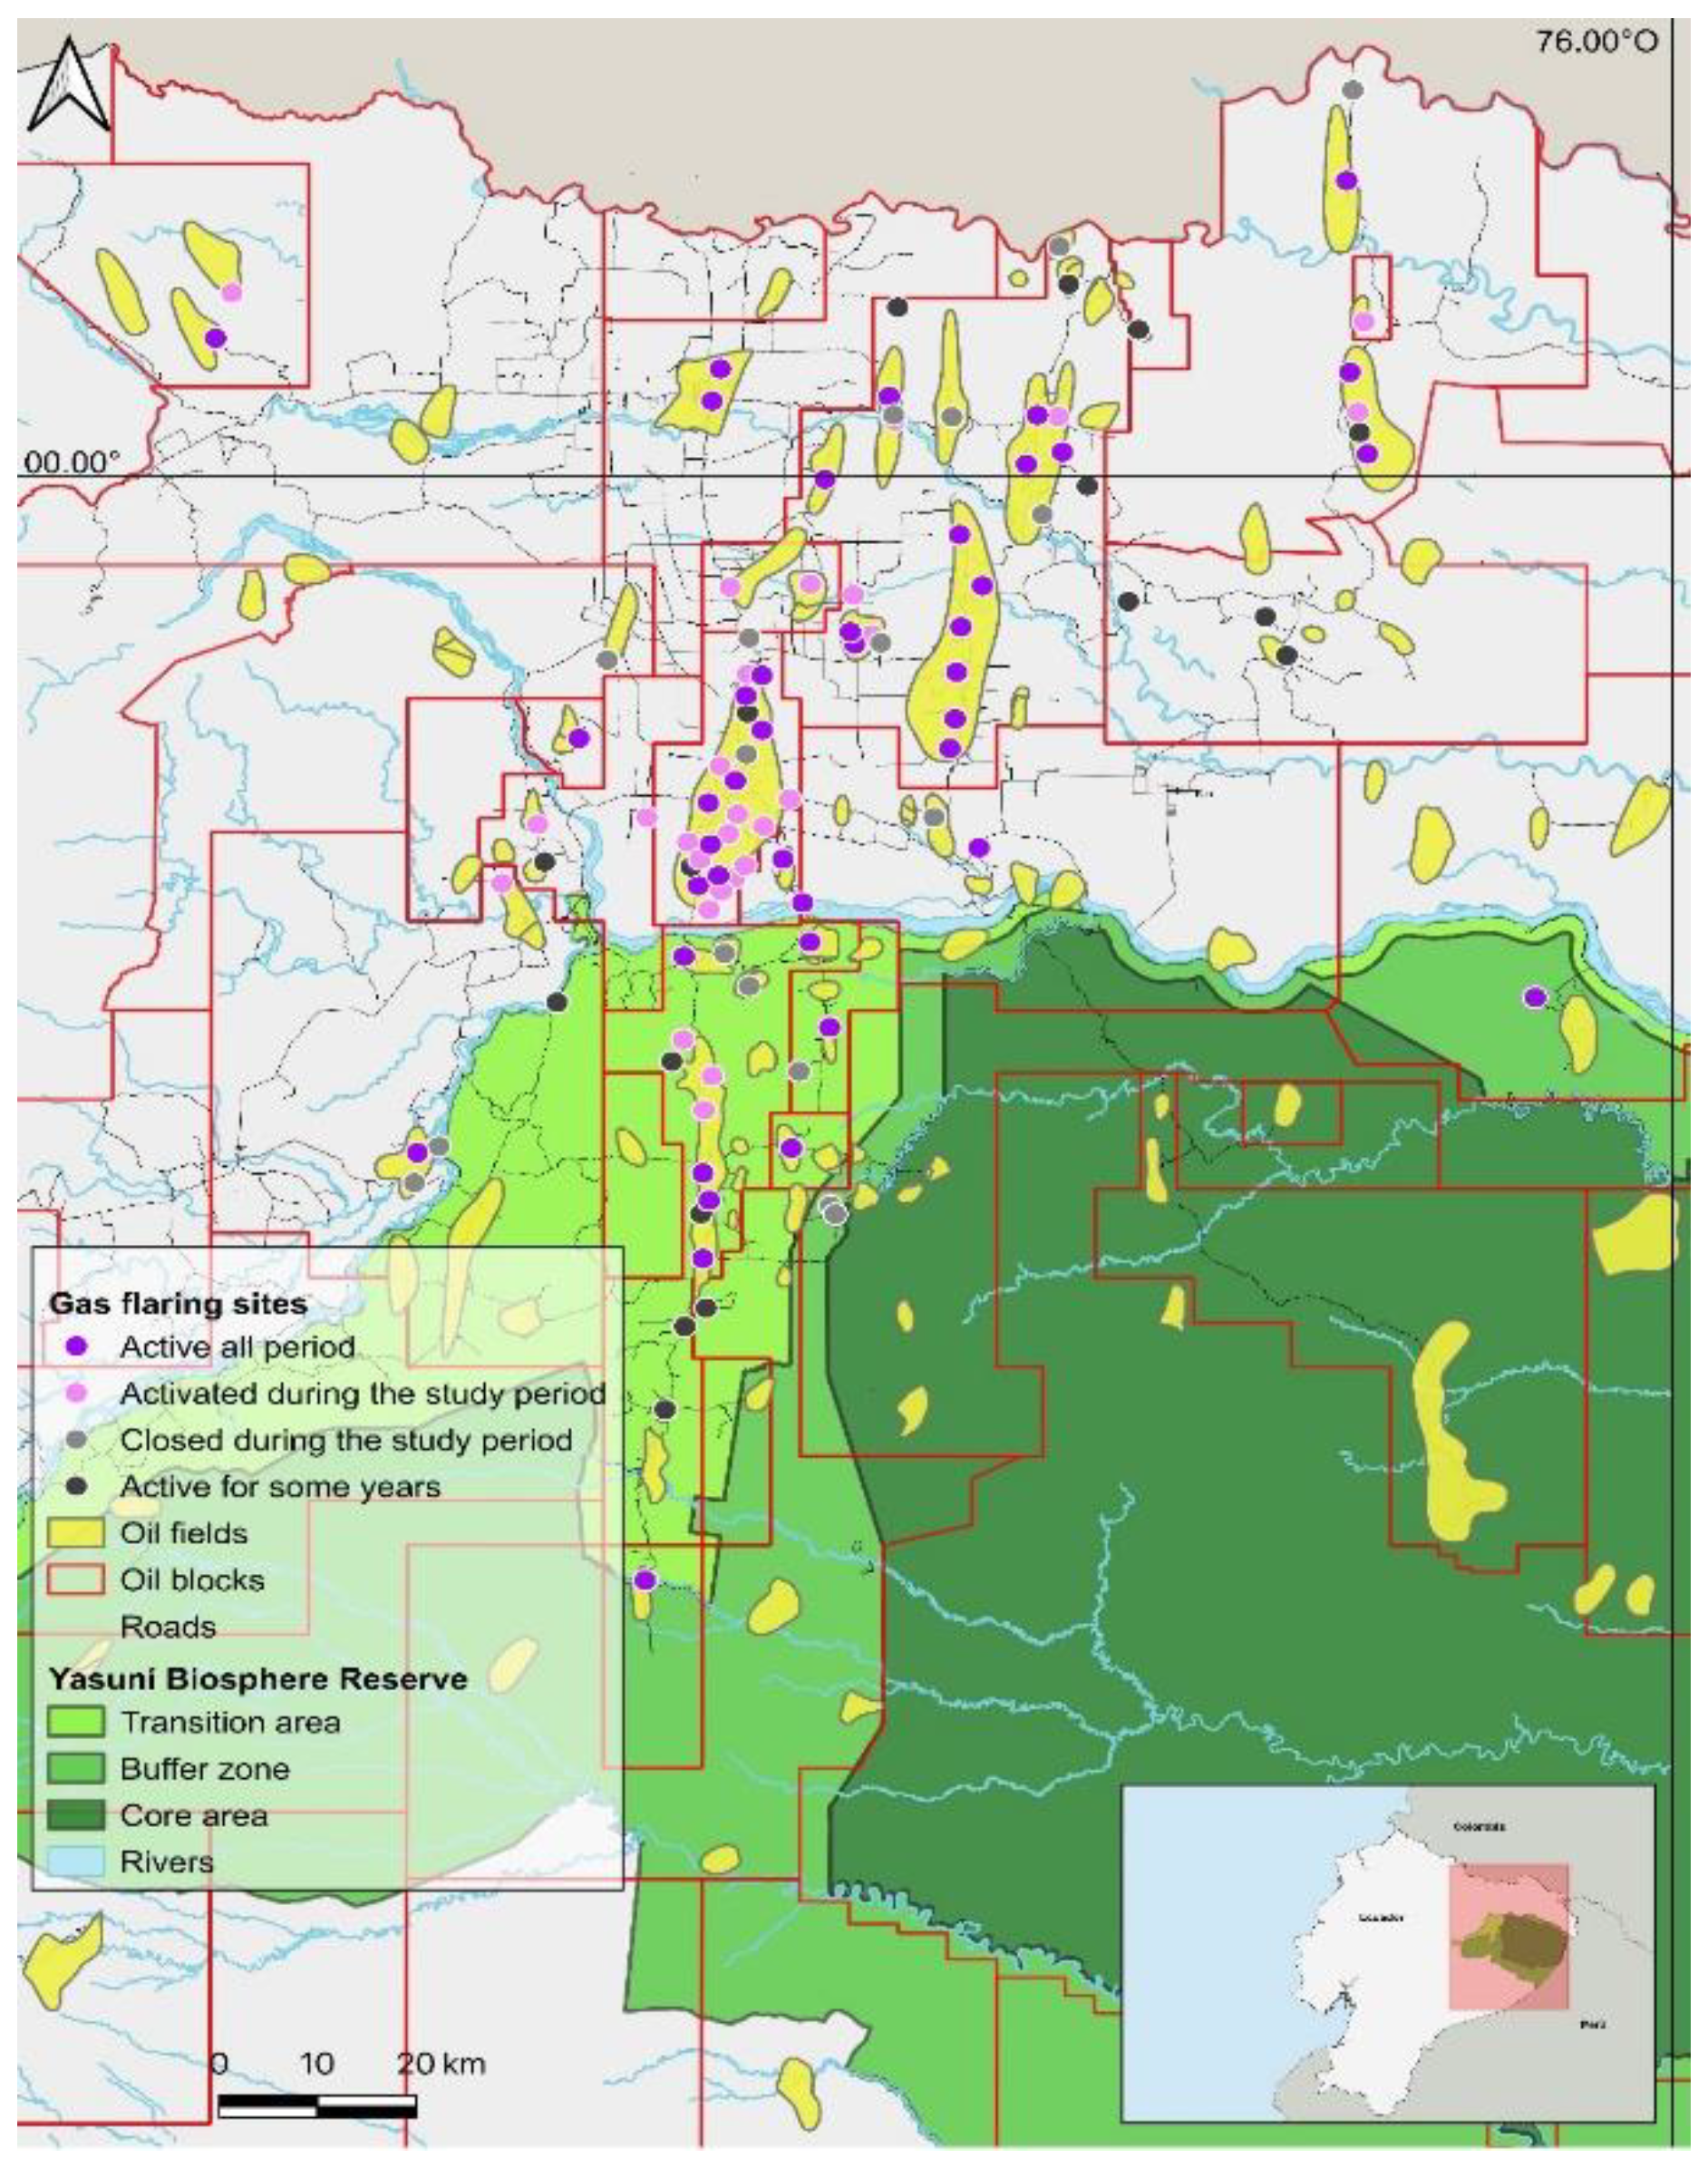
Moreover, we identified 34 new gas flaring sites, which contributes to an increase of +11.1% of the flared gas. Among them, one was classified from the data providers as a downstream site, with a total of 155 MCM of flared gas. According to previous works on gas flaring in the Amazonian context, we considered this site (the Shushufindi production plant, Orellana) as a mid-stream site and included it in the dataset [87]. Moreover, each year, sites without any activity detected in the previous year were considered as new activated gas flaring sites. Therefore, we identified, 54 new sites activated during the study period. Since 2013, these new activated gas flaring sites burned 1044 MCM of gas alone, representing 15.1% of the total flared gas in the EAR. During the study period, 44 flare sites were closed, not being included in the annual dataset in the years after their activation. Gas flaring estimation in the EAR is shown in Table 2, whereas Figure 4 shows all the identified gas flaring sites and their period of activity.
Data analysis shows that 23.5% of the flare sites are located in the YBR (24 of 102), and 18.4% of the flared gas sites (1268 of 6888 MCM) are located in the EAR. In particular, the Transition Area shows intense flaring activity, with the presence of 21 active sites during the study period. Moreover, this data shows three active gas flaring sites in the Buffer Zone, for a total of 369 MCM of flared gas. No site was detected in the Core Area. It is noteworthy that, similarly to the general EAR data, there is a peak in the number of the gas flaring sites in 2016, with an important decrease in 2017 and 2018. These variations may be due to changes in waste gas management by the operating company, causing the actual dismission of the flaring plant, or to meteorological conditions which allowed a clearer detection of the sites in 2016 than in other years. Despite the decrease in the gas flaring activities in this part of the reserve, this practice represents a critical issue for the UNESCO zoning of the Biosphere Reserves, which defines a Transition Area as “[...] the area of the reserve where the greatest activity is allowed, fostering economic and human development that is socio-culturally and ecologically sustainable” [105].
Gas flaring volume patterns are mainly composed of relatively small volumes of flared gas (the median is approximately 10 MCM in all the years), with bigger flares which become rarer for increasing flared gas amounts. In fact, the median values are nearer to the first quartile, than to the third, with four major gas flaring sites that in 2016 flared approximately 260 MCM—22% of the total EAR flared gas. Despite the increased overall volume of flared gas, there is a stable trend in the average amount of flared gas for each site, meaning that the incidence of new gas flare sites is coherent with the previous distribution (Figure 5a). The frequency distribution of the average flared volumes highlights the presence of five upper outliers. Among them, the Aguarico-3 oil well (Shushufindi oil field), with a mean of 60 MCM flared each year, abundantly exceeds the others (approximately 44 MCM). Figure 5b shows the distributions of the detections of individual gas flaring sites. The detections were defined multiplying the number of clear observations (the number of times the satellite passed above the site without clouds) by the detection frequency (percentage of clear observations in which the flare has been detected) as suggested from the data provider. It is noteworthy that in 2016, the year with the higher number of detected flares (See Table 3), there is the higher mean, third and fourth quartiles, meaning a higher number of detections for the gas flaring sites with intense activity. Further, in 2018, which shows an important diminution of gas flaring sites, there are the minimum values of both maximum detection number and third quartile and the highest median values for the distribution, meaning a minor number of detections also for the main gas flaring sites. This may suggest that lower numbers of gas flaring sites and lower volumes may be due to the meteorological conditions which influenced the detection process, in particular for smaller gas flaring sites. Gas flaring volume distribution and detections, on a yearly basis, are shown in Figure 5a,b.
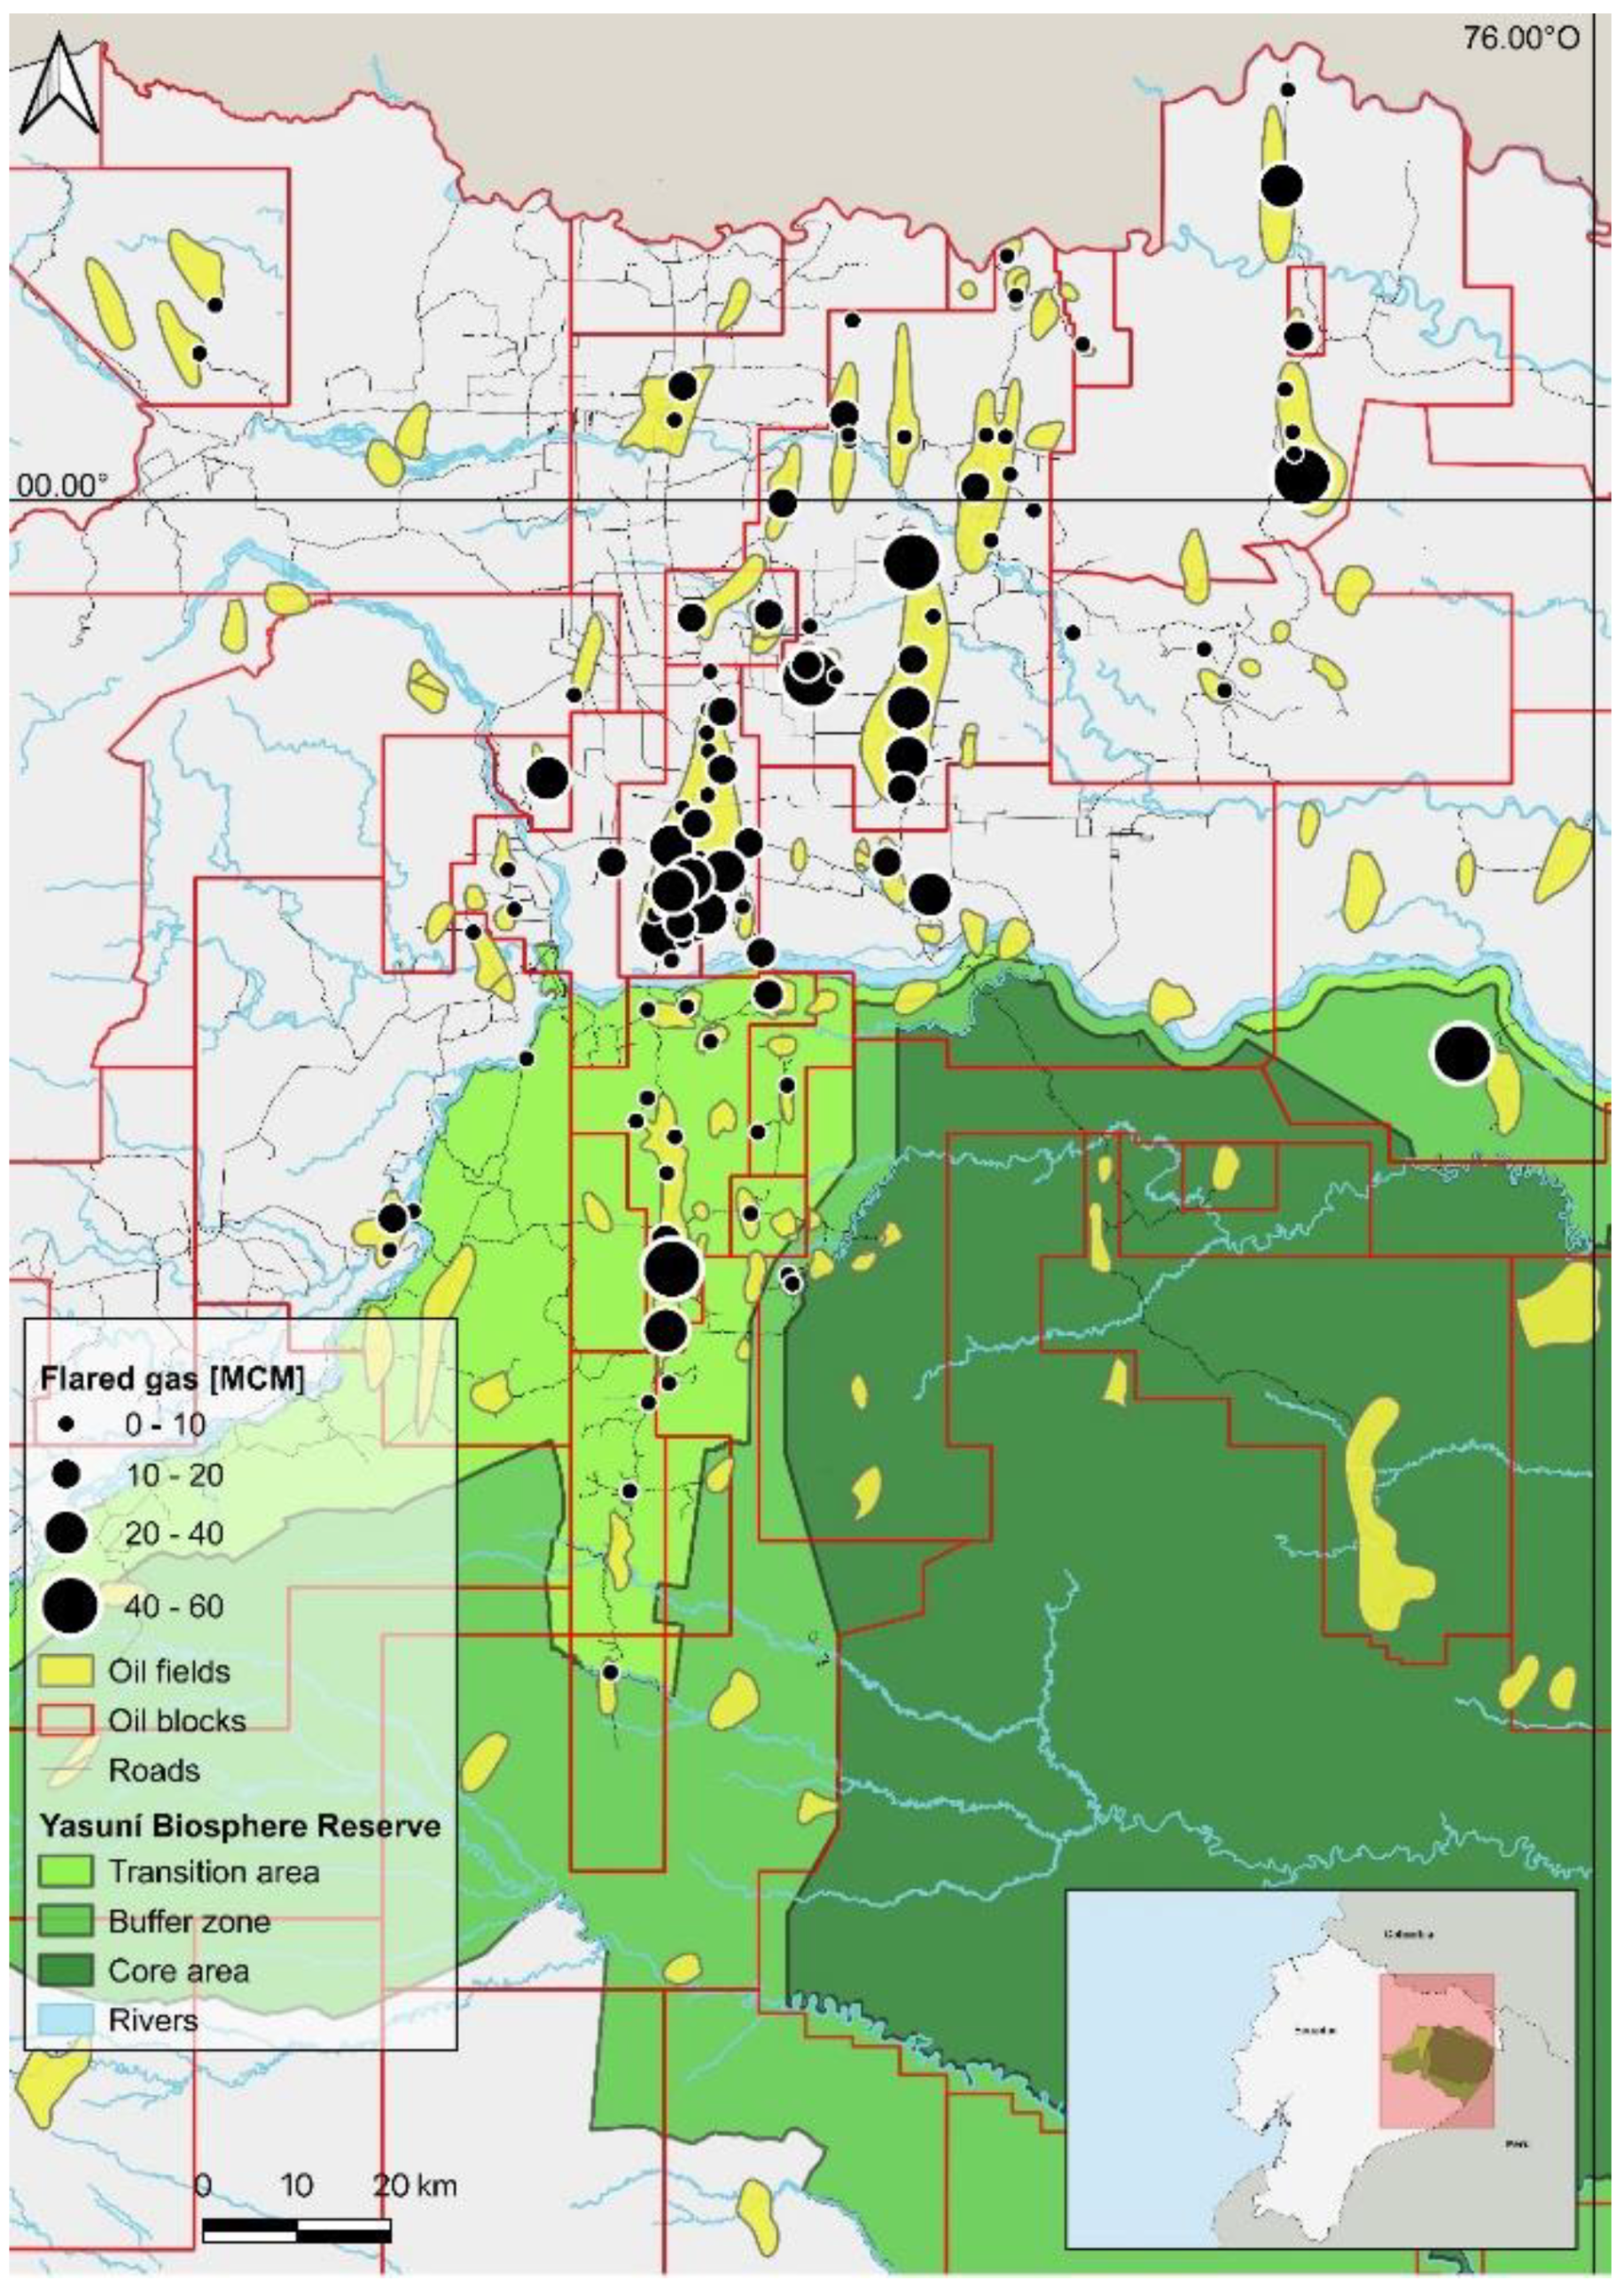
Two of the four major gas flaring sites of the EAR are located in the YBR—one in the Buffer Zone and the other in the Transition Area (see Figure 6). They are within the Yuturi (oil block 12) and Auca (oil block 61) oil fields, with more than 44 MCM of gas flared annually on average. The analysis of the flared gas volumes shows that these two main producers burned between a one-third and 50% of the gas flared in the YBR, whereas the other half is flared in smaller gas flaring sites, concentrated mainly along the “Via Auca”, with an average combustion of between 1 and 30 MCM.

3.2. Geospatial Analysis of Currently Active Gas Flaring Sites

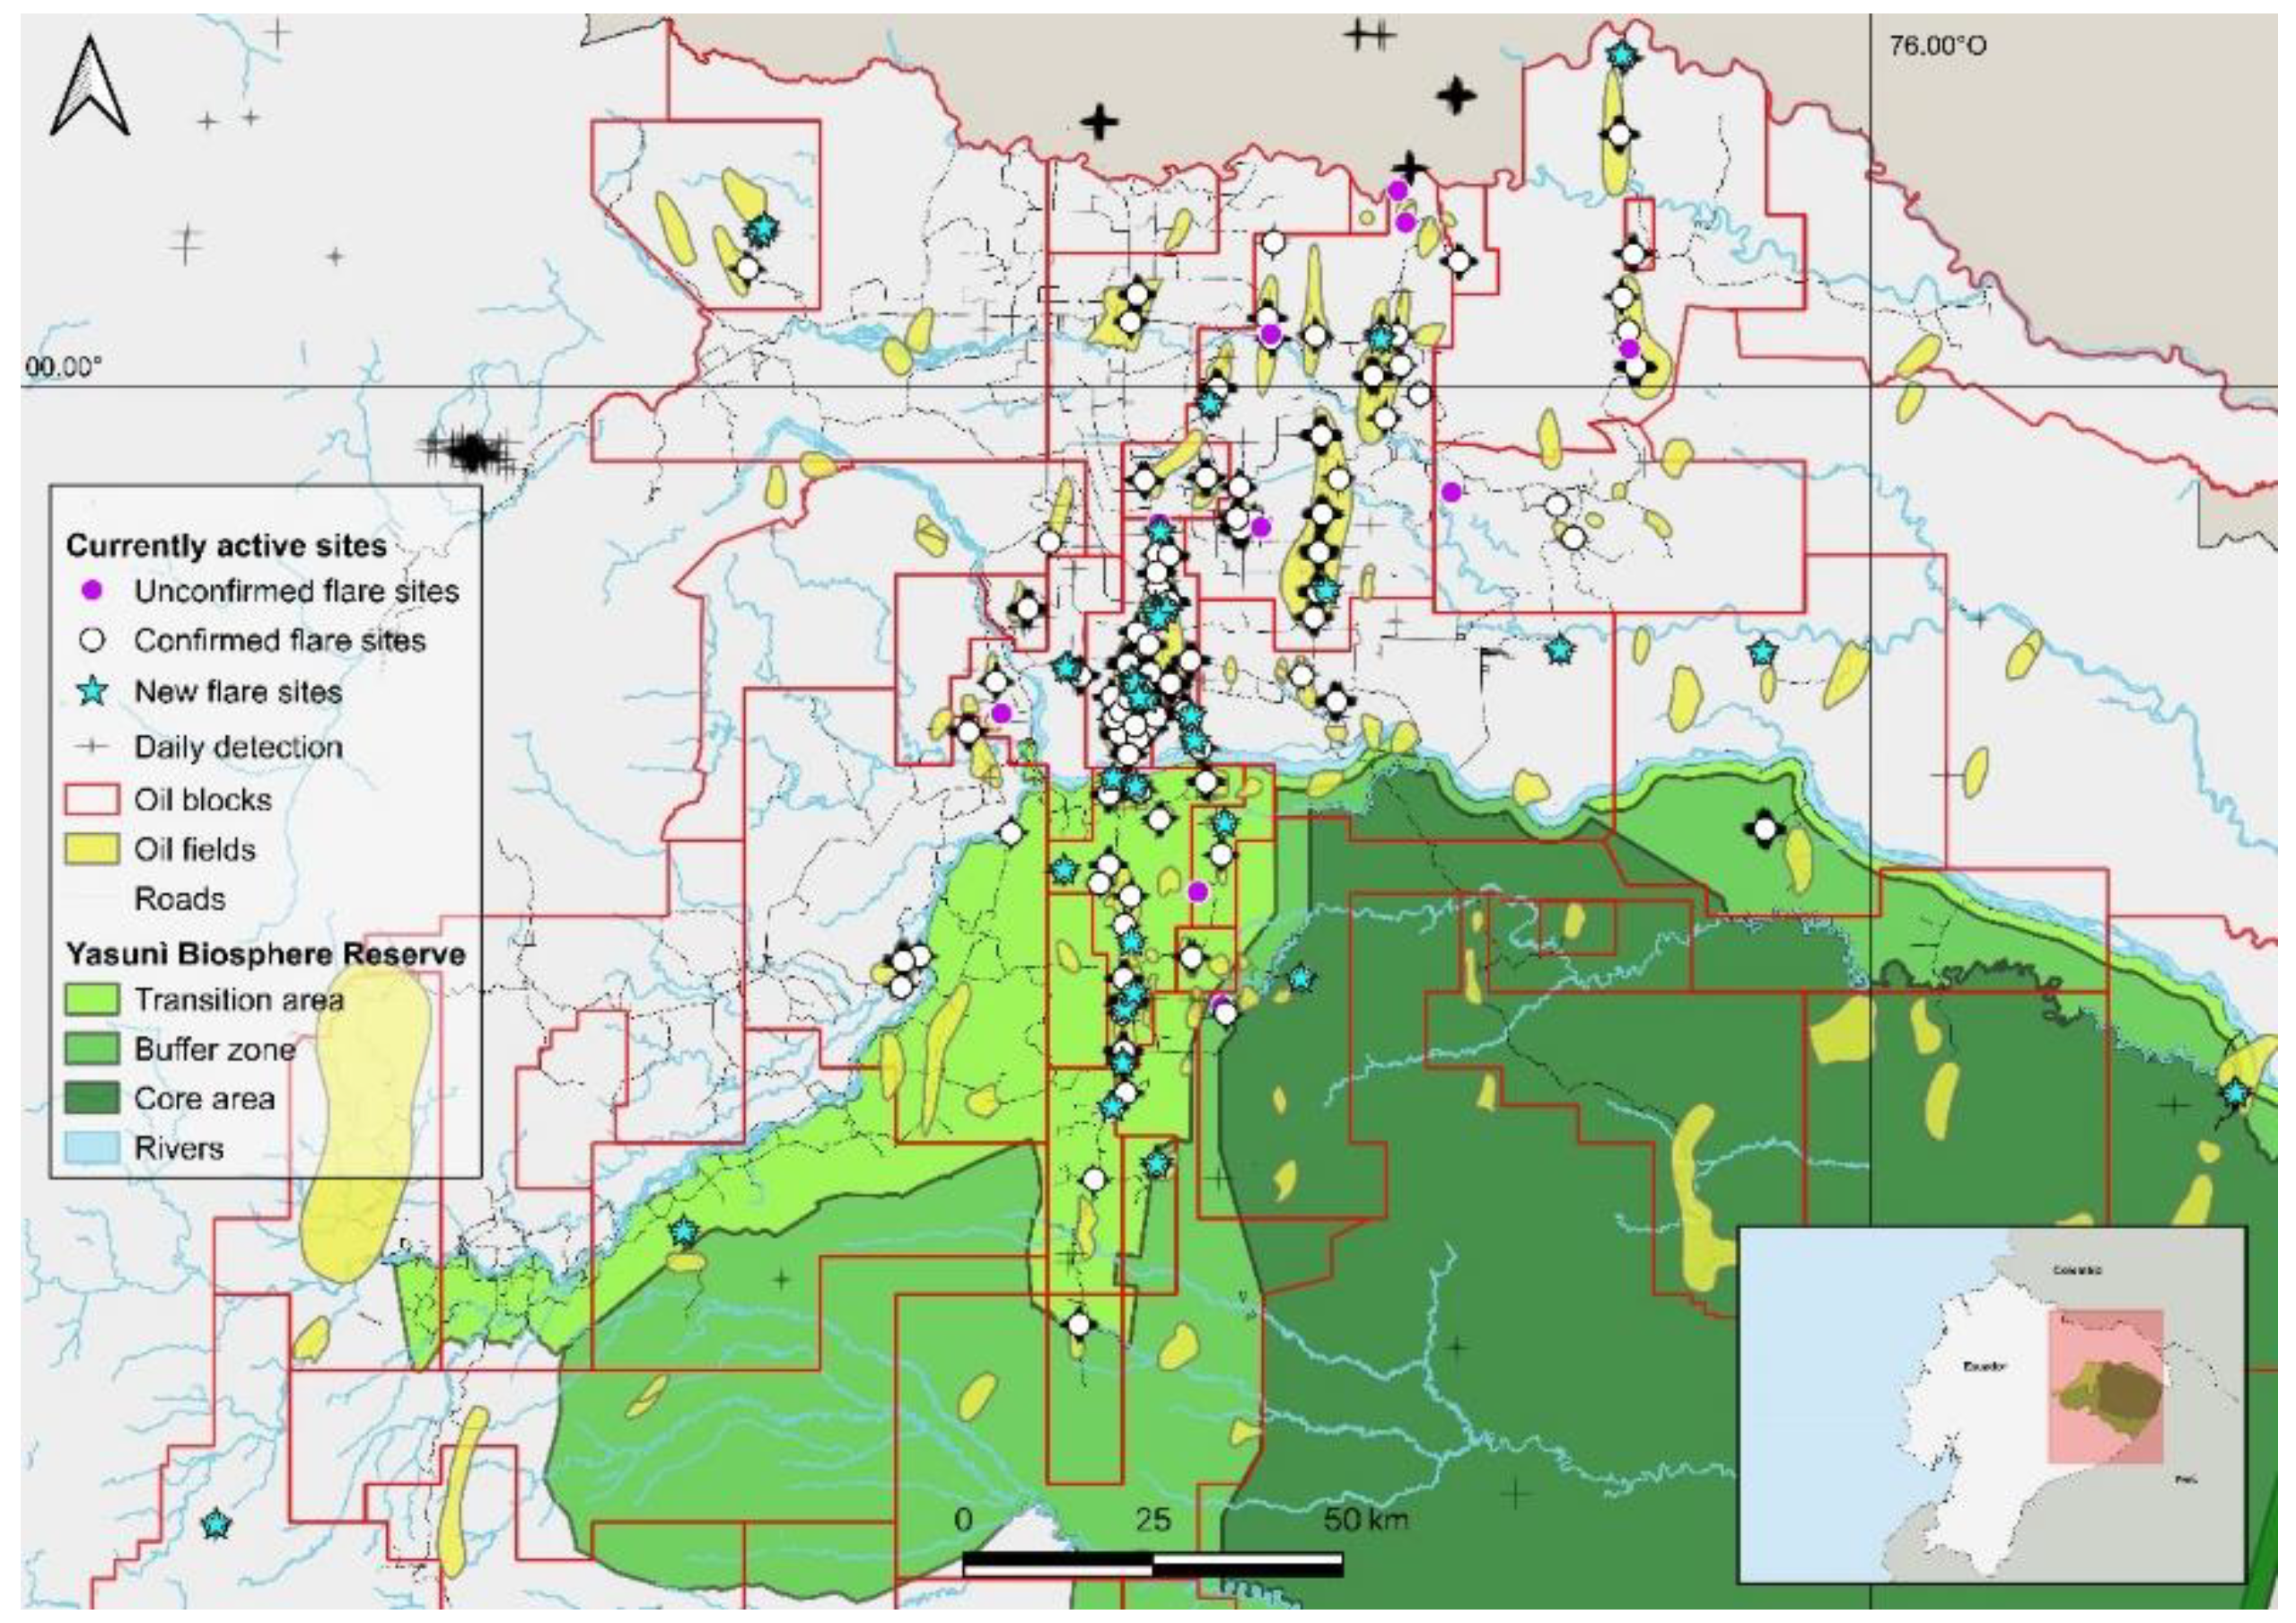
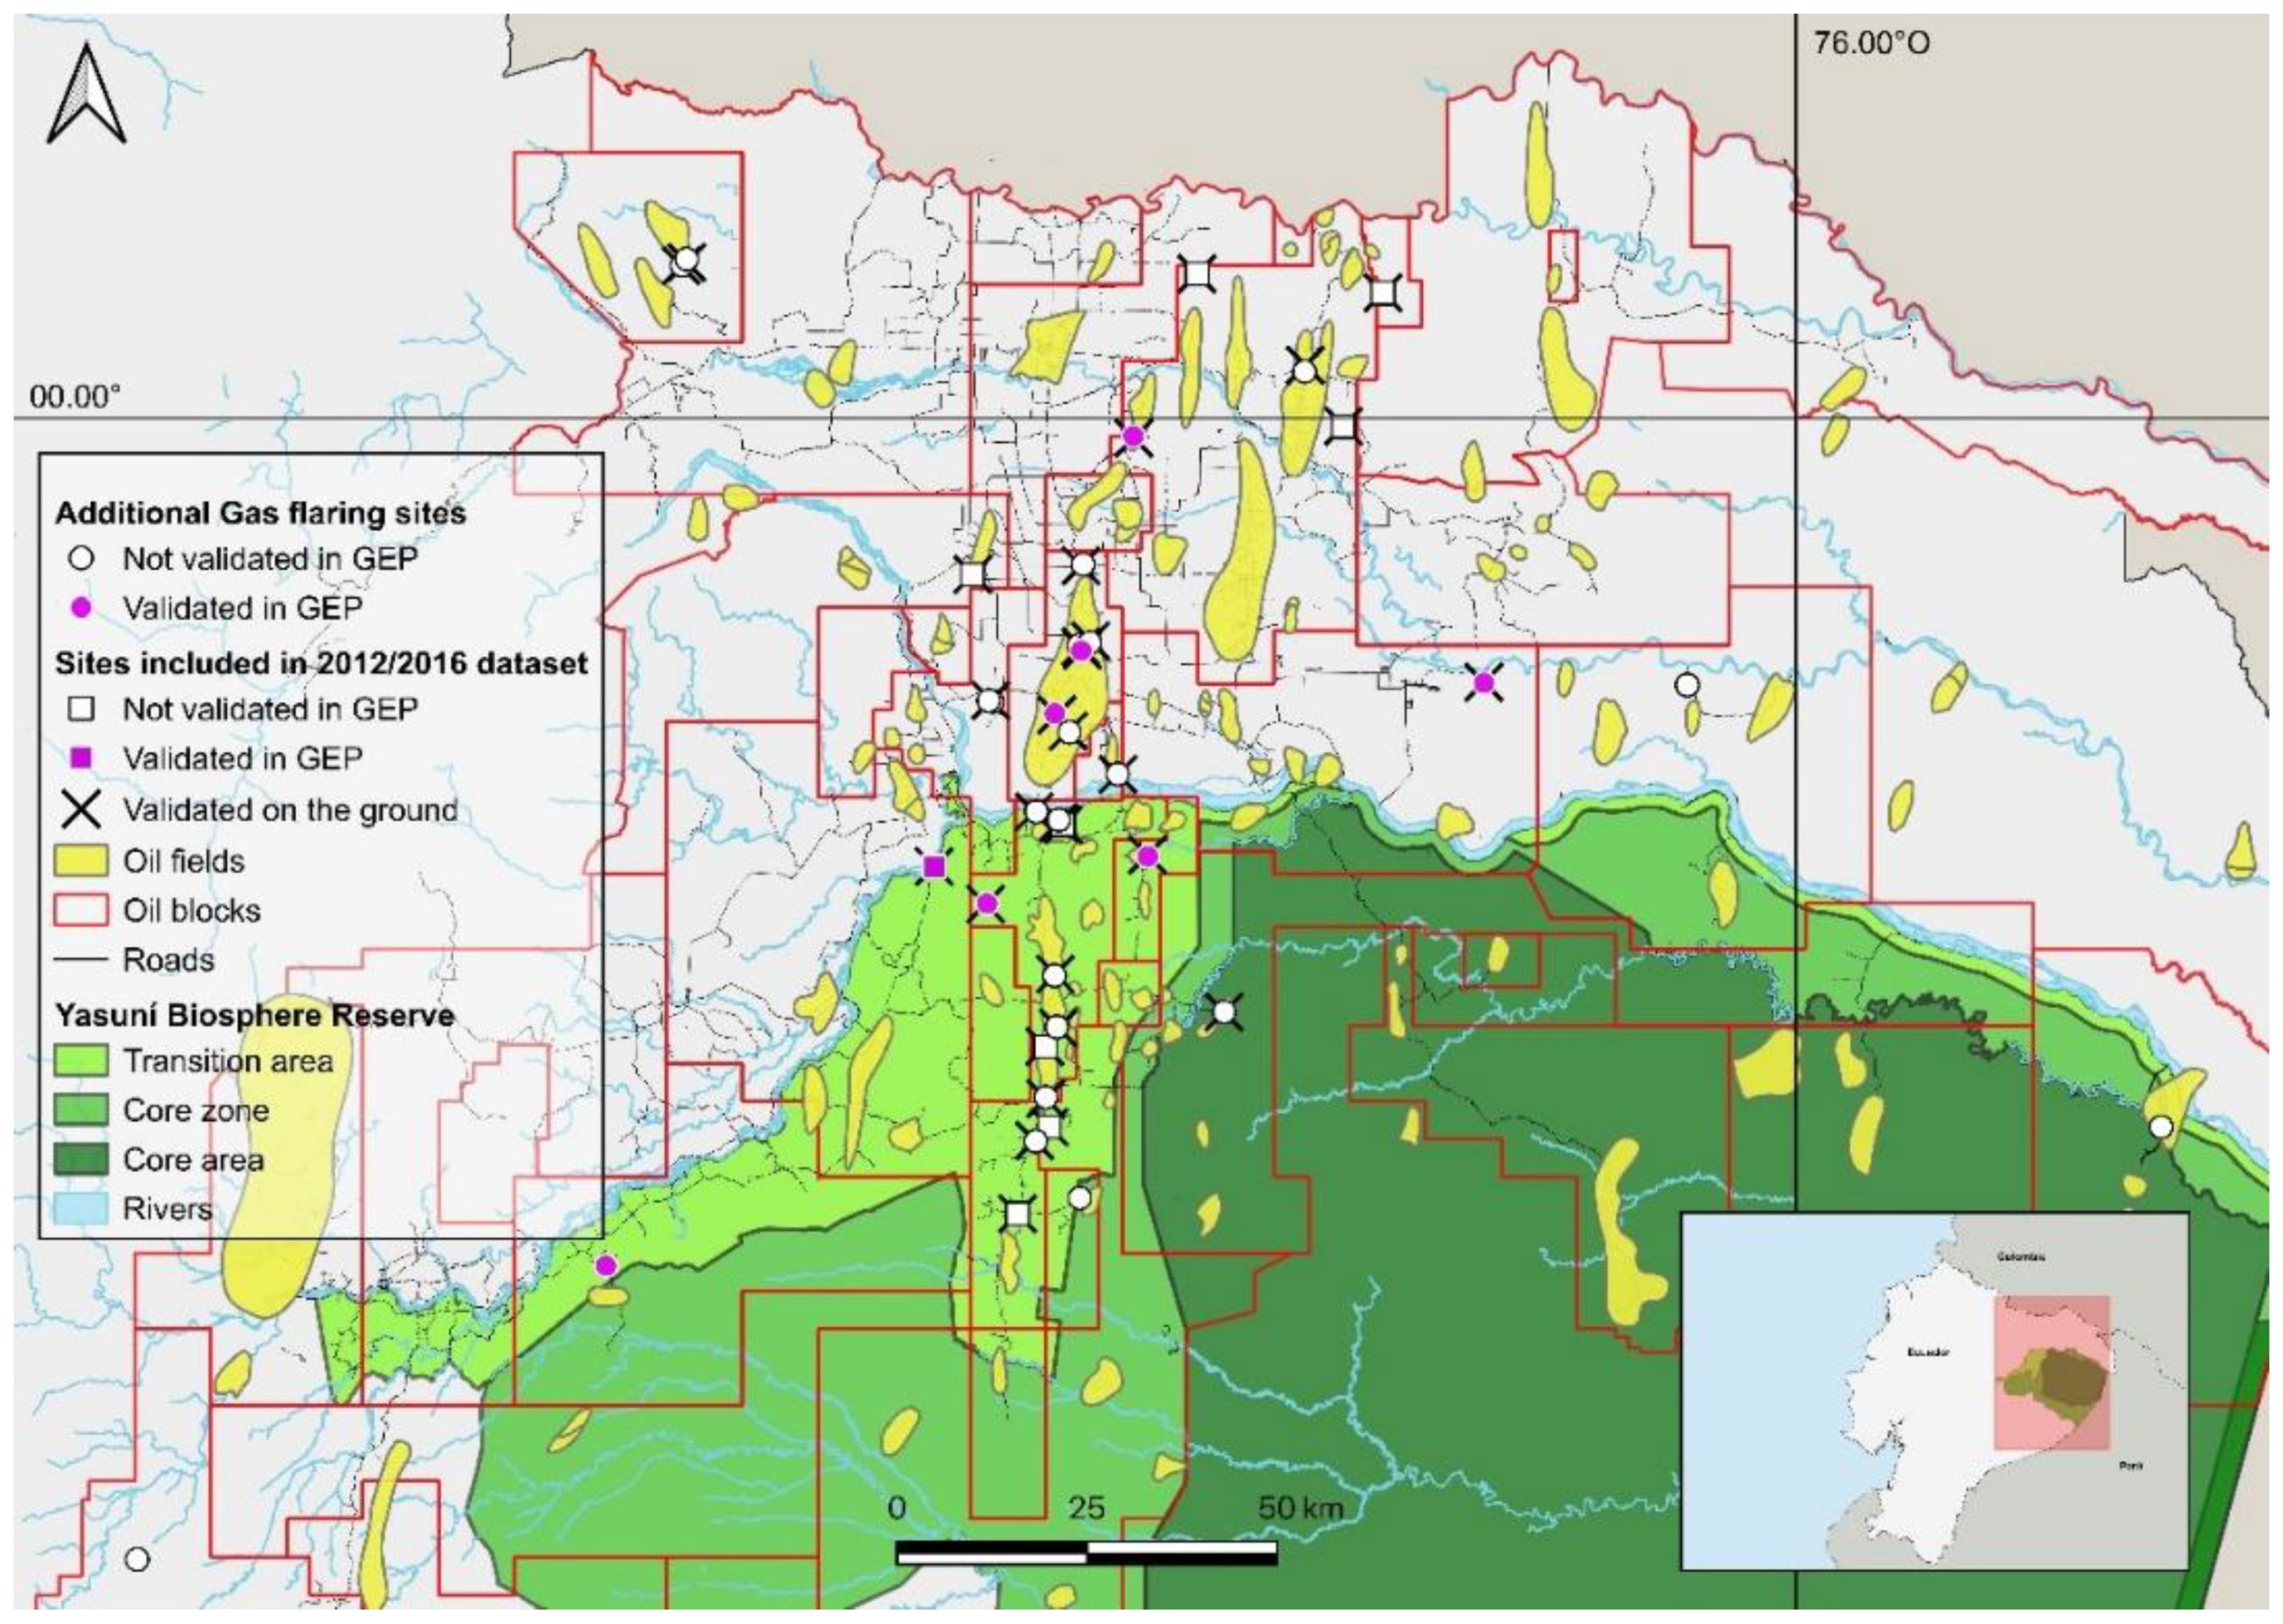
Near real-time monitoring allowed us to identify 101 currently active gas flaring sites in the EAR. The sites not included in the 2017 and 2018 datasets were 34, with 12 in the YBR. These additional sites may belong to sites which were not considered as independent in the NOAA extrapolation workflow, or to sites with not enough detections to be considered as active with only one year of time range. Figure 7 compares locations from the 2012–2018 dataset, sorted as identified as active or inactive from the elaboration of daily detections (see Section 2.4 and Section 2.5); daily detections from 01/01/2017 to 04/04/2019 and the validated additional sites identified in this work Among the validated additional gas flaring sites, nine were in the YBR Transition Area, with four of these in the Auca oil field (block 61), one in the Buffer Zone, inside the Armadillo oil field (block 55), and two in the Core Area, inside the Tiputini and the Sunka (block 14) oil fields . It is noteworthy that the oil production within the Armadillo oil field is actually highly debated as it is located in the influence area of the Tagaeri and Taromenane, indigenous populations in voluntary isolation [84]. Additionally, five flares that seemed closed after 2016 were identified as active. These results, compared with Table 3 that shows a decreasing trend from 2012 to 2018, revealing a different scenario, with 29 currently active sites in the YBR.
In relation to the 29 active gas flaring sites of the YBR, two are in the Core Area, two in the Buffer Zone and 25 in the Transition Area. These results confirm that, despite the advanced and green technologies often claimed both by oil companies and the Government [35,106], oil development and production are carried out in the UNESCO YBR by adopting irrational practices such as gas flaring. Of particular concern is the evidence of gas flaring activities in the Core Area of the zoning framework, where the only activities allowed should be “non-destructive research and other low-impact uses (such as education)” [74]. Considering the spatial distribution of the gas flaring sites and the volumes of gas flared in the Biosphere Reserve, a schizophrenic overlap of policies becomes visible, represented by the dichotomy of the fossil fuels territory on one side and the protection of biodiversity conservation and human rights on the other.

3.3. Daily Detection Processing and Spatial Validation Results

Spatial data validation confirmed the presence of 25 of 28 flares identified from our daily detection elaborations (results are shown in Table 4 and geo-visualized in Figure 8). Moreover, on the ground, we identified and validated nine flaring sites which were included in the 2012–2016 dataset, but not in the 2017 and 2018 datasets. Photointerpretation on high-resolution imageries (GEP) allowed us to validate seven of the additional sites identified by our model; in only one case, there is evidence of gas flaring activity. Additionally, we found that four sites identified from the NOAA in 2016 (or before) were included in GEP imagery; only one case had imagery dated in 2017 or later, giving us evidence of ongoing gas flaring activities.
By a GPS survey, we validated 24 additional sites from our extraction workflow. Among the remaining four sites, three were not accessible and one had no gas flaring activities.
It is interesting to note that, on 37 investigated sites, 11 were confirmed through the GEP, but only three had imageries taken after the beginning of the detections (17 after 01/01/2017), another three had low-resolution images and one showed cloud cover. It means that by GEP imagery interpretation, we would have been able to validate only 43% of the investigated sites and to find evidence of 44% of the existent sites. Finally, by the dual validation process, the new flare detection method showed 3.5% false positives (gas flaring sites detected but not existing on the ground), with 7.1% uncertainty (sites where we were not able to investigate the presence of gas flaring activity). Table 4 summarizes data validated by the GEP imagery photointerpretation and by GPS ground truth.

3.4. Tiputini Oil Field: A Case Study

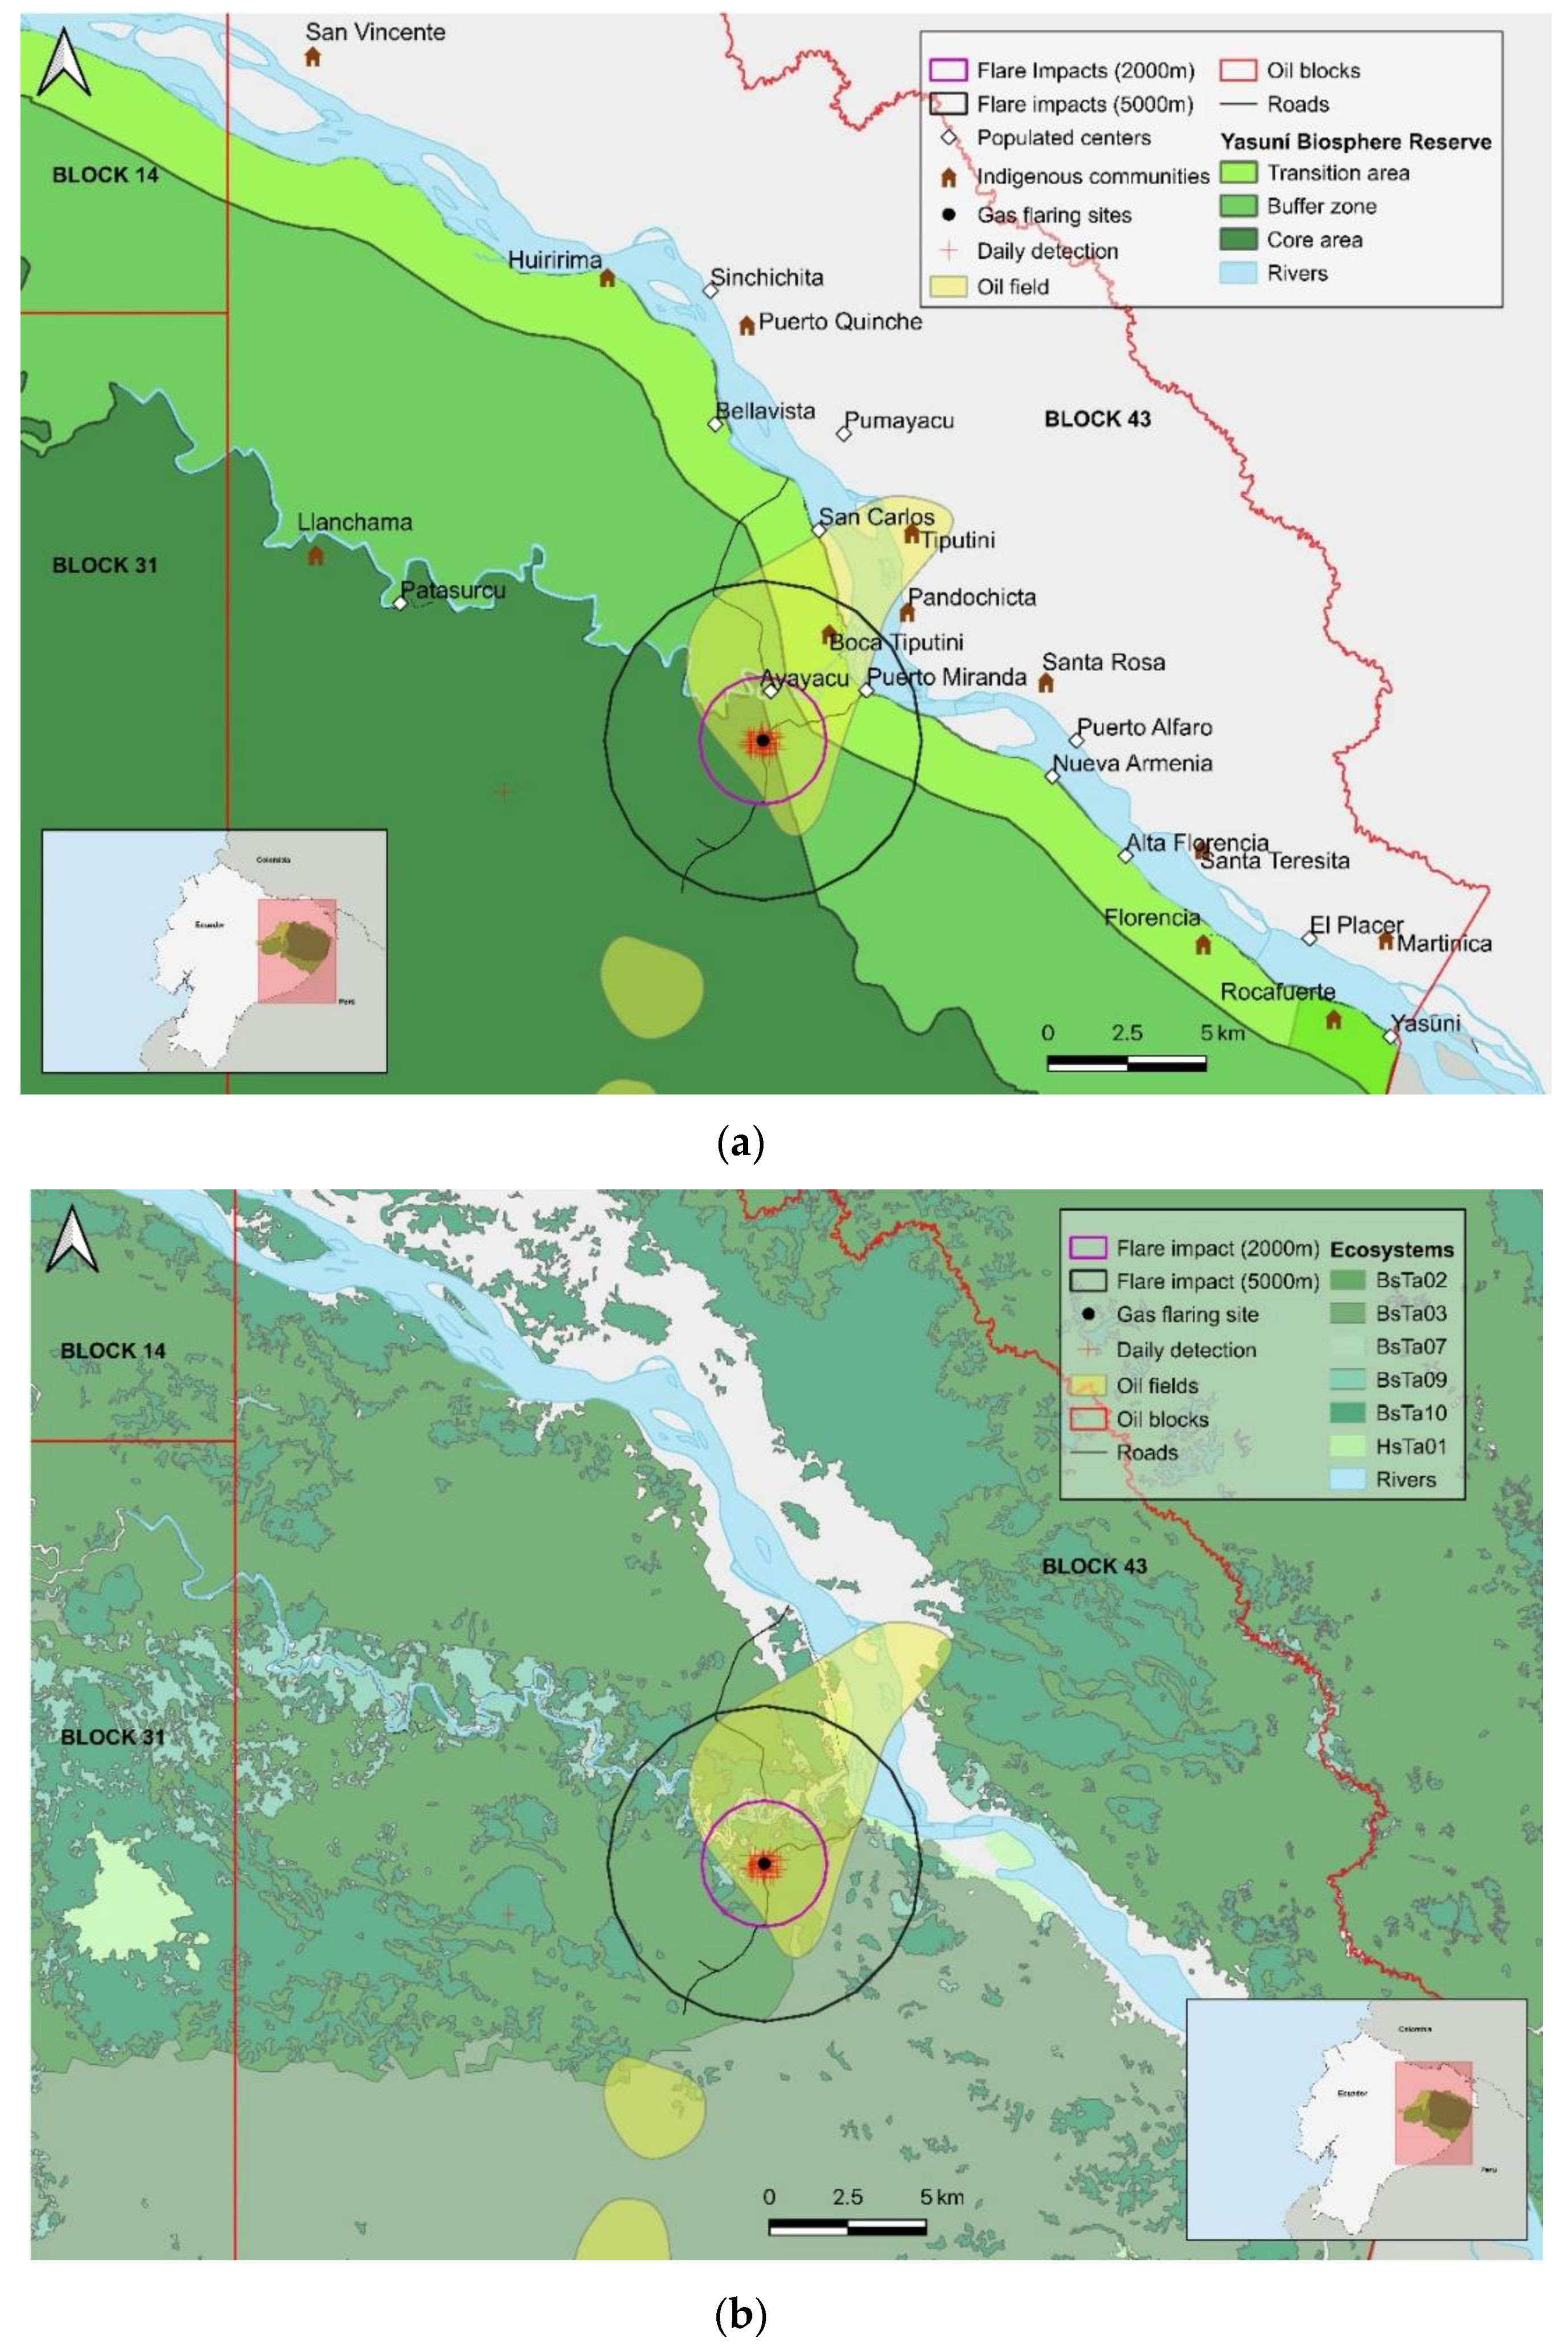
Figure 9 shows the area of the Tiputini oil field (Block 43), where we found 25 detections from 13/12/2017 to 11/04/2019 with an average temperature of 41,529K. The centroid falls into the Core Area of the YBR. Spatial validation was performed by a recent drone aerial image (2018); imagery from GEP was from 2007, and therefore not usable for spatial validation.
The use of the VIIRS-NOAA daily detections was useful to identify gas flaring sites in this area, which is crucial in terms of environmental, social and legislative point of view. In fact, the oil block 43, located in the YBR Core Area and at the border of the Zona Intangible Tagaeri-Taromenane (ZITT), is one of the more debated cases for fossil fuel production in Ecuador [107]. In 2013, the National Interest Declaration of the former President Rafael Correa about the end of the Yasuní-ITT Initiative allowed extraction in the area and encountered strong resistances from local populations, NGOs and a part of the international scientific community [28,29,30]. For this reason, the oil activities in the Tiputini field began only recently [106]. In this context, the Ecuadorian Government ensured the use of advanced and environmentally friendly extraction technologies, as documented by the Environmental Impact Assessment prepared by the National Company Petroamazonas EP to operate block 43 (and approved by Ministry of Environment). These best practices should avoid the in situ gas flaring procedure, commonly known in Ecuador as “mecheros” [35]. The spatial analysis of the YBR areas potentially threatened by the Tiputini oil field (See Section 2.3 and Section 3.4) shows, in the precautional scenario, the following overlapping: 12.5 km2 for the whole YBR; 7.1 km2 for the Core Area; 4.7 km2 for the Buffer Zone; 0.7 km2 for the Transition Area. Additionally, other overlapping includes 8.1 km2 for the “Bosque siempreverde de penillanura del sector Aguarico/Putumayo/Caquetá”, 0.1 km2 for the “Bosque siempreverde de penillanura y llanura del sector Napo/Curaray”, 0.7 km2 for the “Bosque inundable de la llanura aluvial de los ríos de origen amazónico”, 1.0 km2 for the “Bosque inundado de la llanura aluvial de la Amazonía” and 1.8 km2 for the “Bosque inundado de palmas de la llanura aluvial de la Amazonía”, according to the ecosystem classification of the Ecuadorian Ministry of Environment [108].

3.5. Potentially Affected Areas in Tropical Ecosystems and Local Communities

The 2 km buffer of potentially affected areas from the gas flaring activities, applied to both the sites included in the NOAA annual dataset in 2018 and our ground validated sites, cover an area of 347 km2 in the YBR, precisely 21.1 km2 in the Core Area, 41.1 km2 in the Buffer Zone and 284.5 km2 in the Transition Area. Moreover, potentially affected areas are located in eight different tropical ecosystems (see Table 5 and Figure 10) for a total of 524.1 and 49.3 km2 respectively.
It is worth noting that, even if there is little scientific literature about the negative effects of gas flaring on tropical ecosystems, the light pollution and the heating gradient from the gas flaring sites can be some of the direct impacts that can threaten ecosystem dynamics [14,85,109]. The analysis of the potentially affected areas shows great differences between the conservative and the precautional scenarios. Considering the ecosystems, the potentially affected area according to the conservative scenario is 49.3 km2. This is related to the fact that wide areas of primary tropical forest ecosystems are almost completely degraded and deforested, mainly due to the oil-related development of the last 40 years; moreover, the oil infrastructures, such as the road network, represent a key driver for agricultural colonization. As reported in the metadata [89], these areas are “strongly altered by anthropic activities” and represent the more affected areas with a total area of 106.9 km2 in the conservative scenario of “area under human intervention” (the term used from MAE to indicate ecosystems with high anthropic influence), which represents 70% of the overall affected areas. On the other hand, at a 2 km radius from gas flaring, there were more frequent “uncontaminated” areas, with a total area of 662 km2 representing “area under human intervention” only”, which represents 56% of the overall potentially affected areas within that radius.
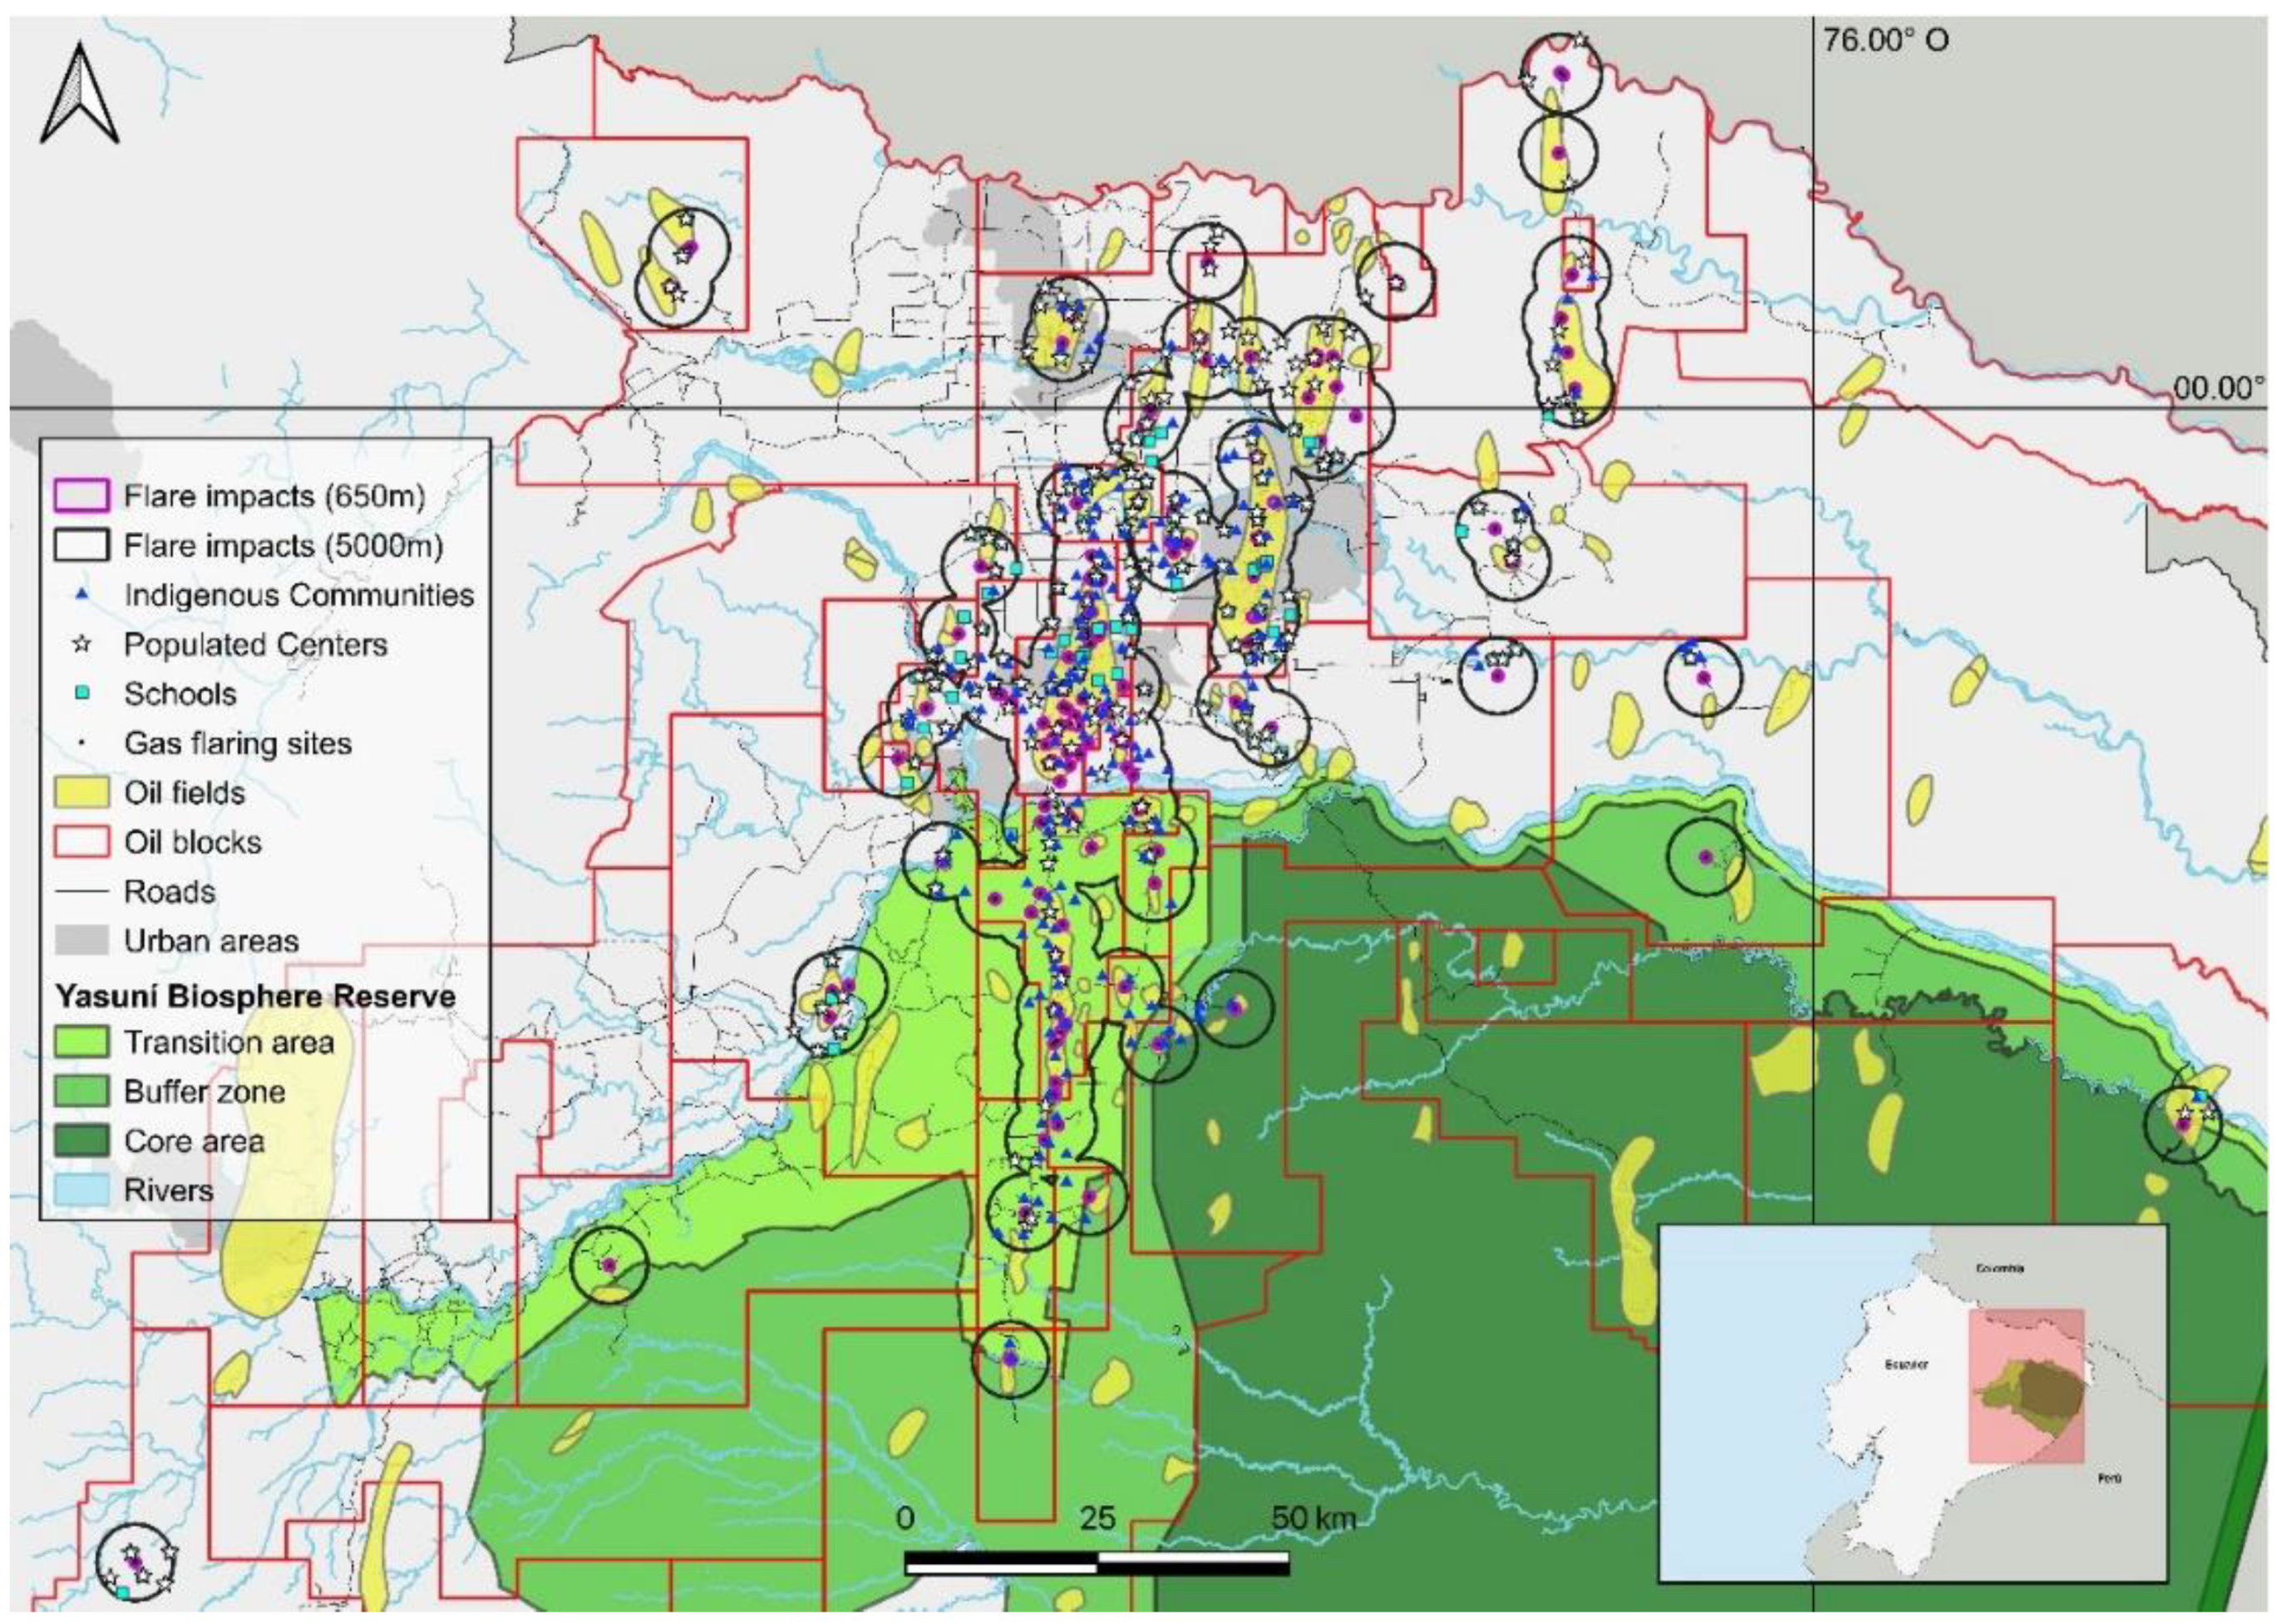
Spatial analyses of potentially affected areas involving local populations showed, in a precautional scenario, that 170 indigenous communities, 187 populated centers and 274 schools are located within a 5 km radius from gas flaring sites (see Figure 11). This buffer affects four main cities of the Amazon region (Nueva Loja, Shushufindi, Joya de los Sachas and Puerto Francisco de Orellana), with an overall overlapping of 550.1 km2, which is 46.85% of the total urban areas. Otherwise, the conservative scenario shows that, within a 650 m radius from the gas flaring sites, there are 10 indigenous communities, 18 populated centers and 10 schools. In this scenario, the overlap between the conservative buffer and local urban centers is 19.6 km2, representing 1.6% of their area. These data are particularly relevant considering that the gas flaring practice in the country has been going on for at least 25 years [52]. The presence of settlements and schools in areas potentially affected by gas flaring activities should be a warning for the local policy makers to consider asking for the use of cleaner technologies or at least implementing safety distances from settled areas.

4. Discussion and Conclusions

This study reveals how the integration of different tools such as NOAA data and GIS modeling allows monitoring gas flaring activities and interactions with territories, over seven years, in key sensitive areas for biodiversity conservation and sustainable development.
This study reveals how the integration of different tools such as open and daily remote sensing data provided from the NOAA, combined with GIS modelling and visual validation, allow developing a new monitoring system to map and to assess gas flaring activities in remote and ecologically and culturally sensitive areas.
Particularly, results showed that, despite the UNESCO MAB program, 23.5% of the gas flaring sites (24 of 102) and 18.4% of the burned gas of the EAR (1,268 on 6,888 MCM) are located within the MAB YBR. Moreover, two of the four main gas flaring plants of the EAR are located in the YBR, in the Yuturi and Auca oil fields.
By adopting, for the first time, this novel and simple method, it is possible to keep monitoring ongoing gas flaring activities in remote sensitive areas by using free downloadable daily detections, provided by the NOAA. However, GEP survey for data validation suggests that, although it can be a good instrument for the removal of false-positive sources (e.g., volcanoes), the lack of free recent imagery of remote areas strongly affects validation. For our study area, spatial validation on the ground (GPS survey) was therefore required, showing the good performance of our method: only one false positive on 35 investigated sites was recorded. This also means at least 32 active gas flaring sites were not identified in the NOAA annual datasets. Validated results of new gas flaring sites suggest that gas flaring activity is more extended in the area than reported from the Elvidge et al. annual datasets [104], especially in remote sectors of the RBY, where the oil exploitation frontier is at present under expansion. In fact, this study highlights the presence of gas flaring practices both in the Core Area and in the Buffer Zone of the MAB Biosphere Reserve, where only biodiversity conservation policies and sustainable practices should be allowed.
This study also provided a new data monitoring system from the NOAA which allows exploiting daily detections not recorded in the official annual dataset and detecting ongoing active gas flaring activities. The daily detection analysis also suggests that gas flaring activities are more extended in the area, especially in remote sectors of the RBY, where the oil exploitation frontier is at present under expansion. In fact, daily detections permitted identifying gas flaring in the oil field Tiputini, in the oil block 43, which is considered one of the key areas for biological and cultural diversity conservation. Moreover, we were able also detect 38 new gas flaring sites, two in the Core area, one in the Buffer Zone and 11 in the Transition Area of the YBR.
The case of the recent exploitation of the Tiputini oil field, included in the Yasuní-ITT Initiative as an unburnable carbon area, is emblematic: after the international debate, oil operation started under claims of adopting advanced technologies to minimize socio-environmental impacts [32,34]. Moreover, according to the Environmental Impact Assessment approved by MAE, the use of gas flaring stacks was supposed to be abandoned during the different phases of oil drilling and production ([35] (pp. 489, 505)). However, our method of processing daily detections allowed us to identify 25 cases of gas flaring activities (from 13/12/2017 to 11/04/2019), with an average temperature of 1529 K in the Tiputini oil field. Hence, this study highlights the potential of using open NOAA satellite data to keep monitoring compliance with EIA and environmental guidelines from oil companies which are operating in remote and sensitive areas, such as the Western Amazon. This fact becomes more crucial if there is a general lack of independent and reliable information on gas flaring activities [55]. Many authors assert the key role of this kind of information in guiding the efforts toward the adoption of better environmental practices and the management of territorial conflicts related to fossil fuel extraction [52,110].
The estimation of potentially affected areas, in a conservative scenario created with the lower metrics found in the literature, shows 10 indigenous communities, 18 populated centers and 10 schools that may be impacted by gas flaring activities.
This represents an important screening that is useful for national and regional policy makers, who may be interested in reducing gas flaring from oil production, starting from priority intervention. However, on-the-ground surveys to better assess metrics about the harmfulness of gas flaring activities on human health and ecosystems, in this kind of context, would be of great contribution to the estimation of potentially affected areas.
Moreover, data comparison of different satellite multispectral images such as Sentinel, Landsat and specifically provided night imagery from WorldView-3, along with on-the-ground surveys, may be useful to analyze results and to investigate the extension of gas flaring impacts on microclimate and biodiversity, as well as on human rights. This first analysis of interaction among gas flaring and policy implementation in Western Amazon, even if it falls inside the boundary of Ecuador, a small country with high biological and cultural diversity, whose economy relies on fossil fuels extraction, asks for global responsibilities in implementing climatic justice policies.

Author Contributions

All authors contributed equally to the project. All authors have read and agreed to the published version of the manuscript.

Funding

This research received no external funding.

Acknowledgments

We would like to thank the GIScience D4G LAB (ICEA Department, University of Padua) for supporting GIS and remote sensing analyses. We also acknowledge the Yasunidos collective of Quito for monitoring the Tiputini oil fields and for providing updated information. A special thanks to the network Unión de Los Afectados Para Texaco of Lago Agrio and to the Fundación Alejandro Labaka of Coca for supporting us during the fieldwork in Ecuador during mapping and validating of gas flaring sites.

Conflicts of Interest

The authors declare no conflict of interest.

References

  1. Finer, M.; Jenkins, C.N.; Pimm, S.L.; Keane, B.; Ross, C. Oil and Gas Projects in the Western Amazon: Threats to Wilderness, Biodiversity and Indigenous Peoples. PLoS ONE 2008, 3, e2932. [Google Scholar] [CrossRef]
  2. Bass, M.S.; Finer, M.; Jenkins, C.N.; Kreft, H.; Cisneros-Heredia, D.F.; McCracken, S.F.; Pitman, N.C.A.; English, P.H.; Swing, K.; Villa, G.; et al. Global Conservation Significance of Ecuador’s Yasuní National Park. PLoS ONE 2010, 5, e8767. [Google Scholar] [CrossRef] [PubMed]
  3. Ulloa, J.; Callles, J.; Espíndola, F.; López, V. Amazonía Ecuatoriana Bajo Presión. 2013. Available online: www.raisg.socioambiental.org (accessed on 5 November 2019).
  4. Finer, M.; Babbitt, B.; Novoa, S.; Ferrarese, F.; Pappalardo, S.E.; Marchi, M.D.; Saucedo, M.; Kumar, A. Future of Oil and Gas Development in the Western Amazon. Environ. Res. Lett. 2015, 10, 024003. [Google Scholar] [CrossRef]
  5. Mittermeier, R.A.; Mittermeier, C.; Pil, P.R. Megadiversity: Earth’s Biologically Wealthiest Nations; Cemex: Mexico City, Mexico, 1997. [Google Scholar]
  6. Myers, N.; Mittermeier, R.A.; Mittermeier, C.G.; Da Fonseca, G.A.B.; Kent, J. Biodiversity Hotspots for Conservation Priorities. Nature 2000, 403, 853–858. [Google Scholar] [CrossRef] [PubMed]
  7. Rival, L. Resistance in an Amazonian Community, Huaorani Organizing against the Global Economy. J. Lat. Am. Anthropol. 2008, 10, 257–259. [Google Scholar] [CrossRef]
  8. Pappalardo, S.E.; De Marchi, M.; Ferrarese, F. Uncontacted Waorani in the Yasuní Biosphere Reserve: Geographical Validation of the Zona Intangible Tagaeri Taromenane (ZITT). PLoS ONE 2013, 8, e66293. [Google Scholar] [CrossRef] [Green Version]
  9. Fontaine, G.; Narvaez, I. Yasuní En El Siglo XXI. El Estado Ecuatoriano y La Conservacion de La Amazonia; FLACSO: Quito, Ecuador, 2008. [Google Scholar]
  10. Acosta, A. La Maldición de La Abundancia; Abya-Yala: Quito, Ecuador, 2009. [Google Scholar]
  11. Codato, D.; Pappalardo, S.E.; Diantini, A.; Ferrarese, F.; Gianoli, F.; De Marchi, M. Oil Production, Biodiversity Conservation and Indigenous Territories: Towards Geographical Criteria for Unburnable Carbon Areas in the Amazon Rainforest. Appl. Geogr. 2019, 102, 28–38. [Google Scholar] [CrossRef]
  12. The World Bank. Systematic Country Diagnostic Bolivia, Chile, Ecuador, Peru and Venezuela Country Management Unit. 2018. Available online: http://documents.worldbank.org/curated/en/835601530818848154/pdf/Ecuador-SCD-final-june-25-06292018.pdf (accessed on 5 November 2019).
  13. Lessmann, J.; Fajardo, J.; Moñoz, J.; Bonaccorso, E. Large Expansion of Oil Industry in the Ecuadorian Amazon: Biodiversity Vulnerability and Conservation Alternatives. Ecol. Evol. 2016, 6, 4997–5012. [Google Scholar] [CrossRef] [Green Version]
  14. McCracken, S.F.; Forstner, M.R.J. Oil Road Effects on the Anuran Community of a High Canopy Tank Bromeliad (Aechmea Zebrina) in the Upper Amazon Basin, Ecuador. PLoS ONE 2014, 9, e85470. [Google Scholar] [CrossRef]
  15. Azevedo-Santos, V.M.; Garcia-Ayala, J.R.; Fearnside, P.M.; Esteves, F.A.; Pelicice, F.M.; Laurance, W.F.; Benine, R.C. Amazon Aquatic Biodiversity Imperiled by Oil Spills. Biodivers. Conserv. 2016, 25, 2831–2834. [Google Scholar] [CrossRef] [Green Version]
  16. Arellano, P.; Tansey, K.; Balzter, H.; Boyd, D.S. Detecting the Effects of Hydrocarbon Pollution in the Amazon Forest Using Hyperspectral Satellite Images. Environ. Pollut. 2015, 205, 225–239. [Google Scholar] [CrossRef]
  17. Arellano, P.; Tansey, K.; Balzter, H.; Tellkamp, M. Plant Family-Specific Impacts of Petroleum Pollution on Biodiversity and Leaf Chlorophyll Content in the Amazon Rainforest of Ecuador. PLoS ONE 2017, 12, e0169867. [Google Scholar] [CrossRef] [PubMed] [Green Version]
  18. Sierra, R.; Stallings, J. The Dynamics and Social Organization of Tropical Deforestation in Northwest Ecuador‚ 1983–19951. Hum. Ecol. 1998, 26, 135–161. [Google Scholar] [CrossRef]
  19. Zapata-Ríos, G.; Suárez, R.E.; Utreras Víctor, B.; Vargas, J. Evaluation of Anthropogenic Threats in Yasuní National Park and Its Implications for Wild Mammal Conservation. Lyonia 2006, 10, 31–41. Available online: https://lyonia.org/articles/volume_21/volume.pdf#page=46 (accessed on 19 December 2019).
  20. Suárez, E.; Zapata-Ríos, G.; Utreras, V.; Strindberg, S.; Vargas, J. Controlling Access to Oil Roads Protects Forest Cover, but Not Wildlife Communities: A Case Study from the Rainforest of Yasuní Biosphere Reserve (Ecuador). Anim. Conserv. 2013, 16, 265–274. [Google Scholar] [CrossRef]
  21. Akchurin, M. Constructing the Rights of Nature: Constitutional Reform, Mobilization and Environmental Protection in Ecuador. Law Soc. Inq. 2015, 40, 937–968. [Google Scholar] [CrossRef]
  22. Kauffman, C.M.; Martin, P.L. Can Rights of Nature Make Development More Sustainable? Why Some Ecuadorian Lawsuits Succeed and Others Fail. World Dev. 2017, 92, 130–142. [Google Scholar] [CrossRef]
  23. Laastad, S.G. Nature as a Subject of Rights? National Discourses on Ecuador’s Constitutional Rights of Nature. Forum Dev. Stud. 2019, 1–25. [Google Scholar] [CrossRef]
  24. Finer, M.; Moncel, R.; Program, E.; Jenkins, C.N. Leaving the Oil Under the Amazon: Ecuador’s Yasuní-ITT Initiative. Biotropica 2010, 42, 63–66. [Google Scholar] [CrossRef]
  25. Rival, L. Ecuador’s Yasuní-ITT Initiative: The Old and New Values of Petroleum. Ecol. Econ. 2010, 70, 358–365. [Google Scholar] [CrossRef]
  26. Marx, E.; Calle, N. Conservation Biology. The Fight for Yasuni. Science 2010, 330, 1170–1171. [Google Scholar] [CrossRef]
  27. Larrea, C.; Warnars, L. Ecuador’s Yasuni-ITT Initiative: Avoiding Emissions by Keeping Petroleum Underground. Energy Sustain. Dev. 2009, 13, 219–223. [Google Scholar] [CrossRef]
  28. Vallejo, M.C.; Burbano, R.; Falconí, F.; Larrea, C. Leaving Oil Underground in Ecuador: The Yasuní-ITT Initiative from a Multi-Criteria Perspective. Ecol. Econ. 2015, 109, 175–185. [Google Scholar] [CrossRef]
  29. Fierro, L.G. Re-Thinking Oil: Compensation for Non-Production in Yasuní National Park Challenging Sumak Kawsay and Degrowth. Sustain. Sci. 2017, 12, 263–274. [Google Scholar] [CrossRef]
  30. Alava, J.J.; Calle, N. Drilling Plans Endanger Yasuní’s Biodiversity. Science 2013, 342, 931–932. [Google Scholar] [CrossRef] [PubMed]
  31. Sovacool, B.K.; Scarpaci, J. Energy Justice and the Contested Petroleum Politics of Stranded Assets: Policy Insights from the Yasuní-ITT Initiative in Ecuador. Energy Policy 2016, 95, 158–171. [Google Scholar] [CrossRef]
  32. Gobierno no Escatimará Esfuerzos Para Explotación Petrolera en Yasuní. Available online: https://www.elcomercio.com/actualidad/yasuni-itt-explotacion-petrolera-lorena.html (accessed on 5 November 2019).
  33. Petroamazonas Perforó el Primer Pozo Para Extraer Crudo Del ITT|El Comercio. Available online: https://www.elcomercio.com/actualidad/petroamazonas-perforacion-crudo-yasuniitt.html (accessed on 21 October 2019).
  34. Correa: Solo se Explotarán 200 Hectáreas Del Yasuní. Available online: https://www.eluniverso.com/noticias/2014/11/06/nota/4191661/presidente-rafael-correa-precisa-sobre-porcentaje-afectacion-yasuni (accessed on 21 October 2019).
  35. Renssnature Consulting (CÍA); LTDA. Borrador Del Alcance a la Reevaluación Del estudio de Impacto Ambiental y Plan de Manejo Ambiental Para el Desarrollo y Producción de Los Campos Tputini y Tambococha, Bloque 43; Gruporenss: Quito, Ecuador, 2017. [Google Scholar]
  36. McGlade, C.; Ekins, P. The Geographical Distribution of Fossil Fuels Unused When Limiting Global Warming to 2 °C. Nature 2015, 517, 187–190. [Google Scholar] [CrossRef]
  37. UNFCCC. Adoption of the Paris Agreement. 2015. Available online: https://unfccc.int/resource/docs/2015/cop21/eng/l09.pdf (accessed on 5 November 2019).
  38. Zhao, S.; Alexandroff, A. Current and Future Struggles to Eliminate Coal. Energy Policy 2019, 129, 511–520. [Google Scholar] [CrossRef]
  39. IPCC. Global Warming of 1.5 °C. An IPCC Special Report on the Impacts of Global Warming of 1.5 °C Above Pre-Industrial Levels and Related Global Greenhouse Gas Emission Pathways, in the Context of Strengthening the Global Response to the Threat of Climate Change; Intergovernamental Panel on Climate Change. 2018. Available online: https://www.ipcc.ch/sr15/download/#full (accessed on 5 November 2019).
  40. Rhodes, C.J. Only 12 Years Left to Readjust for the 1.5-Degree Climate Change Option—Says International Panel on Climate Change Report: Current Commentary. Sci. Prog. 2019, 102, 73–87. [Google Scholar] [CrossRef]
  41. Unburnable Carbon: Is Brazil Avoiding the Carbon Bubble? Available online: https://www.carbontracker.org/reports/is-brazil-avoiding-the-carbon-bubble/ (accessed on 5 November 2019).
  42. Hendrick, M.F.; Cleveland, S.; Phillips, N.G. Unleakable Carbon. Clim. Policy 2017, 17, 1057–1064. [Google Scholar] [CrossRef]
  43. Erickson, P.; Lazarus, M.; Piggot, G. Limiting Fossil Fuel Production as the next Big Step in Climate Policy. Nat. Clim. Chang. 2018, 8, 1037–1043. [Google Scholar] [CrossRef]
  44. IPCC. Climate Change 2013. The Physical Science Basis. Contribution of Working Group I to the Fifth Assessment Report of the Intergovernmental Panel on Climate Change; Cambridge University Press: Cambridge, UK, 2014. [Google Scholar]
  45. Emam, E.A. Environmental Pollution and Measurement of Gas Flaring. Int. J. Innov. Res. Sci. Eng. Technol. 2016, 2, 252–262. Available online: https://pdfs.semanticscholar.org/0463/5c29995aefa3f8f7d431d4ca6a35d22c4813.pdf (accessed on 19 December 2019).
  46. Saheed Ismail, O.; Umukoro, G.E.; Ismail, O.S.; Umukoro, G.E. Global Impact of Gas Flaring. Energy Power Eng. 2012, 4, 290–302. [Google Scholar] [CrossRef] [Green Version]
  47. IPCC. Climate Change 2014: Mitigation of Climate Change. In Contribution of Working Group III to the Fifth Assessment Report of the Intergovernmental Panel on Climate Change; Cambridge University Press: New York, NY, USA, 2014. [Google Scholar]
  48. Amaechi, C.F.; Biose, E. Gas Flaring: Carbon Dioxide Contribution to Global Warming. J. Appl. Sci. Environ. Manag. 2016, 20, 309–317. Available online: https://www.ajol.info/index.php/jasem/article/view/140405 (accessed on 19 December 2019).
  49. Weyant, C.L.; Shepson, P.B.; Subramanian, R.; Cambaliza, M.O.L.; Heimburger, A.; Mccabe, D.; Baum, E.; Stirm, B.H.; Bond, T.C. Black Carbon Emissions from Associated Natural Gas Flaring. Environ. Sci. Technol. 2016, 500, 2075–2081. [Google Scholar] [CrossRef] [PubMed]
  50. Global Gas Flaring Reduction Partnership (GGFR). Available online: https://www.worldbank.org/en/programs/gasflaringreduction (accessed on 5 November 2019).
  51. Zero Routine Flaring by 2030. Available online: https://www.worldbank.org/en/programs/zero-routine-flaring-by-2030 (accessed on 5 November 2019).
  52. Elvidge, C.D.; Ziskin, D.; Baugh, K.E.; Tuttle, B.T.; Ghosh, T.; Pack, D.W.; Erwin, E.H.; Zhizhin, M. A Fifteen Year Record of Global Natural Gas Flaring Derived from Satellite Data. Energies 2009, 2, 595–622. [Google Scholar] [CrossRef]
  53. Fawole, O.G.; Cai, X.M.; Mackenzie, A.R. Gas Flaring and Resultant Air Pollution: A Review Focusing on Black Carbon. Environ. Pollut. 2016, 216, 182–197. [Google Scholar] [CrossRef]
  54. De Marchi, M.; Sengar, B.; Furze, J.N. Prospects for Sustainability in Human–Environment Patterns: Dynamic Management of Common Resources. In Mathematical Advances Towards Sustainable Environmental Systems; Furze, J.N., Swing, K., Gupta, A.K., McClatchey, R., Reynolds, D., Eds.; Springer International Publishing: Cham, The Switzerland, 2017; pp. 319–347. [Google Scholar] [CrossRef]
  55. Faruolo, M.; Lacava, T.; Pergola, N.; Tramutoli, V.; Faruolo, M.; Lacava, T.; Pergola, N.; Tramutoli, V. On the Potential of the RST-FLARE Algorithm for Gas Flaring Characterization from Space. Sensors 2018, 18, 2466. [Google Scholar] [CrossRef] [Green Version]
  56. Anejionu, O.C.D.; Blackburn, G.A.; Whyatt, J.D. Satellite Survey of Gas Flares: Development and Application of a Landsat-Based Technique in the Niger Delta. Int. J. Remote Sens. 2014, 35, 1900–1925. [Google Scholar] [CrossRef] [Green Version]
  57. Faruolo, M.; Coviello, I.; Filizzola, C.; Lacava, T.; Pergola, N.; Tramutoli, V. A Satellite-Based Analysis of the Val d’Agri Oil Center (Southern Italy) Gas Flaring Emissions. Nat. Hazards Earth Syst. Sci. 2014, 14, 2783–2793. [Google Scholar] [CrossRef] [Green Version]
  58. Chowdhury, S.; Shipman, T.; Chao, D.; Christopher, D.E.; Zhizhin, M.; Hsu, F.-C.; Survey, A.G.; Regulator, A.E. Daytime Gas Flare Detection Using Landsat-8 Multispectral Data. In Proceedings of the IEEE International Geoscience Remote Sensing Symposium, Quebec, QC, Canada, 13–18 July 2014; pp. 1–5. [Google Scholar]
  59. Anejionu, O.C.D.; Blackburn, G.A.; Whyatt, J.D. Detecting Gas Flares and Estimating Flaring Volumes at Individual Flow Stations Using MODIS Data. Remote Sens. Environ. 2015, 158, 81–94. [Google Scholar] [CrossRef] [Green Version]
  60. Caseiro, A.; Rücker, G.; Tiemann, J.; Leimbach, D.; Frauenberger, O.; Kaiser, J.W. A Methodology for Gas Flaring Detection and Characterisation Using SLSTR. Remote Sens. 2018, 10, 1118. [Google Scholar] [CrossRef] [Green Version]
  61. Doumbia, E.H.T.; Liousse, C.; Keita, S.; Granier, L.; Granier, C.; Elvidge, C.D.; Elguindi, N.; Law, K. Flaring Emissions in Africa: Distribution, Evolution and Comparison with Current Inventories. Atmos. Environ. 2019, 199, 423–434. [Google Scholar] [CrossRef]
  62. Zhizhin, M.; Elvidge, C.D.; Hsu, F.; Baugh, K.E. Using the Short-Wave Infrared for Nocturnal Detection of Combustion Sources in VIIRS Data. Proc. Asia-Pac. Adv. Netw. 2013, 35, 49–61. [Google Scholar] [CrossRef] [Green Version]
  63. Elvidge, C.D.; Zhizhin, M.; Baugh, K.; Hsu, F.C.; Ghosh, T. Methods for Global Survey of Natural Gas Flaring from Visible Infrared Imaging Radiometer Suite Data. Energies 2016, 9, 14. [Google Scholar] [CrossRef]
  64. Deetz, K.; Vogel, B. Development of a New Gas-Flaring Emission Dataset for Southern West Africa. Geosci. Model. Dev. 2017, 10, 1607–1620. [Google Scholar] [CrossRef] [Green Version]
  65. Sharma, A.; Wang, J.; Lennartson, E. Intercomparison of MODIS and VIIRS Fire Products in Khanty-Mansiysk Russia: Implications for Characterizing Gas Flaring from Space. Atmosphere 2017, 8, 95. [Google Scholar] [CrossRef] [Green Version]
  66. Caseiro, A.; Gehrke, B.; Leimbach, D.; Kaiser, J.W. Gas Flaring Activity and Black Carbon Emissions in 2017 Derived from Sentinel-3A SLSTR. Earth Syst. Sci. Data Discuss. 2019. [Google Scholar] [CrossRef] [Green Version]
  67. Lesmann, J.; Fajardo, J.; Bonaccorso, E.; Bruner, A. Cost-effective protection of biodiversity in the western Amazon. Biol. Conserv. 2019, 235, 250–259. [Google Scholar] [CrossRef]
  68. Mittermeier, R.A.; Mittermeier, C.G.; Brooks, T.M.; Pilgrim, J.D.; Konstant, W.R.; Fonseca, G.A.B.; Kormos, C. Wilderness and Biodiversity Conservation. In Proceedings of the National Academy of Sciences, Washington, DC, USA, 14 April 2003; pp. 10309–10313. [Google Scholar]
  69. Peres, C.A. Why We Need Megareserves in Amazonia. Conserv. Biol. 2005, 19, 728–733. [Google Scholar] [CrossRef]
  70. Ter Steege, H.; Pitman, N.; Sabatier, D.; Castellanos, H.; Van Der Hout, P.; Silveira, M.; Phillips, O.; Adalardo Oliveira, A.D.E.; Thomas, R.; Van Essen, J.; et al. A Spatial Model of Tree A-Diversity and Tree Density for the Amazon. Biodivers Conserv. 2003, 12, 2255–2277. [Google Scholar] [CrossRef]
  71. Finer, M.; Vijay, V.; Ponce, F.; Jenkins, C.N.; Kahn, T.R. Ecuador’s Yasuní Biosphere Reserve: A Brief Modern History and Conservation Challenges. Environ. Res. Lett. 2009, 4, 034005. [Google Scholar] [CrossRef]
  72. Weckmüller, H.; Barriocanal, C.; Maneja, E.; Boada, M. Factors Affecting Traditional Medicinal Plant Knowledge of the Waorani, Ecuador. Sustainability 2019, 11, 4460. [Google Scholar] [CrossRef] [Green Version]
  73. Biosphere Reserves Information. Available online: http://www.unesco.org/mabdb/br/brdir/directory/biores.asp?code=ECU+02&mode=all (accessed on 5 November 2019).
  74. Zoning Schemes|United Nations Educational, Scientific and Cultural Organization (UNESCO). Available online: http://www.unesco.org/new/en/natural-sciences/environment/ecological-sciences/biosphere-reserves/main-characteristics/zoning-schemes/ (accessed on 21 October 2019).
  75. Huertas, O.; Reyes, H. Informe de Evaluación Final Programa Yasuní. Ministerio del Ambiente del Ecuador y F-ODM. 2011. Available online: http://yasunitransparente.ambiente.gob.ec/documents/348542/351054/Informe_Programa.pdf/872553ed-b6fa-4742-9a5e-6f0d780f0c75;jsessionid=5phB5Dpzmxa9x9Z7ZIkyh3pL (accessed on 5 November 2019).
  76. Finer, M.; Ferrarese, F.; Pappalardo, S.E.; De Marchi, M. High Resolution Satellite Imagery Reveals Petroamazonas Violated Environmental Impact Study by Building Road into Yasuní National Park. 2014. Available online: http://www.geoyasuni.org/wp-content/uploads/2014/06/Yasuni-Technical-Report_bloque31.pdf (accessed on 5 November 2019).
  77. O’Rourke, D.; Connolly, S. Just Oil? The Distribution of Environmental and Social Impacts of Oil Production and Consumption. Annu. Rev. Environ. Resour. 2003, 28, 587–617. [Google Scholar] [CrossRef] [Green Version]
  78. Ramirez, M.I.; Arevalo, A.P.; Sotomayor, S.; Bailon-Moscoso, N. Contamination by Oil Crude Extraction—Refinement and Their Effects on Human Health. Environ. Pollut. 2017, 231, 415–425. [Google Scholar] [CrossRef] [PubMed]
  79. San Sebastián, M.S.; Armstrong, B.; Córdoba, J.A.; Stephens, C.; Manuel, C. Exposures and Cancer Incidence near Oil Fields in the Amazon Basin of Ecuador. Occup. Environ. Med. 2001, 58, 517–522. [Google Scholar] [CrossRef]
  80. UDAPT. Clinica Ambiental. Informe de Salud. 2017. Available online: http://www.clinicambiental.org/docs/publicaciones/informe_salud_tex.pdf (accessed on 5 November 2019).
  81. Anticona, C.; Bergdahl, I.A.; San Sebastian, M. Lead Exposure among Children from Native Communities of the Peruvian Amazon Basin. Rev. Panam. Salud Publica 2012, 31, 296–302. Available online: http://iris.paho.org/xmlui/handle/123456789/9380 (accessed on 19 December 2019).
  82. Anticona, C.; Bergdahl, I.A.; Lundh, T.; Alegre, Y.; Sebastian, M.S. Lead Exposure in Indigenous Communities of the Amazon Basin, Peru. Int. J. Hyg. Environ. Health 2011, 215, 59–63. [Google Scholar] [CrossRef]
  83. Bravo, E. Los Impactos de la Explotacion Petrolera en Ecosistemas Tropicales y la Biodiversidad. 2007. Available online: http://www.inredh.org/archivos/documentos_ambiental/impactos_explotacion_petrolera_esp.pdf (accessed on 5 November 2019).
  84. De Marchi, M.; Pappalardo, S.E.; Codato, D.; Ferrarese, F. Zona Intangible Tagaeri Taromenane y Expansión de Las Fronteras Hidrocarburíferas Miradas a Diferentes Escalas Geográficas; CLEUP: Padova, Italy, 2015. [Google Scholar]
  85. Pohlman, C.L.; Turton, S.M.; Goosem, M. Edge Effects of Linear Canopy Openings on Tropical Rain Forest Understory Microclimate. Biotropica 2007, 39, 62–71. [Google Scholar] [CrossRef]
  86. Peláez-Samaniego, M.R.; Garcia-Perez, M.; Cortez, L.A.B.; Oscullo, J.; Olmedo, G. Energy Sector in Ecuador: Current Status. Energy Policy 2007, 35, 4177–4189. [Google Scholar] [CrossRef]
  87. Durango-Cordero, J.; Saqalli, M.; Parra, R.; Elger, A. Spatial Inventory of Selected Atmospheric Emissions from Oil Industry in Ecuadorian Amazon: Insights from Comparisons among Satellite and Institutional Datasets. Saf. Sci. 2019, 120, 107–116. [Google Scholar] [CrossRef] [Green Version]
  88. Elvidge, C.D.; Baugh, K.; Zhizhin, M.; Hsu, F.C.; Ghosh, T. VIIRS Night-Time Lights. Int. J. Remote Sens. 2017, 38, 5860–5879. [Google Scholar] [CrossRef]
  89. WFS. Services of the Ecuadorian Environmental Ministry. Available online: http://mapainteractivo.ambiente.gob.ec/geoserver/wfs (accessed on 5 November 2019).
  90. WFS. Services from Ecuadorian Geospatial Insitute. Available online: http://www.geoportaligm.gob.ec/portal/index.php/descarga-de-servicios-wfs-del-igm/ (accessed on 5 November 2019).
  91. Solov’yanov, A.A. Associated Petroleum Gas Flaring: Environmental Issues. Russ. J. Gen. Chem. 2012, 81, 2531–2541. [Google Scholar] [CrossRef]
  92. Oseji, O.J. Environmental Impact of Gas Flaring within Umutu-Ebedei Gas Plant in Delta State, Nigeria. Arch. Appl. Sci. Res. 2011, 3. Available online: https://www.scholarsresearchlibrary.com/abstract/environmental-impact-of-gas-flaring-within-umutuebedei-gas-plant-in-delta-state-nigeria-3885.html (accessed on 19 December 2019).
  93. Seiyaboh, E.I.; Izah, S.C. A Review of Impacts of Gas Flaring on Vegetation and Water Resources in the Niger Delta Region of Nigeria. Int. J. Econ. Energy Environ. 2017, 2, 48–55. [Google Scholar] [CrossRef] [Green Version]
  94. Uzoma, H.C.; Maduka, O. Physico-Chemical Characteristics of Rainwater in a Nigerian Rural Community Experiencing Gas Flaring. J. Environ. Earth Sci. 2015, 5, 105–117. Available online: https://www.iiste.org/Journals/index.php/JEES/article/view/26545 (accessed on 19 December 2019).
  95. Odjugo, P.A.O.; Osemwenkhae, E.J. Natural Gas Flaring Affects Microclimate and Reduces Maize (Zea Mays) Yield. Int. J. Agric. Biol. 2009, 11, 408–412. [Google Scholar] [CrossRef] [Green Version]
  96. Argo, J. Unhealthy Effects of Upstream Oil and Gas Flaring: A Report Prepared for Save Our Seas and Shores (SOSS) for Presentation Before the Public Review Commission into Effects of Potential Oil and Gas Exploration, Drilling Activities within Licences; Save Our Seas and Shores (SOSS), Nova Scotia. 2002. Available online: https://www.osti.gov/etdeweb/biblio/20291224 (accessed on 5 November 2019).
  97. Ozabor, F.; Obisesan, A. Gas Flaring: Impacts on Temperature, Agriculture and the People of Ebedei in Delta State Nigeria. J. Sustain. Soc. 2015, 4, 5–12. [Google Scholar] [CrossRef]
  98. Nduka Ojeh, V. Sustainable Development and Gas Flaring Activities: A Case Study of Ebedei Area of Ukwuani LGA, Delta State, Nigeria. Resour. Environ. 2012, 2, 169–174. [Google Scholar] [CrossRef]
  99. Strosher, M. Investigations of Flare Gas Emissions in Alberta. 1996. Available online: https://www.osti.gov/etdeweb/biblio/430151 (accessed on 5 November 2019).
  100. Anomohanran, O. Thermal Effect of Gas Flaring at Ebedei Area of Delta State, Nigeria. Pac. J. Sci. Technol. 2012, 13, 555–560. Available online: http://www.akamaiuniversity.us/PJST13_2_555.pdf (accessed on 19 December 2019).
  101. Iyorakpo, J.; Iyorakpo, J.; Odibikuma, P.W. Impact of gas flaring on the built Environment: The case of Ogba/Egbema/Ndoni Local Govt Area, Rivers State, Nigeria. Eur. Sci. J. 2015, 11, 83–95. Available online: https://eujournal.org/index.php/esj/article/view/6232 (accessed on 19 December 2019).
  102. Elvidge, C.; Zhizhin, M.; Hsu, F.-C.; Baugh, K. VIIRS Nightfire: Satellite Pyrometry at Night. Remote Sens. 2013, 5, 4423–4449. [Google Scholar] [CrossRef] [Green Version]
  103. VIIRS. Nightfire Nighttime Detection and Characterization of Combustion Sources. Available online: https://eogdata.mines.edu/download_viirs_fire.html (accessed on 5 November 2019).
  104. Global Gas Flaring Observed from Space. Available online: https://www.ngdc.noaa.gov/eog/viirs/download_global_flare.html (accessed on 5 November 2019).
  105. Biosphere Reserves—Learning Sites for Sustainable Development. Available online: http://www.unesco.org/new/en/natural-sciences/environment/ecological-sciences/biosphere-reserves/ (accessed on 5 November 2019).
  106. En Ishpingo se prevé perforar pozos y construir un oleoduct|El Comercio. Available online: https://www.elcomercio.com/actualidad/ishpingo-preve-perforar-pozos-oleoducto.html (accessed on 18 December 2019).
  107. New Round of Oil Drilling Goes Deeper into Ecuador’s Yasuní National Park. Available online: https://www.theguardian.com/environment/2018/jan/10/new-round-of-oil-drilling-goes-deeper-into-ecuadors-yasuni-national-park (accessed on 5 November 2019).
  108. Ministerio de Ambiente del Ecuador. Sistema de Clasificación de Los Ecosistemas Del Ecuador Continental, Subsecretaría de Patrimonio Natural. 2012. Available online: http://www.ambiente.gob.ec/wp-content/uploads/downloads/2012/09/LEYENDA-ECOSISTEMAS_ECUADOR_2.pdf (accessed on 5 November 2019).
  109. Cochrane, M.A.; Laurance, W.F. Fire as a Large-Scale Edge Effect in Amazonian Forests. J. Trop. Ecol. 2002, 18, 311–325. [Google Scholar] [CrossRef] [Green Version]
  110. Loperte, S.; Calvello, M.; Faruolo, M.; Giocoli, A.; Alfredo Stabile, T.; Trippetta, S. The Contribution of the Scientific Research for a Less Vulnerable and More Resilient Community: The Val d’Agri (Southern Italy) Case. Geomat. Nat. Hazards Risk 2019, 10, 873–897. [Google Scholar] [CrossRef] [Green Version]
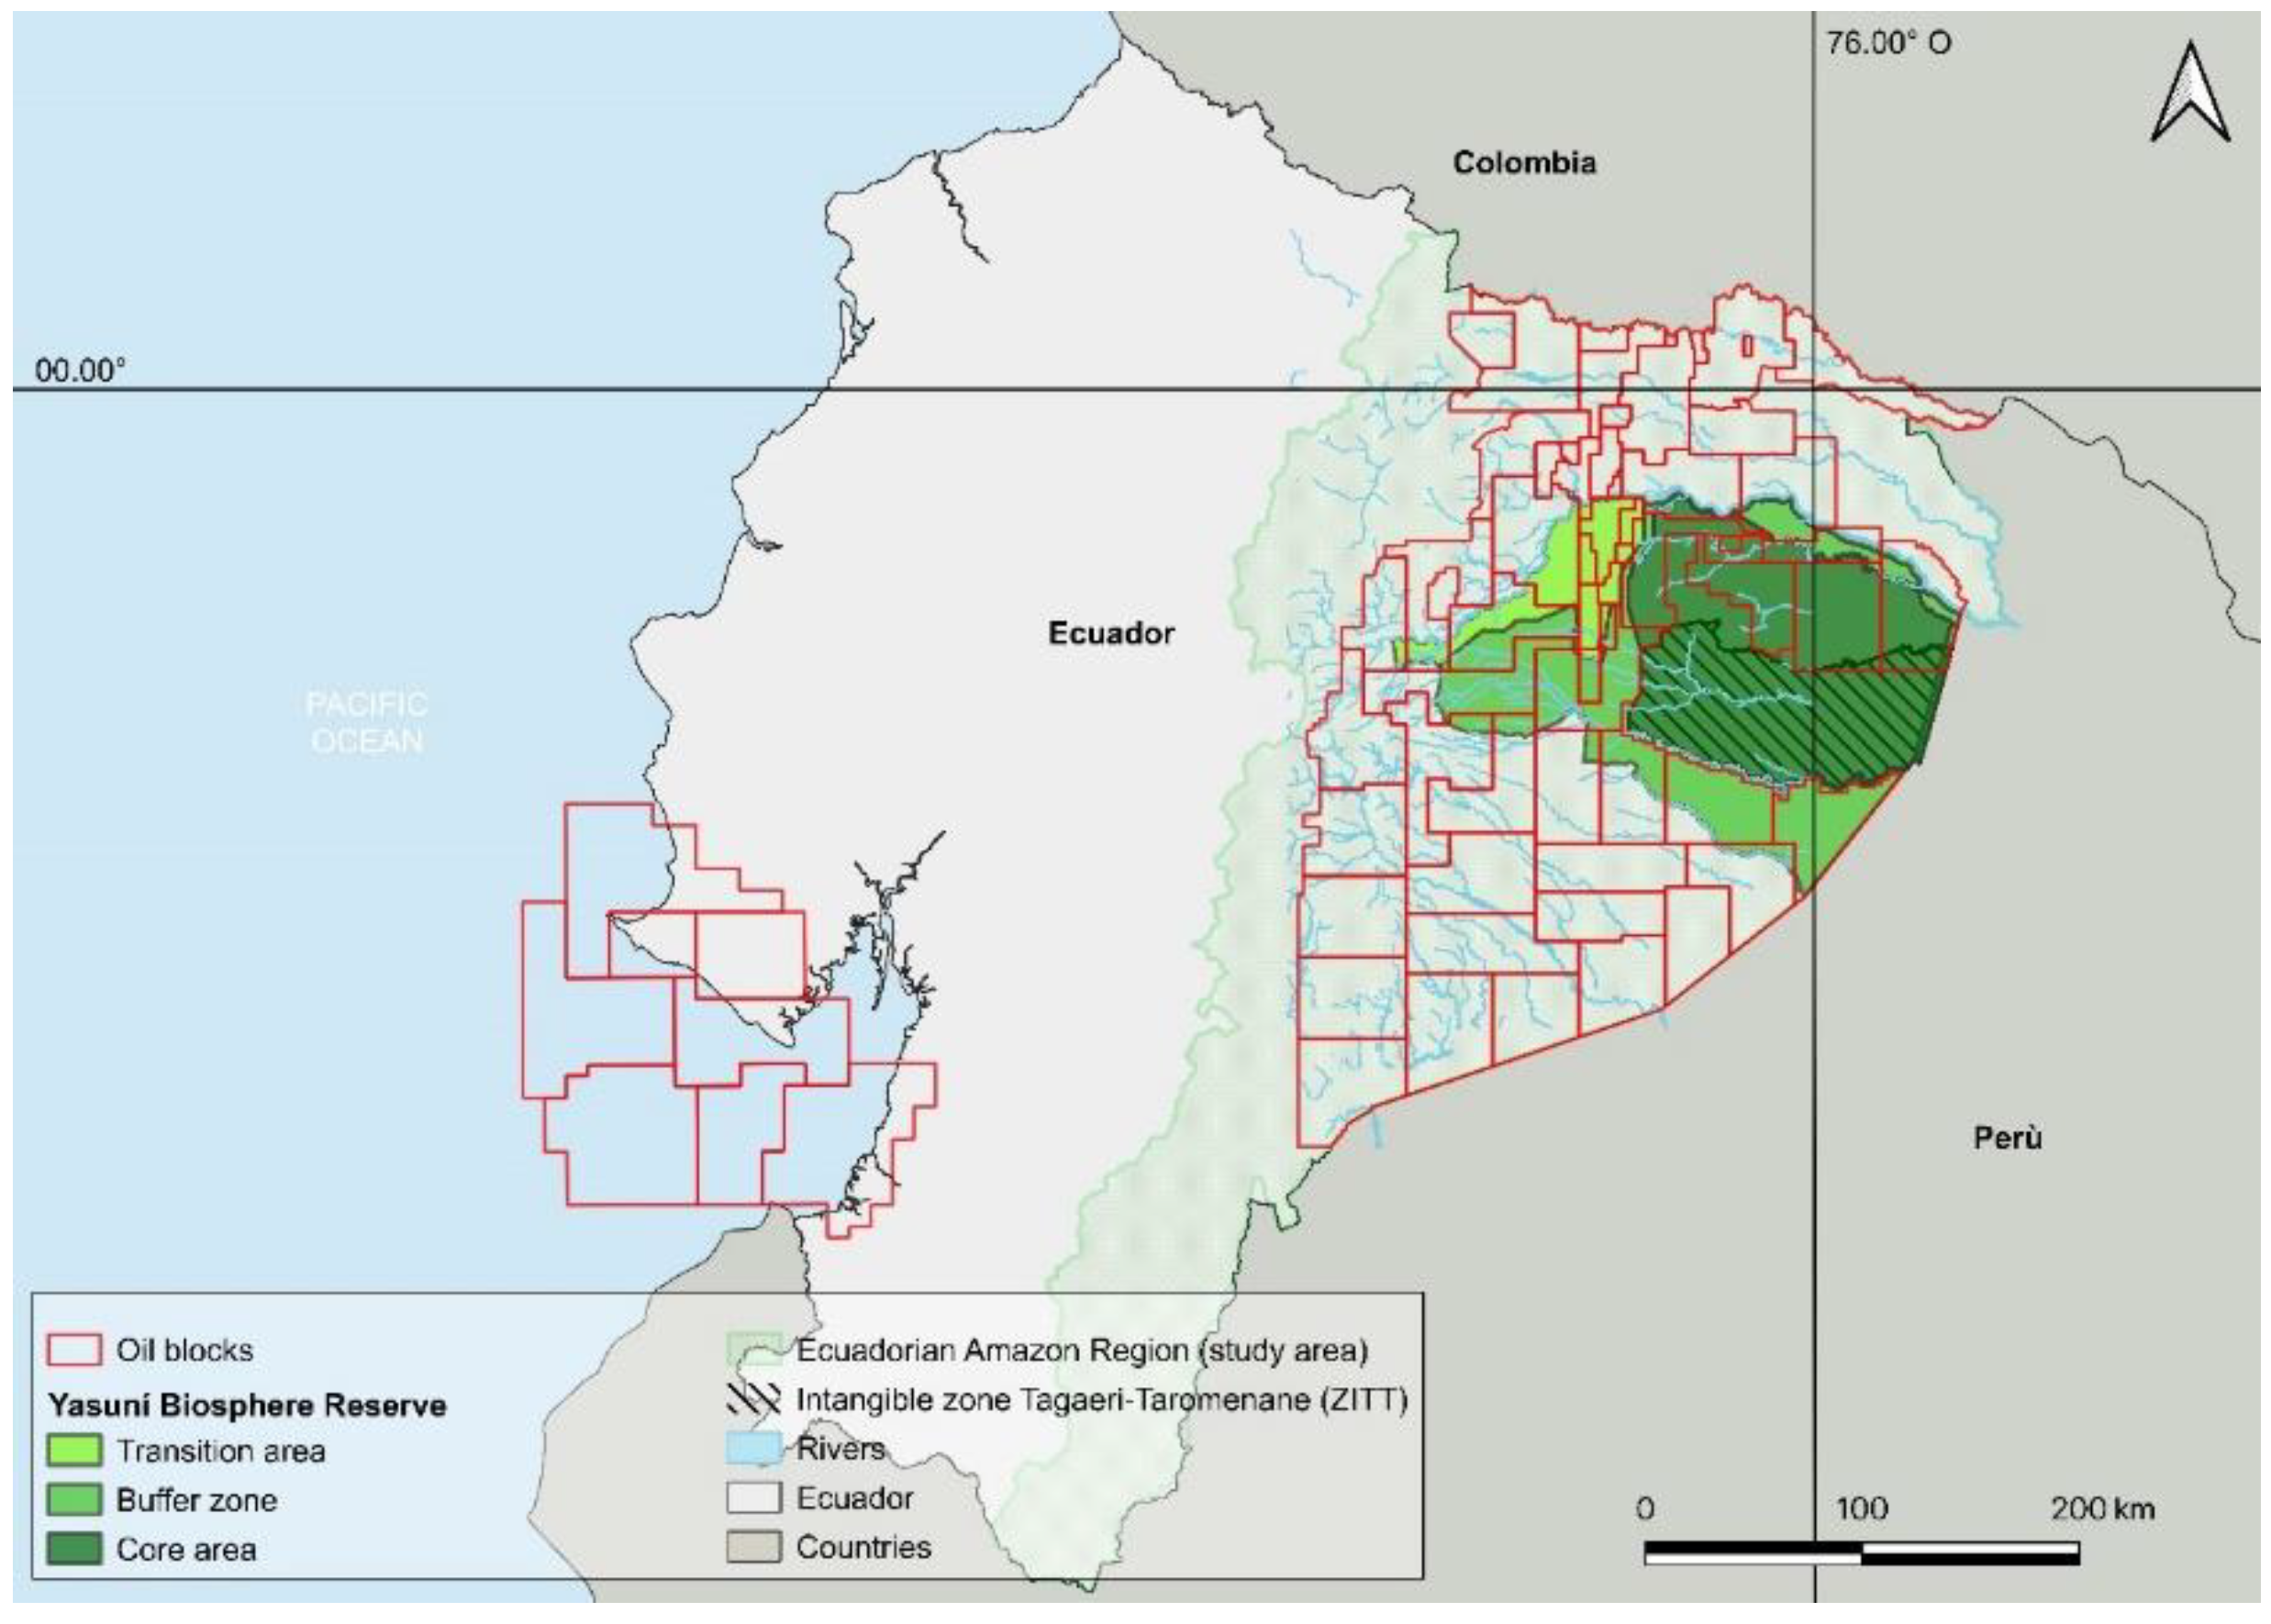
Figure 1. Study areas: the Ecuadorian Amazon Region, the Yasuní Biosphere Reserve and the oil concessions for fossil fuel production.
Sustainability 12 00058 g001
Figure 2. Gas flaring plant in the Auca oil field (Orellana Province of Ecuador). Ecuador (picture with DJI Mavic 2 Pro, date 02/06/2019) This is a common example of gas flaring practices in the Ecuadorian Amazon: not confined torch, proximity to rainforest ecosystems. Notice the bare soil resulting from the higher temperature close to flare stack.
Sustainability 12 00058 g002
Figure 3. Workflow diagram showing functions and geo/processes used to extract new gas flaring sites and currently active gas flaring sites.
Sustainability 12 00058 g003
Figure 4. Flare sites activity in EAR and Yasuní Biosphere Reserve (YBR) from 2012 to 2018.
Sustainability 12 00058 g004
Figure 5. Boxplots showing the frequency distribution of: (a) volume of flared gas; (b) number of site detections.
Sustainability 12 00058 g005
Figure 6. Distribution and average estimated flared gas (in million cubic meters) of gas flaring sites in 2016 from 2012 to 2018.
Sustainability 12 00058 g006
Figure 7. Map showing: 1) the additional gas flaring sites identified and validated in this study; 2) the sites from the NOAA 2012/2018 annual datasets which were identified as active or not from our daily detection analysis; 3) all the detections from 01/01/2017 to 15/04/2019.
Sustainability 12 00058 g007
Figure 8. Map of the dual spatial validation through Google Earth Pro (GEP) and the ground truth. The validation is related to the additional gas flaring sites identified through our elaboration of daily detection data from 01/01/2017 to 04/04/2019 and those not included in the NOAA annual datasets for 2017 and 2018, but with detected activity in previous years.
Sustainability 12 00058 g008
Figure 9. Gas flaring site detections and potentially affected areas in the Tiputini oil field (Block 43) compared with UNESCO YBR zoning (9a) and MAE ecosystems (9b).
Sustainability 12 00058 g009
Figure 10. Gas flaring potentially affecting areas of ecosystems and Yasuní Biosphere Reserve in precautional (2 km radius) and conservative (650 m radius) scenarios.
Sustainability 12 00058 g010
Figure 11. Map of the potentially affected areas around the gas flaring sites in the precautional (5 km radius) and conservative (650 m radius) scenarios.
Sustainability 12 00058 g011
Table 1. Metrics of impacts found through the literature survey.
Distance (m)ImpactTargetSource
5000Hazardous chemical contamination of airHumanArgo, 2001 [96]
650Temperature alterationEnvironmentOzabor and Obisesan, 2015 [97]
650Pollutants above U.S. Environmental Protection AgencyconcentrationsHumanNduka Ojeh V, 2012 [98]
2000Alteration of microclimate, soil parameters and 50% decrease in mays yieldEnvironmentOdjugo, 2009 [95]
1350Particulate matter above World Health Organization limitsHumanStrosher, 1996 [99]
2000Temperature alterationEnvironmentAnomoharan, 2012 [100]
2000Lead in rainwater above World Health Organization limitsHumanUzoma, 2015 [94]
1000Damages to buildingsHumanIyorakpo, 2015 [101]
Table 2. Gas flaring sites identified and gas volume estimations in the years 2012–2018 in the Ecuadorian Amazon Region (EAR) (MCM = million cubic meter of methane flared). Sites without flaring activity during the previous year were considered as activated and defined as new gas flaring sites.
2012201320142015201620172018Total
Gas flaring sites active each year58626967847768102
Active new gas flaring sites-7103198754
Closed gas flaring sites33521516-44
Variation of gas flaring sites (%)+0.0+6.9+11.3−2.9+25.4−8.3−11.7+17.2
Total flared gas (MCM)81880710061069116910869336888
Variation of flared gas (%)+0.0-1.3+24.6+6.3+9.3−7.1−14.0+14.1
Flared gas from the activated new gas flaring sites in the study period (MCM)-1776145220361044
% of flared gas from the new gas flaring sites 0.02.27.51.34.41.83.815.1
Table 3. Gas flaring sites identified with the Earth Observation Group (NOAA) Nightfire algorithm in the years 2012–2018 in the Yasuní Biosphere Reserve (MCM = million cubic meter of methane flared).
2012201320142015201620172018Total
Gas flaring sites active each in YBR1515151520161224
Flared gas in YBR (MCM)1861661951782101731591268
Gas flaring sites in YBR/Core00000000
Flared gas in YBR/Core (MCM)00000000
Gas flaring sites in YBR/Buffer33332213
Flared gas in YBR/Buffer (MCM)74465443574649369
Gas flaring sites in YBR/Transition1212121218141121
Flared gas in YBR/Transition (MCM)112120141135153127110898
Table 4. Additional gas flaring sites identified through the elaboration of the NOAA Nightfire daily detection data from 01/01/2017 to 15/04/2019.
Flare idIncluded in the NOAA 2012/2016 DatasetDetection NumberFirst Detection Date
(yyyy/mm)
Last Detection Date (yyyy/mm)Identified with Google Earth ProDate of Google Earth Pro Imagery
(yyyy/mm)
Ground Validation
1X682017/062019/04X2016/10X
2X272017/072019/04 2012/1X
3 252017/122019/04 2007/9X
4X252017/032019/03X2018/9X
5 162018/082019/04 low resolutionX
6X152017/082019/04 2012/01X
7 142018/072019/04X2017/12X
8 142017/102019/04 2003/08X
9 122018/092019/04 2017/12X
10 112017/092019/01 2016/10X
11 112018/032019/04 2012/01X
12 102019/012019/04 2017/12X
13 102018/122019/04X2018/9X
14 92017/102019/04Clouds2017/12X
15X92017/092018/12X2014/08X
16 92018/092019/02X2018/02X
17X92019/012019/04 2017/12X
18X82017/062019/04 2014/08X
19 62019/032019/04 2018/09X
20 62017/082019/04X2014/08X
21 62018/032019/04X2018/03No data
22 62018/032019/04 2012/06X
23 52019/032019/04 2014/08X
24 52019/012019/04 2012/01X
25 42017/102019/01 2012/01X
26 42018/062019/01 2014/10X
27 42018/032019/04 low resolutionNo data
28 42018/012019/01 2014/10X
29 42018/092019/03X2017/12X
30 42019/032019/04 2018/09X
31 42017/032018/05X2017/12X
32X42017/072019/03 2012/01X
33 32018/052019/04 low resolutionX
34 32018/102019/04 2015/10No data
35X32017/102019/04X2016/10X
36 32019/032019/04 2018/09
37 32018/042018/09 2007/05X
Total9-2017/012019/0411-32
Table 5. Tropical ecosystems potentially affected by gas flaring activities in the Ecuadorian Amazon Region in 2017, in precautional (2 km radius) and conservative (650 m radius) scenarios.
Ecosystems as Categorized from Environment Ministry of Ecuador [108]CodeImpacted Area:
Precautional Scenario (km2)
Impacted Area:
Conservative Scenario (km2)
Bosque inundable de la llanura aluvial de los ríos de origen amazónicoBsTa070.780
Bosque inundado de la llanura aluvial de la AmazoníaBsTa091.00.1
Bosque inundado de palmas de la llanura aluvial de la Amazonía BsTa1022.81.2
Bosque siempreverde de penillanura del sector Aguarico/Putumayo/CaquetáBsTa02254.022.7
Bosque siempreverde de penillanura y llanura del sector Napo/CurarayBsTa03221.322.6
Bosque siempreverde piemontano del norte/centro de la cordillera oriental de los AndesBsPa0123.72.6
Herbazal inundado lacustre/ripario de la llanura aluvial de la AmazoníaHsTa010.50
Total 524.149.3