Article

Does China’s Outward Direct Investment Improve the Institutional Quality of the Belt and Road Countries?

by
Chunyang Pan
1,
William X. Wei
2,*,
Etayankara Muralidharan
2,
Jia Liao
3 and
Bernadette Andreosso-O’Callaghan
4
1
Department of Economics, School of Business, East China University of Science and Technology (ECUST), Institute of Advanced Studies for Social Sciences at ECUST, Shanghai 200237, China
2
School of Business, MacEwan University, Edmonton, AB T5J 4S2, Canada
3
Department of International Economics and Trade, School of Business, Shanghai University of International Business and Economics, Shanghai 201620, China
4
School of Business, University of Limerick, V94 T9PX Limerick, Ireland
*
Author to whom correspondence should be addressed.
Sustainability 2020, 12(1), 415; https://doi.org/10.3390/su12010415
Submission received: 26 November 2019 / Revised: 1 January 2020 / Accepted: 3 January 2020 / Published: 5 January 2020

Abstract

:
This article investigates the effects of China’s outward direct investment (ODI) on the institutional quality of the Belt and Road (B&R) countries. Based on a panel data set of 63 B&R countries during the period 2003 to 2016, we find that China’s ODI improves the institutional quality of B&R countries not only in the short run but also in the long run. Further, although China’s ODI exerts no differential impacts on host country institutional dimensions of “control of corruption,” “government effectiveness,” and “political stability” in countries with different natural resource endowments, it improves their institutional dimensions of “regulatory quality” and “rule of law,” implying that China’s ODI may help the host B&R countries minimize the “resource curse”. As one of the most important strategies for China’s opening-up development in the current era, the B&R initiative serves as means to promote sustainable development of B&R countries. The article therefore contributes to existing scholarship on the institutional effects of China’s ODI and sheds light on the mechanisms that drive sustainable development.

1. Introduction

Scholars have long recognized that better institutional quality of host countries encourages inflows of foreign direct investment (FDI) [1,2,3,4,5,6,7,8,9,10]. However, research on the direct role of FDI in host country institutional development or reform is limited [11]. The quality of a country’s institutions plays an important role to realize the Sustainable Development Goals of the United Nations [12]. With the accumulation of FDI and the increasing international expansion of multinational corporations (MNCs), scholars suggest that the MNCs are not passive observers in host countries but are active players in terms of political and economic issues.
Extant research suggests that FDI affects not only the economic development, but also government policies and the institutional quality of host countries [13,14,15,16,17,18,19]. However, there is still no consensus, both theoretically and empirically, that inward FDI improves the institutional quality of host countries. Kwok and Tadesse [15] found that FDI flow reduced the host-country corruption levels. However, Olney [20] found that competition for FDI from the US led to undercutting of regulatory labor markets among the host countries. FDI inflows helped improve property rights protection, accountability, rule of law, tax policies, and business regulations in host countries [21,22,23].
Many recent studies have confirmed the positive effect of FDI, emanating mostly from developed countries, on the institutional quality of host countries. Scholars have found that MNCs from developed economies bring advanced management skills, sound business practices and industrial regulation policies, which promote institutional reform within the host countries [15,16,22]. This stems from the fact that the investing firm, originating from an advanced economy and investing in a developing or emerging country, holds several firm specific advantages. However, another strand of the ODI literature points to a less positive impact of direct investment in host countries that are developing economies [13,18,24]. In particular, certain behaviors among MNCs from developed countries investing in developing countries have raised concerns about the darker side of FDI. To some extent, the above negative findings of FDI have increased the international community’s doubts about the rapid expansion of MNCs in general. Investigations have found that these enterprises pay bribes and send informal gifts to government officials to stimulate business growth in (for instance) China, India, and Pakistan [25]. The above findings are therefore mixed in terms of the effects of FDI from developed countries on institutional quality of the host country. Also, given the recent increase in FDI from developing countries, influence of FDI from developing countries on host country institutions is an area that needs to be explored further. Particularly, FDI from Chinese firms has increased substantially in the recent past [26]. Chinese MNCs, because of their strong demand for natural resources, are often eager to invest in countries with relatively abundant natural resources [27,28,29,30,31,32,33]. Is it possible that those countries would blindly rely on China’s natural resources demand, ignore the need for institutional development, and ultimately fall under the “resource curse” syndrome? These topics are hotly debated in existing literature, but such debates are mainly qualitative judgments or analyses of a few cases, and lack rigorous empirical evidence. In our study we attempt to address the above gaps in the context of China’s increasing ODI into the Belt and Road (B&R) countries.
B&R countries, which account for about 43 per cent of the world’s population (please see Figure 1), is a key destination for China’s ODI [34]. The level of economic development in B&R countries is lower than the world average. World Development Indicators (WDI) reveal that in 2016, the average GDP per capita of this region was about $3815, accounting for only 37.4 per cent of the world average. The same year also witnessed uneven economic development among B&R countries. In 2016, Qatar, Singapore, and the United Arab Emirates ranked as the top three in GDP per capita terms, achieving 59.3, 53.0, and 37.6 thousand USD, respectively. In contrast, Afghanistan, Nepal, and Tajikistan ranked as the bottom three, with GDP per capita of $562, $729, and $796, respectively. Nevertheless, it must be noted that, during the 2000s, B&R countries have made great progress in terms of economic development and economic size. The gap between the region’s GDP per capita and the world average narrowed generally from 2003 to 2016. The total GDP of this region as a percentage of the world total also increased from 10.7 to 16.3 per cent during the same period (please see Figure 2). Meanwhile, China’s ODI into B&R countries has increased significantly. During the period between 2003 and 2016, China’s ODI flow as a percentage of the total FDI inflows to this region increased from 0.22 to 5.32 per cent, while China’s ODI stock ratio increased from 0.15 to 2.78 per cent (please see Figure 2). Hence, China has gradually become one of the B&R region’s most important FDI sources.
The B&R initiative, proposed by President Xi JinPing during his visits to Central and Southeast Asian countries in September and October 2013, has received great attention from the international community and further promote China’s ODI into this region. While the B&R initiative encompasses many areas of economic integration and global governance [35], it is specifically an infrastructure-led economic integration plan for integrating China’s trading partners by developing their infrastructure (i.e., ports, roads, airports, railways, etc.,).The initiative manifests a Chinese commitment to investing in a variety of infrastructure projects in order to strengthen the economic capacity and connectivity among the B&R countries [36]. In the recent past scholars have paid considerable attention to this initiative which has specifically aimed to invest in better connecting Europe, Middle East, Central Asia, South-East Asia, and China [37,38,39,40]. Along with economic integration the B&R initiative is also considered as a vehicle toward sustainable development [41,42,43]. This initiative, which is an initiative for regional cooperation is suggested to have a positive impact on the sustainable development of all the countries involved [44]. Through the various regional cooperation measures of this initiative it is expected to encourage regional economic advancement and social development that drive sustainable development [45]. Scholars specifically suggest that the B&R initiative’s objectives to provide increased accessibility to public goods to the global community through effective communication, better connectivity, increased trade flows, and improved financing leads to prosperity that ultimately promotes sustainable development [44]. Preliminary research has also examined the initiatives’ association with the ecological footprint through positive environmental spillovers in the countries involved [45]. Further, consistent with institutional theory it has been suggested by extant research that the quality of a country’s institutions plays an important role to realize the Sustainable Development Goals of the United Nations [12]. It is in the above context that we examine the role of FDI from China in the institutional development of the B&R countries.
Scholars have used Worldwide Governance Indicators (WGI) to develop an understanding of the institutional quality. During the period 2003 to 2016, indicators of government effectiveness, regulatory quality, and rule of law were rising continuously in the B&R countries. The corruption control indicator started to rise in 2011, whereas political stability and voice and accountability stayed roughly stable during this period (please see Figure 3). Because institutional quality, as mentioned earlier, is critical to a country’s productivity enhancement, long-term economic growth, and consequently sustainable development [46,47], the specific question that is addressed in this study is whether China’s ODI improves the institutional quality of B&R countries. This research question is all the more topical, pertinent, and challenging in that an answer to this question will enrich the current body of research on the institutional effects of direct investment particularly in the case of China (a developing economy) as an investor, which is very much an unexplored issue. As a consequence, it will shed light on the sustainable development prospects of the B&R initiative.
The current study, therefore, operates at the interface of the literature on the impact of FDI on host countries and the literature on the determinants of institutional quality and contributes to the broader scholarship on economic integration and sustainable development. Our research specifically makes the following contributions to the above literature. First, it is the first attempt to test the institutional effects of China’s ODI on the B&R countries, which enriches the current body of research on the institutional effects of FDI from developing countries. Second, it tries to distinguish the institutional effects among countries with different natural resource endowments. Third, from an empirical perspective, compared with the existing literature that focuses either on one aspect of institutional quality, such as corruption [15,18,19], or on some aggregated index of institutional quality [13,22], this study tests the effects on all the six identified WGI indicators of institutional quality separately. We therefore use a fine-grained approach for measuring institutional quality.
Using a panel data set of 63 B&R countries during the period 2003 to 2016, we apply a fixed effects model to mitigate the countries’ culture and geographical heterogeneity in examining the effects on institutional quality. We also extend the benchmark model to a dynamic setting that allows us to measure the institutional persistence over time and employ the difference GMM (generalized method of moments) estimator (i.e., Arellano-Bond estimator) to test the effects of China’s ODI on the institutional quality of host countries both in the long term and in the short term.
The structure of the article is as follows. In the next section we review the theory on the effects of FDI on institutional quality and derive testable hypotheses. Thereafter, we introduce the methods section wherein we discuss the data, the variables used, estimation methods, and present our results. Finally, we discuss our findings and conclude.

2. Theory and Hypotheses

2.1. Theories of Institutional Effect of FDI

Extant literature has examined the effect of FDI on host countries through various perspectives. Some scholars have examined the impact of FDI on host countries’ productivity [48,49], de-industrialization [50,51], and economic growth [38], while others have investigated the influence of FDI on the institutional quality of host countries and tried to disentangle the mechanisms behind it [3].
In less developed countries (which usually have a lower institutional quality), MNCs are likely to be more productive than their local counterparts are. Thus, the entry of MNCs would crowd out, or even replace, local firms and weaken market competition, resulting in higher economic rents and bribes to government officials and investors respectively [18,19,24]. Demir [13], for example, is concerned that the fierce competition between investors may encourage the foreign investors to bypass laws and regulations in host countries through corrupt practices to maintain their market shares. Pinto and Zhu [18] show that FDI is positively associated with levels of corruption in less-developed countries, but not in developed countries. Zhu [19] applies this theory to the context of China and verifies that provinces with more MNC activities tend to have a higher level of corruption. This “crowding out effect” implies that FDI may ultimately deteriorate the institutional quality of host countries.
Another strand of the literature focuses on the “demonstration effect” of MNCs. MNCs generally bring advanced information regarding management skills, business practices, and industry regulation into host countries, which may assure the local governments of the importance of a sound institutional environment in attracting more FDI and enhancing their countries’ international reputation [15]. Based on this argument, Kwok and Tadesse [15] found that FDI generates a positive spillover effect on the institutional environment of host countries; in particular, it reduces their degree of corruption. Zeng and Eastin [52] show that in order to establish a good reputation, the MNCs from less developed countries also have the incentive to adopt a sound environmental practice in host countries, rather than transfer the home countries’ poor practices across borders, which exerts a positive spillover effect on environmental practices of host-country firms.
MNCs can also affect the host-country institutional quality through lobbying and exerting pressure on local governments. It is widely accepted that MNCs have long-term interests in host countries and are deeply embedded in local markets, and hence that they tend to engage in a governance process and alter the host institutional environment for their own benefit by entering the domestic political process [53,54,55]. By examining 27 transition economies, Malesky [16] notes that MNCs have the incentive to lobby the local government and to raise the probability of economic reforms carried out by the host-government. Ali, Fiess, and Macdonald [21] argue that foreign investors have an incentive to lobby for institutional change when faced with an inefficient business climate, and they find a positive effect of FDI inflows on property rights protection of host countries. In the case of Vietnam and China, Dang [22] and Long et al. [23] found a positive institutional effect of FDI inflows, which also lends support to the “lobbying effect”.
Some scholars go a step further and argue that the direction of FDI’s institutional effect partly depends on the institutional environment of the home country [15,56]. The behavior of MNCs may be strongly constrained by the home country government. For example, the United States enacted the Foreign Corrupt Practices Act of 1977, prohibiting American businesses from offering bribes to foreign governments. The United Kingdom also introduced the Bribery Act in 2011 to combat bribery practices among British companies, both at home and abroad. This regulatory pressure from the home country raises opportunity costs for the MNCs engaging in corrupt behavior in order to secure business [15]. Prakash and Potoski [56] demonstrate that the institutional effects of FDI are not associated with how much FDI host countries receive, but rather, where they receive it. They found that FDI improves the ISO 14001 adoption rate (an environmental management standard) of host countries only when the FDI comes from home countries with high levels of this environmental management standard. Demir [13] argues that when investing in developing countries, developed countries push forward conditionality requirements in order to put pressure on the host government to improve its institutional environment. To a certain degree, this “regulation pressure effect” from the home country confines MNCs’ behavior to a legitimate framework, which lays the foundation for positive institutional effects induced by FDI.
It is also worth noticing that the causal relationship between FDI and institution operates both ways. A large body of the literature holds that sound institutional quality of host countries encourages FDI inflows [1,2,3,4,10]. This fact increases the difficulty in explaining the causality between China’s ODI and institutional quality of B&R countries, which is the focus in our current study. We, therefore, employ the difference GMM method (i.e., Arellano-Bond estimator) into a panel data model to address the above issue.
Based on the above literature review, we can infer that the institutional effect of FDI depends on several factors, including the competitiveness of MNCs relative to the local firms, the market structure in host countries, and the regulatory pressure from home countries. In contrast to the existing studies on this topic, the present study analyses the effects of China’s ODI on the institutional quality of B&R countries, which are mainly comprised of developing countries in Asia, Central and East Europe, and North Africa.

2.2. Chinese ODI and Institutional Quality of B&R Host Countries

First, to the extent that economic development serves as a proxy for the competitiveness and productivity of firms [18], we observe that China’s MNCs may have an advantage over the firms in B&R countries on average. The reason is that China’s GDP per capita (a typical indicator of economic development) is more than twice that of B&R countries (according to the WDI database, China’s GDP per capita reached $8123 (current price) in 2016, and the GDP per capita of B&R region reached $3750 (current price, calculated as the total GDP over total population of B&R countries). This lays the foundation for the demonstration effect. Second, China’s ODI into B&R countries accounts only for a small share of total FDI absorbed by this region, which is increasing over time, but which has never exceeded 7% historically (please see Figure 1). Hence, it is unlikely that Chinese MNCs will alter the local market structure and gain a monopolistic status completely. Third, the Chinese government implemented a series of laws and regulations in order to monitor the operation and investment behaviors of Chinese MNCs, which include the measures on overseas investment administration issued by the Ministry of Commerce in 2009, the Measures on Overseas Investment Authorization and Registration issued by the National Development and Reform Commission in 2014, to name a few. All of these exert regulatory pressure on Chinese MNCs operating abroad. In summary Chinese ODI, we argue, is driven by “demonstration” and “regulatory” effects to facilitate improvement in the institutional quality of the host countries. Hence, our first hypothesis:
Hypothesis 1 (H1).
China’s ODI improves the institutional quality of B&R countries.
Another important motivation, as pointed out by extant research for China’s ODI is the country’s abundant need for natural resources. The role of multinational firms in resource rich countries and their interaction with the institutions of such countries is not well understood [57]. Countries rich in natural resources suffer from the “resource curse” where increased resources lead to reduced growth and development [57,58]. Institutional development of such countries is important to get over the “resource curse”. Recent studies have shown that countries with strong institutions of democratic accountability and rule of law tend to escape the resource curse, whereas those with weak institutions do not [59,60]. The negative effects of natural resource dependence on institutional development have been discussed extensively in literature [61]. The easy flow of revenues from natural resource exports may facilitate the formation of a rentier state, leaving little incentive for the government to improve its institutional quality [13].
China’s dependence on natural resources has been changing. Some empirical studies suggest that oil and metals are two determinants of China’s ODI location during 2003–2009 [43]. However, we cannot ignore the fact that the proportion of China’s ODI in the mining industry is declining over the time. After it reached 48 per cent of total Chinese realized ODI in 2003, this proportion decreased ever since. It has declined to 7.7 per cent and 1.0 per cent in 2015 and 2016 respectively. Meanwhile, the proportion of ODI in manufacturing, financial services, leasing, and business services have been increasing over time [62]. It is reported that high technology, real estate, finance, agribusiness, health care sectors, etc., have become the more favorable target sectors of investment [63]. That is to say that natural resources are losing their significance in China’s ODI. Hence, our second hypothesis:
Hypothesis 2 (H2).
China’s ODI exerts no systematically different impacts on the institutional quality of countries with different natural resource endowments.

3. Data and Method

According to the Statistical Bulletin of China’s Outward Foreign Direct Investment [62], there are 64 B&R countries (please see Table 1), which are located in Asia, Central and East Europe and North Africa. Considering the extraordinarily high institutional quality of Singapore, we exclude the data of Singapore from our regression analysis.
The geographical distribution of China’s ODI into B&R countries is quite unbalanced. The right panel of Table 2 lists the top 15 countries absorbing China’s ODI in terms of total stock in 2015 and shows that the average GDP per capita ($10,760) of these 15 countries is slightly higher than the world average ($10,191). However, if we consider the countries’ economic size and rank according to China’s ODI stock as a percentage of the host country’s GDP (a measurement of direct investment intensity), then the list of the top 15 countries changes dramatically. This group is mainly comprised of less developed countries (except Singapore and Kazakhstan) with average GDP per capita of $5700 in 2015 (please see the left panel of Table 2). Note that eight countries—Lao PDR, Mongolia, Cambodia, Singapore, Myanmar, Kazakhstan, Vietnam, and Pakistan—appear in both the left and right panels in Table 2, suggesting that these eight countries are important destinations of China’s ODI, regardless of whether we use absolute or relative measurements.
We now explain our key variables and data sources used for constructing them as follows.

3.1. Dependent Variable

The indicators of institutional quality (INSQ) are the explained variables. North [64] defines institutions as “humanly devised constraints that structure political, economic and social interactions”. Some scholars have developed indicators to quantify the institutional quality of a country or region, such as the aforementioned Worldwide Governance Indicators (WGI) introduced by Kaufmann and Kraay (For a detailed introduction to the WGI, the interested reader can refer to Kaufmann et al. [65] and to the WGI website: http://info.worldbank.org/governance/wgi/index.aspx#doc). These indicators are as follows:
(1)
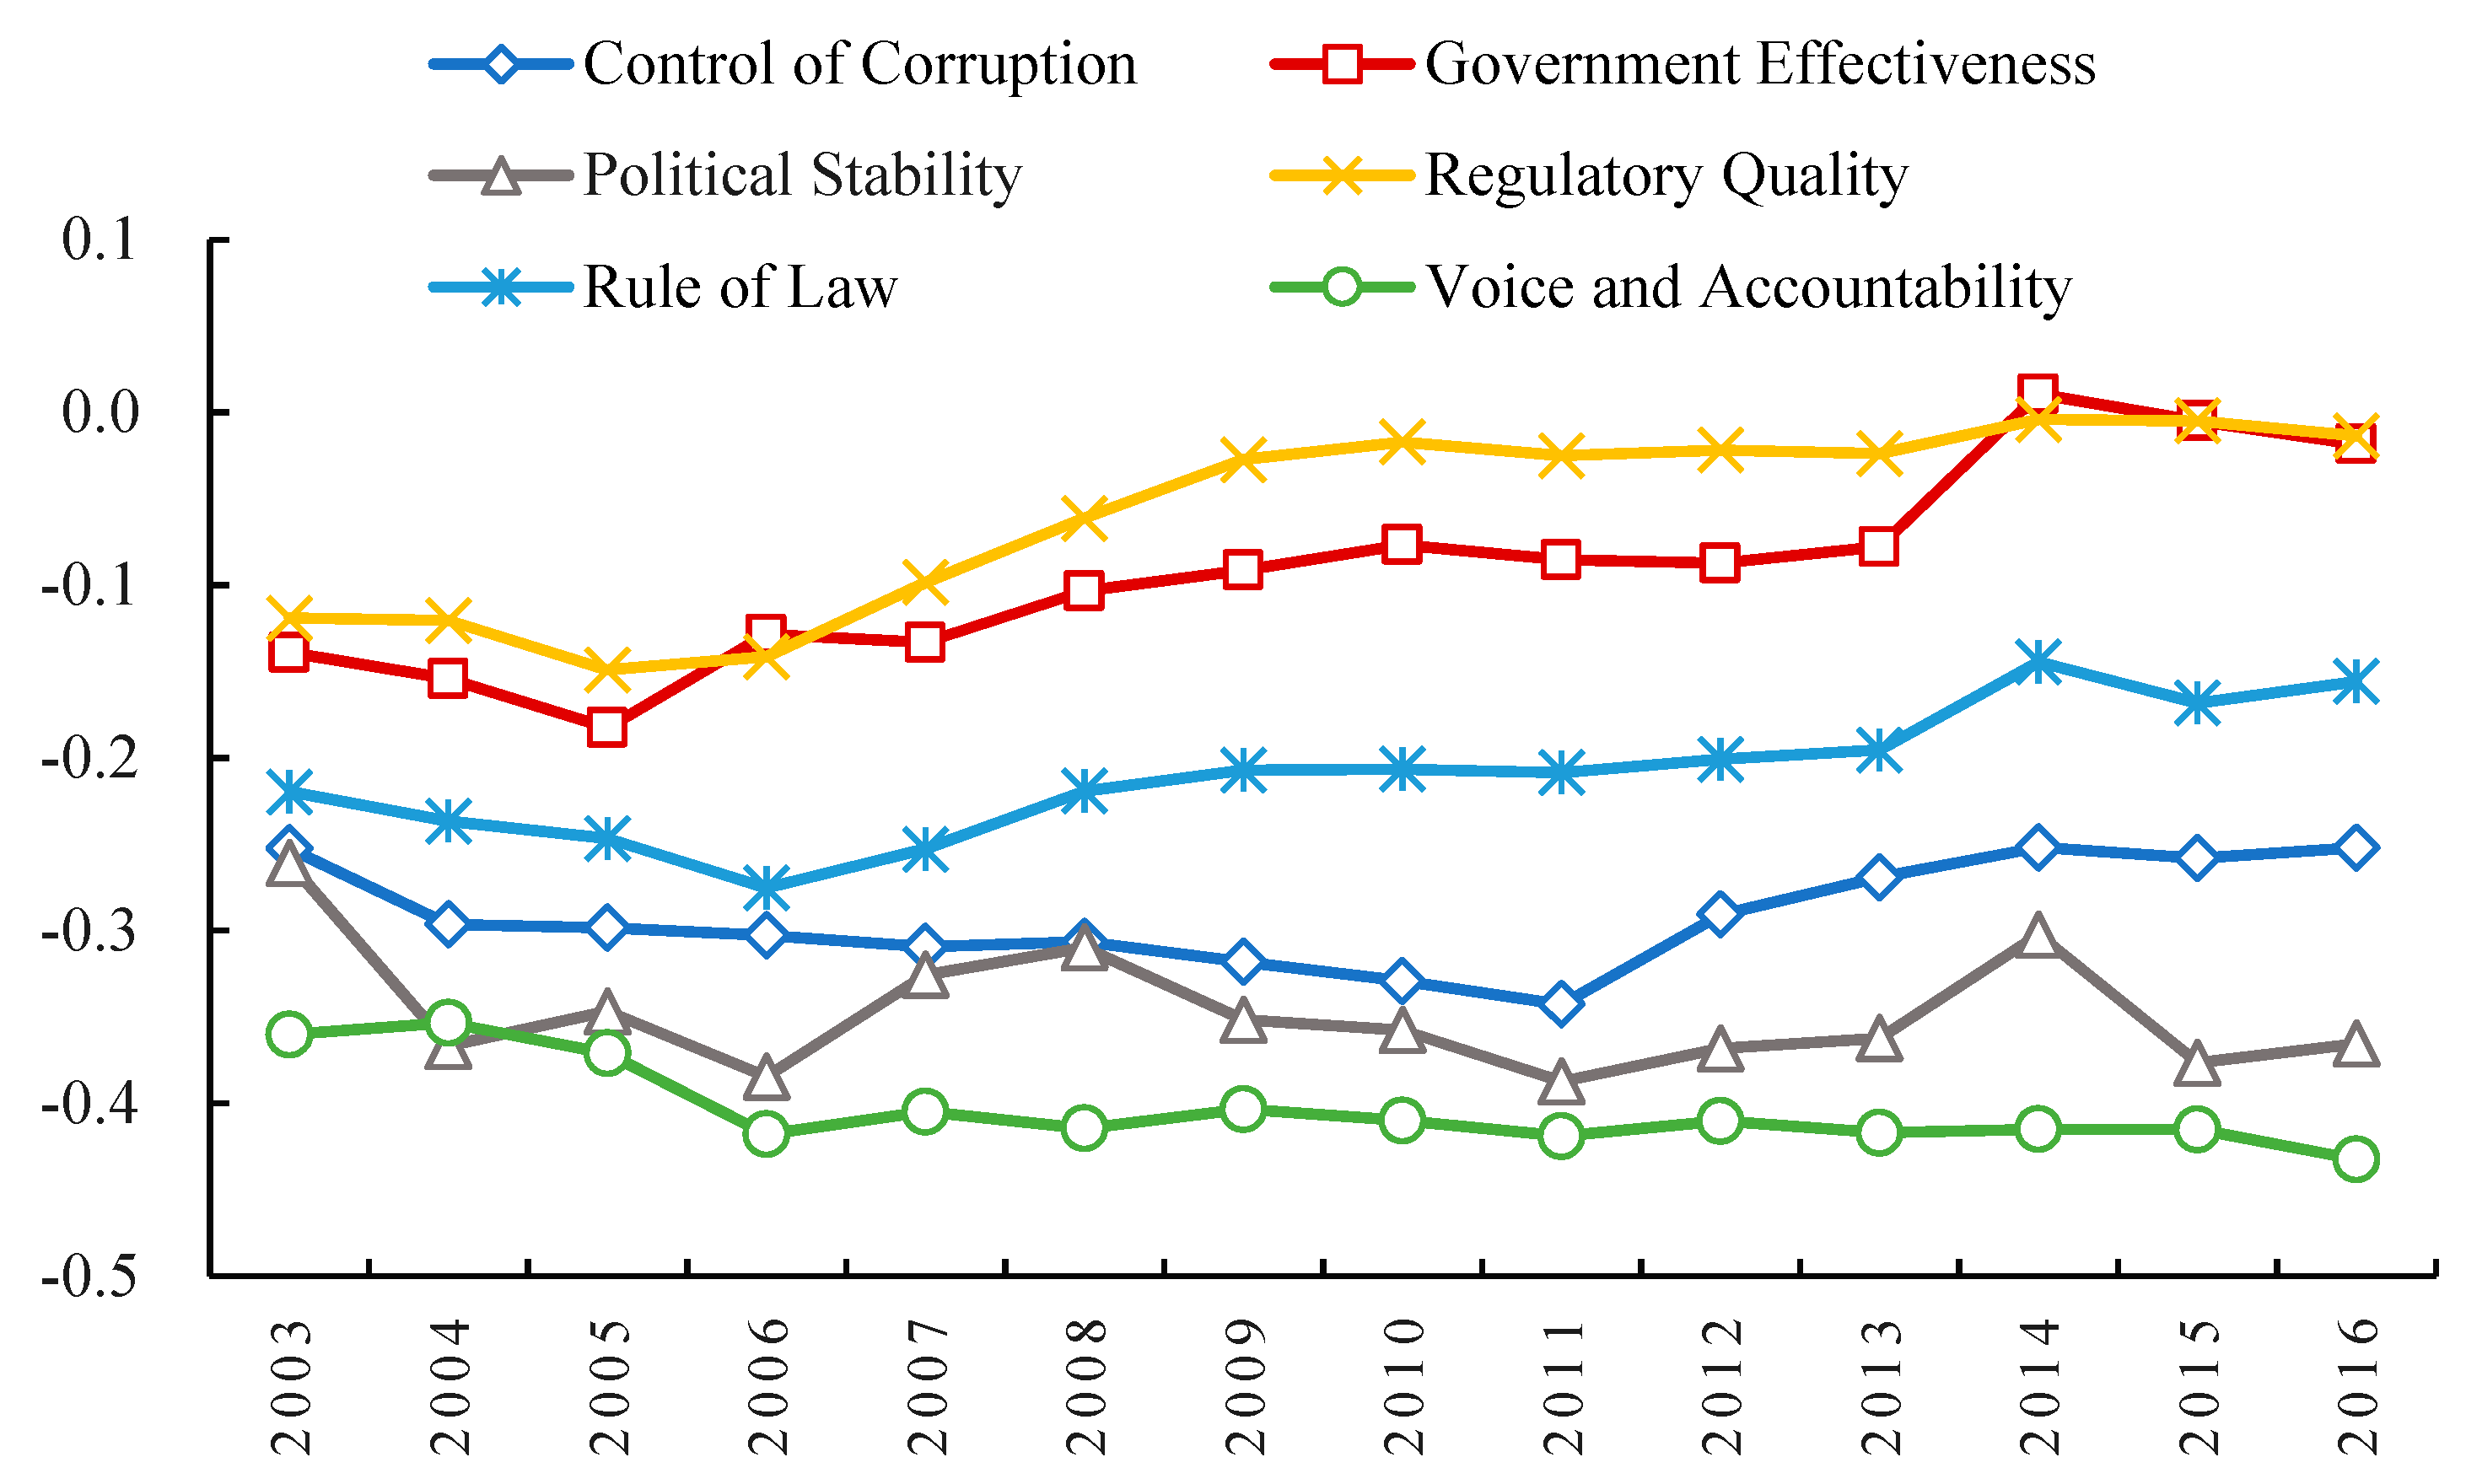
Control of corruption (CC) captures perceptions of the extent to which public power is exercised for private gain, including both petty and grand forms of corruption; it also gives an indication on the degree to which the state is “captured” by elites’ and private interests.
(2)
Government effectiveness (GE) captures perceptions of the quality of public services, the quality of the civil service, and the degree of its independence from political pressures, the quality of policy formulation and implementation, and the credibility of the government’s commitment to such policies.
(3)
Political stability and absence of violence/terrorism (PS) measures perceptions of the likelihood of political instability and/or politically motivated violence, including terrorism.
(4)
Regulatory quality (RQ) captures perceptions of the ability of the government to formulate and implement sound policies and regulations that permit and promote private sector development.
(5)
Rule of law (RL) captures the perceptions of the extent to which agents have confidence in and abide by the rules of society; it refers in particular to the quality of contract enforcement, property rights, the police and the courts, as well as the likelihood of crime and violence.
(6)
Voice and accountability (VA) captures perceptions of the extent to which a country’s citizens are able to participate in selecting their government, as well as freedom of expression, freedom of association and a free media.
The WGI website contains data on 215 countries from the year 1996. WGI permits meaningful cross-country and over-time comparisons, even after taking the measurement error into account [65] and is widely used in empirical studies in international business, institutional economics, and political science [66,67,68,69]. Therefore, we use the WGI to measure the institutional quality of the host countries.
Further, we also argue that institutional quality is a construct which is difficult to be captured in a single indicator. We therefore use a fine-grained approach for its measurement. We follow the WGI design and test the above hypotheses in two steps. First, we test the effect of China’s ODI on the average of the six WGI indicators to capture a general picture. Second, we test the effects on each of those six WGI indicators respectively. This contrasts with the existing literature which either focuses on one aspect of institutional quality, such as corruption [15,18,19], or on some aggregated index of institutional quality [13,22].
For the aggregated index of the institutional quality we use the simple average of the six indicators as an additional dependent variable (WGI average). We however exclude the data from Singapore because of its extraordinary high values of institutional quality (however, the direction and significance of estimated coefficients did not change much whether or not we incorporate the data of Singapore into the regression).

3.2. Independent Variable

(1) China’ ODI intensity (CDII) serves as the key explanatory variable. In consideration of the cumulative effect of ODI and the economic size of the host countries, we measure CDII using China’s ODI stock as a percentage of the host country’s GDP. This measurement is in line with Prakash and Potoski [56], Malesky [16], and Gossel [70]. Data regarding China’s direct investment comes from the Statistical Bulletin of China’s Outward Foreign Direct Investment (corresponding years), and it is compiled by the Ministry of Commerce in China. The GDP data are obtained from the WDI database.

3.3. Control Variables

There are extensive empirical studies on the determinants of institutional quality. In this study, we choose to include a set of control variables, which are frequently contained in models that explain the differences of institutional quality across countries.
(1)
GDP per capita (GDPPC): This variable is measured in thousands of dollars at the constant price of 2010, which represents the synthetic economic development level of a country. It is expected that a rising economic development level leads to better institutional quality. Hence, following Zeng and Eastin [52] and Demir [13], we include this indicator in our model.
(2)
Intensity of FDI from countries other than China (FDII): In line with the construction of CDII, FDII is measured as the difference between total FDI stock and China’s ODI stock in the host country, as a percentage of the host country’s GDP. The data regarding total FDI stock are obtained from the UNCTAD database. Since FDI coming from other countries may have a competitive relationship with Chinese ODI and may exert an influence on the institutional quality of host countries, we incorporate this variable into the model.
(3)
Trade openness (Open): This variable is measured as the sum of export and import as a percentage of a country’s GDP. Rodrik [71] argues that open countries are more subject to external shocks, and therefore need a better institution for stabilizing their economy; therefore, trade openness is also associated with a country’s institutional quality. On the other hand, trade openness is directly linked to FDI inflows. Hence, in line with Kalliny et al. [69], we include this variable in the model.
(4)
Internet penetration (Internet): This variable is measured as the percentage of people with access to Internet in a country and is directly obtained from the WDI database. It is widely acknowledged that Internet penetration is associated with information transmission and media freedom in a country, which significantly influences institutional quality [72]. Asongu and Nwachukwu [68] treat Internet penetration as a tool of knowledge diffusion and find it has a positive effect on political governance. Based on these arguments, we include this variable in the model.
(5)
Natural resource contribution (NRC): This variable is measured as the total natural resource rents as a percentage of a country’s GDP, which is directly obtained from the WDI database. The total natural resource rents are the difference between the value of natural resources (oil, natural gas, coal, mineral, and forest) production at world prices and total costs of production, reflecting the abundance of natural resources in a country. Natural resources influence economic and institutional development in a complex way. On the one hand, exporting natural resource-related products brings desired foreign exchange for developing countries, which is beneficial to economic growth. On the other hand, exporting these resources can cause a country to rely too heavily on its natural resources, hindering its long-term economic growth, as the resource curse hypothesis posits. Furthermore, some scholars hold the viewpoint that natural resource seeking is one of the motivations of China’s ODI [27,28,30,31,32,33]. Therefore, excluding this variable would bias the estimation.
The summary statistics of the above variables are listed in Table 3.

3.4. Model Specification and Estimation Methods

The benchmark model to capture the institutional effect of China’s ODI on B&R countries is specified as follows:
I N S Q i t = β C D I I i t + γ M i t + α + λ i + ε i t
where the subscripts i and t stand for host country (i = 1, 2, …, 63) and year (t = 2003, 2004…, 2016), respectively. INSQ denotes the institutional quality of the host country, which is measured according to the six WGI dimensions discussed in Section 3.1. CDII represents the intensity of China’s ODI into the host country, which is measured as China’s ODI stock in a host country as a percentage of this country’s GDP. M represents a set of control variables, which capture some important characteristics of the host country. α is a constant and λ denotes host-country fixed effects, capturing culture and geographic heterogeneity across B&R countries. β and γ are the coefficients to be estimated, and ε is the error term. Under the assumption of no omitted variable and measurement errors, the fixed effects estimator gives a consistent estimator of β. According to H1, we expect β to be significantly positive. We report the standard fixed effects estimation in Section 4.1.
Note that model (1) suffers from potential endogeneity biases. First, institution persists, that is today’s institution will affect the one tomorrow [46]. Hence a lagged term referring to the institutional quality variable should be incorporated into the model. Since this variable is omitted in model (1), the fixed effects estimator cannot eliminate this bias [73]. Second, China’s ODI and the institutional quality of the host countries influence each other simultaneously; this is also referred to as the reverse causality problem, which also biases the fixed effects estimator.
Following Acemoglu et al. [74], we incorporate the first lag of the dependent variable into the model and replicate all the benchmark estimations using two-step difference GMM regressions in order to address endogeneity concerns. Proposed by Arellano and Bond [75], the difference GMM method, also referred to as the Arellano–Bond estimator, is used to perform an IV estimation using the lagged terms of endogenous variables as instruments for the endogenous variables themselves. With the assumption of no autocorrelation among error terms, the difference GMM produces a consistent estimator. According to model (1), the dynamic models are specified as follows:
I N S Q i t = ρ I N S Q i t 1 + β C D I I i t + γ M i t + α + λ i + ε i t
To explore the heterogeneous effect of China’s ODI on B&R countries with different natural resource endowments (i.e., to test H2), we add an interaction term between CDII and a natural resource variable (NRC, discussed in Section 3.3) into the model, and we obtain thus:
I N S Q i t = ρ I N S Q i t 1 + β C D I I i t + δ C D I I i t × N R C i t + γ M i t + α + λ i + ε i t
Coefficient ρ captures the level of institutional persistence between two consecutive years. Coefficient β can be interpreted as the short-term impact of CDII on an institution, and the long-term impact can be calculated as β/(1 − ρ), according to Acemoglu et al. [74]. In models (2) and (3), we treat the lagged dependent variable, CDII, and the interaction term as endogenous, and other variables as exogenous in order to reduce the number of instruments used and avoid weak instrument problems. We report the difference GMM estimation in Section 4.2 and Section 4.3.

4. Results

4.1. Benchmark Model Results

We first estimate model (1) with the fixed effects estimator (we test the hypothesis that the intercepts (λi) are all equal with F tests shown in the second last row of Table 4, which implies that fixed effects model is more appropriate than the OLS model. Hausman tests further support fixed effects model rather than random effects model. Because of space limitations, we only present estimation of fixed effects model). The results are reported in Table 4. Columns (1) to (7) use different dimensions of institutional quality as dependent variables, with the first dependent variable (WGI average) being the simple average of the six WGI indicators. Column (1) shows that China’s ODI intensity (CDII) is significantly and positively associated with WGI average. More specifically, columns (2) to (7) show that CDII has significant and positive relationships with the first five institution variables. This suggests that a host country with a higher share of China’s ODI tends to have higher levels of control of corruption, government effectiveness, political stability, regulatory quality, and rule of law. It means that for most of the countries of the B&R initiative, China’s ODI tends to have a positive impact on the host country’s institutional framework, except for voice and accountability. These results provide support to H1 to a large extent, which states that China’s ODI improves institutional quality of B&R countries.
However, there is no significant effect of CDII on voice and accountability, although the coefficient remains positive. It is not surprising since China has less experience in this domain given its one-Party rule regime. Consequently, Chinese ODI’s positive influence on these countries in general can in turn be explained by the institutional distance existing between China and most of the B&R countries. Since China unleashed its “Going Global” policy, it has been able to put in place adequate institutions so as to facilitate its ODI. These institutions are of superior quality when compared with those of B&R countries such as Mongolia, Tajikistan, or Iran. Obviously, this does not apply to a few selected countries encompassed in the B&R group such as Poland and Hungary, which are also part of the European Union.
Moreover, GDPPC is positively related with the six WGI indicators, but it is only significantly related with regulatory quality and rule of law. For the intensity of FDI from other countries, FDII is positively related with five institutional variables, but only significant for rule of law and control of corruption, and it is negatively associated with the host countries’ regulatory quality. The coefficients of trade openness in all seven columns are positive and not significant for the six institutional variables. Internet penetration has a significantly positive relationship with government effectiveness and rule of law, but a significantly negative relationship with voice and accountability. Finally, host countries with higher levels of natural resources contribution tend to have significantly lower levels of political stability and regulatory quality, which is partly in line with the resource curse hypothesis. The variable NRC is also negatively related with control of corruption, voice and accountability, and WGI average, though not significantly.

4.2. Difference GMM Estimation Results

In coping with the endogeneity problem, we use the difference GMM method to estimate model (3) following a two-step procedure. The results are in Table 5. The Sargen test confirms that the instruments used are valid in all specifications. Except for column (7) in Table 5, the p-values for the AR1 show that we can reject the null hypothesis that no first-order autocorrelation exists among the first-differenced error terms, and the p-values for the AR2 indicate that there is no second-order autocorrelation among the first-differenced error terms, which satisfies the condition for applying the difference GMM estimation.
CDII still exerts significantly positive effects on the WGI average (column 1) and the first five WGI indicators: control of corruption, government effectiveness, political stability, regulatory quality, and rule of law (column 2 to 6). These results lend support to H1. If the difference GMM estimation can be interpreted as causal, this suggests that, all other things being equal, each 0.01 increase in CDII will improve the value of control of corruption, government effectiveness, political stability, regulatory quality and rule of law by 0.0137, 0.0059, 0.0077, 0.00997, and 0.0079, respectively, for host countries in the short term.
The first order lagged institutional variables are significant in all seven columns with coefficients ranging between 0 and 1. This implies the persistence of institutions over time and a trend toward convergence. It further implies that China’s ODI intensity improves the equilibrium levels of host countries’ institutional quality in the long run. According to Acemoglu et al. [73], the long-term effect of CDII can be calculated as ΔCDII × β/(1−ρ). Specifically, all other things being equal, each 0.01 increase of CDII will improve the levels of control of corruption, government effectiveness, political stability, regulatory quality and rule of law by 0.0260, 0.0077, 0.0195, 0.0214, 0.0208, respectively, for host countries in the long term. Thus, both the short-term and long-term quantitative effects of China’s ODI intensity are modest, but by no means negligible.
For column (7), a further Arellano-Bond test shows that there is no third-order autocorrelation among the differenced error terms. Hence, we use higher order lagged terms of endogenous variables as instruments to re-estimate the model in column (7). Meanwhile, we also estimate the fixed effects model with lagged dependent variables VA (t−1). The estimation results show a similar pattern to column (7) in Table 4, with the key explanatory variable CDII remaining insignificant.
For the control variables, GDPPC is not significant for all six variables, implying that economic development may be the result of institutional improvement, rather than the cause of it [46]. Direct investment from other countries is also insignificant, and negatively associated with four of the six institution variables and the WGI average. Trade openness exerts no significant impact on institutional quality. Internet penetration still exerts a positive impact on government effectiveness but is loosely related with other dimensions of institutional quality. Natural resource contribution exerts significant and negative effects on political stability, regulatory quality, and rule of law, which is in line again with the resource curse hypothesis.

4.3. Difference GMM Estimation Results with an Interaction Term

To explore the heterogeneous effects of China’s ODI intensity on institutional quality of countries with different natural resources abundance, we add an interaction term between CDII and NRC (CDII × NRC). We estimate model (3) using the difference GMM method, and the results are in Table 6. The Sargen test shows that we cannot reject the null hypothesis that all the instruments are valid. The Arellano-Bond tests demonstrate that there is a high first-order, but no second-order, autocorrelation among the first-differenced residuals, except for column (7). We further test column (7) by the method proposed in sub-Section 4.2 and find that CDII and the interaction term remain insignificant.
Columns (1) to (4) show that CDII still exerts a positive impact on the WGI average, as well as on control of corruption, government effectiveness, and political stability, with insignificant coefficients of the interaction terms. These results provide support both to H1 and H2. Furthermore, the interaction terms are positively significant in columns (5) and (6), which indicates that China’s ODI in host countries with more abundant natural resources generates stronger institutional effects on enhancing regulatory quality and rule of law. In other words, absorbing China’s ODI is beneficial to these countries in that they may minimize the “resource curse”.

5. Discussion and Conclusions

With the increasingly improved international competitiveness of its MNCs and the rapid accumulation of foreign exchange reserves, China has gradually transformed from a country focusing mainly on absorbing foreign capital to a country attaching equal importance to absorbing foreign capital and exporting domestic capital. In 2015 and 2016, China’s outward direct investment (ODI) flows reached $145.7 and $196.2 billion respectively, ranking second in the world.
The B&R initiative is observed to promote and facilitate the new wave globalization [76]. Since China proposed the B&R Initiative in 2013, its ODI into B&R countries has risen steadily, from $13.7 billion in 2014 to $15.3 billion in 2016 [62]. As a result, B&R countries became important destinations of China’s ODI, as they provided market for effectively resolving China’s excess production capacity. As argued by Pauls and Gottwald [35], the B&R initiative is to foster a win-win cooperation with the partner countries. It is therefore clear that not only is China’s ODI a key pillar in the B&R Initiative, but also that China’s ODI lays the foundation that allows B&R countries to not only enter the global industrial value chain and promote regional economic cooperation, but also to facilitate sustainable development in these countries [42,43]. Given the vast geographical coverage and size of the economy, the B&R group of countries is an important new context in the world economy [36]. The B&R initiative, which seeks to improve the linkage between China and its neighboring countries [77], is one of the most important strategies for China’s opening up in the current era of globalization. It is also a means to contribute to the sustainable development of countries involved [44]. Motivated by the key observation that the quality of a country’s institutions plays an important role to realize the Sustainable Development Goals of the United Nations [12], we examine whether the B&R initiative improves the institutional quality of host countries involved. Situated in the broad field of economic integration theory, we use insights from international business and institutional economics to investigate the impact of China’s ODI on the institutional quality of the 63 B&R countries during the period 2003 to 2016. Our findings are summarized as follows.
First, although a high percentage of Chinese B&R projects are in regions with high political risks [78], this ODI from China improves the institutional quality of B&R countries, including control of corruption, government effectiveness, political stability, regulatory quality, rule of law, and WGI average. No significant effect is found for voice and accountability, which is in line with what one would logically expect. These results suggest that China through its “going global” strategy has been able to improve drastically the key institutions of the B&R countries, with the exception of those countries with pre-existing high levels of institutional development (e.g., countries belonging to the European Union). In other words, for most B&R countries, China might be seen as a role model in view of its successful capability at investing abroad, which may have been resulted from the improvement of its own institutional framework. Second, according to the dynamic model, China’s ODI not only promotes the institutional quality of host countries in the short run, but also improves the equilibrium level of the institutional quality in the long run. Third, China’s ODI exerts no differential impacts on the dimensions of control of corruption, government effectiveness, and political stability of countries with different natural resource endowments. However, China’s ODI in host countries with richer natural resources generates stronger institutional effects in improving regulatory quality and rule of law, indicating that China’s ODI may help the such host B&R countries minimize their “resource curse”.
These findings enrich our knowledge of the institutional effects of China’s ODI and may shed light on the policy design for the B&R initiative in the near future. The results obtained suggest a number of implications, which are economic, managerial, and political, all of which contribute to the sustainable development of the countries involved. From an economic/managerial viewpoint, and in line with standard theory of economic integration, there are substantial gains arising from more economic integration between countries. From a policy/political viewpoint, it is clear that strengthening the supervision and auditing of Chinese MNCs should be a priority for the Chinese government. Such actions would help to enhance the “regulatory pressure effect” and streamline MNCs’ behavior. For B&R countries, this initiative is undoubtedly a great opportunity to “catch up” economically with the rest of the world in many respects. By absorbing China’s direct investment, these countries can improve their institutional quality, minimize the resource curse, and achieve sustainable development. Moreover, the Chinese government should actively advance cultural exchanges and business cooperation between Chinese MNCs and the enterprises and/or governments of host countries, which would lay the foundation of the “demonstration effect” for the MNCs. In addition, the Chinese government should continue its fight against corruption both at home and abroad in order to establish a healthy image of Chinese MNCs. From a theoretical viewpoint, the article contributes the extant scholarship on the effects of developing country ODI on host country institutional quality. Extant scholarship examining the effect of FDI on institutional quality of host countries is limited. The present case of the B&R initiative can further be theoretically supported and expanded by the gravity model and/or core-periphery models as sub-sets of economic integration theory. Finally, the study has also contributed empirically through a fine-grained analysis of country level institutional quality. Extant literature focuses either on one aspect of institutional quality or some aggregated index. The present study tests the effects on all the six identified WGI indicators of institutional quality separately.
The study has the following limitations that can drive future research. First, our study has a limitation of the time frame involved in the analysis. The B&R initiative began from the year 2013. The time period in our analysis is thus limited. Future inquiry, to further validate our findings, should therefore extend this line of research using a longer time frame to examine the effects of B&R ODI on the institutional quality of the host countries. Second, as mentioned earlier, the causal relationship between FDI and institutions operates both ways. Extant research suggests that good institutional quality of host countries encourages FDI inflows [1,2,3,4,10]. While we have addressed this issue in our study conceptually by using insights from extant research [15] and empirically using the difference GMM-model [75], we feel that future research can deliberate further both conceptually and empirically to address better the concerns of reverse causality in examining the effects of FDI on the quality of host country institutions. Third, the findings in regard to “resource course” may be applicable to countries which are rich in natural resources but have questionable institutional quality (e.g., Iran, Iraq, etc.,). Whether the findings will be applicable to countries which are rich in resources and with strong institutional quality will need to be examined by future research (e.g., Canada, United States, etc.,). Again, because of the short time period the impact of B&R initiative on sustainable development, examined empirically, has not been significant [44]. Future, research can further factor our findings to validate the role of B&R FDI in sustainable development. The role of institutional quality as a mechanism to understand the effect of B&R FDI on sustainable development of the countries involved may be empirically tested. In other words, the mediating role of the quality of host country institutions, in the influence of B&R FDI on sustainable development can be empirically tested.
Our findings can also motivate future research in regard to the nature of institutions in the host country. The present study examines the effect of the B&R initiative on host country formal institutions only. Extant research has suggested that informal institutions may also influence sustainable development of societies. Informal institutions such as sustainability values [79] and culturally endorsed leadership theories [80] have been found to influence sustainable development activities in societies. In terms of future research, longitudinal studies can therefore examine the impact of the B&R initiative on the informal institutions of the host country. Future research can also examine whether the nature of FDI in B&R countries has an influence on institutional quality of the host country. For example, investments by Chinese firms can differ from being a joint venture, a merger or acquisition, or a greenfield activity. Will the nature of investment influence the institutional quality in the host country? The role of the type of the Chinese firms active in B&R countries can be examined. Since non-state-owned firms are engaged more in non-infrastructure related activities, they are likely to be more active in ODI in non-infrastructure industries in B&R countries [36]. So, does the type of the investing firm influence the institutional quality of the host country? Finally, we have evaluated Chinese FDI driven by the B&R initiative in this study. Hence only the countries that are covered by this initiative are considered in this study. Would our findings be applicable for non B&R FDI from China? We hope our findings would motivate future inquiry on these and other questions on the role of FDI in improving the institutional quality of countries involved and finally contribute to understanding the mechanisms that drive sustainable development.

Author Contributions

This work is a joint effort of all the authors. Conceptualization, methodology, data analysis, and original draft were by C.P., W.X.W., and J.L. Further development of the manuscript, dissemination at conferences and soliciting feedback, strengthening conceptualization, development and strengthening of hypotheses, strengthening the theoretical contribution, and overall writing and review were by W.X.W., E.M., and B.A.-O. All authors have read and agreed to the published version of the manuscript.

Funding

This research was funded by the Key Research Project of Shanghai Education Commission (rant number: 2017-01-07-00-02-E00008).

Conflicts of Interest

The authors declare no conflict of interest

References

  1. Alfaro, L.; Kalemli-Ozcan, S.; Volosovych, V. Why doesn’t capital flow from rich to poor countries? An empirical investigation. Rev. Econ. Stat. 2008, 90, 347–368. [Google Scholar] [CrossRef]
  2. Beazer, Q.H.; Blake, D.J. The conditional nature of political risk: How home institutions influence the location of foreign direct investment. Am. J. Political Sci. 2018, 62, 470–485. [Google Scholar] [CrossRef]
  3. Benacek, V.; Lenihan, H.; Andreosso-O’Callaghan, B.; Michalikova, E.; Kan, D. Political risk, institutions and foreign direct investment: How do they relate in various European countries? World Econ. 2014, 37, 625–653. [Google Scholar] [CrossRef] [Green Version]
  4. Busse, M.; Hefeker, C. Political risk, institutions and foreign direct investment. Eur. J. Political Econ. 2007, 23, 397–415. [Google Scholar] [CrossRef] [Green Version]
  5. Cezar, R.; Escobar, O.R. Institutional distance and foreign direct investment. Rev. World Econ. 2015, 151, 713–733. [Google Scholar] [CrossRef]
  6. Corcoran, A.; Gillanders, R. Foreign direct investment and the ease of doing business. Rev. World Econ. 2015, 151, 103–126. [Google Scholar] [CrossRef] [Green Version]
  7. Demir, F.; Hu, C. Destination institutions, firm heterogeneity and exporter dynamics: Empirical evidence from China. Rev. World Econ. 2019, 1–35. [Google Scholar] [CrossRef]
  8. Fernández González, R.; Arce Fariña, M.E.; Garza Gil, M.D. Resolving Conflict between Parties and Consequences for Foreign Direct Investment: The Repsol-YPF Case in Argentina. Sustainability 2019, 11, 6012. [Google Scholar] [CrossRef] [Green Version]
  9. Quer, D.; Claver, E.; Rienda, L. Political risk, cultural distance, and outward foreign direct investment: Empirical evidence from large Chinese firms. Asia Pac. J. Manag. 2012, 29, 1089–1104. [Google Scholar] [CrossRef]
  10. Wei, S. How taxing is corruption on international investors. Rev. Econ. Stat. 2000, 82, 1–11. [Google Scholar] [CrossRef] [Green Version]
  11. Goldberg, L. Financial-Sector FDI and Host Countries: New and Old Lessons; (No. w10441); National Bureau of Economic Research: Cambridge, MA, USA, 2004. [Google Scholar]
  12. Acemoglu, D.; Robinson, J.A. Why Nations Fail: The Origins of Power, Prosperity, and Poverty; Crown Business: New York, NY, USA, 2012. [Google Scholar]
  13. Demir, F. Effects of FDI flows on institutional development: Does it matter where the investors are from. World Dev. 2015, 78, 341–359. [Google Scholar] [CrossRef]
  14. Dhahri, S.; Omri, A. Does foreign capital really matter for the host country agricultural production? Evidence from developing countries. Rev. World Econ. 2019, 1–29. [Google Scholar] [CrossRef]
  15. Kwok, C.; Tadesse, S. The MNC as an agent of change for host-country institutions: FDI and corruption. J. Int. Bus. Stud. 2006, 37, 767–785. [Google Scholar] [CrossRef]
  16. Malesky, J.E. Foreign direct investors as agents of economic transition: An instrumental variables analysis. Q. J. Political Sci. 2009, 4, 59–85. [Google Scholar] [CrossRef]
  17. Oh, K.S.; Ryu, Y.S. FDI, Institutional Quality, and Bribery: An Empirical Examination in China. Sustainability 2019, 11, 4023. [Google Scholar] [CrossRef] [Green Version]
  18. Pinto, P.M.; Zhu, B. Fortune or evil? The effect of inward foreign direct investment on corruption. Int. Stud. Q. 2016, 60, 693–705. [Google Scholar] [CrossRef] [Green Version]
  19. Zhu, B. MNCs, rents and corruption: Evidence from China. Am. J. Political Sci. 2017, 61, 84–99. [Google Scholar] [CrossRef]
  20. Olney, W.W. A race to the bottom? Employment protection and foreign direct investment. J. Int. Econ. 2013, 91, 191–203. [Google Scholar] [CrossRef]
  21. Ali, F.; Fiess, N.; Macdonald, R. Climbing to the top? Foreign direct investment and property rights. Econ. Inq. 2011, 49, 289–302. [Google Scholar] [CrossRef] [Green Version]
  22. Dang, A.D. How foreign direct investment promotes institutional quality: Evidence from Vietnam. J. Comp. Econ. 2013, 41, 1054–1072. [Google Scholar] [CrossRef]
  23. Long, C.; Yang, J.; Zhang, J. Institutional impact of foreign direct investment in China. World Dev. 2015, 66, 31–48. [Google Scholar] [CrossRef]
  24. Hu, J.; Andreosso-O’Callaghan, B. Is the strategy of technology acquisition in China an indisputable success? On the impact of FDI on Chinese domestic enterprises’ technology improvement. In Asia and Europe—Connections and Contrasts; Andreosso-O’Callaghan, B., Zolin, B., Eds.; Libreria Editrice Cafoscarina: Venice, Italy, 2008; pp. 257–274. [Google Scholar]
  25. Bilal, A.R.; Khan, A.A.; Akoorie, M.E.M. Constraints to growth: A cross country analysis of Chinese, Indian and Pakistani SMEs. Chin. Manag. Stud. 2006, 10, 365–386. [Google Scholar] [CrossRef]
  26. Alon, I.; Anderson, J.; Munim, Z.H.; Ho, A. A review of the internationalization of Chinese enterprises. Asia Pac. J. Manag. 2018, 35, 573–605. [Google Scholar] [CrossRef]
  27. Asongu, S.; Ssozi, J. Sino-African relations: Some solutions and strategies to the policy syndromes. J. Afr. Bus. 2016, 17, 33–51. [Google Scholar] [CrossRef] [Green Version]
  28. Busse, M.; Erdogan, C.; Mühlen, H. China’s impact on Africa: The role of trade, FDI and aid. Kyklos 2016, 69, 228–262. [Google Scholar] [CrossRef]
  29. Cui, L.; Jiang, F. Behind ownership decision of Chinese outward FDI: Resources and institutions. Asia Pac. J. Manag. 2010, 27, 751–774. [Google Scholar] [CrossRef]
  30. Poncet, S. Inward and outward FDI in China. In China and the World Economy; Greenaway, D., Milner, C., Yao, S., Eds.; Palgrave Macmillan: London, UK, 2010; pp. 112–134. [Google Scholar]
  31. Rosen, D.H.; Hanemann, T. China’s Changing Outbound Foreign Direct Investment Profile: Drivers and Policy Implications; Policy Brief, No. PB09-14; Peterson Institute for International Economics: Washington, DC, USA, 2009. [Google Scholar]
  32. Schuler-Zhou, Y.; Schuller, M. The Internationalization of Chinese Companies. Chin. Manag. Stud. 2009, 3, 25–42. [Google Scholar] [CrossRef] [Green Version]
  33. Yao, S.; Zhang, F.; Wang, P.; Luo, D. Location Determinants of China’s Outward Foreign Direct Investment. China World Econ. 2017, 25, 1–27. [Google Scholar] [CrossRef]
  34. Liu, H.; Jiang, J.; Zhang, L.; Chen, X. OFDI agglomeration and Chinese firm location decisions under the “Belt and Road” initiative. Sustainability 2018, 10, 4060. [Google Scholar] [CrossRef] [Green Version]
  35. Pauls, R.; Gottwald, J.C. Origins and dimensions of the Belt and Road Initiative: Experimental patch-work or grand strategy? In China’s Global Political Economy—Managerial Perspectives; Taylor, R., Jaussaud, J., Eds.; Routledge: New York, NY, USA, 2018; pp. 31–54. [Google Scholar]
  36. Du, J.; Zhang, Y. Does one belt one road initiative promote Chinese overseas direct investment? China Econ. Rev. 2018, 47, 189–205. [Google Scholar] [CrossRef]
  37. Fu, Y.; Supriyadi, A.; Wang, T. China’s Outward FDI in Indonesia: Spatial Patterns and Determinants. Sustainability 2018, 10, 4632. [Google Scholar] [CrossRef] [Green Version]
  38. Li, W.; Hilmola, O.P. Belt and Road Initiative and Railway Sector Efficiency—Application of Networked Benchmarking Analysis. Sustainability 2019, 11, 2070. [Google Scholar] [CrossRef] [Green Version]
  39. Wang, L.; Zheng, Y.; Ducruet, C.; Zhang, F. Investment Strategy of Chinese Terminal Operators along the “21st-Century Maritime Silk Road”. Sustainability 2019, 11, 2066. [Google Scholar] [CrossRef] [Green Version]
  40. Wu, T.; Qi, G.; Li, C.; Wang, M. A Survey of Techniques for Constructing Chinese Knowledge Graphs and Their Applications. Sustainability 2018, 10, 3245. [Google Scholar] [CrossRef] [Green Version]
  41. Khan, M.; Sandano, I.; Pratt, C.; Farid, T. China’s Belt and Road Initiative: A Global Model for an Evolving Approach to Sustainable Regional Development. Sustainability 2018, 10, 4234. [Google Scholar] [CrossRef] [Green Version]
  42. Li, Y.; Zhu, X. The 2030 Agenda for Sustainable Development and China’s Belt and Road Initiative in Latin America and the Caribbean. Sustainability 2019, 11, 2297. [Google Scholar] [CrossRef] [Green Version]
  43. Zhang, Y.; Yu, X.; Zhang, H. Addressing the Insufficiencies of the Traditional Development Aid Model by Utilizing the One Belt, One Road Initiative to Sustain Development in Afghanistan. Sustainability 2019, 11, 312. [Google Scholar] [CrossRef] [Green Version]
  44. Xiao, H.; Cheng, J.; Wang, X. Does the Belt and Road Initiative Promote Sustainable Development? Evidence from Countries along the Belt and Road. Sustainability 2018, 10, 4370. [Google Scholar] [CrossRef] [Green Version]
  45. Liu, H.; Kim, H. Ecological footprint, foreign direct investment, and gross domestic production: Evidence of Belt & Road Initiative countries. Sustainability 2018, 10, 3527. [Google Scholar]
  46. Acemoglu, D.; Johnson, S.; Robinson, J.A. The colonial origins of comparative development: An empirical investigation. Am. Econ. Rev. 2001, 91, 1369–1401. [Google Scholar] [CrossRef]
  47. Hall, R.; Jones, C. Why do some countries produce so much more output per worker than others? Q. J. Econ. 1999, 114, 83–116. [Google Scholar] [CrossRef]
  48. Javorcik, S.B. Does foreign direct investment increase the productivity of domestic firms? In search of spillovers through backward linkages. Am. Econ. Rev. 2004, 94, 605–627. [Google Scholar] [CrossRef] [Green Version]
  49. Liu, Z. Foreign direct investment and technology spillovers: Theory and evidence. J. Dev. Econ. 2008, 85, 176–193. [Google Scholar] [CrossRef]
  50. Gui-Diby, S.L.; Renard, M.-F. Foreign direct investment inflows and the industrialization of African countries. World Dev. 2015, 74, 43–57. [Google Scholar] [CrossRef]
  51. Kang, S.J.; Lee, H. Foreign direct investment and de-industrialisation. World Econ. 2011, 34, 313–329. [Google Scholar] [CrossRef]
  52. Zeng, K.; Eastin, J. Do developing countries invest up? The environmental effects of foreign direct investment from less-developed countries. World Dev. 2012, 40, 2221–2233. [Google Scholar] [CrossRef]
  53. Buckley, P.J.; Doh, J.P.; Benischke, M.H. Towards a renaissance in international business research? Big questions, grand challenges, and the future of IB scholarship. J. Int. Bus. Stud. 2017, 48, 1045–1064. [Google Scholar] [CrossRef] [Green Version]
  54. Hanekom, D.; Luiz, J.M. The impact of multinational enterprises on public governance institutions in areas of limited statehood. Manag. Decis. 2017, 55, 1736–1748. [Google Scholar] [CrossRef]
  55. Poynter, T. Multinational Enterprises and Government Intervention; Croom Helm: London, UK, 1985. [Google Scholar]
  56. Prakash, A.; Potoski, M. Investing up: FDI and the cross-country diffusion of ISO 14001 management systems. Int. Stud. Q. 2007, 51, 723–744. [Google Scholar] [CrossRef]
  57. Wiig, A.; Kolstad, I. Multinational corporations and host country institutions: A case study of CSR activities in Angola. Int. Bus. Rev. 2010, 19, 178–190. [Google Scholar] [CrossRef]
  58. Sachs, J.D.; Warner, A.M. Natural Resource Abundance and Economic Growth; (No. w5398); National Bureau of Economic Research: Cambridge, MA, USA, 1995. [Google Scholar]
  59. Mehlum, H.; Moene, K.; Torvik, R. Institutions and the resource curse. Econ. J. 2006, 116, 1–20. [Google Scholar] [CrossRef] [Green Version]
  60. Robinson, J.A.; Torvik, R.; Verdier, T. Political foundations of the resource curse. J. Dev. Econ. 2006, 79, 447–468. [Google Scholar] [CrossRef] [Green Version]
  61. De Rosa, D.; Iootty, M. Are Natural Resources Cursed? An Investigation of the Dynamic Effects of Resource Dependence on Institutional Quality WP 6151; World Bank: Washington, DC, USA, 2012. [Google Scholar]
  62. MOFCOM (Ministry of Commerce of P. R. C.). Statistics Bulletin of China’s Outward Foreign Direct Investment; China Statistics Press: Beijing, China, 2017.
  63. Ernst and Young. Riding the Silk Road: China Sees Outbound Investment Boom. 2015. Available online: http://www.ey.com/Publication/vwLUAssets/eychina-outbound-investment-report-en/%24FILE/ey-china-outbound-investment-report-en.pdf (accessed on 19 December 2019).
  64. North, D.C. Institutions, Institutional Change and Economic Performance; Cambridge University Press: Cambridge, UK, 1990. [Google Scholar]
  65. Kaufmann, D.; Kraay, A.; Mastruzzi, M. The Worldwide Governance Indicators: Methodology and Analytical Issues; Working paper no. 5430; World Bank Policy Research: Washington, DC, USA, 2010. [Google Scholar]
  66. Aleksynska, M.; Havrylchyk, O. FDI from the south: The role of institutional distance and natural resources. Eur. J. Political Econ. 2013, 29, 38–53. [Google Scholar] [CrossRef] [Green Version]
  67. Antràs, P.; Chor, D. Organizing the global value chain. Econometrica 2013, 81, 2127–2204. [Google Scholar]
  68. Asongu, S.A.; Nwachukwu, J.C. The mobile phone in the diffusion of knowledge for institutional quality in Sub-Saharan Africa. World Dev. 2016, 86, 133–147. [Google Scholar] [CrossRef]
  69. Kalliny, M.; Benmamoun, M.; Cropf, R.A.; Kim, S.H. The role of MNCs and information flow on institutional change. Multinatl. Bus. Rev. 2015, 23, 130–147. [Google Scholar] [CrossRef]
  70. Gossel, S.J. FDI, democracy and corruption in Sub-Saharan Africa. J. Policy Modeling 2018, 40, 647–662. [Google Scholar] [CrossRef]
  71. Rodrik, D. Why do More Open Countries Have Bigger Governments? J. Political Econ. 1998, 106, 997–1032. [Google Scholar] [CrossRef]
  72. Brunetti, A.; Weder, B. A free press is bad news for corruption. J. Public Econ. 2003, 87, 1801–1824. [Google Scholar] [CrossRef]
  73. Greene, W.H. Econometric Analysis, 7th ed.; Pearson Education: New York, NY, USA, 2012. [Google Scholar]
  74. Acemoglu, D.; Johnson, S.; Robinson, J.A.; Yared, P. Income and democracy. Am. Econ. Rev. 2008, 98, 808–842. [Google Scholar] [CrossRef]
  75. Arellano, M.; Bond, S. Some tests of specification for panel data: Monte Carlo evidence and an application to employment equations. Rev. Econ. Stud. 1991, 58, 277–297. [Google Scholar] [CrossRef] [Green Version]
  76. Li, J.; Liu, B.; Qian, G. The belt and road initiative, cultural friction and ethnicity: Their effects on the export performance of SMEs in China. J. World Bus. 2019, 54, 350–359. [Google Scholar] [CrossRef]
  77. Yii, K.J.; Bee, K.Y.; Cheam, W.Y.; Chong, Y.L.; Lee, C.M. Is Transportation Infrastructure Important to the One Belt One Road (OBOR) Initiative? Empirical Evidence from the Selected Asian Countries. Sustainability 2018, 10, 4131. [Google Scholar] [CrossRef] [Green Version]
  78. Zhang, C.; Xiao, C.; Liu, H. Spatial Big Data Analysis of Political Risks along the Belt and Road. Sustainability 2019, 11, 2216. [Google Scholar] [CrossRef] [Green Version]
  79. Muralidharan, E.; Pathak, S. Sustainability, transformational leadership, and social entrepreneurship. Sustainability 2018, 10, 567. [Google Scholar] [CrossRef] [Green Version]
  80. Muralidharan, E.; Pathak, S. Consequences of Cultural Leadership Styles for Social Entrepreneurship: A Theoretical Framework. Sustainability 2019, 11, 965. [Google Scholar] [CrossRef] [Green Version]
Figure 1. Economic development of Belt and Road (B&R) countries. Source: Authors’ calculations based on World Development Indicators (WDI) (http://data.worldbank.org/).
Sustainability 12 00415 g001
Figure 2. China’s outward direct investment (ODI) flow and stock in B&R countries. Source: Authors’ calculations based on data from SBCOFDI for various years.
Sustainability 12 00415 g002
Figure 3. The institutional quality of B&R countries. Source: Authors’ calculations based on data from the Worldwide Governance Indicators (http://info.worldbank.org/governance/wgi/index.aspx#home).
Sustainability 12 00415 g003
Table 1. B&R countries.
East and South Asia
AfghanistanBangladeshBrunei DarussalamCambodia
IndiaIndonesiaLao PDRMalaysia
MongoliaMyanmarNepalPakistan
PhilippinesSingaporeSri LankaThailand
Timor-LesteVietnam
Europe and Central Asia
AlbaniaArmeniaAzerbaijanBelarus
Bosnia and HerzegovinaBulgariaCroatiaCyprus
Czech RepublicEstoniaGeorgiaGreece
HungaryKazakhstanKyrgyz RepublicLatvia
LithuaniaMacedonia, FYRMoldovaMontenegro
PolandRomaniaRussian FederationSerbia
Slovak RepublicSloveniaTajikistanTurkey
TurkmenistanUkraineUzbekistan
Middle East and North Africa
BahrainEgypt, Arab Rep.Iran, Islamic Rep.Iraq
IsraelJordanKuwaitLebanon
OmanQatarSaudi ArabiaSyrian Arab Republic
United Arab EmiratesWest Bank and GazaYemen, Rep.
Table 2. The geographical distribution of China’s ODI into B&R Countries in 2015.
CountryChina’s ODI Stock/Host Country GDPGDP Per Capita ($)CountryChina’s ODI Stock (Millions of $)GDP Per Capita ($)
Lao PDR39.14%1818 Singapore31,98552,889
Mongolia32.02%3968 Russian Federation14,0209238
Cambodia20.36%1159 Indonesia81253346
Kyrgyz Republic16.29%1103 Kazakhstan509510,510
Tajikistan11.58%926 Lao PDR48421818
Singapore10.93%52,889 United Arab Emirates460340,439
Timor-Leste6.96%1158 Myanmar42591161
Myanmar6.80%1161 Pakistan40361435
Georgia3.82%3796 India37701598
Kazakhstan2.76%10,510 Mongolia37603968
Afghanistan2.17%594 Cambodia36761159
Vietnam1.74%2111 Thailand34405815
Pakistan1.49%1435 Vietnam33742111
Nepal1.38%743 Iran29495436
Uzbekistan1.32%2132 Saudi Arabia243420,482
Average10.58%5700 Average6691 10,760
Source: Authors’ calculations based on data from WDI and SBCOFDI.
Table 3. Summary statistics.
VariableDescriptionObs.MeanStd. Dev.MinMax
CCControl of Corruption732−0.3179 0.7117 −1.6984 1.7229
GEGovernment Effectiveness732−0.0975 0.7583 −1.7701 1.5651
PSPolitical Stability 732−0.3740 0.9676 −3.1848 1.3995
RQRegulatory Quality732−0.0569 0.8466 −2.3447 1.6749
RLRule of Law732−0.2206 0.7725 −1.9516 1.3646
VAVoice & Accountability732−0.3982 0.8768 −2.2176 1.1719
WGI avgAggregate Institutional Quality732−0.2442 0.7205 −1.9283 1.2140
CDIIChina’s ODI Intensity7320.0100 0.0347 4.04E-070.3202
GDPPCGDP per capita73210.5396 13.3483 0.3737 74.6866
FDIIFDI intensity from other countries7320.4115 0.7516 0.0064 8.3160
OpenTrade Openness7320.9358 0.3767 0.0017 2.1037
InternetInternet Penetration7320.3221 0.2502 2.41E-040.9288
NRCNatural Resource Contribution7320.1268 0.2907 5.79E-063.4417
Source: Authors’ calculations based on data from WDI, WGI, SBCOFDI and the UNCTAD database.
Table 4. Fixed effects estimation results.
Dependent Var.(1)(2)(3)(4)(5)(6)(7)
WGI AvgCCGEPSRQRLVA
CDII1.1841 ***1.0898 **0.5114 *2.0183 ***1.3918 **1.0272 ***1.066
[0.3553][0.5154][0.2904][0.6154][0.6975][0.3902][0.8201]
GDPPC0.01270.01350.00620.01790.0204 **0.0157 *0.0022
[0.0078][0.0107][0.0102][0.0109][0.0082][0.0087][0.0038]
FDII0.00980.0187 *0.01280.009−0.00450.0161 **0.0066
[0.0065][0.0095][0.0109][0.0144][0.0096][0.0078][0.0061]
Open0.08480.11770.05640.11040.0670.02260.1348
[0.0728][0.0992][0.0902][0.1435][0.0965][0.0830][0.0840]
Internet0.0111−0.05960.3021 ***−0.21750.11080.1520*−0.2211 ***
[0.0790][0.1132][0.0953][0.1823][0.0873][0.0890][0.0768]
NRC−0.0818−0.05960.0258−0.2744 **−0.1835 ***0.037−0.0358
[0.0590][0.0941][0.0883][0.1319][0.0472][0.0743][0.0581]
Constant−0.4660 ***−0.5624 ***−0.3269 ***−0.5849 ***−0.3590 ***−0.4780 ***−0.4850 ***
[0.1006][0.1450][0.1182][0.1679][0.1230][0.1080][0.1025]
Obs.732732732732732732732
within R20.08460.04330.11810.0410.12530.10990.0686
F3.06681.69314.17463.35575.91893.78562.3295
p value0.01100.13830.00140.00640.00010.00290.0435
Note: (1) *, **, *** represent significance at the 1%, 5%, and 10% levels respectively; (2) the numbers in brackets [ ] show the robust standard errors with Windmeijer finite sample correction.
Table 5. Difference generalized method of moments (GMM) estimation results.
Dependent Var.(1)(2)(3)(4)(5)(6)(7)
WGI AvgCCGEPSRQRLVA
WGI avg (t-1)0.4961 ***
[0.1452]
CC (t-1) 0.4744 ***
[0.1043]
GE (t-1) 0.2363 *
[0.1233]
PS (t-1) 0.6070 ***
[0.1069]
RQ (t-1) 0.5330 ***
[0.1524]
RL (t-1) 0.6209 ***
[0.1502]
VA (t-1) 0.3655 **
[0.1581]
CDII0.8519 **1.3684 ***0.5885 **0.7663 *0.9974 **0.7884 *0.5727
[0.3805][0.4446][0.2963][0.4222][0.4982][0.4205][0.4699]
GDPPC0.002−0.00880.0030.00370.00990.00150.0039
[0.0044][0.0085][0.0047][0.0097][0.0072][0.0075][0.0035]
FDII−0.00860.0096−0.0072−0.0329−0.01980.0008−0.0183
[0.0223][0.0258][0.0240][0.0444][0.0245][0.0178][0.0177]
Open−0.0355−0.0503−0.0994−0.04110.0172−0.0162−0.0509
[0.0366][0.0452][0.0647][0.0923][0.0470][0.0516][0.0448]
Internet0.02920.04450.2343 **0.1026−0.0232−0.0097−0.0194
[0.0485][0.0714][0.1041][0.1511][0.0675][0.0692][0.0783]
NRC−0.02780.0055−0.0278−0.1134 **−0.0994 **−0.0768 **0.0208
[0.0320][0.0539][0.0574][0.0573][0.0485][0.0345][0.0636]
Constant−0.0857−0.0449−0.0748−0.1497−0.0967−0.052−0.2040 *
[0.0790][0.1160][0.1178][0.1554][0.0907][0.1136][0.1062]
Obs.671671671671671671671
χ228.053250.26350.533655.220941.126248.997510.1951
AR1−2.6899−3.6531−2.4337−3.4652−2.7728−3.1777−1.2891
p value0.0071 0.0003 0.0149 0.0005 0.0056 0.0015 0.1973
AR20.2601 0.1147 −0.0616 0.1237 0.1181 −0.8373 −2.2008
p value0.7948 0.9087 0.9509 0.9015 0.9060 0.4024 0.0277
Sargen48.3048 52.3051355.4860258.1146333.9795250.2349156.34817
p value0.5814 0.42310.60580.22980.37240.5040.2818
Note: (1) *, **, *** represent significance at the 1%, 5%, and 10% levels respectively; (2) the numbers in brackets [ ] show the robust standard errors with the Windmeijer finite sample correction.
Table 6. Difference GMM estimation results with interaction term.
Dependent Var.(1)(2)(3)(4)(5)(6)(7)
WGI AvgCCGEPSRQRLVA
WGI avg (t-1)0.5548 ***
[0.1570]
CC (t-1) 0.4757 ***
[0.1147]
GE (t-1) 0.2302 *
[0.1253]
PS (t-1) 0.6298 ***
[0.1132]
RQ (t-1) 0.5493 ***
[0.1314]
RL (t-1) 0.6236 ***
[0.2404]
VA (t-1) 0.3858 *
[0.2006]
CDII0.8266 **1.4850 ***0.7850 *1.1046 *0.34560.46610.9762
[0.3736][0.5343][0.4607][0.6298][0.3546][1.1291][1.0032]
CDII × NRC0.9586−1.6795−0.5842.36215.3166 **3.6817 ***−4.9225
[1.0303][1.4558][1.5846][1.6818][2.0773][1.4150][6.1681]
GDPPC0.0019−0.01190.00190.00340.00850.00160.003
[0.0042][0.0090][0.0034][0.0110][0.0057][0.0099][0.0054]
FDII−0.0140.0218−0.0148−0.0261−0.0193−0.0062−0.0148
[0.0276][0.0207][0.0340][0.0365][0.0224][0.0246][0.0146]
Open−0.0313−0.0575−0.0834 *−0.02380.0215−0.0155−0.0345
[0.0362][0.0474][0.0461][0.0999][0.0499][0.0581][0.0498]
Internet0.04280.02880.2455 ***0.0841−0.0188−0.0003−0.0269
[0.0596][0.0680][0.0859][0.1503][0.0686][0.0825][0.0771]
NRC−0.0299−0.0109−0.0372−0.0984 *−0.1106 **−0.07240.015
[0.0311][0.0517][0.0592][0.0594][0.0510][0.1369][0.0669]
Constant−0.06910.0048−0.0628−0.1449−0.1062−0.0704−0.1978 *
[0.0692][0.1107][0.1010][0.1700][0.0905][0.1369][0.1194]
Obs.671671671671671671671
χ261.19660.39231.456354.314545.695343.44066.4021
AR1−2.8158−3.4404−2.4066−3.4625−3.1863−2.2557−1.1398
p value0.00490.00060.01610.00050.00140.02410.2544
AR20.32050.1343−0.0690.12140.1484−0.7219−2.1592
p value0.74860.89320.9450.90340.8820.47030.0308
Sargen45.5521441.3439246.5185453.3515547.3868656.435656.5385
p value0.32650.49960.29170.11250.26220.67550.6719
Note: (1) *, **, *** represent significance at the 1%, 5%, and 10% levels respectively; (2) the numbers in brackets [ ] show the robust standard errors with the Windmeijer finite sample correction.

