Evolution of Land Cover and Ecosystem Services in the Frame of Pastoral Functional Categories: A Case Study in Swedish Lapland


1
UFR de Géographie et d’Aménagement, Faculté des Lettres, Institut de Géographie, Sorbonne-Université FRE Espaces, Nature, Culture, 75005 Paris, France
2
GDR 2012 AREES Arctique Enjeux Environm & Soc, CNRS-Meudon, 92195 Meudon, France
*
Author to whom correspondence should be addressed.
Sustainability 2020, 12(1), 390; https://doi.org/10.3390/su12010390
Submission received: 31 October 2019
/
Revised: 23 December 2019
/
Accepted: 31 December 2019
/
Published: 3 January 2020
(This article belongs to the Special Issue Nature-Based Solutions in Conservation Management)
Abstract
:Ecosystem services (ES) are a key-component for sustainable management of human–environment systems, particularly in polar environments where effects of global changes are stronger. Taking local knowledge into account allows the valuation of ES experienced by stakeholders. It is the case for reindeer herders in Scandinavia, the ungulate being a keystone specie for subarctic socio-ecosystems. We adapt the ecosystem services assessment (ESA) proposed in Finland to the case study of the Gabna herders’ community (Sweden), considering its cultural, geographical, and dynamic specificities. We used Saami ecological categories over the land-use categories of the CORINE Land Cover (CLC). We reassessed ES at the scale of the Gabna community and its seasonal pastures. We studied their evolution over 2000–2018, using CLC maps and Change CLC maps. Integration of Saami ecological categories in the classification of land cover did not substantially change the land cover distributions. However, ES were greater in Saami land use compared to other CLC categories. Cultural services were higher for summer and interseasonal pastures, dedicated to the reindeer reproduction, suggesting interactions between provisioning and cultural ES. Land cover changes are mostly represented by intensive forestry (5% of winter pastures) impeding reindeer grazing activity, while other seasonal pasture landscape composition stayed comparable along time. Consequently, forest activity, and in a lesser extent glacier melting and urbanization are the main drivers of the temporal evolution of ES. In the frame of pastoral landscapes conservation, the use of local terminologies opens perspectives for a holistic approach in environmental science. It raises the importance of local stakeholders as co-researchers in nature conservation studies.
1. Introduction
1.1. Sustainability Sciences and Ecosystem Services Studies
Sustainability sciences are defined as “an emerging field of research dealing with the interactions between natural and social systems, and with how those interactions affect the challenge of sustainability: meeting the needs of present and future generations while substantially reducing poverty and conserving the planets’ life support system” [1]. Even if at a first glance ecological, economic and social goals appear to be antagonists, the study of ecosystem services (ES), as constituents of well-being, are meaningful for the management of human–environment systems. Four major categories of ES are listed: Supporting ES (biotic and abiotic factors contributing to basic structure and functions of ecosystems, necessary to keep them resilient against disturbances); Provisioning ES (resources directly harvested by mankind); Regulating ES (as contributors to regional and local climate, carbon, and water cycles, etc.) and Cultural ES (e.g., aesthetics, specific ecosystem components with high value for local culture) [2].
Designing, mapping, and surveying ES allow conservation decision-making in complex human–natural systems. It makes understandable to stakeholders the interrelations between resource exploitation economy, policies, landscape planning, and other ecosystem components [3,4]. Indeed, ecosystem services studies (ESS) have a specific meaning in the current sociopolitical and ideological context (“conserving biodiversity [having] the potential to deliver economic benefits to people”) [3], the economic part giving to ES a particular voice to stakeholders involved in one’s regional landscape planning. In landscape planning, sensibility and values related to different ES might change according to stakeholders’ cultural backgrounds and interests [5]. By its collaborative aspects, ecosystem services assessment (EEA) represents a powerful lever to share different perspectives on the same region. It is in particular the case for older inhabitants such as indigenous people, who are more affected by interrelated environmental, ethnical, social, and economical issues. ESS is urgently needed in the context of global change and its geographical implications on socio-ecosystems characterized by competition between pastoralism and other land uses [6].
1.2. Associating Ecological Traditional Knowledge to Land Cover and Ecosystem Services Assessment
International institutions have widely underlined the importance of the inclusion of local traditional knowledge in ESS and for biodiversity conservation [2,7,8,9]. Many recent study cases have been conducted around the world, in particular in developing countries such as India, central/south America, and Africa [10,11,12,13]. To our knowledge, a few studies have been carried out in Europe, including southern Spain [14], and one has been designed for Saami’ reindeer herding systems in Finland [6]. In addition, arctic indigenous knowledge such as Saami cultural and ecological knowledge has been included in environmental studies focused on ethnobotany, vegetal communities and their diversity, reindeer forage quality as well as snow characteristics [15,16]. That said, inclusion of ecological terminologies in environmental geography studies and particularly in studies of subarctic socio-ecosystems is still a significant gap.
1.3. Combining Ecological Traditional Knowledge of Saami People to Their Cultural Landscapes
Arctic and subarctic pastoralist societies, associated indigenous cultures and systems of knowledge are particularly affected by the consequences of global change [17,18,19,20]. Reindeer (Rangifer tarandus tarandus L.) constitutes a key-component subspecie, and its role in both the natural and cultural spheres is particularly important. The ability of reindeer to cope with its food needs and spatial requirements may represent a good opportunity to increase arctic and subarctic socio-ecosystems resilience to rapid effects of climate change [15]. Nevertheless, warmer winter temperatures, rapid changes in the water cycle, increasing landscape fragmentation, and human disturbances contribute to undermine reindeer-based societies, in particular Saami pastoral systems in Fennoscandia [15,18,21]. In a holistic view, it is then important to combine the traditional ecological knowledge of reindeer herders with geographical analysis to provide an assessment of land cover, ES, and their dynamics in a case study of reindeer-based society.
1.4. Objectives of the Study
We are seeking to adapt and renew a previous evaluation of ES carried out in northern Finland [6] by integrating cultural, geographical, and temporal dimensions. For this purpose, Saami terminologies (e.g., ecological categories expressed in Saami) have been used to replace some land-use categories of the CORINE Land Cover nomenclature initially applied in the Finnish study [6]. Use of Saami terminologies and associated ecological categories will allow to better assess ES rendered by the reindeer husbandry activity. Our study being limited to one single mountain community/sameby (instead of three forest samebyar in the Finnish study), ratings attributed to the Provisioning, Regulating, Cultural and Supporting ES have been adapted using our field knowledge (vegetation surveys, observation of sacred sites, etc.) and Open Access databases. We also consider the organization of the sameby into seasonal pastures, due to the migratory behavior of the herds within the forest tundra ecotone. Finally, we want to verify the effects of global change by comparing ES over the past 20 years. Taking local knowledge and spatiotemporal heterogeneity (ecological, pastoral) into account allows valuation of ES to be rooted in the reality experienced by reindeer herders living in such changing environment.
Firstly, we integrate Saami terminologies (e.g., ecological categories) in the land cover nomenclature and use them to adapt the ES assessment already led in northern Scandinavia [6]. Adapting land cover to local knowledge associated to reindeer herding and its surrounding culture is a critical point described by the International Centre for Reindeer Husbandry: “The primary goals of the IPY EALAT Project are to assess the vulnerability of reindeer herding—a coupled human ecological system—to climate and other changes in key aspects of the natural and human environments and to build optimal knowledge with scientific data and analyses” [22]. Taking into account of the specific context of Saami ecological knowledge (whose cultural, socioeconomical, territorial, and political claims are focused on reindeer husbandry systems) therefore calls for a consideration of Saami linguistics and associated categories. To achieve this goal, we focused on Saami ecological knowledge, including locally named and defined ecological terminologies, related to agro-pastoralism and their landscapes [23]. In particular, vegetation cover and its botanical composition are taken into account in this study, because of the Saami’ cultural attention to reindeer-appealing vegetation, in addition to culturally valuable plant species (e.g., medicine, cuisine). This includes a listing of ecological terminologies oriented toward vegetation denomination, and how we inferred it at different ecological scales (e.g., species, genus, landscape, temporal). An integration of Saami ecological categories in geographical analysis (e.g., land cover assessment) will be proposed by combining semantical interpretation and its geographical translation by using different geodatabases (CORINE Land Cover and National Natural Protected Areas).
Secondly, we want to geographically adapt ES to the study case and focus analysis on two scales: the level of the community (e.g., sameby) and its seasonal pastures. The study conducted by Finnish ecologists and German geographers was based on a geographical comparison between three samebyar/reindeer herders’ communities in northern Finland [6]. This inter-community approach was particularly interesting, but did not include a comparison between seasonal pastures composing one reindeer herders’ community. Yet, evidence shows that geographical heterogeneity of seasonal pastures constitutes a particularly important matter for reindeer herds’ grazing and ecosystem functioning along the tundra–taiga ecotone/ecocline in particular for montane reindeer pastoral systems [24]. Another adaptation will be to build on the geographical database established by the Swedish Saami Parliament in collaboration with the authorities (RenGIS 2.0; Renbruksplan [25]). Geographical adaptation of Ecosystem Service Assessment (ESA) will use Saami ecological categories for Cultural ecosystem services, and fieldworks led within the study area will contribute to locally adapt ESA for the Supporting, Provisioning and Regulating ecosystem services. Comparison of land cover nomenclatures and ES within the community and between seasonal pastures will thus allow to differentiate ES capacities by spatial units.
Finally, once Saami ecological categories embedded to land cover maps, ES assessment adapted and analysis conducted at the scales of the sameby and its seasonal pastures, we seek to quantify short-term effects of global changes on land covers and ES over time (2000–2018). For this, changes in surface areas will be computed for land covers (including Saami ecological categories) comparing each time frame (2000–2006; 2006–2012; 2012–2018; 2000–2018). A map of land cover change processes, showing most detected land cover changes between 2000 and 2018, will be proposed to geographically identify such changes. Quantification of changes in surface areas will be also carried on ES ranks (related to land cover and Provisioning, Regulating, Cultural, Supporting ES ratings given to each one). Finally, areal ecosystem services capacity (AESC) evolution will be computed to be compared at the sameby scale and its seasonal pastures.
2. Study Area, Material and Methods
2.1. Study Area
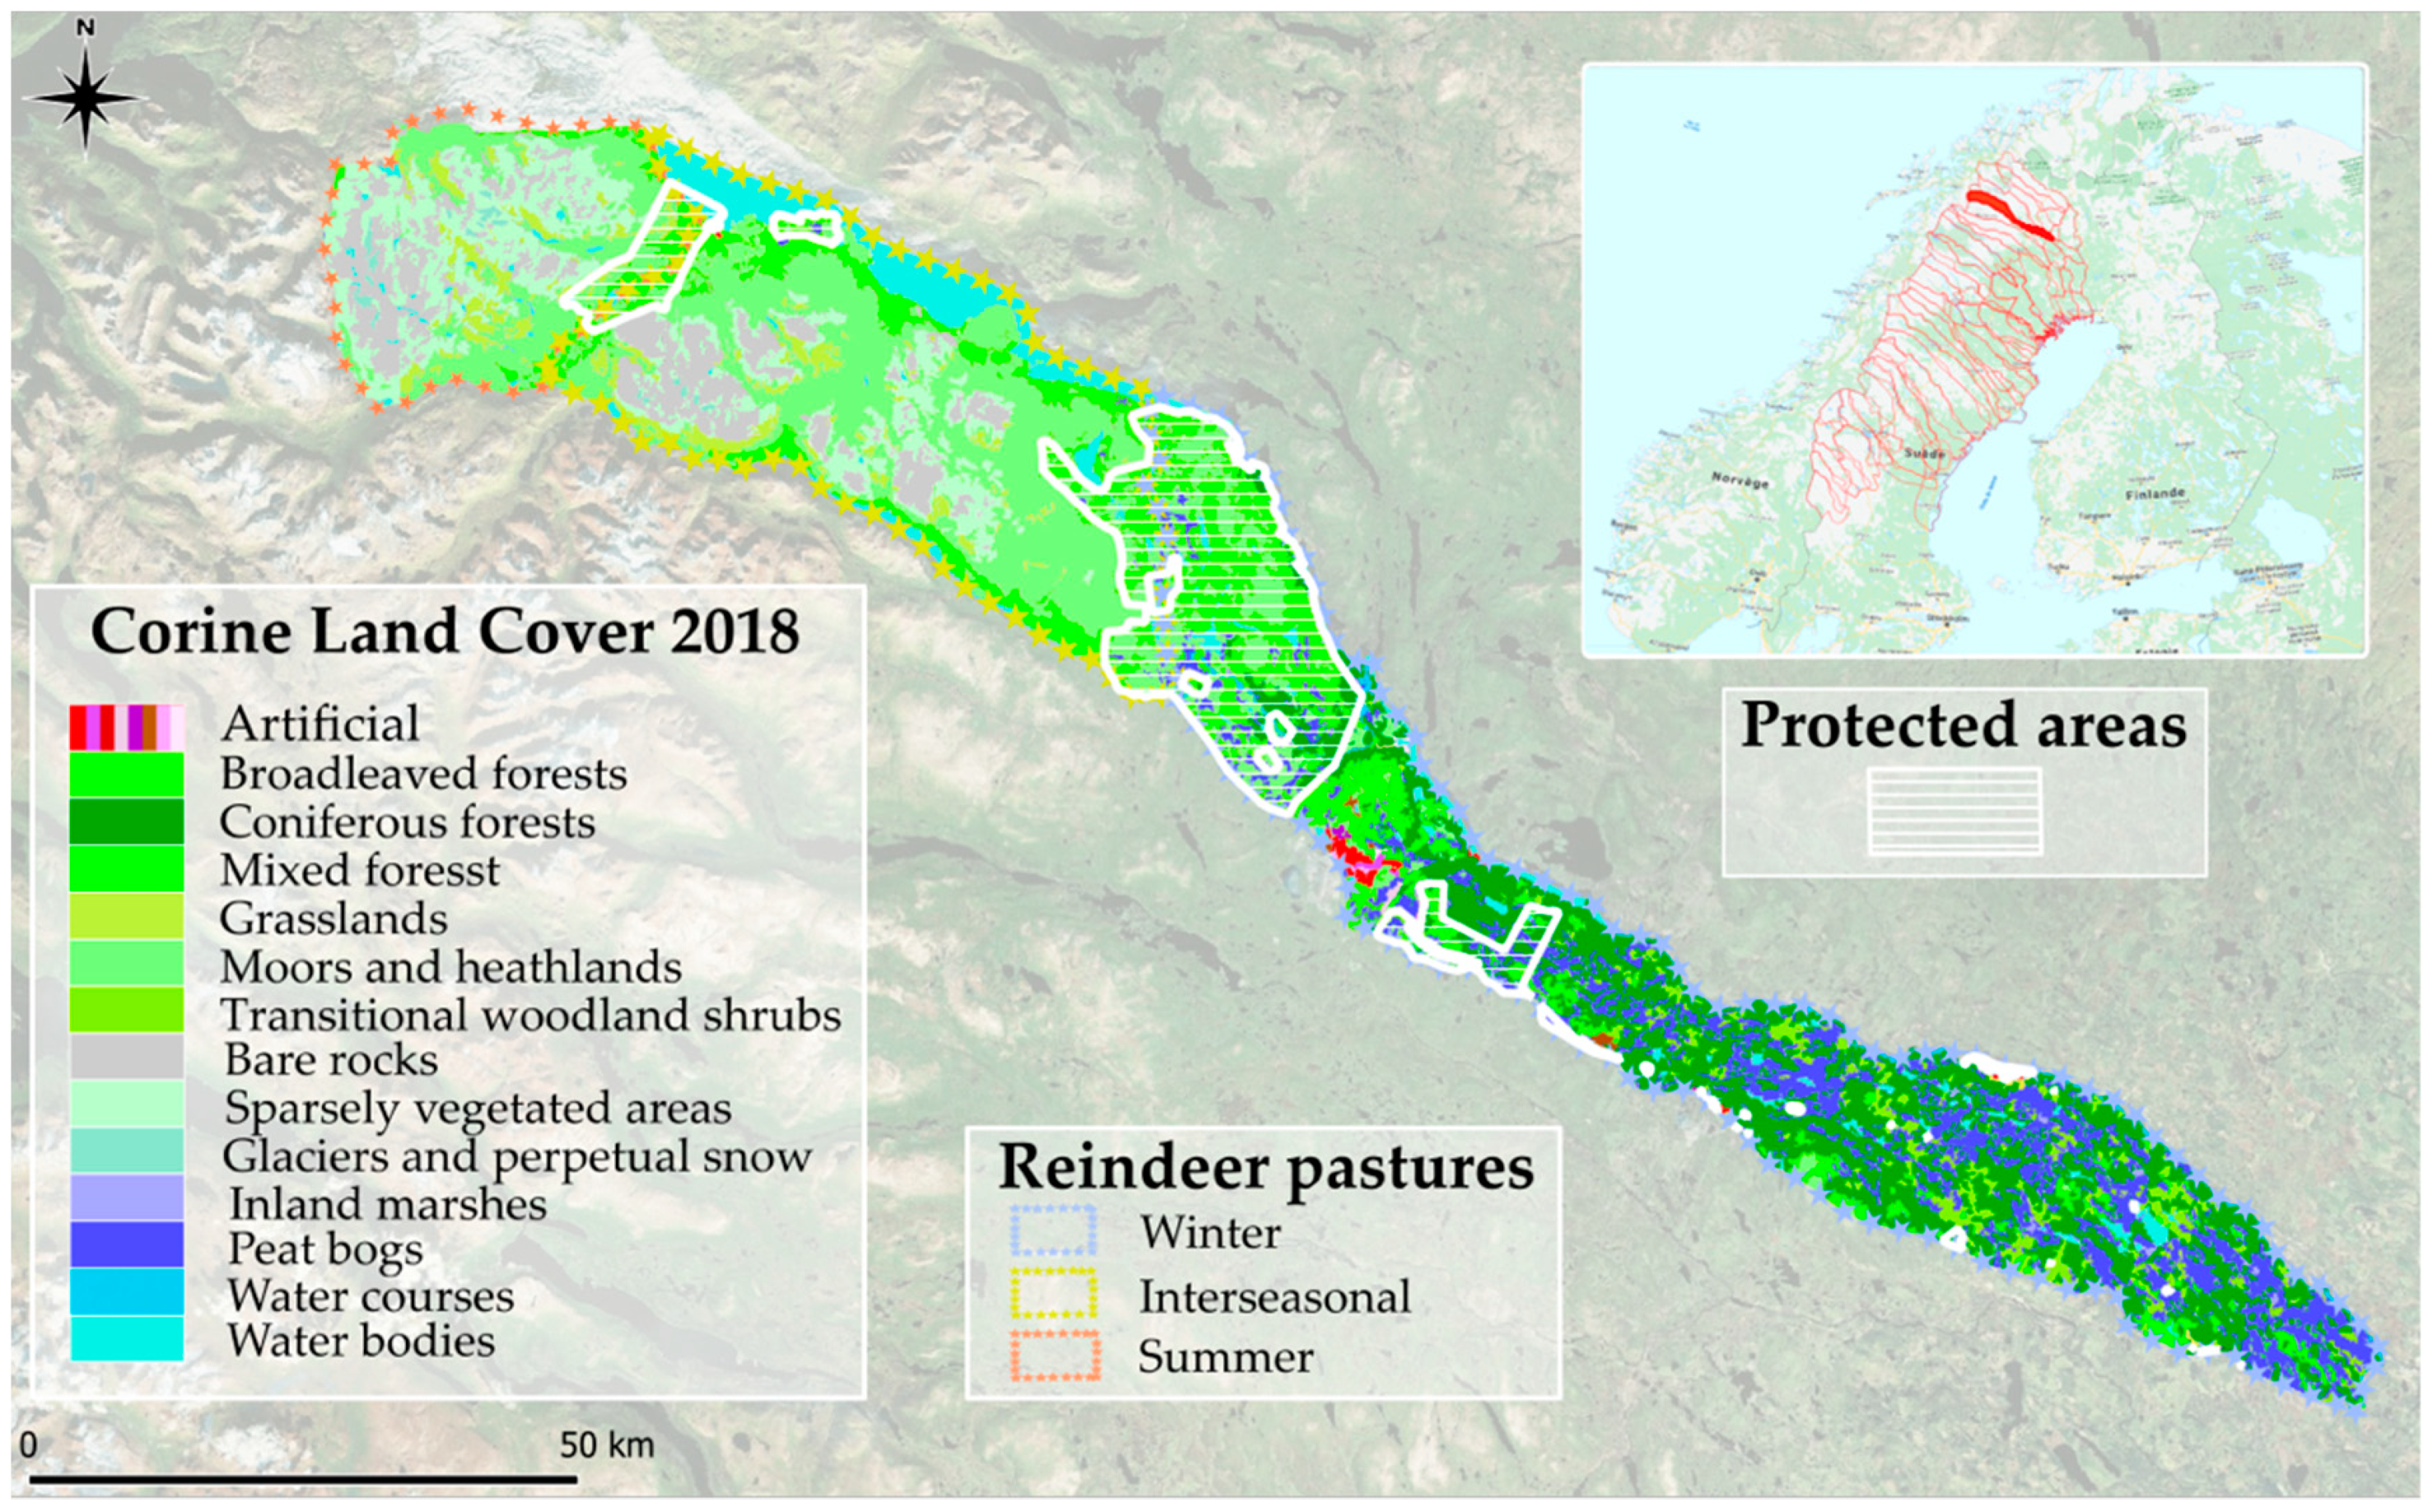
The Gabna reindeer herders’ sameby (e.g., community) is located in northern Sweden (Figure 1). Among other Swedish Saami communities (samebyar, here underlined in red in the location map of the Figure 1), the Gabna reindeer herder pastoralism system is classified as a “mountainous herding system” [26]. Unlike the two other types of community/reindeer pastoral system (“forest” and “concessions”), herds of semi-domesticated reindeer (Rangifer tarandus tarandus L.) have bigger vital areas, with migratory patterns yearly rotating between the coniferous forest biome and upland tundra (here about ~200 km northwestward).
The Gabna reindeer herders’ sameby is set within the tundra–taiga altitudinal ecotone. Specifically, herds of semi-domesticated reindeer range from the northern border of the Scandinavian and Russian taiga in the southeastern part of the sameby to the Scandinavian Montane Birch forest and grasslands in the northwestern highlands. In winter ranges, which are larger than other seasonal pastures (Figure 1), semi-domesticated herds evolve in dark and snowy conditions, primary trampling and grazing from crate to crate terricolous lichens. When spring thaw appears, reindeer and herders start the transhumance towards calving areas, located on the southern blanks of the Torneträske Lake and crossing the pine scot thermic treeline. The reverse movement toward the siida (e.g., winter village) of Kiruna turns back when yearly calves are born, mating season passed, and yearly males slaughtered. The Gabna sameby has 11 reindeer herding private firms for 10 groups of herders, comprising up to 6500 reindeer in winter. Herders of the Gabna sameby are both Swedish and North Saami speakers. Saami and its regional declination are Finno-Ugrian languages, currently experiencing a strong cultural and linguistic renaissance [27].
Administratively, the Gabna sameby belongs to the North Botnia County and stretches between the municipalities of Kiruna and Pajala. This border community is distributed along the upper Torne valley, receiving the European route E10, linking the northernmost part of Sweden and Norway to central regions of Sweden and southern Europe. The Narvik (Norway)–Kiruna–Luleå (Sweden) axis was also historically privileged by the LKAB mining company to convey iron ore by railway (the Iron Ore Line, Malmbanan), now mainly extracted at the Kirunavaara (Kiruna mountain), the largest iron ore mine in the world. Adding to those cumulative effects of transport and mining activities on semi-domesticated reindeer ecology, intensive forestry constitutes a major issue in term of loss of pastures and landscape fragmentation [19,21], as well as summer and winter tourism activities (outdoor and motor sports, husky safaris, etc.) [28].
Protection areas, represented in white dashes in Figure 1, are mostly represented by three juridical conservation measures, with a national designation: Nature reserves, Habitat protection areas, and Wildlife and Plant sanctuaries. Nature reserves are indexed by the International Union for Conservation of Nature (IUCN) Management Category Ib (“wilderness area”, strict protection procedures), whereas Habitat protection areas and Wildlife and plant sanctuaries do not present any assigned IUCN Management Category. Small features (Figure 1), standing for Habitat protection areas and Wildlife and plant sanctuaries can be found within winter pastures, whereas expanded nature reserves are located on the westernmost side of the Gabna sameby.
2.2. Material
2.2.1. Linguistic Material
2.2.2. Geographical Material and Preprocessed Datasets
Geographical Dataset of Reindeer Herding Community and Seasonal Pastures
Geographical data giving Saami reindeer herding territories (e.g., samebyar), area of interest and seasonal pastures are processed using the database and software Rengis 2.0., available on the Swedish Saami Parliament website [35]. RenGIS 2.0 and associated maps result from the Renbruksplan (RBP), initiated in 1998, beard by the Swedish Forest Agency and the Saami Parliament to “increase understanding of the reindeer industries’ needs with other land using-actors” and “give to the Saami samebyar the opportunity to describe their land use in an understandable way for outsiders” [36]. The whole Gabna sameby, as well as seasonal pastures are selected and computed using RenGIS 2.0, converting the aforementioned database as shapefiles, turned into UTM 34 N projection system. The analysis is then conducted at two geographical scales: Gabna sameby in its entirety (~3786 km2), as well as seasonal pastures (winter, inter-seasonal, and summer ones, Figure 1). Seasonal pastures and associated shapefiles were clipped to avoid overlapping territories between them, and conducting the diachronic analysis on proper and well-defined territories.
Land Cover Assessment and Land Cover Changes Datasets
Land cover assessment and land cover changes maps were obtained by downloading the CORINE Land Cover geodatabases of 2000, 2006, 2012 and 2018 (e.g., status layer referring to one-year basis). Related changes in land cover between 2000 and 2006; 2006 and 2012; 2012 and 2018 have been acquired as well. Those geographical datasets are available on the Copernicus Land Monitoring Service website. Covering the greater Europe, CORINE Land Cover mappings catalogue 44 different land covers, with a minimum mapping unit (MMU) from 25 ha for areal land covers, 100 m for linear land covers (roads and pathways). Changes layers proposed by the CORINE Land Cover program give changes between two years (e.g., land cover changes from 2000 to 2006; 2006 to 2012; 2012 to 2018) at a finer spatial resolution, with a minimum mapping unit of 5 ha [37].
Conservation Areas
Conservation areas are here used to spatialize ecological terminologies (Method section and Table 1) and give insights on land cover changes and related ES (Figure 1). Nationally designated areas (CDDA) have been downloaded from the European Environmental Agency Open Access data portal [38] to get conservation areas comprised within the Gabna herders’ territories. Datasets were intersected with reindeer herders’ territories to be later analyzed with land cover maps.
2.2.3. Vegetation Surveys
Field surveys represent botanical surveys operated in summer 2015 and summer 2016 [39]. At the Gabna sameby scale, we chose a semi-stratified sampling strategy based on landscape diversity given by CORINE Land Cover habitats, with a distinction between managed forested areas from swamp coniferous forests. According to the vegetation physiognomy, surveys have been led in two variations: tree layers with the intercept cover technique, and herbaceous layers using 1 × 1 m2 quadrats with contact points and exhaustive floristic listing (including mosses and lichens) along 42 m transects.
2.3. Methods
2.3.1. Saami Ecological Terminologies Interpretation and Implementation as Distinct Land Covers
Analysis and choices of ecological categories have been conducted using various sources from the specialized literature (botanical sciences, anthropology, linguistics, and wordbooks [29,30,31,32,33,34]) and vegetation surveys made within Gabna’ territories [39]. The biogeographical scale of each functional category has been interpreted according to the direct and literal meaning in the case of “Landscape scale”. That said, ecological terminologies might describe a vegetal specie, and/or a vegetal sub-specie, or even induce a temporal and dynamic meaning (Table 1). CORINE Land Cover nomenclature has been used for the geographical assessment of the Saami ecological terminologies. Land covers as semantic categories were complementary and used as geographical proxies to assess one local land cover and associated ES.
Using literature and extensive vegetation surveys conducted in the Gabna seasonal pastures [39], we infer from the “specie scale” whether the plant mentioned is dominant in the vegetation landscapes of the taiga–tundra altitudinal ecotone. For instance, the terminology Lageš (i.e., montane birch) designates a widely distributed tree and a keystone specie of high-altitude wooded tundra. For dynamic ecological terminologies including a temporal aspect (Hàika; old pine), eco-anthropologists and herders have shown that the age of pine forests is important in winter for good reindeer grazing conditions [30]. Here, national areas of natural conservation were taken into account as proxies of forests without any supposed human disturbance (such as industrial forestry activities). Coniferous forests being under a conservation measure status are then estimated as Haika land cover category.
Other terminologies, describing wider environmental conditions (Meahcci; Duottar) are complex. The meaning, brought by crossing literature items [29,30,31,32,33,34] is here important, and the choice has been made to mix land cover categories/habitats (Table 1, terminologies with an (*)). Thus, Meahcci (i.e., “open country, pasture land, wilderness”), evoking a treeless but vegetated landscape, includes altitudinal moors and heathlands and directly adjacent grasslands. For Duottar (i.e., tundra, hill), the choice has been made to include this landscape ecological category as a compromise between patches of grasslands, periglacial/alpine vegetation and moss-rich summits of the highest mountainous areas of the Gabna’ sameby. Thus, CORINE Land Cover habitats of “Natural grasslands” and “Sparsely vegetated areas” were merged (321 and 333 codes of the CLC nomenclature).
2.3.2. Transforming Land Covers Classifications (CORINE and Saami Terminologies) and Surface Areas toward Ecosystem Services Assessment (ESA)
For the ESA, we chose to conduct the method used by Vihervaara, Kumpula et al. (2010) for three main reasons. Firstly, this study focused on three Saami reindeer herders’ communities of northern Finland and the authors led extensive researches to propose a classification of ES (and associated rankings) applicable to our study area. Their work was based on the accepted classifications of the Millennium Ecosystem Assessment (2005) and reinforced by interviews with local stakeholders. Secondly, the methodology employed in their study mostly relies on the CORINE Land Cover database, facilitating implementation of ES and their temporal evolution for our Swedish case study. Finally, similar environmental conditions (e.g., vegetal landscapes distribution, reindeer pastoralism) and issues (forestry, mining activities, effects of current global change) as well as associated methods enable the possibility of comparison between studies and implementation of ES (e.g., Overall Value Habitat).
Table A1 and Table A2 (Appendix A) display ratings which have been attributed for every land cover category (CORINE Land Cover and Saami’ ecological terminologies), according to their biophysical features and their ecological capacity at each main ecosystem service (e.g., Provisioning, Regulating, Cultural, Supporting). Ratings of ES ecosystem services range from 0/2 to 2/2, giving a total of 50/50 by land cover comprising all listed ES.
To adapt ranking of ES to our study area, three variations can be described:
- Original ecosystem rankings directly issued from [6]. Ratings stayed untouched for similar land covers;
- Modified ecosystem rankings, due to regional/local adaptation of ES ratings. Those have been lightly modified to fit with the national, regional and local contexts. For instance, the “Fodder” Ecosystem Service rating was retrograded to 0/2 for all land covers of our study area, given that there is no cattle activity. We used literature and botanical field surveys led in the study area to adjust ES ratings to our study case compared to the original ecosystem ratings [29,30,31,32,33,34,39];
- New land cover types, e.g., Saami landscape categories, which mix up two CORINE Land Cover habitats (Table 1) or another data source (Haika for example, Table 1). We used mentioned sources above to give ES ratings slightly different from original ones. For example, ratings of Duottar (Natural grasslands, code CORINE Land Cover 321 and adjacent Sparsely vegetated areas, code CLC 333) mixed ratings of the two original land covers, with local adaptations (such as reevaluation of the Ecosystem Service “Reindeer” according to floristic surveys, due to higher vegetal diversity and cover of grazing species for this summer/altitudinal land cover). For ES belonging to the Cultural capacity, each Saami landscape category/land cover was inflated for the Ecosystem service “Local and Saami culture”, giving a ranking of 2/2 (Appendix A).
Once ES rankings have been attributed for land covers composing the Gabna sameby landscapes, land cover datasets (Gabna and its seasonal pastures extents) were reclassified using ArcMap 10.4 software and SQL queries. Two main results were calculated:
- The sum of each ES by land cover, giving Overall habitat value (OHV) by land cover, with 50 as maximum OHV;
- Areal Ecosystem Service Capacity indices (AESC), summarizing Ecosystem Capacity for the four main ecosystem services capacities (Provisioning, Regulating, Cultural, and Supporting), at the scale of seasonal pastures and the whole Gabna sameby. Here the four intermediate habitat values have been calculated. Each habitat value corresponds to the mean of the group of ES describing each ecosystem capacity (Appendix A). The four mean of each ES Capacity were then attributed to attribute tables using Excel functions. Pivot tables have been computed to sum up AESC calculated on land covers constituting the analyzed spatial units (Gabna sameby; seasonal pastures).
2.3.3. Temporal Evolution of Land Covers, Ecosystem Services and Areal Ecosystem Service Capacity (AESC) 2000 to 2018: Area Calculations and Changes Mapping
To quantify evolution of land cover types we calculated areas for community and seasonal pastures land cover shapefiles using ArcMap 10.4 software. From the CORINE Land Cover status layers referring to one-year basis, and after preprocessing it (clipping by RenGIS 2.0 Gabna’ territories and seasonal pastures), we exported attribute tables and we summed up areas for every land cover category. Areas differences (in km2 and %) between land cover categories at four shifts (2000–2006; 2006–2012; 2012–2018; 2000–2018) were calculated. The same operation was reiterated by taking account of Saami ecological categories as land covers, and comparing temporal analysis with initial CORINE Land Cover habitats.
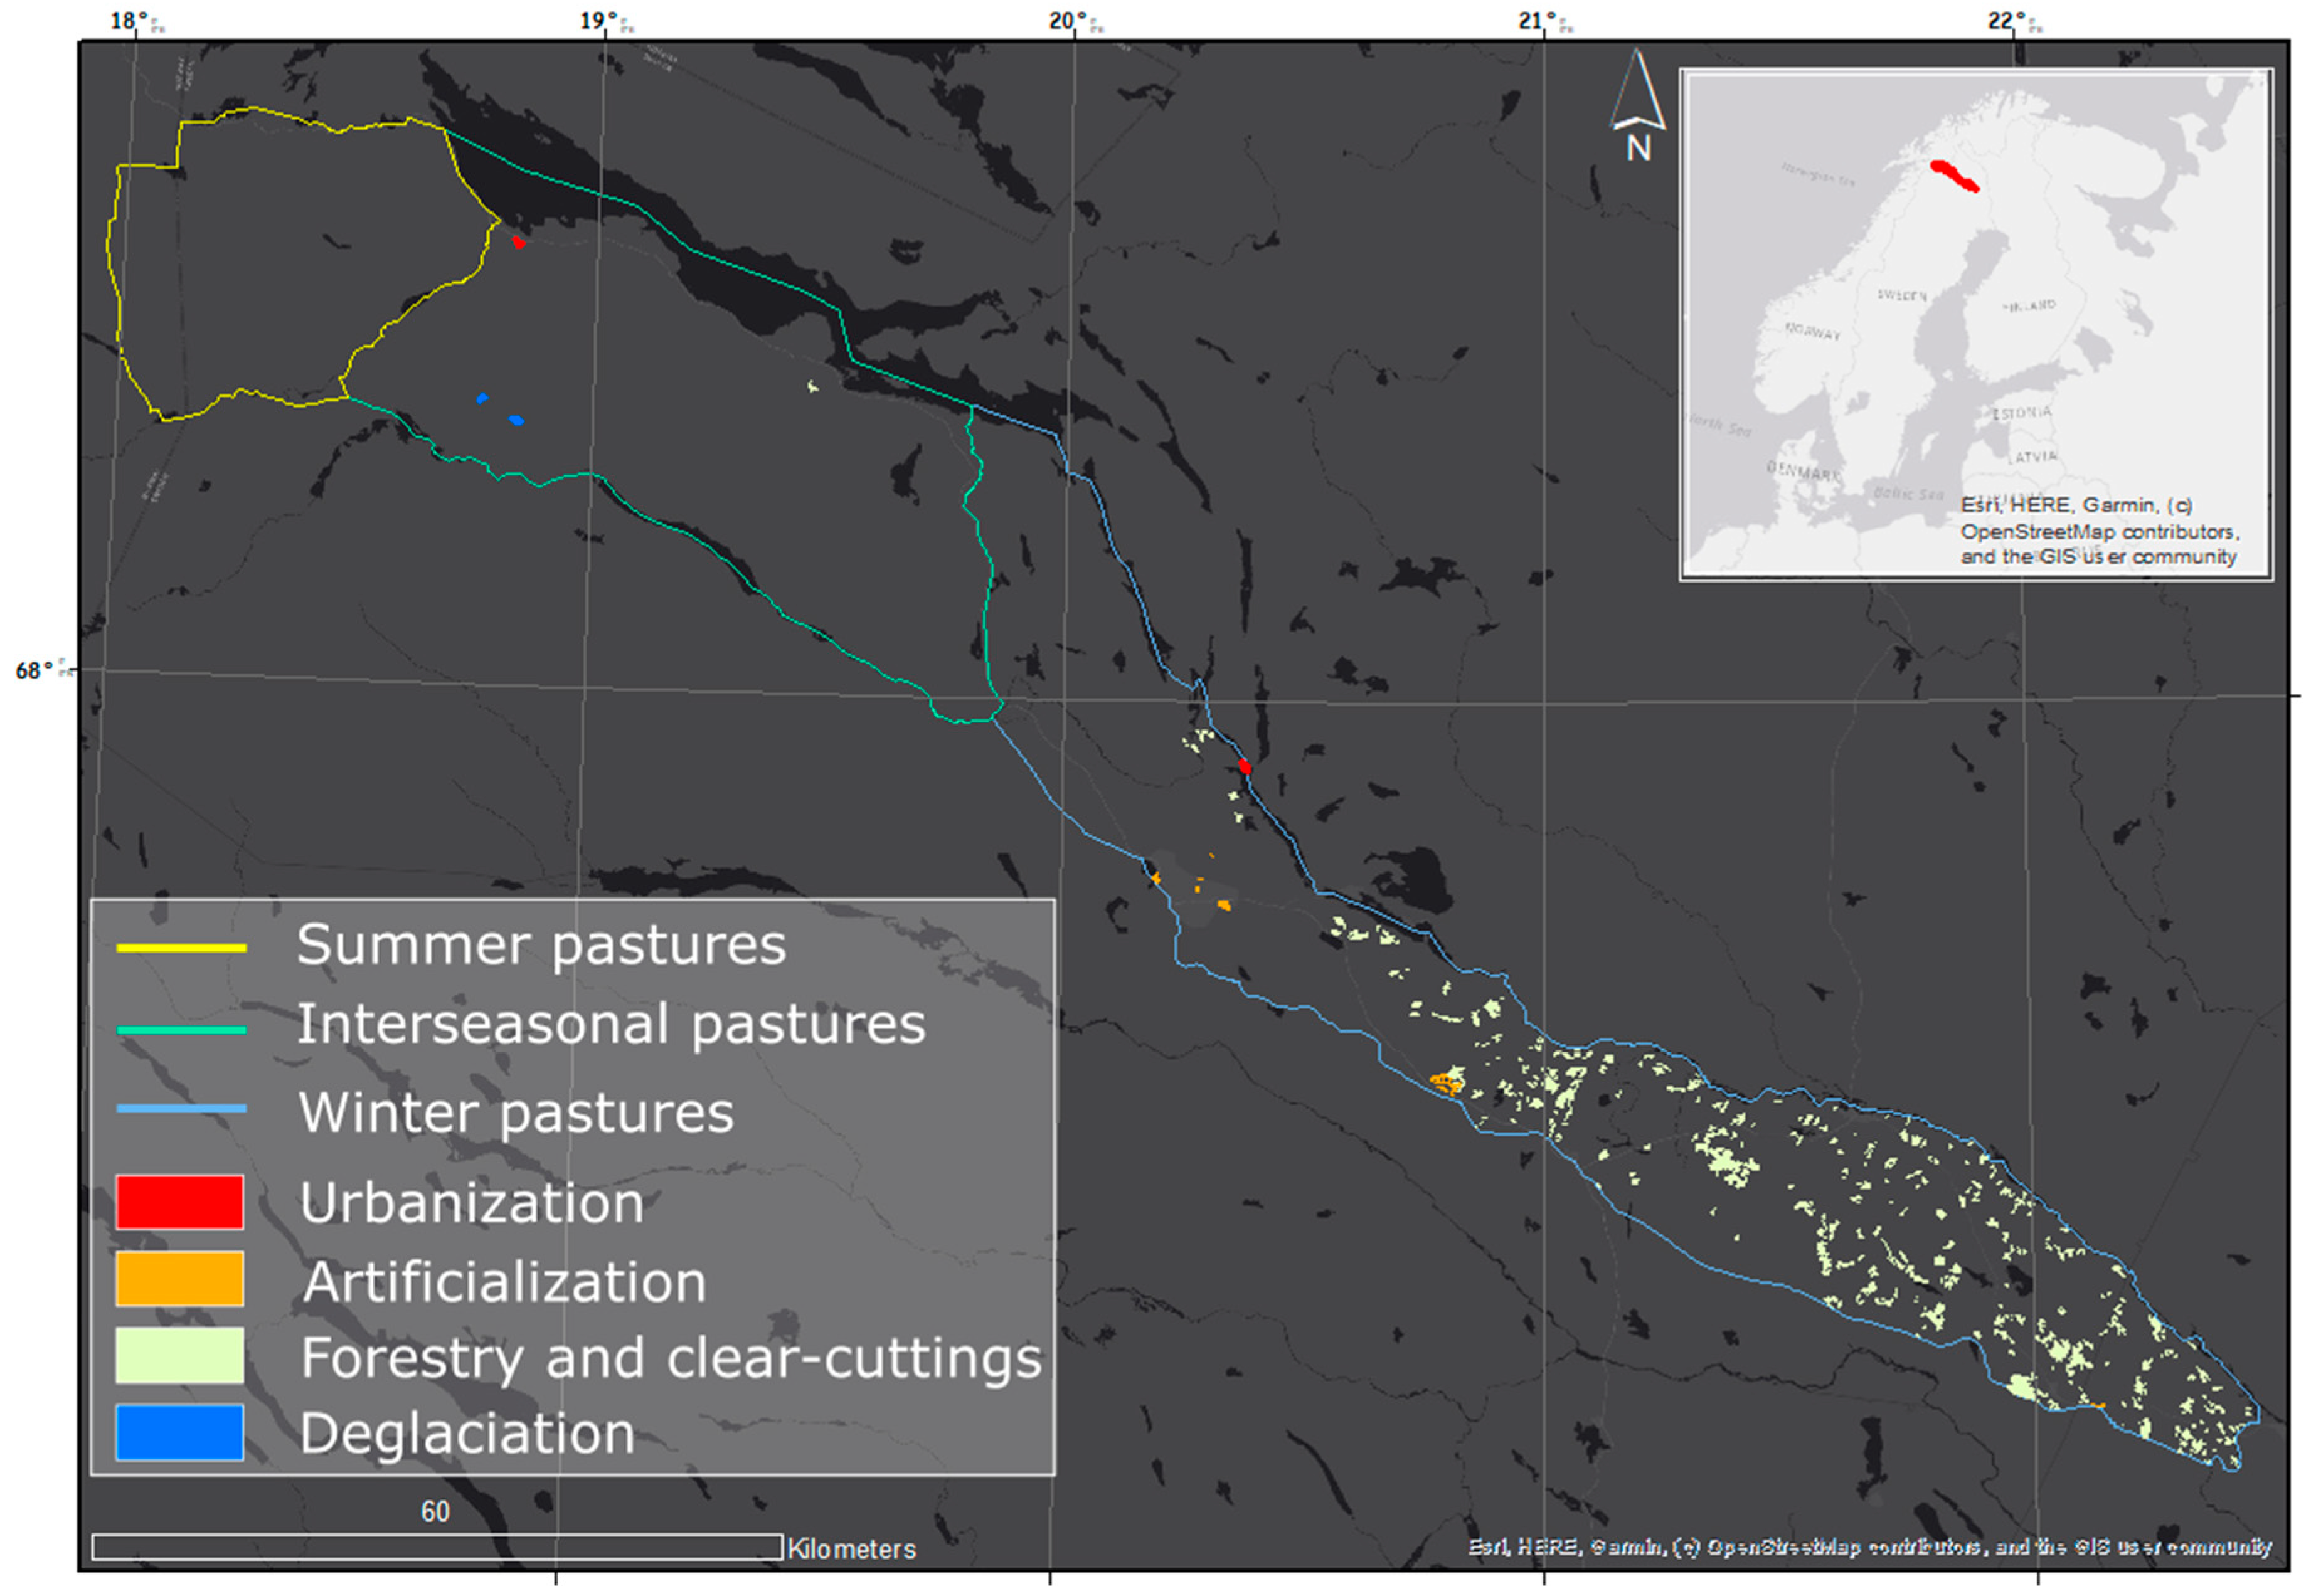
Based on CLC changes layers, a map of land cover changes at the Gabna’ reindeer sameby is then made, to identify changes (previously expressed in changes of areas) for the totality of the available time series (2000–2018). Land cover changes regarding the 2000–2006, 2006–2012, 2012–2018 periods are then listed, summarized, and reclassified giving four dominant land cover processes changes. Reclassified dominant land cover changes processes are those given to the final classes of the map: 1—Urbanization (from one land cover to “Discontinuous urban fabric” category); 2—Artificialization (from one land cover to an artificial land cover excluding “Discontinuous urban fabric”); 3—Forestry, including clear-cuttings (“Mixed” and “Coniferous forests” to “Transitional woodland scrub”) and forest plantation (“Transitional woodland scrub” to “Coniferous” and “Mixed forests”); and finally 4—Deglaciation (from “Glaciers and perpetual snow” to “Bare rocks”). Other land cover changes and associated processes (e.g., shrubification, expanding water courses or roads) represent less than 1% of the overall changes of areas and were then neglected for the analysis.
Finally, evolution of surface areas of ES overall value habitat (OVH) and areal ecosystem services capacity (AESC) followed the same procedure as mentioned above for land cover evolution: OVH and AESC areas were exported date by date for seasonal pastures and at the whole community scale, before being summed up with Excel.
3. Results
3.1. Cultural Dimension
Table 2 compares surface areas between the CORINE Land Cover nomenclature classes and adapted Saami classes in 2018. Beahcevuovdi stand for 91% of the overall Coniferous forests areas composing the Gabna sameby. Hàika (e.g., Coniferous forests included in a protection status) represent 9% of the 312 CORINE Land Cover class. Broadleaved forests (CLC 311), with a “simple” forest composition, are the equivalent of Lageš (e.g., Birch, Betula pubescens L.) in surface area, representing from both sides 541 km2 at the scale of the Gabna sameby. Meahcci surface areas are quite comparable with Moors and Heathlands CLC habitat (respectively 772 km2 and 854 km2). Landscape composition of the Saami category (meaning “open country, pasture land, wilderness”) and its geographical interpretation (see Table 1 and Section 2.3), excluded boreal moors and heathlands, explaining the differences in surface areas with the coarser Moors and heathlands. Duottar (463 km2) merged Natural grasslands and Sparsely vegetated areas CORINE Land Cover habitats (respectively 117 and 346 km2). Since those ecological habitats can only be found at elevations above 900 m (ridges of the summer/interseasonal pastures) and due to the vertical zonation of vegetal cover, all Sparsely vegetated areas of the Gabna community were adjacent to Natural grasslands.
3.2. Geographical Dimension
Overall values of ES, ranging from 0 to 50, are shown in the Table 3 with related land cover classes. These classes describe the landscape composition of the Gabna sameby. Only two land cover present the same overall value of ES (Duottar and Water courses), other land covers being separated. Natural areas and Saami land cover have the highest overall values (Hàika, Beahcevuovdi, Mixed forests, Lageš > 33.5/50) due to their high ES capacities values (Regulating, Cultural and Supporting >1.5/2). Land cover presenting a low vegetal cover (Artifical, Bare rocks, Glaciers and perpetual snow) have the lowest overall value of ES (<15/50), mainly explained by their low contribution for Provisioning, Regulating and Supporting ES capacities. Highest overall value of ES, represented by forest habitats, can be found in low elevations due to the lower thermal constraint on forest growth (mainly within winter pastures, lakes shorelines).
Table 4 shows the Areal ecosystem service capacity indices (AESC) in 2018, computed with the ecosystem assessment adapted to the Gabna sameby. Total index (mean) summarizes the four main ecosystem services capacities (Provisioning, Regulating, Cultural and Supporting ES). At the scale of the Gabna sameby, stronger indexes are reached by Cultural ES, whereas weakest are represented by Provisioning ES. From a geographical point of view, winter pastures have the most important total indexes, meaning that a big part of ES are concentrated within those territories. Such value in the total index is due to the highest Supporting ES compared to other spatial units. The highest Regulating ecosystem service capacity index is also reached by winter pastures (AESC = 1.33). Significant portions of coniferous and mixed forests within winter pastures and their specific traits in ecosystem structures and functions explain largest values (Appendix A for further details).
On the other hand, summer pastures indexes are less important, mainly due to their geographical features (altitudinal tundra ecotone, above treelines) and associated low rankings of Provisioning, Regulating and Supporting services. That said, Cultural ES capacity indices are higher for summer and inter-seasonal pastures. Such results can be explained by the presence of mountains, the surroundings of the Lake Torneträske (Esthetic landscapes and Recreation ES), as well as significant surface areas presenting the highest “Local and Saami culture ES” rates (Lageš/birch forests; Meahcci/Moors and heathlands and adjacent natural grasslands; Duottar/Natural grasslands and adjacent Sparsely vegetated areas).
3.3. Temporal Dimension
3.3.1. Quantification of Land Cover Changes between 2000–2006–2012–2018 at the Scale of the Gabna Reindeer Herders’ Sameby
Table 5 and Table 6 show land cover changes in area at the scale of the Gabna sameby for the monitored period. Changes between dates are expressed in square kilometers and in brackets percentages (on the entire sameby). Only changes in area being above 1 km2 are shown here. Table 5 pertains to the CORINE Land Cover categories, whereas Table 6 shows results in change areas for ecological categories expressed in north Saami. For the whole period of the survey (2000–2018), major changes in area are noticed for three land cover categories: Coniferous forests (code CLC 312, Table 5), Beahcevuovdi (non-managed and non-protected coniferous forests, Table 6) and finally Forestry/Transitional woodland shrubs (code CLC 324). Other land cover evolutions are negligible (<0.1%), besides Mixed forests and Haika (Coniferous forests with a protection status, Table 6) showing a light but mentionable increasing. Increase in Beahcevuovdi surface areas, and decrease in Transitional woodland shrubs suggest the Saami category still includes managed Coniferous forests and linked cycles of industrial forests for both categories.
During 2000–2006, changes are very slight (less than 0.2% of the overall area, or less than 7 km2). Coniferous forests and Forestry/Transitional woodland shrubs display the most important changes in extent. Sparsely vegetated areas are lightly increasing, also revealed by the land cover Duottar (Table 6). For the 2006–2012 period, changes in area are the most intense among all dates (about 1% of the overall sameby, or 40 km2). Forestry/Transitional woodland shrubs category shows the greatest change, followed by Coniferous forests. For 2012–2018, changes in cover range from 0 and 5 km2 for the whole sameby extent (e.g., 3786 km2). Biggest change in cover touch on Forestry/Transitional woodland shrubs, Dump sites coming at the second place in terms of changes in extent, with Coniferous forests and Mixed forests.
As seen on Table 5 and Table 6, changes in areas over the monitored period mainly affect the Scandinavian boreal forests and its margins. Effects of industrial forestry are visible through several cycles of forest regeneration, as suggested by changes and alternation in land cover extent between Coniferous forests and Transitional woodland shrubs. Lageš (i.e., Broadleaved forest), mainly located in altitudinal pastures (summer and inter-seasonal) showed negligible changes along the period, outlining the coarse resolution of CORINE Land Cover mappings and its evolution along the four base years.
Strong evolutions within boreal forests, mentioned above calls then for a spatialization of the results, in particular detected changes at the scale of seasonal pastures composing the Gabna pastoral system. Figure 2 maps changes in land cover according to the CORINE Land Cover changes layers, from 2000 to 2018 with a minimum mapping unit of 5 ha. The map summarized four different kind of changes in terms of process (Urbanization, Artificialization, Forestry and clear-cuttings and Deglaciation). As already mentioned, and here illustrated in Figure 2, most of temporal changes in surface area are related to the Forestry and clear-cuttings category. Major changes mainly occur within the winter pasture, representing 98.9% of all changes in land cover for the monitored period (2000–2018). Those changes are widely represented by the Forestry and clear-cuttings, concentrated at the east of the city of Kiruna but spread all along the winter pasture, until Svappavaara in the far southeast corner of the Gabna sameby. They represent 5% of the surface area. Summer pastures do not show any change, whereas surprisingly inter-seasonal pastures display one case of Industrial reforestation, one case of Urbanization (village of Abisko) and two cases of Deglaciation (Giron, Čoamohas and Ballinčohkka mountains).
3.3.2. Quantification of Ecosystem Services Changes in Area and in Service Capacity over the 2000–2018 Time Series
Table 7 presents temporal changes in surface area for land covers rated according to their scored Providing, Regulating, Cultural and Supporting capacities (Appendix A). Here ES ratings blend land covers expressed in Saami as well as non-translated land covers (Methods section). Only rated ES showing an evolution bigger than 1 km2 are shown. Overall ES ratings range between 7/50 (very low; mainly artificial surfaces) and 39/50 (very high; Haika, protected coniferous forests). The lowest rating (7/50, Artificial areas) is currently increasing in area, whereas the rate 16/50 (Forestry) seems to decrease significantly.
Table 8 displays the progression of Areal Ecosystem Service Capacities (AESC) for 2000, 2006, 2012, and 2018 for seasonal pastures and the whole Gabna’ territories. Total index (mean) summarizes the four main ES capacities (Provisioning, Regulating, Cultural and Supporting ES). The Gabna’ total index decreases from 1.23 in 2000 to 1.21 in 2006, lightly increases in 2012 and 2018 (respectively 1.22 and 1.23). The evolution of the total index is mainly explained by the Cultural and Supporting ES, which have the same kinetic (decreasing g from 2000 to 2006, then slight rises during 2006–2012 and 2012–2018). Regulating services draws a distinction, being steady in its total index. Winter pastures have a total index which remains stable with 1.31, reflected by the steadiness of all Ecosystem Service Capacities along time. Most changes in AESC occur within summer pastures, driven by changing Provisioning and Supporting indexes over 2000–2018. Provisioning capacity indexes are decreasing for this pasture over 2000–2018, whereas Supporting ones are mildly increasing. Total index decreases slightly over time for summer and inter-seasonal pastures, the date 2006 standing out compared to other dates.
4. Discussion, Conclusion and Perspectives
The present study had three focuses and questionings, mainly represented by (1) the integration of traditional terminologies related to cultural landscapes; (2) the geographical adaptation of the ecosystem services assessment (ESA); (3) lastly by the temporal evolution of land covers and ES within a sensible reindeer herding pastoralism system.
The first work is represented by the inclusion of local knowledge in the land cover assessment, in particular ecological terminologies meaningful at the landscape level. At the scale of the Gabna sameby, results showed few changes between original CORINE Land Cover classes and adaptation using Saami linguistic categories describing landscapes. This first result corroborates statements made on overlapping knowledge between science and local/traditional knowledge in environmental sciences [7,9]. That said, the present attempt of knowledge co-construction needs an important task of validation with native Saami people and linguists to strengthen land cover assessment and downstream implementation of surveys and related environmental policies.
The question of the ESA (e.g., ratings according to land covers and its co-construction) and associated Areal Ecosystem Services Capacities calculated for each seasonal pasture composing the Gabna sameby showed that ES directly involved in reindeer herds’ well-being were higher compared to concurrent ones. Cultural ES were more frequent in summer and inter-seasonal pastures agreeing with the study [6]. Finnish reindeer herders’ Saami communities characterized by mountainous and lake landscapes had more cultural (i.e., esthetic) ecosystem values, whereas communities (or seasonal pastures in our study) characterized by wider forest areas had inflated Provisioning and Supporting values/indexes. However, summer and inter-seasonal pastures, with higher Cultural ecosystem values concentrate an important part of reindeers’ biological activity (for forages: diversification of reindeers’ diet; for biological cycle: rutting and calving areas) and seem to be more responsive to the current climate warming effects [35]. Studied assessment of ES has then to be discussed with reindeer herders. It would be particularly informative to present those first results to them (inclusion of local terminologies, ESA, temporal evolution), and discuss (1) ES important for the herding activity, (2) the rate they could give on it, (3) specific ES and/or land covers it would be necessary to have protection measures.
For temporal evolution of land covers, as seen, Saami categories/land covers presented very few changes in surface areas. Shifts, mainly located within winter pastures are due to stakeholders and economic powers which are not related to reindeer herding pastoral systems:
- (1)
- Industrial forestry cycles, clearly visible when looking at Transitional vegetation and shrublands (CLC), Beahcevuovdi (Saami) and Coniferous forest (CLC) co-evolutions. The latter Saami category does not include young Scots pine trees/plantations (represented by the Transitional vegetation shrublands category) but appears to be still affected by forest industries (clear-cuttings/loss of surface area). Forestry being however statistically related to landscape fragmentation [21] in the area, it damages key pastures for reindeer herds of the Beahcevuovdi land cover. Such spatial concurrence between forestry and reindeer herding activity is notably mentioned within the literature [6] and is here confirmed in our study area;
- (2)
- (3)
- Urbanization, in combination with the two mentioned human processes, also driven by winter/summer tourism industries and recreational activities development [28].
Mentioned economic powers evoked above are based on communication pathways (railroads, highways, hiking trails, cableways, and logging roads) which contribute to the fragmentation of habitats and migration routes for reindeer herds [21]. Acquiring more detailed datasets on concurrent activities involved in landscape transformations (forestry uses, tourism frequentation) as well as more accurate land covers assessment on longer time series (using MODIS and Landsat imageries) would greatly improve the overall methodology to detect global changes effects and related ES modifications.
Author Contributions
Conceptualization, R.C. and M.C.; Formal analysis, R.C. and M.C.; Methodology, R.C. and M.C.; Supervision, M.C.; Writing—original draft, R.C. All authors have read and agreed to the published version of the manuscript.
Funding
This research received no external funding, APC was funded by the GDR Arctique CNRS-Meudon and Sorbonne-Université.
Acknowledgments
We are grateful for the Swedish Saami Parliament and the Abisko Research Station for their assistance and sharing their knowledge and time. We also want to acknowledge institutional portals, such as the Copernicus Land Monitoring Service and the European Environmental Agency for providing Open Access data. We are grateful to the referees for their constructive inputs.
Conflicts of Interest
The authors declare no conflict of interest.
Appendix A

Table A1.
Ecosystem services and values associated to land cover categories and main ecosystem productions [1] 0/2 = non-contributive, 2/2 = very contributive. Habitat value and overall habitat value are respectively averaged and summed, according to their contributions for a given land cover (continue hereafter, Table A2). ([*]) indicate rates of ecosystem services values modified by fieldworks or literature.
| Ecosystem Service | Artificial 1 | Agriculture 2 | Lageš3 | Beahcevuovdi4 | Hàika5 | Mixed Forests | Moors and Heathlands 6 | Meahcci7 |
|---|---|---|---|---|---|---|---|---|
| Provisioning | ||||||||
| Reindeer | 0 | 1 | 1 | 1 | 2 | 2 | 2 | 2 |
| Hunting | 0 | 1 | 2 | 2 | 2 | 2 | 1 | 1 |
| Fish | 0 | 0 | 0 | 0 | 0 | 0 | 0 | 0 |
| Berries, mushroom | 0 | 0 | 2 [*] | 2 | 2 | 2 | 1 | 1 |
| Fodder | 0 | 2 | 0 [*] | 0 [*] | 0 | 0 [*] | 1 | 0 [*] |
| Medicine | 0 | 0 | 2 [*] | 2 | 2 | 1 | 0 | 0 |
| Wood | 0 | 0 | 1 | 2 | 2 | 2 | 0 | 0 |
| Water | 0 | 0 | 1 | 1 | 1 | 1 | 1 | 1 |
| Energy | 0 | 0 | 1 | 2 | 2 | 2 | 0 | 0 |
| Genetic resources | 0 | 2 | 2 | 1 | 2 | 2 | 2 | 2 |
| Habitat value | 0 | 0.6 | 1.1 | 1.3 | 1.5 | 1.4 | 0.8 | 0.7 |
| Regulating | ||||||||
| Local/regional climate | 0 | 0 | 2 | 1 | 2 | 2 | 1 | 1 |
| Carbon sequestration | 0 | 1 | 2 | 2 | 2 | 2 | 1 | 1 |
| Pollination | 1 | 2 | 1 | 2 [*] | 2 | 2 [*] | 2 | 1 [*] |
| Flood prevention | 2 | 0 | 1 | 1 | 1 | 1 | 0 | 0 |
| Erosion prevention | 1 | 0 | 2 | 2 | 2 | 2 | 2 | 2 |
| Nutrient sequestration | 2 | 2 | 1 | 1 | 1 | 1 | 1 | 1 |
| Habitat value | 1 | 0.83 | 1.5 | 1.5 | 1.6 | 1.6 | 1.2 | 1 |
| Cultural | ||||||||
| Local and saami culture | 1 | 2 | 2 [*] | 2 [*] | 2 [*] | 2 | 1 | 2 [*] |
| Esthetic landscape | 0 | 1 | 2 | 2 [*] | 2 | 2 | 2 | 2 |
| Intrinsic value of nature | 0 | 0 | 2 | 2 [*] | 2 | 1.5 [*] | 2 | 1.5 [*] |
| Recreation | 0 | 0 | 2 | 2 | 2 | 2 | 2 | 2 |
| Habitat value | 0.25 | 0.75 | 2 | 2 | 2 | 1.9 | 1.75 | 1.9 |
| Supporting | ||||||||
| Photosynthesis | 0 | 2 | 1.5 [*] | 2 | 2 | 2 | 1 [*] | 1 [*] |
| Nutrient cycling | 0 | 2 | 2 | 2 | 2 | 2 | 2 | 2 |
| Soil formation | 0 | 2 | 2 | 2 | 2 | 2 | 1.5 [*] | 1.5 [*] |
| Habitat value | 0 | 2 | 1.83 | 2 | 2 | 2 | 1.5 | 1.5 |
| Overall habitat value | 7 | 20 | 33.5 | 36 | 39 | 35.5 | 26.5 | 25 |
1 Artificial land covers (categories 112, 121, 122, 124, 131, 132, 141, 142); 2 Agriculture: 231, 241, 243; 3 Lageš: 311 (Broadleaved forest); 4 Beahcevuovdi: category 312 without natural conservation (Coniferous forest); 5 Hàika: category 312 (Coniferous forest) within conservation areas; 6 Moors and heathlands with no adjacent natural grasslands (non alpine Moors and heathlands); 7 Meahcci (Moors and heathlands 322 and adjacent natural grasslands 321).
Table A2.
Second part of ecosystem services and values associated to land cover categories and main ecosystem productions [1] 0/2 = non-contributive, 2/2 = very contributive. Habitat value and overall habitat value are respectively averaged and summed, according to their contributions for a given land cover. ([*]) indicate rates of ecosystem services values modified by fieldworks or literature.
| Ecosystem Service | Forestry/Transitional Woodland/Shrub | Duottar1 | Bare Rocks | Glaciers and Perpetual Snow | Inland Marshes and Peat Bogs | Water Courses | Water Bodies |
|---|---|---|---|---|---|---|---|
| Provisioning | |||||||
| Reindeer | 1 | 1.5 [*] | 0 | 0 | 1 | 0 | 0 |
| Hunting | 1 | 0.75 | 0 | 0 | 1 | 1 | 2 |
| Fish | 0 | 0 | 0 | 0 | 0 | 2 | 2 |
| Berries, mushroom | 1 | 0.75 | 0 | 0 | 2 | 0 | 0 |
| Fodder | 0 | 0 [*] | 0 | 0 | 0 [*] | 0 | 0 |
| Medicine | 0 | 0 | 0 | 0 | 2 | 0 | 0 |
| Wood | 2 | 0 | 0 | 0 | 0 | 0 | 0 |
| Water | 0 | 1 | 1 | 1 | 2 | 2 | 2 |
| Energy | 1 | 0 | 0 | 0 | 1 | 2 | 1 |
| Genetic resources | 1 | 1.75 | 1 | 1 | 2 | 2 | 2 |
| Habitat value | 0.7 | 0.57 | 0.2 | 0.2 | 1.1 | 0.9 | 0.9 |
| Regulating | |||||||
| Local/regional climate | 1 | 1 | 1 | 2 | 2 | 2 | 2 |
| Carbon sequestration | 1 | 0.75 | 0 | 0 | 2 | 0 | 1 |
| Pollination | 2 [*] | 1 [*] | 0 | 0 | 1 [*] | 0 | 0 |
| Flood prevention | 1 | 0.25 | 1 | 2 | 2 | 2 | 2 |
| Erosion prevention | 0 | 1.5 | 0 | 0 | 0 | 0 | 0 |
| Nutrient sequestration | 0 | 0.75 | 0 | 0 | 2 | 0 | 1 |
| Habitat value | 0.83 | 0.87 | 0.3 | 0.6 | 1.5 | 0.6 | 1 |
| Cultural | |||||||
| Local and saami culture | 0 | 2 [*] | 2 | 2 | 1 | 2 | 2 |
| Esthetic landscape | 0 | 2 | 2 | 2 | 1 | 2 | 2 |
| Intrinsic value of nature | 0 | 1 | 2 | 2 | 1 [*] | 2 | 1 |
| Recreation | 1 | 2 | 2 | 2 | 2 | 2 | 2 |
| Habitat value | 0.25 | 1.75 | 2 | 2 | 1.25 | 2 | 1.75 |
| Supporting | |||||||
| Photosynthesis | 1 | 1 [*] | 0 | 0 | 1 | 0 | 1 |
| Nutrient cycling | 1 | 2 | 0 | 0 | 1 | 1 | 1 |
| Soil formation | 1 | 1 [*] | 0 | 0 | 2 | 0 | 0 |
| Habitat value | 1 | 1.3 | 0 | 0 | 1.3 | 0.3 | 0.6 |
| Overall habitat value | 16 | 22 | 12 | 14 | 29 | 22 | 24 |
1Duottar: (Grasslands 321 adjacent to Sparsely vegetated areas 333).
References
- Kates, R.W. What kind of a science is sustainability science? Proc. Natl. Acad. Sci. USA 2011, 108, 19449–19450. [Google Scholar] [CrossRef] [PubMed] [Green Version]
- Millennium Ecological Assessment. Ecosystems and Human Well-Being; Island Press: Washington, DC, USA, 2005. [Google Scholar]
- Naidoo, R.; Balmford, A.; Costanza, R.; Fisher, B.; Green, R.E.; Lehner, B.; Malcolm, T.R.; Ricketts, T.H. Global mapping of ecosystem services and conservation priorities. Proc. Natl. Acad. Sci. USA 2008, 105, 9495–9500. [Google Scholar] [CrossRef] [PubMed] [Green Version]
- Power, A.G. Can Ecosystem Services Contribute to Food Security? In Routledge Handbook of Ecosystem Services; Routledge: Abingdon, UK, 2016; pp. 491–500. [Google Scholar]
- Hein, L.; Van Koppen, K.; De Groot, R.S.; Van Ierland, E.C. Spatial scales, stakeholders and the valuation of ecosystem services. Ecol. Econ. 2006, 57, 209–228. [Google Scholar] [CrossRef]
- Vihervaara, P.; Kumpula, T.; Tanskanen, A.; Burkhard, B. Ecosystem services-A tool for sustainable management of human–environment systems. Case study Finnish Forest Lapland. Ecol. Complex. 2010, 7, 410–420. [Google Scholar] [CrossRef] [Green Version]
- Ferrier, S.; Ninan, K.N.; Leadley, P.; Alkemade, R.; Acosta, L.A.; Akçakaya, H.R.; Kabubo-Mariara, J. The Methodological Assessment Report on Scenarios and Models of Biodiversity and Ecosystem Services; Secretariat of the Intergovernmental Platform for Biodiversity and Ecosystem Services: Bonn, Germany, 2016. [Google Scholar]
- Potts, S.G.; Ngo, H.T.; Biesmeijer, J.C.; Breeze, T.D.; Dicks, L.V.; Garibaldi, L.A.; Vanbergen, A. The Assessment Report on Pollinators, Pollination and Food Production of the Intergovernmental Science-Policy Platform on Biodiversity and Ecosystem Services; Secretariat of the Intergovernmental Platform for Biodiversity and Ecosystem Services: Bonn, Germany, 2016. [Google Scholar]
- Rounsevell, M.; Fisher, M.; Boeraeve, F.; Jacobs, S.; Liekens, I.; Marques, A.; Zlinsky, A. The IPBES Regional Assessment Report on Biodiversity and Ecosystem Services for Europe and Central Asia; Secretariat of the Intergovernmental Platform for Biodiversity and Ecosystem Services: Bonn, Germany, 2016. [Google Scholar]
- Becker, C.D.; Ghimire, K. Synergy between traditional ecological knowledge and conservation science supports forest preservation in Ecuador. Conserv. Ecol. 2003, 8, 1–12. [Google Scholar] [CrossRef]
- Cámara-Leret, R.; Paniagua-Zambrana, N.; Balslev, H.; Barfod, A.; Copete, J.C.; Macía, M. Ecological community traits and traditional knowledge shape palm ecosystem services in northwestern South America. For. Ecol. Manag. 2014, 334, 28–42. [Google Scholar] [CrossRef]
- Mukhopadhyay, R.; Roy, S.B. Traditional Knowledge for Biodiversity Conservation, Maintain Ecosystem Services and Livelihood Security in the Context of Climate Change: Case Studies from West Bengal, India. J. Biodivers. 2015, 6, 22–29. [Google Scholar] [CrossRef]
- Boafo, Y.A.; Saito, O.; Kato, S.; Kamiyama, C.; Takeuchi, K.; Nakahara, M. The role of traditional ecological knowledge in ecosystem services management: The case of four rural communities in Northern Ghana. Int. J. Biodivers. Sci. Ecosyst. Serv. Manag. 2016, 12, 24–38. [Google Scholar] [CrossRef] [Green Version]
- Gómez-Baggethun, E.; Reyes-García, V.; Olsson, P.; Montes, C. Traditional ecological knowledge and community resilience to environmental extremes: A case study in Doñana, SW Spain. Glob. Environ. Chang. 2012, 22, 640–650. [Google Scholar] [CrossRef]
- Inga, B. Reindeer (Rangifer tarandus tarandus) feeding on lichens and mushrooms: Traditional ecological knowledge among reindeer-herding Sami in northern Sweden. Rangifer 2007, 27, 93–106. [Google Scholar] [CrossRef] [Green Version]
- Riseth, J.Å.; Tømmervik, H.; Helander-Renvall, E.; Labba, N.; Johansson, C.; Malnes, E.; Bjerke, J.W.; Jonsson, C.; Pohjola, V.; Sarri, L.E.; et al. Sámi traditional ecological knowledge as a guide to science: Snow, ice and reindeer pasture facing climate change. Polar Rec. 2011, 47, 202–217. [Google Scholar] [CrossRef]
- Assessment, A.C.I. Impacts of a Warming Arctic-Arctic Climate Impact Assessment. Impacts of a Warming Arctic-Arctic Climate Impact Assessment by Arctic Climate Impact Assessment; Cambridge University Press: Cambridge, UK, 2014; ISBN 0521617782. [Google Scholar]
- Tyler, N.J.C.; Turi, J.M.; Sundset, M.A.; Bull, K.S.; Sara, M.N.; Reinert, E.; Oskal, N.; Nellemann, C.; McCarthy, J.J.; Mathiesen, S.D.; et al. Saami reindeer pastoralism under climate change: Applying a generalized framework for vulnerability studies to a sub-arctic social-ecological system. Glob. Environ. Chang. 2007, 17, 191–206. [Google Scholar] [CrossRef]
- Driedger, E. Analyzing Cumulative Effects from Human Development on Reindeer Habitat in Sweden. Master’s Thesis, Sveriges lantbruksuniversitet (SLU), Uppsala, Sweden, 2014. [Google Scholar]
- Labba, K. Mineral Activities on Sami Reindeer Grazing Land in Sweden. Nordisk Miljörättslig Tidskrift Nord. Environ. Law J. 2014, 1, 93–98. [Google Scholar]
- Courault, R.; Duval, G.; Cohen, M. La fragmentation des paysages de l’élevage des rennes. Une étude de cas en Laponie suédoise. Géocarrefour 2018, 92, 2–18. [Google Scholar] [CrossRef]
- Gutman, G.; Reissell, A. Eurasian Arctic Land Cover and Land Use in a Changing Climate; Springer: Berlin/Heidelberg, Germany, 2011. [Google Scholar]
- Roué, M.; Molnar, Z. Knowing Our Lands and Resources: Indigenous and Local Knowledge of Biodiversity and Ecosystem Services in Europe and Central Asia; UNESCO Publishing: Paris, France, 2017. [Google Scholar]
- Mårell, A.; Edenius, L. Spatial heterogeneity and hierarchical feeding habitat selection by reindeer. Arct. Antarct. Alp. Res. 2006, 38, 413–420. [Google Scholar] [CrossRef]
- Esselin, A. Kommunikationsstrategi för Renbruksplan; Rapport I; Skogsstyrelsen: Jönköping, Sweden, 2012; pp. 1–38. [Google Scholar]
- Manker, E.M. People of Eight Seasons; Viking Press: New York, NY, USA, 1964. [Google Scholar]
- Hoffmann-Schickel, K. Un Peuple Du Renne Entre Hier Et Demain: Les Sâmes de Kautokeino Dans Le Finnmark Norvégien. Ph.D. Thesis, Université de Strasbourg, Strasbourg, France, 2010. [Google Scholar]
- Skarin, A.; Åhman, B. Do human activity and infrastructure disturb domesticated reindeer? The need for the reindeer’s perspective. Polar Biol. 2014, 37, 1041–1054. [Google Scholar] [CrossRef] [Green Version]
- Fernandez-Vest, M.M.J. Sami: An Introduction to the Language and Culture; Finn Lectura: Helsinki, Finland, 2012. [Google Scholar]
- Roturier, S.; Roué, M. Of forest, snow and lichen: Sámi reindeer herders’ knowledge of winter pastures in northern Sweden. For. Ecol. Manag. 2009, 258, 1960–1967. [Google Scholar] [CrossRef]
- Hætta, O.M. The Sami: An Arctic Indigenous People; Davvi girji: Karasjok, Norway, 2008. [Google Scholar]
- Inga, B. Traditional Ecological Knowledge Among Reindeer Herders in Northern Sweden. Bachelor Thesis, Sveriges lantbruksuniversitet (SLU), Uppsala, Sweden, 2008. [Google Scholar]
- Warenberg, K.; Danell, Ö.; Gaare, E.; Nieminen, M. Flora I Reinbeiteland, 2nd ed.; Ekendahl, B., Bye, K., Eds.; Landbruksforlaget: Oslo, Norway, 1997; p. 183. [Google Scholar]
- Cogos, S.; Östlund, L.; Roturier, S. Forest Fire and Indigenous Sami Land Use: Place Names, Fire Dynamics, and Ecosystem Change in Northern Scandinavia. Hum. Ecol. 2019, 47, 51–64. [Google Scholar] [CrossRef] [Green Version]
- RenGIS 2.0. Available online: https://www.sametinget.se/111684 (accessed on 30 October 2019).
- Vad är Renbruksplaner? Available online: https://www.sametinget.se/renbruksplan (accessed on 30 October 2019).
- CORINE Land Cover. Available online: https://land.copernicus.eu/pan-european/corine-land-cover (accessed on 30 October 2019).
- European Environment Agency. View Dataset Definition. Available online: http://dd.eionet.europa.eu/datasets/latest/CDDA (accessed on 30 October 2019).
- Courault, R. Les Paysages Culturels de L’élevage de Rennes en Scandinavie Face au Changement Global: Une Approche Multi-Scalaire (Laponie Suédoise, SUD Norvégien). Ph.D. Thesis, Sorbonne-Université, Paris, France, 2018. [Google Scholar]
- Kotimaisten Kielten Keskus. Available online: kaino.kotus.fi (accessed on 30 October 2019).
- Agnan, Y.; Courault, R.; Alexis, M.A.; Zanardo, T.; Cohen, M.; Sauvage, M.; Castrec-Rouelle, M. Distribution of trace and major elements in subarctic ecosystem soils: Sources and influence of vegetation. Sci. Total Environ. 2019, 682, 650–662. [Google Scholar] [CrossRef] [PubMed]
Figure 1.
Location map and geographical features of the Gabna reindeer herders’ sameby (source: CORINE Land Cover 2018, RenGIS 2.0 Swedish Saami Parliament, European Environmental Agency, 2019; realization: R. Courault, 2019).
Figure 1.
Location map and geographical features of the Gabna reindeer herders’ sameby (source: CORINE Land Cover 2018, RenGIS 2.0 Swedish Saami Parliament, European Environmental Agency, 2019; realization: R. Courault, 2019).

Figure 2.
Map of land cover changes for seasonal pastures of the Gabna sameby. All land cover changes occurring during 2000–2018 have been reduced into four categories (Section 2.3). Urbanization outlines have been magnified, and thus do not represent projected area surfaces (source: CORINE Land Cover changes database (2019), RenGIS 2.0 Swedish Saami Parliement (2019); realization: R.Courault, 2019).

Table 1.
List of functional/ecological terminologies and associated meanings, expressed in north Saami. Those used in the present study are denoted with an (*) and interpreted as a land cover.
Table 1.
List of functional/ecological terminologies and associated meanings, expressed in north Saami. Those used in the present study are denoted with an (*) and interpreted as a land cover.
| Meaning | Local Name | Latin Name | Etymology | Biogeographical Scale | Land Cover Interpretation |
|---|---|---|---|---|---|
| Pine forest region 1,2 | Beahcevuovdi (*) | Pinus sylvestris | Beahci: pine; vuov: make a round, region | Landscape/Specie | Coniferous forests |
| Blackberry 3 | Cahppesmuorji | Empetrum nigrum | Muorji: berry; Cahppes: black | Specie | - |
| Tundra, hill, treeless mountain 1,2,3 | Duottar (*) | - | - | Landscape | Grasslands and connected sparsely vegetated areas |
| Crustaceous lichens 1,4 | Gatna | - | - | Family/Genus | - |
| Spruce 1,3 | Guossa | Picea abies | - | Specie | - |
| Mushroom, fungus 1,3 | Guoppar | - | - | Family/Genus | - |
| Old pine 3 | Hàika (*) | Pinus sylvestris | - | Specie/Dynamic | Untouched coniferous forests |
| Reindeer moss/lichens 1,3,4 | Jeagil | - | - | Family/Genus | - |
| Lingonberry 1,3 | Jokŋa | Vaccinium vitis-idae | - | Specie | - |
| Montane birch 1,5 | Lageš (*) | Betula pubescens ssp czerepanovii | - | (Sub) Specie | Broadleaved forests |
| Epiphytic lichens 4 | Lahppu | - | - | Family/Genus | - |
| Open country, pasture land, wilderness 1,3 | Meahcci (*) | - | - | Landscape | Moors, heathlands and connected grasslands |
| Deergrass 5 | Miektaruossi | Trichophorum cespitosum | - | Specie | - |
| Bog-bean 5 | Muoska (njuohcu) | Menyanthes trifoliata | - | Specie | - |
| Tall cottongrass 5 | Niitoullu | Eriophorum angustifolium | - | Specie | - |
| Flowering plant 3 | Ràssi | - | - | Class? Family? Genus? | - |
| Burnt forest/mountain 2,6 | Roavve | - | - | Landscape/Dynamic | - |
| Blueberry 2 | Sarrit | Vaccinium myrtillus | - | Specie | - |
| Willow 1,3 | Sieđga | Salix sp | - | Genus | - |
| Willow colony 1 | Sieđgai | - | - | Genus/Landscape | - |
| Hay/July willow 1 | Sieđggavuolẹssuoidni | Salix sp | Suoidni: Hay, July month | Specie? Landscape? Dynamics | - |
| Grasses 4 | Sitnu | - | - | Family/Genus | - |
| Stiff sedge 5 | Skazerlukti | Carex bigelowii | - | Specie | - |
| Dwarf birch 5 | Skier’ri | Betula nana | - | Specie | - |
| Birch 2 | Soahki | - | - | Infra-specie | - |
| Forest grass 5 | Vuovdesitnu | Deschampsia flexuosa | - | Specie | - |
| Mountain grass 5 | Vàrresitnu | Deschampsia alpina | Vàrri: mountain | Specie | - |
Table 2.
Surface areas comparison between CORINE Land Cover categories and adapted Saami categories (based on 2018 CLC map, Gabna scale; ~3786 km2).
Table 2.
Surface areas comparison between CORINE Land Cover categories and adapted Saami categories (based on 2018 CLC map, Gabna scale; ~3786 km2).
| CORINE Land Cover Class | Surface Area (km2) | Saami Class | Surface Area (km2) |
|---|---|---|---|
| Coniferous forests (CLC 312) | 662 | Beahcevuovdi (unprotected Coniferous forests) | 601 |
| Hàika (protected Coniferous forests) | 61 | ||
| Broadleaved forests (CLC 311) | 541 | Lageš (Broadleaved forests) | 541 |
| Moors and heathlands (CLC 322) | 854 | Meahcci (Moors and heathlands and adjacent Natural grasslands) | 772 |
| Natural grasslands (CLC 321) | 117 | Duottar (Natural grasslands adjacent to Sparsely vegetated areas) | 463 |
| Sparsely vegetated areas (CLC 333) | 346 |
Table 3.
Overall value of ecosystem services (/50) and Ecosystem Services (ES) habitat value (/2) according to land cover classes/habitats composing the Gabna sameby.
Table 3.
Overall value of ecosystem services (/50) and Ecosystem Services (ES) habitat value (/2) according to land cover classes/habitats composing the Gabna sameby.
| Land Cover Class | Overall Value of ES (/50) | Provisioning ES Habitat Value | Regulating ES Habitat Value | Cultural ES Habitat Value | Supporting ES Habitat Value |
|---|---|---|---|---|---|
| Artificial areas | 7 | 0.7 | 1 | 0.25 | 0 |
| Bare rocks | 12 | 0.2 | 0.2 | 2 | 0 |
| Glaciers and perpetual snow | 14 | 0.2 | 0.2 | 2 | 0 |
| Forestry/Transitional woodland shrub | 16 | 0.7 | 0.83 | 0.25 | 1 |
| Agriculture | 20 | 0.6 | 0.83 | 0.75 | 2 |
| Duottar and Water courses | 22 | 0.57/0.9 | 0.87/0.9 | 1.75/2 | 1.3/0.3 |
| Water bodies | 24 | 0.9 | 0.9 | 1.75 | 0.6 |
| Meahcci | 25 | 0.7 | 1 | 1.9 | 1.5 |
| Moors and heathlands | 26.5 | 0.8 | 1.2 | 1.75 | 1.5 |
| Inland marshes and Peat bogs | 29 | 1.1 | 1.1 | 1.25 | 1.3 |
| Lageš | 33.5 | 1.1 | 1.5 | 2 | 1.83 |
| Mixed forests | 35.5 | 1.4 | 1.6 | 1.9 | 2 |
| Beahcevuovdi | 36 | 1.3 | 1.5 | 2 | 2 |
| Hàika | 39 | 1.5 | 1.6 | 2 | 2 |
Table 4.
Areal ecosystem service capacity indices (AESC) in 2018 for seasonal pastures and the entire Gabna sameby.
Table 4.
Areal ecosystem service capacity indices (AESC) in 2018 for seasonal pastures and the entire Gabna sameby.
| Provisioning | Regulating | Cultural | Supporting | Total Index (Mean) | |
|---|---|---|---|---|---|
| Summer pasture | 0.64 | 0.76 | 1.86 | 0.83 | 1.02 |
| Inter-seasonal pasture | 0.77 | 0.96 | 1.8 | 1.14 | 1.16 |
| Winter pasture | 1.07 | 1.33 | 1.38 | 1.48 | 1.31 |
| Gabna sameby | 0.92 | 1.14 | 1.57 | 1.29 | 1.23 |
Table 5.
Main CLC land cover changes over 2000, 2006, 2012, and 2018 within the Gabna reindeer herding sameby (changes >1 km2 over the whole period are indicated; % calculated from the overall Gabna extent ~3786 km2). “-” represents negligible changes in cover extent.
Table 5.
Main CLC land cover changes over 2000, 2006, 2012, and 2018 within the Gabna reindeer herding sameby (changes >1 km2 over the whole period are indicated; % calculated from the overall Gabna extent ~3786 km2). “-” represents negligible changes in cover extent.
| CLC Category | Evolution 2000–2006 | Evolution 2006–2012 | Evolution 2012–2018 | Evolution 2000–2018 |
|---|---|---|---|---|
| Dump sites (132) | - | - | +2.2 (+0.06) | +2.9 (+0.08) |
| Coniferous forests (312) | −6.9 km2 (−0.18%) | +36 (+0.95) | +1.9 (+0.05) | +30.9 (+0.82) |
| Mixed forests (313) | - | +4.8 (+0.13) | - | +6.3 (+0.16) |
| Forestry/Transitional woodland–scrubs (324) | +6.5 (+0.17) | −39.1 (−1.03) | −5.3 (−0.14) | −37.9 (−1) |
| Sparsely vegetated areas (333) | +1.1 (+0.03) | - | - | - |
| Peat bogs (412) | - | - | - | +1.6 (+0.04) |
Table 6.
Main traditional land cover changes over 2000, 2006, 2012, and 2018 within the Gabna reindeer (% calculated from the overall Gabna extent). “-” represents negligible changes in cover extent (excepting Lageš/Broadleaved forest, being stable along the period).
Table 6.
Main traditional land cover changes over 2000, 2006, 2012, and 2018 within the Gabna reindeer (% calculated from the overall Gabna extent). “-” represents negligible changes in cover extent (excepting Lageš/Broadleaved forest, being stable along the period).
| Traditional Category | Evolution 2000–2006 | Evolution 2006–2012 | Evolution 2012–2018 | Evolution 2000–2018 |
|---|---|---|---|---|
| Beahcevuvodi (All Coniferous forests excluding Haika) | −6.9 km2 (−0.002%) | +35 (+0.009) | +1.9 (+0.005) | +30.1 (+0.008) |
| Hàika (Protected Pine forests) | −0.04 (−) | +0.96 (−) | −0.03 (−) | +0.89 (−0.02) |
| Duottar (Grasslands and adjacent sparsely vegetated areas) | +0.89 (−) | −0.71 (−) | - | +0.17 (−) |
| Meahcci (Moors, heathlands and adjacent grasslands) | +0.15 (−) | −0.35 (−) | - | −0.19 (−) |
Table 7.
Main ecosystem ratings changes in terms of area over 2000, 2006, 2012 and 2018, at the Gabna reindeer herding sameby (changes > 1 km2 over the whole period are indicated).
Table 7.
Main ecosystem ratings changes in terms of area over 2000, 2006, 2012 and 2018, at the Gabna reindeer herding sameby (changes > 1 km2 over the whole period are indicated).
| Ecosystem Ratings | Evolution 2000–2006 (km2) | Evolution 2006–2012 (km2) | Evolution 2012–2018 (km2) | Evolution 2000–2018 (km2) |
|---|---|---|---|---|
| 7 (very low, Artificial areas) | 0.21 | 1.18 | 3.12 | 4.52 |
| 16 (Forestry) | 6.56 | −39.14 | −5.30 | −37.88 |
| 22 (Duottar and Water courses) | 1.03 | −1.58 | - | −0.56 |
| 29 (Inland marshes and Peat bogs) | - | 2.39 | - | 1.70 |
| 35.5 (Mixed forests) | 0.51 | 4.81 | 0.95 | 6.27 |
| 36 (Beahcevuovdi) | −6.87 | 35.04 | 1.94 | 30.10 |
Table 8.
Evolution of the areal ecosystem service capacity indices (AESC) in 2000–2006–2012–2018 for seasonal pastures and the entire Gabna sameby.
Table 8.
Evolution of the areal ecosystem service capacity indices (AESC) in 2000–2006–2012–2018 for seasonal pastures and the entire Gabna sameby.
| Provisioning | Regulating | Cultural | Supporting | Total index (mean) | |
|---|---|---|---|---|---|
| Summer pasture | 0.71–0.63–0.64–0.64 | 0.76–0.74–0.76–0.76 | 1.86–1.85 –1.86–1.86 | 0.82–0.77–0.83–0.83 | 1.04–1–1.02–1.02 |
| Inter-seasonal pasture | 0.77–0.76–0.76–0.77 | 0.96–0.94–0.96–0.96 | 1.8–1.78–1.79–1.8 | 1.14–1.08–1.14–1.14 | 1.17–1.14–1.16–1.16 |
| Winter pasture | 1.07–1.07–1.07–1.07 | 1.33–1.33–1.33–1.33 | 1.38–1.38–1.37–1.38 | 1.47–1.48–1.48–1.48 | 1.31–1.31–1.31–1.31 |
| Gabna sameby | 0.92–0.89–0.92–0.92 | 1.14–1.15–1.14–1.14 | 1.57–1.55–1.56–1.57 | 1.28–1.27–1.28–1.29 | 1.23–1.21–1.22–1.23 |
© 2020 by the authors. Licensee MDPI, Basel, Switzerland. This article is an open access article distributed under the terms and conditions of the Creative Commons Attribution (CC BY) license (http://creativecommons.org/licenses/by/4.0/).
Share and Cite
MDPI and ACS Style
Courault, R.; Cohen, M. Evolution of Land Cover and Ecosystem Services in the Frame of Pastoral Functional Categories: A Case Study in Swedish Lapland. Sustainability 2020, 12, 390. https://doi.org/10.3390/su12010390
AMA Style
Courault R, Cohen M. Evolution of Land Cover and Ecosystem Services in the Frame of Pastoral Functional Categories: A Case Study in Swedish Lapland. Sustainability. 2020; 12(1):390. https://doi.org/10.3390/su12010390
Chicago/Turabian StyleCourault, Romain, and Marianne Cohen. 2020. "Evolution of Land Cover and Ecosystem Services in the Frame of Pastoral Functional Categories: A Case Study in Swedish Lapland" Sustainability 12, no. 1: 390. https://doi.org/10.3390/su12010390
Note that from the first issue of 2016, this journal uses article numbers instead of page numbers. See further details here.