Application of Life Cycle Energy Assessment in Residential Buildings: A Critical Review of Recent Trends


Abstract
1. Introduction
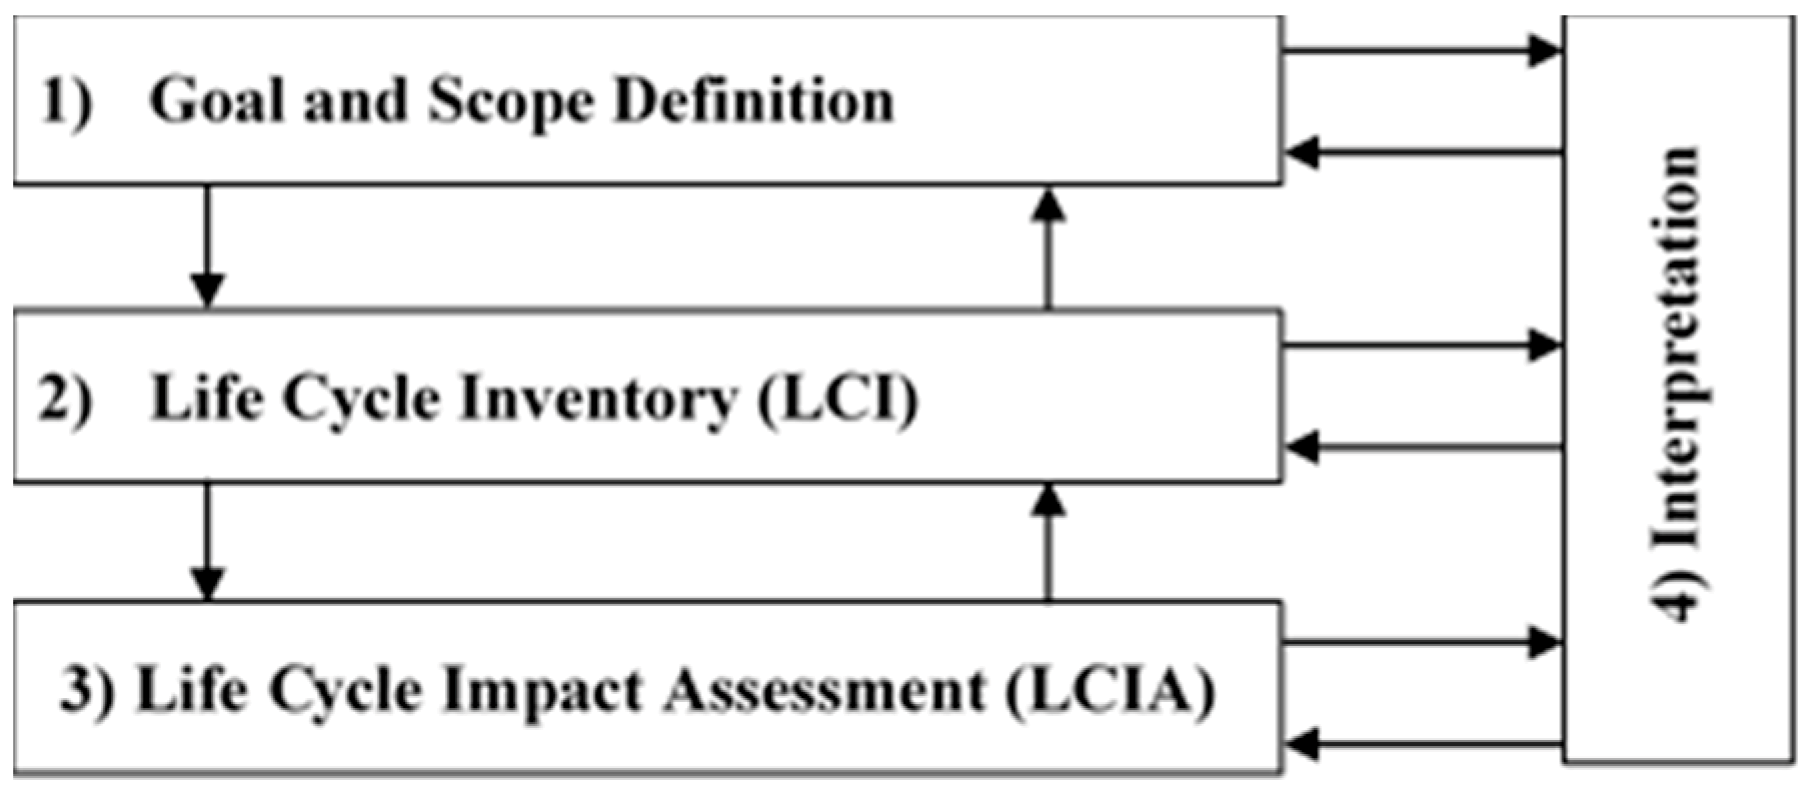
2. An Overview of Life Cycle Energy Assessment (LCEA)
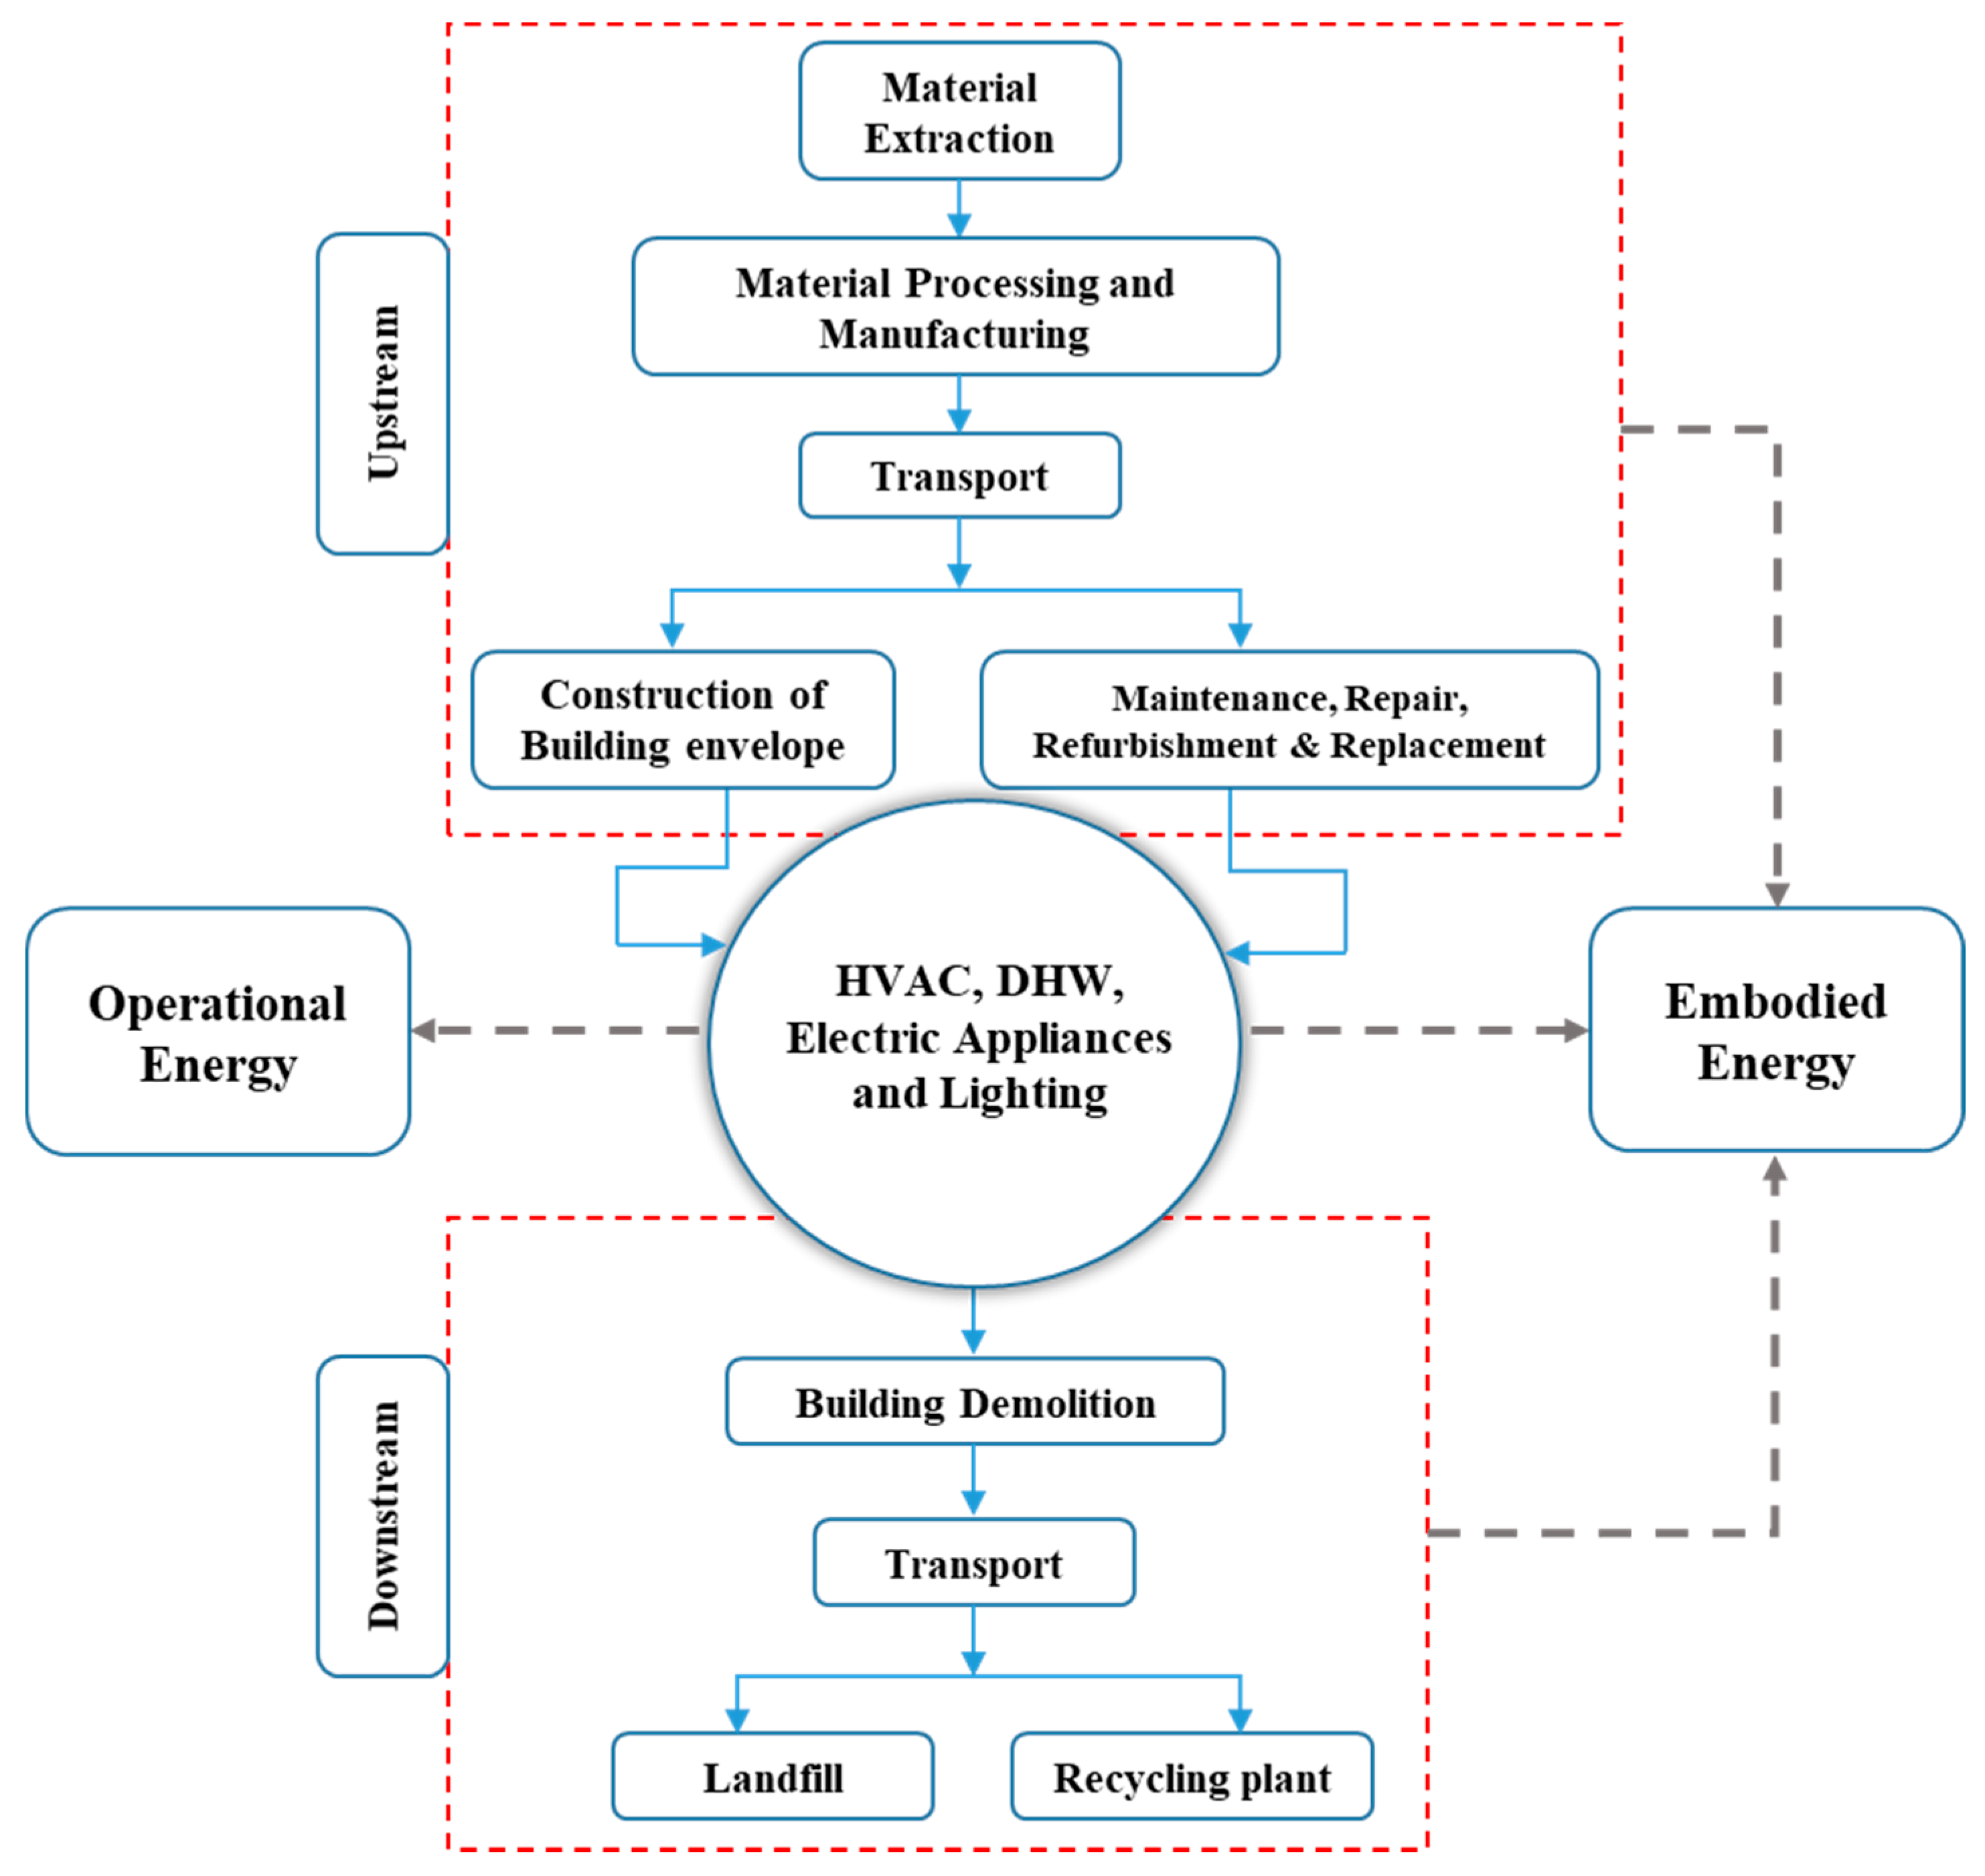
- Initial embodied energy: refers to the quantity of energy incurred for the initial construction of the building including extracting raw materials, processing the extracted materials, and transporting building materials to construction sites and on-site construction and installation.
- Recurring embodied energy: refers to the total amounts of energy embodied in the materials used for maintaining and rehabilitating a building during its life span.
- EOL: refers to the amounts of energy required to demolish the building and to transport the resulted wastages to landfill sites and/or recycling plants.
3. Materials and Methods
4. Analysis and Results
4.1. System Boundary Definition
4.1.1. Stages Excluded
4.1.2. Building Components Considered for Measurement of Embodied Energy
4.1.3. Parameters Considered for Operational Energy Measurement
4.1.4. Building Life Span
4.1.5. Assumptions
4.2. The Assessment of Embodied Energy
4.3. The Assessment of Operational Energy
- Using the actual records of building energy usage collected from utility bills, or energy audit exercises. The review found that 12% of the studies used this method to calculate the operational energy. Using this approach enables researchers to take into consideration all types of energy consumed in buildings including heating, cooling, lighting, DHW, cooking, and appliances. For instance, Atmaca and Atmaca [43] and Mehta et al. [35] used energy bills to estimate building operational energy use. Employing this method provides the ability to capture the dynamics of occupants’ behaviors on energy consumption within a year. However, the application of this method can only supply an aggregated figure of building energy consumption, while failing to present a detailed breakdown of energy by use. This would potentially prevent decision makers from identifying the hot spots of energy consumption in building and providing solutions for energy reduction.
- Using energy simulation software. It was found that 44% of the reviewed studies applied simulation software packages to estimate optional energy use. These software packages are commonly capable of producing detailed data on the annual energy consumption of buildings. Although the application of simulation software may ease the process of estimating operational energy, the accuracy of results achieved via simulation software can still be improved. One way to approach this challenge is to calibrate the simulation model to fit the real energy performance of the existing building. In addition, the impacts of users’ behaviors on energy usage can be better taken into consideration. The two possible approaches to better account for the impacts of users’ behaviors on energy use in buildings are deterministic and stochastic statistical approaches [61]. The deterministic approach refers to defining different scenarios for users’ behaviors ranging from ‘energy saving’ to ‘wasteful’ behavior scenarios in respect to using energy in building e.g., DHW, on an hourly basis throughout the year. In addition, sensitivity analysis can be applied for the same purpose where sufficient data on users’ behaviors are unavailable. Alternatively, the stochastic statistical model can be used to predict the users’ attendance and activity in the building for inclusion into a simulation. In this model, relevant data should be collected through literature and national sociological investigations.
- Static equations. Another method used by the reviewed studies (22%) for estimating operational energy was static equations [5,6,30,46,47]. In a study, Stephan et al. [5] estimated the operational energy of a residential building using Equation (3):where LCOPEb is the life cycle primary operational energy of the building b in GJ, ULb is the useful life of the building b, SFe is the solar fraction for the end-use e, OPEe is the yearly operational final energy demand of the end-use e in GJ, and ηeis the average efficiency of the end-use e. The annual operational energy uses for heating and cooling were estimated by applying Equation (4):where OPEh is the operational final heating energy demand in kWh, HDH is the thousands of heating degree hours for the building site in Kh, Ub is the average heat transfer coefficient for the building in W/(m2K), Aht is the area of heat transfer in m2, ηHR is the efficiency of the heat recovery system if present, and Vht is the ventilation heat transfer in W/K. The cooling energy demand was also calculated using Equation (4) by substituting the cooling degree hours for the heating degree hours. The ventilation energy demand was achieved by using Equation (5):where OPEv is the operational final ventilation energy in kWh, V is the ventilated volume in m3, H is the thousands of hours of mechanical ventilation per year, and P is the average fan power in W/m3. The energy demands for DHW, appliances, and cooking were determined by multiplying regional per capita averages by the number of users in the house. Lighting was calculated by multiplying average annual energy usage per m2 by the usable floor area of the building. The average regional energy consumption data were then gained by using records published by governmental bodies. The final energy demands achieved were converted into primary energy applying appropriate conversion factors. Equation (3) also accounted for situations where solar systems are installed. In this case, solar fractions should be deduced from the final energy consumption of related end-uses. However, using this method can be time-consuming once the aim is to optimize a building design through parametric analysis. In addition, this method fails to capture buildings’ thermal history when calculating cooling and heating loads e.g., time delay between heat absorptance and heat release by enclosing components of a room.
- Miscellaneous. Other methods have been also used by the reviewed studies for calculating operational energy. For instance, Cellura et al. [45] monitored the annual energy consumption of a building in order to have an accurate estimate of the building operational energy use. Similarly, Devi and Palaniappan [37] monitored buildings’ energy consumption for 21 months and then used the data for estimation of operational energy. In another study, Bastos et al. [32,33] estimated the operational energy consumptions while considering the ratio between residential electricity use and natural gas or LPG provided by the Lisbon Energy Matrix, which provides estimates of energy use in Lisbon building stock using 2002 data.
4.4. Interpretation
4.5. Reuse and Recycling Potentials
5. Methodological Challenges
6. Conclusions
7. Future Study
Author Contributions
Funding
Conflicts of Interest
Appendix A

| Authors | Country | Size (M2) | System Boundary | LCI | LCIA | Interpretation | |||
|---|---|---|---|---|---|---|---|---|---|
| Stage(s) Excluded | Life Span (Yrs) | Operational Energy | Assumptions | ||||||
| Aye et al. [27] | Australia | 3943 | EOL and replacement & maintenance | 50 | Heating and cooling | The schedule for operating heating and cooling systems is assumed constant; The detailed occupational schedules and gains are not considered; The efficiency of heat pump system is assumed to consistent over time. | Input–output–based hybrid approach is used; Input–output data is taken from the Australian National Accounts, combined with energy intensity factors by fuel type; Process specific data are retrieved from SimaPro Australian database | TRNSYS simulation software is used to estimate the building operational energy; The materials’ quantities are multiplied by their respective embodied energy intensities, and summed. | None |
| Gustavsson et al. [38] | Sweden | 3374 | Replacement & maintenance | 50 and 100 | Heating, DHW, household electricity, and electricity for facility management purposes. | The primary energy used for on-site construction is assumed 80 kWh/m2; 5% waste of material is assumed during construction; 90% of the wood-based demolition materials are assumed to be recovered. | Process-based approach is used; Detailed info acquired from the manufacturers of building materials; Literature is used to obtain required embodied energy intensities of building materials | ENORM and ENSYST software are used to estimate the operational energy; The materials’ quantities are multiplied by their respective embodied energy intensities, and summed | UA |
| Dodoo and Gustavsson [42] | Sweden | 1190 | None | 50 | Heating, DHW, electricity for ventilation fans and pump, and electricity for household. | The efficiency of heating systems is assumed to be 85% and consistent throughout the entire building life span; It is assumed that 90% of concrete, wood and steel materials would be recovered at EOL. | Process-based approach is used; Literature is used for obtaining primary data on embodied energy. | VIP + software is used to estimate the operational energy; ENSYST is used to calculate the final energy for the operation activities; The embodied energy calculation is carried out multiplying the unit values by the area of each building element. | None |
| Ramesh et al. [28] | India | 85.5 | Construction and EOL | 75 | Heating, cooling, DHW, ventilation, household appliances and lighting. | The annual operating energy is assumed to remain constant throughout the entire building life span; The effects of climate change and occupants’ behaviors in the future are not taken into consideration. | The approach to quantifying the embodied energy is not specified; Literature is used for obtaining primary data on embodied energy | DesignBuilder software is used to estimate the operational energy; The embodied energy calculation is carried out multiplying the unit values by the area of each building element and summed. | None |
| Stephan and Stephan [30] | Lebanon | 904 | EOL | 50 | Heating, cooling, ventilation, lighting, DHW, cooking and appliances | Australian database of construction materials is used to calculate the embodied energy; The embodied energy of infrastructures used to deliver energy to the building and life cycle transport energy demand of the building’s occupants are considered. | Input–output–based hybrid approach is used; Hybrid database of construction materials developed by [63]; Process specific data are obtained from manufacturers. | DEROB-LTH software is used to calculate the heating and cooling loads; Equation is applied to calculate operational energy of DHW, ventilation, cooking, appliances and lighting; The embodied energy is calculated by multiplying the quantity of materials by their relevant embodied energy coefficient. | UA, DL |
| Atmaca and Atmaca [43] | Turkey | Urban area (6760) and rural area (1320) | None | 50 | Heating, cooling, DHW, lighting, appliances, cooking | The standard construction methods and materials are assumed to remain the same during the entire building life span; The structural elements of the building are assumed to have the same service life as the house; All the manufacturing processes are assumed to be undertaken in one place; Only one type of fuel is assumed to be used for transporting the wastages. | Process-based approach is used; Literature and Inventory of Carbon and Energy (ICE) Version 2.0 are used to obtain embodied energy of building materials. | The actual energy consumption records obtained from utility bills and questionnaires are used for estimation of building operational energy; The embodied energy calculation is carried out multiplying the unit values by the area of each building element and summed. | DL |
| Rossi et al. [44] | Belgium, Portugal and Sweden | 192 | EOL | 50 | Heating, cooling, DHW, ventilation, lighting, building automation and control | The on-site processes e.g., the finishing of steel structures (cutting, shot blasting, welding) are excluded; The embodied energy associated with replacement, refurbishment and repair of materials and products are assumed 5% every 10 years. | Process-based approach is used; BEES, CRTI, ICE and databases are used to obtain embodied energy of building materials | LCA analysis has been done using Equer software, linked to two other software namely Pleiades + Comfie | SA, DL |
| Stephan et al. [6] | Belgium | 297 | EOL | 100 | Heating, ventilation, DHW, lighting, cooking and appliances | Australian input–output-based hybrid embodied energy intensities are used for this case study that is located in Belgium; The life cycle transport energy demands of the building’s occupants are considered; The recurrent embodied energy of nearby infrastructures (e.g., roads, power lines, water and gas distribution systems and sewage) is considered. | Input–output–based hybrid approach is used; Input–output data is taken from the Australian National Accounts; A database containing embodied energy coefficients for materials in Australia developed by [63] is used. | The LCA analysis is performed using equations | UA |
| Cellura et al. [45] | Italy | 481.76 | None | 70 | Heating and cooling, ventilation, lighting and plug loads | Not discussed. | Process-based approach is used; Literature and SimaPro database are us; Data acquired from the local manufacturer of building materials. | The annual electricity requirement of the building is monitored, and then normalized for estimating the building’s operational energy; SimaPro is used to perform the LCA analysis. | None |
| Stephan et al. [5] | Belgium and Australia | 297 and 330 | EOL | 50 | Heating, cooling, ventilation, lighting, DHW, cooking and appliances | The embodied energy of nearby infrastructures (e.g., roads, power lines, water and gas distribution, and sewage) used to deliver energy to the building and life cycle transport energy demand of the building’s occupants are considered. | Input–output–based hybrid approach is used; Input–output data is taken from the Australian National Accounts; A database containing embodied energy coefficients for materials in Australia developed by [63] is used. | Static equations are used to calculate the operational energy; The initial embodied energy is calculated multiplying the relevant coefficients by the final quantities of the respective materials, and summed; The recurrent embodied energy is calculated via summing the embodied energy of replaced materials across the building’s life span. | UA |
| Crawford [36] | Australia | 291.3 | None | 50 | Heating, cooling, ventilation, lighting, DHW, cooking and appliances | To account for the contribution of EOL stage, 1% of the total life cycle energy demand is summed to the final achieved figure. | Input–output–based hybrid approach is used; Input–output data is taken from the Australian National Accounts; Australian process data obtained from the SimaPro Australian database. | The energy bills is used to determine the operational energy of the house; The embodied energy is calculated via multiplying the quantities of the materials by their respective energy coefficients, and summed. | DL |
| Pinky Devi and Palaniappan [31] | India | 32.5 | Maintenance, repair, and EOL | 50 | Lighting, ventilation, appliances and equipment | Assumptions are made where technical details of building envelope were unavailable. | Process-based approach is used; The relative embodied energy coefficients are taken from literature and ICE database. | Data related to the operational energy are collected from national statistics; The embodied energy is calculated via multiplying the quantities of the materials by their respective energy coefficients, and summed. | SA, DL |
| Paulsen and Sposto [46] | Brazil | 48 | Transport | 50 | Appliances and equipment and cooking | No analysis of thermal performance (heating and cooling for operational energy) has been performed. | The approach to quantifying the embodied energy is not specified; Data related to the operational energy are collected from national statistics; National Brazilian process data are used for seven groups of material. Data from Portugal are also used for three material groups; Literature is also used to extract relative embodied energy coefficients. | Static equations are used to calculate the operational energy; The embodied energy is calculated via multiplying the quantities of the materials by their respective energy coefficients, and summed. | None |
| Devi and Palaniappan [37] | India | 10,800 | Maintenance, repair, and renovation | 50 | Lighting, ventilation, and partial or no air-conditioning | The building operational energy is assumed to be same during the entire building life span; The embodied energy associated with EOL is assumed 3% of the total building life cycle energy demand. | Process-based approach is used; The buildings’ energy consumptions are monitored for 21 months and used for estimating the operational energy; The relative embodied energy coefficients are taken from literature and ICE. | Data taken from survey, normalized and used for calculation of building operational energy use; The embodied energy is calculated via multiplying the quantities of the materials by their respective energy coefficients, and summed. | SA |
| Bastos et al. [33] | Portugal | Type 2 (367), Type 3 (472) and type 8 (1041) | EOL | 75 | Heating, cooling, ventilation, lighting, DHW, cooking and appliances | The energy consumption is assumed the same during the entire building’s life span. | Process-based approach is used; The Lisbon Energy Matrix data are used for estimating the operational energy; ICE is used for embodied energy calculation. | The Lisbon Energy Matrix data are used to calculate the total energy use per year based on the ratio between residential electricity use and natural gas or LPG; The embodied energy is calculated via multiplying the quantities of the materials by their respective embodied energy coefficients, and summed. | DL |
| Ramesh et al. [29] | India | CS1 (104), CS2 (185), CS3 (62), CS4 (183), CS5 (135), CS6(175), CS7(1280), CS8 (1286), CS9(450), CS10(235) | Construction and EOL | 75 | Heating, cooling, ventilation, lighting, DHW, cooking and appliances | The annual operating energy is assumed to be constant throughout the entire building life span; The effects of climate change and occupants’ behaviors in the future are not taken into consideration. | The approach to quantifying the embodied energy is not specified; The relative embodied energy coefficients are taken from literature. | The building operational energy is estimated using DesignBuilder software; The embodied energy is calculated via multiplying the quantities of the materials by their respective embodied energy coefficients, and summed. | None |
| Zhan et al. [47] | China | 4235.21 | None | 70 | Heating, ventilation, air conditioning, lighting, appliances and equipment | The operational energy usage associated with household appliances is excluded; Recycling is considered at EOL stage. | Input–output–based hybrid approach is used; National data sources are used for estimation of embodied energy such as Guangzhou IO table, Guangzhou Statistical Yearbook of 2013, China Construction Statistical Yearbook of 2013, and China Electric Power Yearbook of 2013. | Static equations are used to estimate the operational energy consumption; Embodied energy is calculated using hybrid LCA | None |
| Iyer- Raniga and Wong [48] | Australia | Not specified a | None | 100 | Heating and cooling | All of the materials are assumed to be landfilled at the EOL stage; The technology utilized for material and productions are assumed to remain unchanged; due to the lack of available data regarding to the replacement lifetimes, the relevant data in US is used; the resource mix supplying electricity to the buildings is assumed static; the occupancy pattern of buildings is assumed static. | Process-based approach is used; The electricity and water bills are collected and compared against the achieved simulated results for the purpose of validation; SimaPro and Australian Unit Process LCI databases are used for estimation of buildings’ embodied energy. | The buildings operational energies are estimated using AccuRate software; Embodied energy is calculated using hybrid LCA | SA, DL |
| Dodoo et al. [39] | Sweden | CLT (928), BC (928) and MS (935) | Replacement and maintenance | 50 | Heating, ventilation, tap water heating and appliances and facility management | The contribution of construction phase to the total building life cycle energy is assumed to be 4% of the material production primary energy; It is assumed that demolition energy would not exceed 10 kWh/m2 [usable area]. In addition, 90% of the demolished concrete, steel and wood materials are assumed to be recovered or recycled during EOL stage. | Process-based approach is used; Literature, Ecoinvent v.2.2 database and SP Technical Research Institute of Sweden are used to obtain required data on embodied energy. | VIP-Energy simulation software is used to estimate the final operational energy of the building; then, the achieved results are converted to primary energy using ENSYST software; The embodied energy is calculated via multiplying the quantities of the materials by their respective energy coefficients, and summed. | SA |
| Tettey et al. [40] | Sweden | 1686 | Replacement and maintenance | 80 | Heating, tap water heating and electricity for ventilation | Electricity usages for household appliances and lighting are excluded for estimating the building operational energy; 80 and 160 kWh/m2 are assumed for the on-site energy consumption of wood and concrete building systems respectively; The primary energy use for demolition of wood and concrete are assumed to be 10 and 20 kWh/m2 respectively. | Process-based approach is used; The relative embodied energy coefficients are obtained from literature. | VIP-Energy simulation software is used to estimate the final operational energy of the building; then, the achieved results are converted to primary energy using ENSYST software; The embodied energy is calculated via multiplying the quantities of the materials by their respective energy coefficients, and summed. | UA |
| Mehta et al. [35] | India | 2588.40 | On-site construction, replacement and maintenance, and EOL | 50 | Heating, cooling, ventilation, lighting, DHW, cooking and appliances | Energy bills of another building with similar specifications are used, namely type of the home, usable floor area per home and the number of rooms. | Process-based approach is used; Operational energy is calculated using energy bills; ICE is used to calculate embodied energy. | Operational energy is calculated using energy bills; The embodied energy is calculated via multiplying the quantities of the materials by their respective energy coefficients, and summed. | SA |
| Zhu et al. [41] | China | 6890 and 216,200 | EOL, Replacement and maintenance | 50 | Heating and cooling, lighting and appliances | The effects of on-site construction management skill is ignored. | Input–output–based hybrid approach is used; The input-output table developed by Chinese National Bureau of Statistics is used; The process-based energy intensity data are acquired from the China Building Material Academy and the Chinese Life Cycle Database developed by Sichuan University. | DesignBuilder software is used to estimate the building’s operational energy; The embodied energy is calculated via multiplying the quantities of the materials by their respective energy coefficients, and summed. | None |
| Bastos et al. [32] | Portugal | CA (102) and SH (104) | EOL | 50 | Heating, cooling, ventilation, lighting, DHW, cooking and appliances | This study accounts for user transportation. | Process-based approach is used; The Ecoinvent database is used for quantification of the building’s embodied energy. | The ratio between residential electricity use and natural gas or LPG from the Lisbon Energy Matrix is used to calculate the total operational energy use per year. | SA |
| Goggins et al. [49] | Ireland | 106 | Replacement and maintenance | 60 | Lighting, ventilation, and DHW | 90% of the building materials are assumed to be recycled at the EOL of building and used for secondary purposes; No change in fuel mix would occur over building life span. | Process-based approach is used; ICE is used to calculate embodied energy. | DEAP software is used to estimate the operational energy; The embodied energy is calculated via multiplying the quantities of the materials by their respective energy coefficients, and summed. | None |
| Kristjansdottir et al. [50] | Norway | 120 | Construction and EOL | 60 | Lighting, heating, appliances, ventilation, DHW. | Replacement of PV panels are assumed to have 50% of the initial embodied energy load. | Process-based approach is used; Ecoinvent v3.2 database is used to calculate embodied energy. | IDA-ICE software is used to calculate the operating energy; Brightway2 is used to perform impact assessment. | DL, SA |
| Mistretta et al. [51] | Italy | 481.76 | None | 70 | Heating and cooling, ventilation, DHW, lighting, and appliances. | Not discussed. | Process-based approach is used; Process data are obtained from local manufacturers; Ecoinvent database is used to retrieve data about recycling of aluminum, steel, glass, and copper. | TRNSYS software is used to estimate operating energy in the refurbished building. For the baseline building, energy use is monitored; SimpaPro is used to assess the environmental impacts. | None |
Appendix B
| Authors | Building Character | Case Study ID | Embodied Energy (kWh/m2.year) | Operational Energy (kWh/m2.year) |
|---|---|---|---|---|
| Aye et al. [27] | Steel structure | CS1 | Steel (80) | Steel (119.88) |
| Concrete structure | CS2 | Concrete (53.55) | Concrete (112.54) | |
| Timber structure | CS3 | Timber (58.29) | Timber (117.57) | |
| Gustavsson et al. [38] | Wood-framed apartment | CS4 | Assumed 50 years of life span (-15.38) | Assumed 50 years of life span (176.86) |
| Dodoo and Gustavsson [42] | Conventional building with EH system | CS5 | Conventional building with EH (−1.56) | Conventional building with EH (278.64) |
| Conventional building with HPH system | CS6 | Conventional building with HPH (−1.56) | Conventional building with HPH (201.7) | |
| Conventional building with DH system | CS7 | Conventional building with DH (−1.56) | Conventional building with DH (187.26) | |
| Passive building with EH system | CS8 | Passive building with EH(−1.66) | Passive building with EH(250.8) | |
| Passive building with HPH system | CS9 | Passive building with HPH (−1.66) | Passive building with HPH (192.12) | |
| Passive building with DH system | CS10 | Passive building with DH(−1.66) | Passive building with DH(181.08) | |
| Ramesh et al. [28] | Building with fired clay exterior walls | CS11 | Building with fired clay exterior walls (29) | Building with fired clay exterior walls (174) |
| Building with hollow concrete exterior walls | CS12 | Building with hollow concrete exterior walls (27) | Building with hollow concrete exterior walls (172) | |
| Building with soil cement exterior walls | CS13 | Building with soil cement exterior walls (27) | Building with soil cement exterior walls (171) | |
| Building with fly ash exterior walls | CS14 | Building with fly ash exterior walls (28) | Building with fly ash exterior walls (169) | |
| Building with aerated concrete exterior walls | CS15 | Building with aerated concrete exterior walls (27) | Building with aerated concrete exterior walls (167) | |
| Stephan and Stephan [30] | Apartment buildings | CS16 | 150 | 266.66 |
| Atmaca and Atmaca [43] | Building located in urban area | CS17 | Urban area (43.33) | Urban area (167.22) |
| Building located in urban rural | CS18 | Rural area (26.11) | Rural area (135.55) | |
| Rossi et al. [44] | Residential building located in Belgium | CS19 | Belgium (24.39) | Belgium (274.41) |
| Residential building located in Portugal | CS20 | Portugal (24.39) | Portugal (174.72) | |
| Residential building located in Sweden | CS21 | Sweden (26.18) | Sweden (327.79) | |
| Stephan et al. [6] | Passive house | CS22 | 131 | 39.5 |
| Cellura et al. [45] | Net zero energy building | CS23 | 137.82 | 48.42 |
| Stephan et al. [5] | Passive house - Brussels, Belgium | CS24 | Belgium (143.48) | Belgium (99.41) |
| 7-Star building (highenergy efficiency standards) - Melbourne, Australia | CS25 | Australia (130) | Australia (160.62) | |
| Crawford [36] | Insulated timber-framed brick veneer walls | CS26 | 120.88 | 81.66 |
| Pinky Devi and Palaniappan [31] | Low-cost house | CS27 | 37.25 | 92.65 |
| Paulsen and Sposto [46] | Low-cost house | CS28 | 43.97 | 97.57 |
| Devi and Palaniappan [37] | Multi-story residential building apartment | CS29 | 72.77 | 116.66 |
| Bastos et al. [33] | Conventional residential buildings with the area of 367 m2 | CS30 | Type 2 (15.47) | Type 2 (74.64) a |
| Conventional residential buildings with the area of 472 m2 | CS31 | Type 3 (15.11) | Type 3 (59.33) a | |
| Conventional residential buildings with the area of 1041 m2 | CS32 | Type 8 (13.87) | Type 8 (37.77) a | |
| Ramesh et al. [29] | Conventional building located in Keerthi | CS 33 | CS1-Conventional system (28.12) | CS1-Conventional system (348) |
| Conventional building located in Eashwer | CS 34 | CS2-Conventional system (21.17) | CS2-Conventional system (271) | |
| Conventional building located in Adil | CS 35 | CS3-Conventional system (27.4) | CS3-Conventional system (303) | |
| Conventional building located in Anand | CS 36 | CS4-Conventional system (21.49) | CS4-Conventional system (264) | |
| Conventional building located in Alwal | CS 37 | CS5-Conventional system (18.56) | CS5-Conventional system (279) | |
| Conventional building located in RG | CS 38 | CS6-Conventional system (22.12) | CS6-Conventional system (296) | |
| Conventional building located in Rock town | CS 39 | CS7-Conventional system (23.27) | CS7-Conventional system (325) | |
| Conventional building located in Kiran Arcade | CS 40 | CS8-Conventional system (21.8) | CS8-Conventional system (250) | |
| Conventional building located in Mahendra | CS 41 | CS9-Conventional system (24.54) | CS9-Conventional system (309) | |
| Conventional building located in Nirmal | CS 42 | CS10-Conventional system (23.50) | CS10-Conventional system (280) | |
| Insulated building located in Keerthi | CS 43 | CS1-Insulated envelope (30.63) | CS1-Insulated envelope (234) | |
| Conventional building located in Eashwer | CS 44 | CS2-Insulated envelope (22.69) | CS2-Insulated envelope (237) | |
| Insulated building located in Adil | CS 45 | CS3-Insulated envelope (29.45) | CS3-Insulated envelope (245) | |
| Conventional building located in Anand | CS 46 | CS4-Insulated envelope (27.08) | CS4-Insulated envelope (230) | |
| Insulated building located in Alwal | CS 47 | CS5-Insulated envelope (20.87) | CS5-Insulated envelope (219) | |
| Insulated building located in RG | CS 48 | CS6-Insulated envelope (23.90) | CS6-Insulated envelope (261) | |
| Insulated building located in Rock town | CS 49 | CS7-Insulated envelope (24.65) | CS7-Insulated envelope (310) | |
| Insulated building located in Kiran Arcade | CS 50 | CS8-Insulated envelope (22.87) | CS8-Insulated envelope (238) | |
| Insulated building located in Mahendra | CS 51 | CS9-Insulated envelope (27.07) | CS9-Insulated envelope (285) | |
| Insulated building located in Nirmal | CS 52 | CS10-Insulated envelope (25.19) | CS10-Insulated envelope (248) | |
| Zhan et al. [47] | Typical residential building located in urban area | CS 53 | 22.77 | 45.19 |
| Iyer- Raniga and Wong [48] | Heritage building with brick veneer envelope | CS 54 | CS1 (63.61) | CS1 (45.00) |
| Heritage building with weatherboard envelope | CS 55 | CS2 (314.4) | CS2 (193.90) | |
| Heritage building with weatherboard envelope | CS 56 | CS3 (118.33) | CS3 (170.50) | |
| Heritage building with weatherboard envelope | CS 57 | CS4 (161.38) | CS4 (116.38) | |
| Heritage building with brick veneer envelope | CS 58 | CS5 (180) | CS5 (108.80) | |
| Heritage building with solid brick | CS 59 | CS6 (134.16) | CS6 (88.00) | |
| Heritage building with solid brick | CS 60 | CS7 (137.22) | CS7 (82.22) | |
| Heritage building with brick veneer envelope | CS 61 | CS8 (143.8) | CS8 (83.88) | |
| Dodoo et al. [39] | Cross laminated timber structure with heat pump heated system | CS 62 | CLT (−18.36) | CLT with HPH system (187) |
| Beam-and-Column system structure with heat pump heated system | CS 63 | BC (−14.2) | BC with HPH (192) | |
| Modular timber structure with heat pump heated system | CS 64 | MT (−3.5) | MT with HPH (192) | |
| Cross laminated timber structure with district heated system | CS 65 | CLT (−18.36) | CLT with DH system (176) | |
| Beam-and-Column system structure with district heated system | CS 66 | BC (−14.2) | BC with DH (180) | |
| Modular timber structure with district heated system | CS 67 | MT (−3.5) | MT with DH (180) | |
| Tettey et al. [40] | Standard building with concrete system | CS 68 | Standard building with concrete system (8.775) | Standard building with concrete system (137.47) |
| Standard building with cross laminated timber structure | CS 69 | Standard building with CLT (−20.18) | Standard building with CLT (137.47) | |
| Standard building with modular timber structure | CS 70 | Standard building with MT (−4.43) | Standard building with MT (137.47) | |
| Passive building with concrete system | CS 71 | Passive building with concrete system (9.52) | Passive building with concrete system (71.16) | |
| Passive building with modular timber structure | CS 72 | Passive building with MT (−4.03) | Passive building with MT (71.16) | |
| Mehta et al. [35] | Multi-story residential building | CS 73 | 34.75 | 179.70 |
| Zhu et al. [41] | Prefabricated buildings located in Chengdu, China | CS 74 | CS A (33.94) | CS A (86.11) |
| Prefabricated buildings located in Shenzhen, China | CS 75 | CS B (28.00) | CS B (113.88) | |
| Bastos et al. [32] | City apartment | CS 76 | CA (15.02) | CA (70.77) |
| Suburban house | CS 77 | SH (17.75) | SH (75.19) | |
| Goggins et al. [49] | Baseline building constructed according to 2005 Irish regulations. Airtightness 9.1 ac/hr@ 50 Pa. | CS 78 | 16.725 | 131.26 |
| Building constructed according to 2008 Irish regulations. Airtightness 5.44 ac/hr@ 50 Pa. | CS 79 | 17.06 | 100.96 | |
| Building constructed according to 2011 Irish regulations. Airtightness 5.44 ac/hr@ 50 Pa. | CS 80 | 20.07 | 85.23 | |
| Building constructed according to 2011 Irish regulations. Airtightness 0.45 ac/hr@ 50 Pa. | CS 81 | 18.73 | 83.07 | |
| NZEB Airtightness 5.44 ac/hr@ 50 Pa. | CS 82 | 21.24 | 78.59 | |
| NZEB. Airtightness 0.45 ac/hr@ 50 Pa. | CS 83 | 19.56 | 79.07 | |
| Kristjansdottir et al. [50] | NZEB | CS 84 | 80.30 | 55.50 |
| Mistretta et al. [51] | Baseline building | CS 85 | 137.86 | 12.80 |
| NZEB (retrofitted) | CS 86 | 49.20 | −90.0 |
References
- Nejat, P.; Jomehzadeh, F.; Taheri, M.M.; Gohari, M.; Majid, M.Z.A. A global review of energy consumption, CO2 emissions and policy in the residential sector (with an overview of the top ten CO2 emitting countries). Renew. Sustain. Energy Rev. 2015, 43, 843–862. [Google Scholar] [CrossRef]
- Soltani, A.; Mehraein, M.; Sharifi, E. Urban features and energy consumption at local level. JUEE 2012, 6, 43–47. [Google Scholar] [CrossRef][Green Version]
- Omrany, H.; Ghaffarianhoseini, A.; Ghaffarianhoseini, A.; Raahemifar, K.; Tookey, J. Application of passive wall systems for improving the energy efficiency in buildings: A comprehensive review. Renew. Sustain. Energy Rev. 2016, 62, 1252–1269. [Google Scholar] [CrossRef]
- Moncaster, A.M.; Rasmussen, F.N.; Malmqvist, T.; Wiberg, A.H.; Birgisdottir, H. Widening understanding of low embodied impact buildings: Results and recommendations from 80 multi-national quantitative and qualitative case studies. J. Clean. Prod. 2019, 235, 378–393. [Google Scholar] [CrossRef]
- Stephan, A.; Crawford, R.H.; De Myttenaere, K. Towards a comprehensive life cycle energy analysis framework for residential buildings. Energy Build. 2012, 55, 592–600. [Google Scholar] [CrossRef]
- Stephan, A.; Crawford, R.H.; De Myttenaere, K. A comprehensive assessment of the life cycle energy demand of passive houses. Appl. Energy 2013, 112, 23–34. [Google Scholar] [CrossRef]
- Crawford, R.H.; Bartak, E.L.; Stephan, A.; Jensen, C.A. Evaluating the life cycle energy benefits of energy efficiency regulations for buildings. Renew. Sustain. Energy Rev. 2016, 63, 435–451. [Google Scholar] [CrossRef]
- Malmqvist, T.; Nehasilova, M.; Moncaster, A.; Birgisdottir, H.; Rasmussen, F.N.; Wiberg, A.H.; Potting, J. Design and construction strategies for reducing embodied impacts from buildings—Case study analysis. Energy Build. 2018, 166, 35–47. [Google Scholar] [CrossRef]
- Chau, C.K.; Leung, T.M.; Ng, W.Y. A review on life-cycle assessment, life-cycle energy assessment and life-cycle carbon emissions assessment on buildings. Appl. Energy 2015, 143, 395–413. [Google Scholar] [CrossRef]
- Dixit, M.K.; Fernández-Solís, J.L.; Lavy, S.; Culp, C.H. Identification of parameters for embodied energy measurement: A literature review. Energy Build. 2010, 42, 1238–1247. [Google Scholar] [CrossRef]
- Dixit, M.K. Life cycle embodied energy analysis of residential buildings: A review of literature to investigate embodied energy parameters. Renew. Sustain. Energy Rev. 2017, 79, 390–413. [Google Scholar] [CrossRef]
- Dixit, M.K.; Culp, C.H.; Fernández-Solís, J.L. System boundary for embodied energy in buildings: A conceptual model for definition. Renew. Sustain. Energy Rev. 2013, 21, 153–164. [Google Scholar] [CrossRef]
- Dixit, M.K.; Fernández-Solís, J.L.; Lavy, S.; Culp, C.H. Need for an embodied energy measurement protocol for buildings: A review paper. Renew. Sustain. Energy Rev. 2012, 16, 3730–3743. [Google Scholar] [CrossRef]
- Karimpour, M.; Belusko, M.; Xing, K.; Bruno, F. Minimizing the life-cycle energy of buildings: Review and analysis. Build. Environ. 2014, 73, 106–114. [Google Scholar] [CrossRef]
- Cabeza, L.F.; Rincón, L.; Vilariño, V.; Pérez, G.; Castell, A. Life cycle assessment (LCA) and life cycle energy analysis (LCEA) of buildings and the building sector: A review. Renew. Sustain. Energy Rev. 2014, 29, 394–416. [Google Scholar] [CrossRef]
- Khasreen, M.; Banfill, P.F.; Menzies, G. Life-cycle assessment and the environmental impact of buildings: A review. Sustainability 2009, 1, 674–701. [Google Scholar] [CrossRef]
- Švajlenka, J.; Kozlovská, M. Houses based on wood as an ecological and sustainable housing alternative—case study. Sustainability 2018, 10, 1502. [Google Scholar] [CrossRef]
- Švajlenka, J.; Kozlovská, M. Effect of accumulation elements on the energy consumption of wood constructions. Energy Build. 2019, 198, 160–169. [Google Scholar] [CrossRef]
- Pryshlakivsky, J.; Searcy, C. Fifteen years of ISO 14040: A review. J. Clean. Prod. 2013, 57, 115–123. [Google Scholar] [CrossRef]
- ISO. Environmental Management-Life Cycle Assessment-Requirements and Guidelines; International Organization for Standardization: Geneva, Switzerland, 2006. [Google Scholar]
- ISO. Environmental Management: Life Cycle Assessment-Principles and Framework; International Organization for Standardization: Geneva, Switzerland, 2006. [Google Scholar]
- Singh, A.; Berghorn, G.; Joshi, S.; Syal, M. Review of life-cycle assessment applications in building construction. J. Build. Eng. 2010, 17, 15–23. [Google Scholar] [CrossRef]
- Ramesh, T.; Prakash, R.; Shukla, K.K. Life-cycle energy analysis of buildings: An overview. Energy Build. 2010, 42, 1592–1600. [Google Scholar] [CrossRef]
- Fay, R.; Graham, T.; lyer-Raniga, U. Life-cycle energy analysis of buildings: A case study. Build. Res Inf. 2000, 28, 31–41. [Google Scholar] [CrossRef]
- Omrany, H.; Ghaffarianhoseini, A.; Berardi, U.; Ghaffarianhoseini, A.; Li, D.H. Is atrium an ideal form for daylight in buildings? Archit. Sci. Rev. 2019, 1–16. [Google Scholar] [CrossRef]
- Ghaffarianhoseini, A.; AlWaer, H.; Omrany, H.; Ghaffarianhoseini, A.; Alalouch, C.; Clements-Croome, D.; Tookey, J. Sick building syndrome: Are we doing enough? Archit. Sci. Rev. 2018, 61, 99–121. [Google Scholar] [CrossRef]
- Aye, L.; Ngo, T.; Crawford, R.H.; Gammampila, R.; Mendis, P. Life cycle greenhouse gas emissions and energy analysis of prefabricated reusable building modules. Energy Build. 2012, 47, 159–168. [Google Scholar] [CrossRef]
- Ramesh, T.; Prakash, R.; Shukla, K.K. Life cycle energy analysis of a residential building with different envelopes and climates in Indian context. Appl. Energy 2012, 89, 193–202. [Google Scholar] [CrossRef]
- Ramesh, T.; Prakash, R.; Shukla, K.K. Life cycle approach in evaluating energy performance of residential buildings in Indian context. Energy Build. 2012, 54, 259–265. [Google Scholar] [CrossRef]
- Stephan, A.; Stephan, L. Reducing the total life-cycle energy demand of recent residential buildings in Lebanon. Energy 2014, 74, 618–637. [Google Scholar] [CrossRef]
- Pinky Devi, L.; Palaniappan, S. Life cycle energy analysis of a low-cost house in India. Intl. J. Cons. Edu. Res. 2018, 1–20. [Google Scholar] [CrossRef]
- Bastos, J.; Batterman, S.A.; Freire, F. Significance of mobility in the life-cycle assessment of buildings. Build. Res. Inf. 2016, 44, 376–393. [Google Scholar] [CrossRef]
- Bastos, J.; Batterman, S.A.; Freire, F. Life-cycle energy and greenhouse gas analysis of three building types in a residential area in Lisbon. Energy Build. 2014, 69, 344–353. [Google Scholar] [CrossRef]
- Praseeda, K.I.; Reddy, B.V.; Mani, M. Embodied and operational energy of urban residential buildings in India. Energy Build. 2016, 110, 211–219. [Google Scholar] [CrossRef]
- Mehta, S.; Chandur, A.; Palaniappan, S. Life Cycle Energy Assessment of a Multi-storey Residential Building. J. Inst. Eng. India Ser. A 2017, 98, 155–162. [Google Scholar] [CrossRef]
- Crawford, R.H. Post-occupancy life cycle energy assessment of a residential building in Australia. Archit. Sci. Rev. 2014, 57, 114–124. [Google Scholar] [CrossRef]
- Devi, P.; Palaniappan, S. A case study on life cycle energy use of residential building in Southern India. Energy Build. 2014, 80, 247–259. [Google Scholar] [CrossRef]
- Gustavsson, L.; Joelsson, A.; Sathre, R. Life cycle primary energy use and carbon emission of an eight-storey wood-framed apartment building. Energy Build. 2010, 42, 230–242. [Google Scholar] [CrossRef]
- Dodoo, A.; Gustavsson, L.; Sathre, R. Lifecycle primary energy analysis of low-energy timber building systems for multi-storey residential buildings. Energy Build. 2014, 81, 84–97. [Google Scholar] [CrossRef]
- Tettey, U.Y.A.; Dodoo, A.; Gustavsson, L. Effect of different frame materials on the primary energy use of a multi storey residential building in a life cycle perspective. Energy Build. 2019, 185, 259–271. [Google Scholar] [CrossRef]
- Zhu, H.; Hong, J.; Shen, G.Q.; Mao, C.; Zhang, H.; Li, Z. The exploration of the life-cycle energy saving potential for using prefabrication in residential buildings in China. Energy Build. 2018, 166, 561–570. [Google Scholar] [CrossRef]
- Dodoo, A.; Gustavsson, L. Life cycle primary energy use and carbon footprint of wood-frame conventional and passive houses with biomass-based energy supply. Appl. Energy 2013, 112, 834–842. [Google Scholar] [CrossRef]
- Atmaca, A.; Atmaca, N. Life cycle energy (LCEA) and carbon dioxide emissions (LCCO2A) assessment of two residential buildings in Gaziantep, Turkey. Energy Build. 2015, 102, 417–431. [Google Scholar] [CrossRef]
- Rossi, B.; Marique, A.F.; Reiter, S. Life-cycle assessment of residential buildings in three different European locations, case study. Build. Environ. 2012, 51, 402–407. [Google Scholar] [CrossRef]
- Cellura, M.; Guarino, F.; Longo, S.; Mistretta, M. Energy life-cycle approach in Net zero energy buildings balance: Operation and embodied energy of an Italian case study. Energy Build. 2014, 72, 371–381. [Google Scholar] [CrossRef]
- Paulsen, J.S.; Sposto, R.M. A life cycle energy analysis of social housing in Brazil: Case study for the program “MY HOUSE MY LIFE”. Energy Build. 2013, 57, 95–102. [Google Scholar] [CrossRef]
- Zhan, J.; Liu, W.; Wu, F.; Li, Z.; Wang, C. Life cycle energy consumption and greenhouse gas emissions of urban residential buildings in Guangzhou city. J. Clean. Prod. 2018, 194, 318–326. [Google Scholar] [CrossRef]
- Iyer-Raniga, U.; Wong, J.P.C. Evaluation of whole life-cycle assessment for heritage buildings in Australia. Build. Environ. 2012, 47, 138–149. [Google Scholar] [CrossRef]
- Goggins, J.; Moran, P.; Armstrong, A.; Hajdukiewicz, M. Lifecycle environmental and economic performance of nearly zero energy buildings (NZEB) in Ireland. Energy Build. 2016, 116, 622–637. [Google Scholar] [CrossRef]
- Kristjansdottir, T.F.; Houlihan-Wiberg, A.; Andresen, I.; Georges, L.; Heeren, N.; Good, C.S.; Brattebø, H. Is a net life cycle balance for energy and materials achievable for a zero emission single-family building in Norway? Energy Build. 2018, 168, 457–469. [Google Scholar] [CrossRef]
- Mistretta, M.; Arcoleo, M.; Cellura, M.; Cesarini, D.N.; Guarino, F.; Longo, S. Refurbishment scenario to shift nearly net ZEBs toward net ZEB target: An Italian case study. In Nearly Zero Energy Building Refurbishment; Springer: London, UK, 2013; pp. 233–252. [Google Scholar] [CrossRef]
- Gustavsson, L.; Joelsson, A. Life cycle primary energy analysis of residential buildings. Energy Build. 2010, 42, 210–220. [Google Scholar] [CrossRef]
- CIRCE. ENSLIC BUILDING-energy Saving through Promotion of Life Cycle Assessment in Buildings, D 4.2. In CIRCE. Pilot Case 3, in ENSLIC-CIRCE-WP4-Pilot Cases-published on Intelligent Energy Europe; Intelligent Energy Europe; European Union: Brussel, Belgium, 2010. [Google Scholar]
- Grant, A.; Ries, R. Impact of building service life models on life cycle assessment. Build Res. Inf. 2013, 41, 168–186. [Google Scholar] [CrossRef]
- Rauf, A.; Crawford, R.H. Building service life and its effect on the life cycle embodied energy of buildings. Energy 2015, 79, 140–148. [Google Scholar] [CrossRef]
- Fufa, S.M.; Wiik, M.R.K.; Schlanbusch, R.D.; Andresen, I. The influence of estimated service life on the embodied emissions of zero emission buildings (ZEBs) when choosing low-carbon building products. In XIV DBMC-14th International Conference on Durability of Building Materials and Components; Rilem publications: Ghent, Belgium, 2017. [Google Scholar]
- Crawford, R.H.; Bontinck, P.A.; Stephan, A.; Wiedmann, T.; Yu, M. Hybrid life cycle inventory methods—A review. J. Clean. Prod. 2018, 172, 1273–1288. [Google Scholar] [CrossRef]
- Chastas, P.; Theodosiou, T.; Bikas, D. Embodied energy in residential buildings-towards the nearly zero energy building: A literature review. Build. Environ. 2016, 105, 267–282. [Google Scholar] [CrossRef]
- Yung, P.; Lam, K.C.; Yu, C. An audit of life cycle energy analyses of buildings. Habitat Int. 2013, 39, 43–54. [Google Scholar] [CrossRef]
- Sartori, I.; Hestnes, A.G. Energy use in the life cycle of conventional and low-energy buildings: A review article. Energy Build. 2007, 39, 249–257. [Google Scholar] [CrossRef]
- Thibodeau, C.; Bataille, A.; Sié, M. Building rehabilitation life cycle assessment methodology—state of the art. Renew. Sustain. Energy Rev. 2019, 103, 408–422. [Google Scholar] [CrossRef]
- Sicignano, E.; Di Ruocco, G.; Melella, R. Mitigation Strategies for Reduction of Embodied Energy and Carbon, in the Construction Systems of Contemporary Quality Architecture. Sustainability 2019, 11, 3806. [Google Scholar] [CrossRef]
- Treloar, G.J.; Crawford, R.H. Database of Embodied Energy and Water Values for Materials. Melbourne: The University of Melbourne. Available online: https://melbourne.figshare.com/articles/Database_of_Embodied_Energy_and_Water_Values_for_Materials/4595623 (accessed on 15 October 2019).


| Keywords Applied at the First Stage |
|---|
| Life cycle assessment; sustainability assessment; life cycle energy assessment; operational and embodied energy; life cycle environmental assessment; building energy performance; life cycle assessment tools; building energy consumption; building environmental emissions; sustainable construction; life cycle inventory; sustainable building design; building embodied emissions. |
| Author(s) | Building Components | Furniture/Fixtures/Appliances | Elements Beyond Building Scale |
|---|---|---|---|
| Aye et al. [27] | Columns and beams, external and internal walls, external cladding, ceiling, roof, floor, doors and windows, floor tiling, staircase. | NA | NA |
| Gustavsson et al. [38] | Foundation, floor structure, roof, external and internal walls, doors and windows, balconies, stairs. | Interior fixtures | NA |
| Dodoo and Gustavsson [42] | Foundation, floor, roof, external and internal walls, insulation, doors and windows, balconies, stairs. | NA | NA |
| Ramesh et al. [28] | Exterior walls, roof and floor, insulation. | NA | NA |
| Stephan and Stephan [30] | Exterior walls, roof, floor, building structure, insulation, building systems. | NA | Urban infrastructure, occupants’ transport |
| Atmaca and Atmaca [43] | External and internal walls, doors and windows, roof, floor, wall and roof tiles, insulation, building structure, foundation, façade (plastering, painting). | NA | NA |
| Rossi et al. [44] | Basement slab, external and internal walls, roof and floor. | NA | NA |
| Stephan et al. [6] | Building structure and sub-structure, external and internal walls, finishings, floor, roof, foundation, systems (piping and wiring), doors and windows, insulations. | Carpet, fixtures | Urban infrastructure, occupants’ transport |
| Cellura et al. [45] | Electrical systems, solar thermal system, Photovoltaic (PV) systems, air handling unit, thermal plant, domestic hot water (DHW) plant, building sub-structure, external and internal walls, building structure, roof and floor, foundation. | NA | NA |
| Stephan et al. [5] | Building structure and sub-structure, external and internal walls, finishings, floor, roof, foundation, systems (piping and wiring), doors and windows, insulations. | NA | Urban infrastructure (i.e., roads, power lines, water and gas distribution, and sewage) |
| Crawford [36] | External walls, roof and floor, doors and windows, paint, building structure, insulation, foundation. | Finishes, appliances, carpet, fitout | NA |
| Pinky Devi and Palaniappan [31] | External walls, roof and floor, building structural frames, systems (plumbing, firefighting and wiring), painting and plastering, foundation. | NA | NA |
| Paulsen and Sposto [46] | External and internal walls, painting and plastering, roof and floor, ceiling, windows, indoor and external doors. | NA | NA |
| Devi and Palaniappan [37] | Building envelope, structural frames/concreting work, finishing (plastering, painting and tiling), doors and windows, sanitary installations, systems (plumbing and water pipes) and steel work (tubes for atrium glazing and stainless steel accessories). | NA | NA |
| Bastos et al. [33] | External and internal walls, floor, roof, staircases, building structures, windows, external and internal doors. | NA | NA |
| Ramesh et al. [29] | External walls, roof, widows, PV panels, wind turbine, wiring and installation. | NA | NA |
| Zhan et al. [47] | External walls, floor, roof, foundation, finishing (plastering, painting and tiling), building structure. | NA | NA |
| Iyer-Raniga and Wong [48] | Foundations, columns, upper floors, staircases, roof, external and internal walls, windows, external and internal doors, floor and ceiling finishes. | NA | NA |
| Dodoo et al. [39] | External and internal walls, intermediate floor and ceiling, roof, foundation, windows and doors, elevator and stair, services and installations, finishes. | NA | NA |
| Tettey et al. [40] | Building structure, external and internal walls, floor, insulation and finishes, foundation, windows. | NA | NA |
| Mehta et al. [35] | Building structure, external walls, foundation, roof, floor, and painting. | NA | NA |
| Zhu et al. [41] | External walls, precast façade, staircase, slab, balcony, painting, windows, finishes. | NA | NA |
| Bastos et al. [32] | External and internal walls, wooden and concrete floors, staircase, roof, windows, foundations, external and internal doors. | NA | Occupants’ transport |
| Goggins et al. [49] | External walls, foundations and floors, roof, chimney, stairs, PV panels, ventilation systems. | NA | NA |
| Kristjansdottir et al. [50] | PV system, space-heating system, external and internal walls, foundation, windows and external doors, roof, insulation. | NA | NA |
| Mistretta et al. [51] | Blinds, electrical system, solar thermal system, PV system, air handling unit, thermal plant, DHW plant, building frame, external and internal walls, support structures, roof, foundations. | NA | NA |
| Building Life Span | Frequency of Use |
|---|---|
| 50 years | 15 |
| 60 years | 2 |
| 70 years | 3 |
| 75 years | 3 |
| 80 years | 1 |
| 100 years | 3 * |
| Total | 27 |
| Stage of Building Life Cycle Targeted | Assumption | Reference |
|---|---|---|
| Operation phase | The schedule for operating heating and cooling systems is assumed to remain unchanged during the entire course of life cycle assessment; The detailed occupational schedules and gains are not considered; The efficiency of heat pump system is assumed to be constant over time; The annual operating energy is assumed to remain consistent in throughout the entire building life span; The effects of climate change and occupants’ behaviors in the future are not taken into consideration; The resource mix supplying electricity to the buildings is assumed to be static; | [27,28,29,33,42] |
| Initial embodied energy | Australian database of construction materials is used to calculate the embodied energy; Australian input–output-based hybrid embodied energy intensities are used for a case study located in Belgium; Using I–O data relating to production stage that occurred over a decade ago; | [6,30,36,43,48] |
| Embodied energy of on-site construction | All the manufacturing processes are assumed to be undertaken in one place; The primary energy used for on-site construction is assumed to be 80 kWh/m2; The primary energy used for on-site construction is assumed to be 4% of the material production primary energy; 80 and 160 kWh/m2 are assumed for the on-site energy consumption of wood and concrete building systems respectively; | [38,39,40] |
| Embodied energy of replacement and refurbishment | The structural elements of the building are assumed to have the same service life as the house; The embodied energy associated with replacement, refurbishment and repair of materials and products are assumed to be 5% every 10 years; The replacement lifetimes of construction materials in US are used for LCEA of buildings in Australia; The standard construction methods and materials are assumed to remain the same during the entire building life span; | [43,44,48] |
| Embodied energy of EOL | 5% waste of material is assumed during construction; 90% of the wood-based demolition materials are assumed to be recovered while 10% decays into atmosphere; Only one type of fuel is assumed to be used for transporting the wastages; To account for the contribution of EOL stage, 1% of the total life cycle energy demand is summed to the final achieved figure; The embodied energy associated with EOL is assumed to be 3% of the total building life cycle energy demand; The primary energy use for demolition of wood and concrete are assumed to be 10 and 20 kWh/m2 respectively; All of the materials are assumed to be landfilled at the EOL stage; It is assumed that demolition energy will not exceed 10 kWh/m2 | [36,37,38,39,40,42,43] |
| Database | Developer | Data Coverage | Access | Boundary | LCI Method |
|---|---|---|---|---|---|
| SimaPro | PRe’ Consultants, Netherlands | Ecoinvent, US LCI, Danish input-output database, Dutch input-output database, LCA food database, Industry data | Licensed access | Cradle-to-grave | Process- based and I-O method |
| Ecoinvent | Ecoinvent centre, Swiss | General products and processes including energy, transport, building materials, chemicals, washing agents, paper and board, agriculture, waste management, International data | Licensed access | Cradle-to-gate | Process-based method |
| ICE | Bath University, UK | Construction and building materials, EU, mostly UK data | Publicly available | Cradle-to-gate | Process-based method |
| AusLCI | Building Product Innovation Council, Australia | Building and construction materials and products, Building product maintenance and replacement life data, Australian data | Publicly available | Cradle-to-grave | Process-based method |
| BEES | National Institute of Standards and Technology (U.S.) | Construction and building materials, mostly U.S. data | Publicly available | Cradle-to-grave | Process-based method |
| Database of Embodied Energy and Water Values for Materials | The University of Melbourne | Construction and building materials, Australian data | Publicly available | Cradle-to-grave | I-O based hybrid method |
| CLCD | Sichuan University, China; IKE Environmental Technology CO., Ltd., China | Materials and chemicals, energy carriers, transport, and waste management, China | Publicly available | Cradle-to-gate | Process-based method |
| Reference | Case Study ID | Energy Recovered at Production Stage | Energy Recovered at Construction Stage | Energy Recovered at EOL Stage | Total Energy Recovered | Total Energy Saved (%) |
|---|---|---|---|---|---|---|
| Gustavsson et al. [38] | CS 4 | 23.64 | NA | 11.42 | 35.06 | 17.84 |
| Dodoo and Gustavsson [42] | CS 5 | 7.78 | NA | 7.92 | 15.70 | 5.36 |
| CS 6 | 7.78 | NA | 7.92 | 15.70 | 7.27 | |
| CS 7 | 7.78 | NA | 7.92 | 15.70 | 7.79 | |
| CS 8 | 8.0 | NA | 8.06 | 16.06 | 6.05 | |
| CS 9 | 8.0 | NA | 8.06 | 16.06 | 7.77 | |
| CS10 | 8.0 | NA | 8.06 | 16.06 | 8.22 | |
| Cellura et al. [45] | CS23 | NA | NA | 19.01 | 19.01 | 9.14 |
| Dodoo et al. [39] | CS 62 | 20.92 | 1.44 | 11.80 | 34.16 | 15.70 |
| CS 63 | 20.22 | 1.26 | 10.90 | 32.38 | 9.54 | |
| CS 64 | 10.18 | 1.10 | 9.04 | 20.32 | 9.04 | |
| CS 65 | 20.92 | 1.44 | 11.80 | 34.16 | 14.88 | |
| CS 66 | 20.22 | 1.26 | 10.90 | 32.38 | 15.02 | |
| CS 67 | 10.18 | 1.10 | 9.04 | 20.32 | 9.54 | |
| Tettey et al. [40] | CS 68 | 1.92 | NA | 5.63 | 7.55 | 4.90 |
| CS 69 | 20.98 | NA | 10.67 | 31.65 | 21.24 | |
| CS 70 | 8.075 | NA | 6.30 | 14.38 | 9.75 | |
| CS 71 | 1.92 | NA | 5.63 | 7.55 | 8.55 | |
| CS 72 | 8.53 | NA | 6.57 | 15.10 | 18.37 |
| Methodological Aspects | Overall Trends of Reviewed Studies for LCEA Application |
|---|---|
| Stages of building life cycle excluded | 50% excluded EOL; 27% replacement and maintenance; 15% excluded on-site construction; 4% excluded transport. |
| Elements proposed for inclusion within system boundary | Three studies accounted for the inclusion of user’s mobility over building life cycle; three studies accounted for the embodied energy of infrastructure on which buildings rely for receiving energy. |
| Building life span | 58% of the reviewed studies considered 50 years as the life span. |
| Assumptions | All stages have been subject to assumptions. |
| Reuse, recovery and recycling potential | 31% of the reviewed studies considered recycling and reusing building materials. |
| The approach used for quantification of embodied energy | 62% used process-based approach and 27% applied I-O based hybrid approach. |
| Database applied for estimating embodied energy | 50% used generic international databases; 19% relied on the literature to retrieve embodied energy coefficients. |
| Contributors considered when estimating operational energy | 62% excluded cooking; 38% excluded DHW; 35% excluded electrical appliances; 27% excluded lighting; and 23% excluded ventilation. |
| Methods used for estimation of operational energy | 44% used software; 22% used static equations; 12% used energy bills. Other methods were also used such as monitoring energy consumption and using the national average of energy use for building stock. |
| Interpretation | 31% used sensitivity analysis; 19% used uncertainty analysis; 31% discussed the limitations of these approaches. 19% used two methods. |
| Geographical context | 50% focused on Europe; 31% on Asia; 15% on Australia; 4% on South America. |
© 2020 by the authors. Licensee MDPI, Basel, Switzerland. This article is an open access article distributed under the terms and conditions of the Creative Commons Attribution (CC BY) license (http://creativecommons.org/licenses/by/4.0/).
Share and Cite
Omrany, H.; Soebarto, V.; Sharifi, E.; Soltani, A. Application of Life Cycle Energy Assessment in Residential Buildings: A Critical Review of Recent Trends. Sustainability 2020, 12, 351. https://doi.org/10.3390/su12010351
Omrany H, Soebarto V, Sharifi E, Soltani A. Application of Life Cycle Energy Assessment in Residential Buildings: A Critical Review of Recent Trends. Sustainability. 2020; 12(1):351. https://doi.org/10.3390/su12010351
Chicago/Turabian StyleOmrany, Hossein, Veronica Soebarto, Ehsan Sharifi, and Ali Soltani. 2020. "Application of Life Cycle Energy Assessment in Residential Buildings: A Critical Review of Recent Trends" Sustainability 12, no. 1: 351. https://doi.org/10.3390/su12010351
APA StyleOmrany, H., Soebarto, V., Sharifi, E., & Soltani, A. (2020). Application of Life Cycle Energy Assessment in Residential Buildings: A Critical Review of Recent Trends. Sustainability, 12(1), 351. https://doi.org/10.3390/su12010351