Abstract
In recent years, the intensification of drought and unsustainable management and use of water resources have caused a significant decline in the water level of the Urmia Lake in the northwest of Iran. This condition has affected the lake, approaching an irreversible point such that many projects have been implemented and are being implemented to save the natural condition of the Urmia Lake, among which the inter-basin water transfer (IBWT) project from the Zab River to the lake could be considered an important project. The main aim of this research is the evaluation of the IBWT project effects on the Gadar destination basin. Simulations of the geometrical properties of the river, including the bed and flow, have been performed, and the land cover and flood map were overlapped in order to specify the areas prone to flood after implementing the IBWT project. The results showed that with the implementation of this project, the discharge of the Gadar River was approximately tripled and the water level of the river rose 1 m above the average. In April, May, and June, about 952.92, 1458.36, and 731.43 ha of land adjacent to the river (floodplain) will be inundated by flood, respectively. Results also indicated that UNESCO’s criteria No. 3 (“a comprehensive environmental impact assessment must indicate that the project will not substantially degrade the environmental quality within the area of origin or the area of delivery”) and No. 5 (“the net benefits from the transfer must be shared equitably between the area of origin and the area of water delivery”) have been violated by implementing this project in the study area. The findings could help the local government and other decision-makers to better understand the effects of the IBWT projects on the physical and hydrodynamic processes of the Gadar River as a destination basin.
1. Introduction
Inter-basin water transfers (IBWTs) indicate water transfer projects spanning two or more basins, from a basin with abundant water resources to those with water shortages [1]. In order to decrease water resource problems, such as water shortages and uneven distribution, more than 160 water transfer projects have been carried out worldwide until 2015 [2]. Although governments construct IBWTs because of economic and social benefits [3], the implementation of these projects causes complicated problems and may affect land use, hydrological systems, water quality, and vegetation in donor and destination watersheds, as well as the surrounding areas along the route of water transfer, leading to changes in the evolution of ecosystems and environmental security [4,5]. The International Hydrological Program (IHP) has introduced five criteria for justifying or rejecting IBWT projects. These criteria are: 1. the area of delivery must face a substantial deficit; 2. the future development of the area of origin must not be substantially constrained by water scarcity; 3. a comprehensive environmental impact assessment must indicate that the project will not substantially degrade environmental quality within the area of origin or area of delivery; 4. a comprehensive assessment of socio-cultural impacts must indicate a reasonable degree of certainty that it will not cause substantial socio-cultural disruption in the area of origin or area of water delivery; 5. the net benefits from the transfer must be shared equitably between the area of origin and the area of water delivery [6]. Therefore, any IBWT project should be evaluated based on these five criteria.
In Iran, hundreds of million dollars are spent annually on IBWT projects. However, there is not any reasonable level of certainty that these projects will not fundamentally destroy environmental quality in donor and destination watersheds, or rather disarrange the morphological balance of the watersheds. In recent years, the intensification of drought and unsustainable use of water resources (dam constructions and over-allocation of water resources to agriculture) have caused a significant decline in the water level of the Urmia Lake in the northwest of Iran [7,8]. The lake is being dried up at an alarming rate. The main problem is that a wide range of users regularly withdraw water from the basins feeding the lake; hence, the outflow has vastly exceeded the inflow of the lake in recent years, resulting in the lake facing a serious crisis, and irreversible damage to the environment and possible imbalance of the regional ecosystem [9]. One of the new priority action plans, which was approved within the Urmia Lake basin management plan in mid-2013 as an urgent action, was the funding and acceleration of the transfer of water from the Zab River to the Urmia lake basin. Therefore, the government, to save Urmia Lake, is implementing the IBWT project from the Zab River to Urmia Lake. The water transmission, despite the removal of some deficiencies in the destination basin, could cause large changes in the bed of the river, such as its transverse and longitudinal profiles.
Considerable investigations have been reported on the impact of IBWT projects implemented across the world [10]. In recent decades, the environmental impacts caused by water transfer projects and reservoir dams have attracted wide attention from managers and researchers [10,11,12,13]. Research shows that the implementation of the south to north water transfer project (SNWTP) in China has caused drastic changes in the hydraulic parameters of water depth, flow rate, the area, and width of the surface flows [14,15]. Salinization and water-logging of soil caused by rising groundwater levels due to leakage channels, the occurrence of mass movements, digging diversion channels, and increase in water flow and consequently increase in soil moisture, intensify the swelling behavior of soils on the terrace and eventually fail the slope of channel dykes in the form of collapse, landslides, and mudflows in the destination basin [16,17,18]. Also, in the United States, dams have caused changes in water flow and flow transport capacity, as well as sediment load in rivers which, in turn, have brought about major changes in cross-sectional and longitudinal sections of rivers and reactions of river tributaries to these changes [19]. Investigations of IBWTs in South Africa show that the IBWTs have the greatest impacts on the upper reaches of the regulated river in the destination watershed. For example, before the implementation of the IBWT, channels in a section of the Skoenmakers River were formed by low flood frequency; however, the hydrological regime has increased after transferring water. As a result, erosion and degradation have been observed both in the channel bed and banks [20]. In 2013, in order to understand and manage groundwater–river interaction (GRI) behavior and the nature of the reservoir control system in the context of inter-basin transfers, the semi-coupled models Hydrologic Engineering Center’s River Analysis System (HEC-RAS) and MODFLOW were utilized for replicating the Tees River experiment that was conducted in 1976. The results showed that the total temporary bankside storage volume was up to 17.5% of the total reservoir release, given about 22 h of travel time. Therefore, with careful reservoir and groundwater management, the Tees River proved to be an ideal natural aqueduct for inter-basin transfers when used as a part of a major regional water resource scheme [21].
Some models and techniques have been suggested and used for flood and groundwater mapping worldwide [22,23,24,25,26,27,28,29,30,31,32,33,34]. The literature concludes that these models could be classified into three main categories: hydrologic, hydraulic, and data-driven models. The distributed hydrologic models such as the Hydrologic Engineering Center’s Hydrologic Modeling System (HEC-HMS), which was developed by the US Army Corps of Engineers, are performed based on a rainfall–runoff model that quantifies flood peak discharges or a flow hydrograph of a given return period (T). The hydraulic models, such as HEC’s River Analysis System (HEC-RAS) [35], predict the flow and velocity dynamics of rivers using a mono-dimensional (1D) surface water model in a steady-state condition and by means of an unsteady 1D or 2D flood routing algorithm. Recently data-driven models, such as machine learning models, have been given more attention by flood researchers to map the flood-prone areas. They do not need flow depth, Manning roughness efficiency, flow velocity, and geometry characteristics for flood modeling [28,30]. They are generally worked and performed by some related geo-environmental factors for natural hazard mapping [26,29,31,36,37].
The difference between the current study and previous studies is that the effects of the IBWT projects on the destination of the river have rarely been considered. Therefore, the main aims of this study are: (1) to simulate the water quantity in the downstream reaches of the Gadar River with analysis of spatial–temporal variations before and after the operation of inter-basin water diversion projects; (2) to predict the inundation areas due to the implementation of the water transfer project in the downstream of the Gadar River of the destination basin using HEC-GeoRAS10.2 and HEC-RAS 4.1 software; (3) to evaluate the effects of IBWT on the destination basin based on the UNESCO criteria; and (4) additionally, to identify sensitive areas and to provide practical solutions to minimize the damages and to maximize the benefits.
2. Study Areas
2.1. The Origin and Destination Basins
The Zab River Basin, the origin basin, is located in the southwest of West Azerbaijan Province, Iran. In terms of geographical coordinates, it lies between longitudes of 44°50′10″ and 45°50′40″ E and latitudes of 35°59′30″ and 36°54′20″ N, and its area is 3383.11 km2. This basin is one of the sub-basins of the Persian Gulf. It is bounded on the north by the Gadar River basin, on the east by the Simineh Rood and Mahabad River basins, and on the west and south by Iraq (Figure 1). The general direction of the elevations is northwest–southeast, and its elevation ridge to the west of the basin forms the Iran–Iraq border.
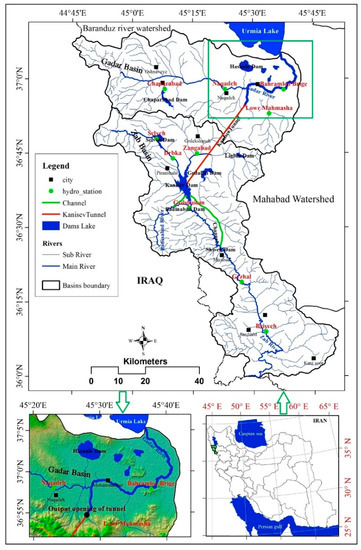
Figure 1.
Location of water transfer project from Zab River Basin to Urmia Lake.
The Gadar River Basin, the destination basin, is located in the north of Zab River Basin between the longitudes of 45°42′5″ and 44°4′50″ E and latitudes of 36°44′45″ and 37°09′55″ N. This basin is limited from north to the Baranduz river basin, from west to Iraq, from east to the Mahabad river basin, from northeast to the Urmia Lake, and from south to the Zab River basin (Figure 1). It covers an area of 2225.12 km2. About 52% of the basin area is relatively flat, with a very low slope approaching the east of the Urmia Lake. This part of the watershed includes the Shino and Sindos (Naqhada) plain and the coastal plain of Sharveran. The Gadar River flows in the middle of the plains from west to east. Once it approaches the lake, its bed widens, and the height of the alluvial terraces is reduced.
According to data recorded at the Grzhal Hydrometric Station, the average annual flow of the Zab River is 46.1 m3/s, equivalent to 1453.8 Mm3 per year. This figure is 11.18 m3/s and 355.47 Mm3 per year, respectively, at the Bahramloo Bridge Hydrometric Station in the Gadar River Basin (Table 1).

Table 1.
Monthly discharge in the 50-year period (1967 to 2017) of the origin and destination basins (m3/s) [38].
Sedimentary, metamorphic, volcanic, igneous rocks from the Precambrian to the present from northwest to the southeast are outcropped in the downstream of the Gadar basin. Quaternary formations, including alluvial terraces and plain deposits (Qft), cover almost all the area of Shino and Sindos plain approaching the Urmia Lake. These formations contain two parts. The old terraces (Qft1) include old fluvial terraces and, in terms of lithology, include conglomerate with particles in various sizes, from a few centimeters to a few decimeters with low sorted, and the cement is relatively loose clay and sand. The new terraces (Qft2) include young terraces and plain deposits that have occurred in the lower levels of the old terraces, and from the lithological point of view, this unit consists of fine-grained materials, such as sand, silt, clay, and conglomerate that is not hard. Also, the unit of Qal includes young deposits in the watercourse, which are mainly formed from sand and various rubble, and these particles are often detached and without cement, such that each year they are transported by water flow. Finally, the Qsl unit, which includes salt clay zones extending in the northeast of the Gadar basin and south of the Urmia Lake (Figure 2).
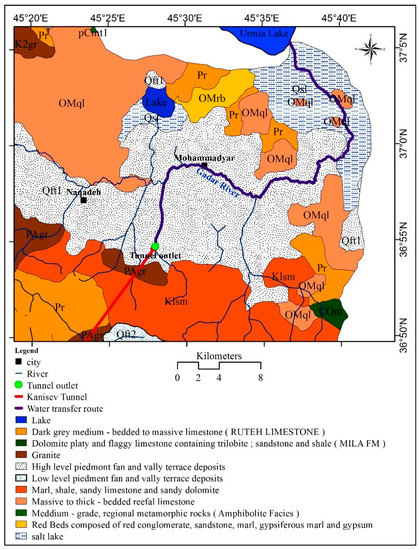
Figure 2.
Geology of the Gadar river basin in the study area.
2.2. The Inter-Basin Water Transfer Project
Generally, the project of transferring water from the Zab River basin as a sub-basin of the Persian Gulf to Urmia Lake includes a set of plans for the water collection system from upstream branches of the Zab River, as well as a tunnel to transfer the water from the Kanisev dam to the Gadar river basin, and eventually to Urmia Lake. The aim of this project is to collect water in the donor basin, to reduce the amount of water existing at the international borders, and to increase the transmission of water to the adjacent basin (Urmia Lake) [39]. According to the plan, about 678.8 mm3 of water is transferred to Urmia Lake using the Kanisev tunnel (Table 2). The Kanisev dam is an embankment dam, 51 m in height, crest length of 776 m, crest width of 9 m, the total volume of the reservoir at the normal level is 326 mm3, the adjustable volume is 740 mm3 per year, with Ogee weirs, the spillway crest length is 60 m, the height of the coffer dam to the bedrock is 20 m, the diversion tunnel is on the right, the number and shape of the diversion tunnel with a circular double-stranded length of the tunnel is 252 m, the length of the tunnel is 282 m, the internal diameter of the tunnels is 5.5 m, tunnel length is 35.3 km, the tunnel diameter is 5.5 m, the access tunnel length is 1354 m, drilling method is two TBM (tunnel boring machine)s, a body of 678.8 mm3 per year water transport, with a free flow slope of 0.085 [40]. The project would be completed within five years, and it should have been completed by 2016; however, due to drilling equipment restrictions and lack of funding, only 61.7% had progressed by June 2019 [41]. It is noted that since starting the project, $91 million had been allocated and could be estimated at around a $100 million budget to completion [42].
Table 2.
Average long-term optimal water transferred through the Kanisev channel (Mm3 (million cubic meters)).
This study includes a part of the project which extends from the junction of branches Bagmqala to the Gadar River to the Urmia Lake, with an approximate length of 38.5 km, in the downstream of the Naghada plain. In this part of the project, the height difference between the permanent bed of the Gadar River and floodplain is minimal, and the average slope is less than 0.06%.
3. Material and Methods
3.1. Data Acquisition
Data required for this research consist of: (1) Topographic data, including 1:5000 topographic maps, to prepare the map from the Kanisev tunnel to Urmia Lake, such that more than 500 points along the river were surveyed. The digital elevation model was then produced from the digitized contour lines with 2 × 2 m pixel resolution, using a triangular irregular network model; (2) Landsat satellite images 8 (ETM+) dated 6 November 2014, downloaded from the United States Geological Survey (USGS), to extract land use maps of the study area using PCI Geomatica 9.1 software by the supervised method. This map was produced to estimate the Manning roughness coefficient, as well as to assess the damages caused by the increased flow downstream of the Gadar River; (3) Geological data were obtained from 1:100,000 geological maps of Shino, Naghada, Mahabad, and Ajabsher regions; (4) Climatic data comprising rainfall, temperature, humidity, and evaporation were obtained from meteorological stations of Mahabad, Sardasht, and Piranshar located in the vicinity of the study area; (5) Hydrological data encompassed the Zab and Gadar river discharge data and their tributaries received from Iranian Water Resources Management Company and Western Azarbaijan Regional Water Authority; and (6) Software including SPSS 18, Arc GIS 10.2, PCI Geomatica 9.1, HEC-RAS 4.1, and their accessions, such as Geostatistical Analyst and HEC-GeoRAS 10.2, were used to make maps and to perform statistical analyses. Field operations were performed to complete the dataset and compliance results with the status quo.
3.2. River Geometric Simulation
In order to insert the river’s cross-sections in the HEC-RAS software, a triangular irregular networks (TIN) plan of the study area in geographic information system (GIS) was first provided, and then by means of the HEC-GeoRAS software, which has been linked to the GIS software, the lines of the river and its banks, as well as the extract of all cross-sections, must be determined.
In order to simulate the geometry of the Gadar River downstream, and to evaluate the impacts of increasing discharge, due to the implementation of the water transfer project, several steps were taken into consideration, as follows:
Step 1: A triangular irregular network (TIN) was prepared using 1:5000 topographic maps along downstream of the Gadar River (38,500 m);
Step 2: In this step, 385 cross-sections were considered to generate the geometric characteristics of the Gadar River as input to HEC-RAS4.1. Model (Figure 3);
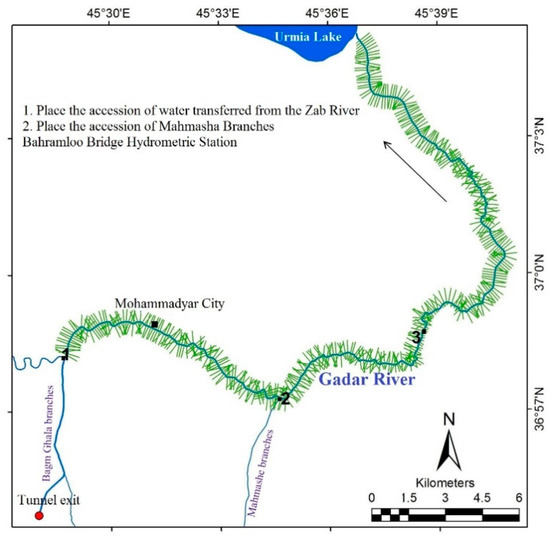
Figure 3.
Position cross-sections on the Gadar River in the study area.
Step 3: The extension of HEC-GeoRAS10.2 was used to simulate geometric characteristics of the Gadar River using ArcGIS10.2, including the following information: (i) drawing central lines of flow to define the direction of the river flow and to view its position in the HEC-RAS4.1 model; (ii) preparing the left and right banks of the river layers in order to separate the main channel from the riverside surfaces and displaying the public border of water flow; (iii) preparation of the cross-sectional layers, according to the location, status, and the width of the sections in this layer.
3.3. Determination of the Manning Roughness Coefficient
The selection of an appropriate value for Manning’s n is very significant to the accuracy of computed water surface profiles. The value of Manning’s n is highly variable and depends on a number of factors, including surface roughness, vegetation, channel irregularities, channel alignment, scour, and deposition, obstructions, size and shape of the channel, stage, and discharge, seasonal changes, temperature, and suspended material, and bedload.
For determining the Manning roughness coefficient, the method of USGS was used. Initially, the land use map of the Gadar River was extracted from the place of confluence of water delivered from the Zab river basin to Urmia Lake, with a length of 38.5 km, by the method “supervised” from Landsat satellite images 8 (ETM+), dated 6 November 2014. Then, according to the land use map and field operations, using existing tables and the Cowen method, the roughness coefficient of the main river and floodplain was estimated using the following equation obtained from US Army Corps of Engineers (USACE, 2012):
where is base value for n for a straight uniform, smooth channel in natural materials, is the value added to correct for surface irregularities, is the value for variations in the shape and size of the channel, is the value for obstructions, is the value for vegetation and flow conditions, and is the correction factor to account for meandering of the channel.
3.4. River Flow Simulation
HEC-RAS is numerical analysis software which provides details of flood profiles. The software is easily available and has precise calibration accuracy [43]. It is designed to perform one-dimensional hydraulic calculations for a full network of natural and constructed channels which can simulate flow conditions of steady and unsteady states. In steady-state, the HEC-RAS model calculates the water surface elevation (WSE) and velocity in cross-sections by solving the energy continuity equations and flow resistance (like the Manning coefficient). In this software, the simulation is based on a standard step-by-step numerical method to calculate the WSE between two periods. The method is based on the energy relationship that starts the calculations from one end of the range (supercritical flow at upstream to subcritical flow downstream) and continues the calculation from this section to the next. The size of the motion equation is also used in the place of narrowing and the place of changing in the flow regime (converting critical flow to supercritical flow and vice versa) [44]. The simulation process by HEC-RAS had the following steps:
Step 1. The schematic project of the Gadar river system was designed;
Step 2. The geometric data of cross-sections extracted from the topographic maps were imported as inputs into the HEC-RAS software. These data included (i) the river and reach information, (ii) the right and the left banks of the cross-sections, (iii) the distance of the main channel and of the left and the right banks from the downstream section, (iv) the roughness coefficient in the main channel and of the left and the right banks, (v) steady flow data and discharge with different return periods.
There are four boundary conditions—the rating curve, the normal depth, the critical depth, and the water surface level. Here, the boundary conditions in the upstream “normal depth” and in the downstream “critical flow” were chosen. For these types of boundary conditions, the energy grade-line should be calculated that will be used in the calculation of the normal depth. The normal depth will be calculated based on the slope. In this study, for the upstream boundary condition, since sufficient information about stream conditions and flow boundary conditions was not readily accessible, the flow on steady-state was simulated. That is, considering the constant flow, the slope of the river bed, water surface slope, and the energy grade-line were determined to be the same at 0.006, and flow as “subcritical” was introduced to the model. After entering all data, the simulation was carried out, and the water surface profiles were extracted.
In the final step, after modeling in HEC-RAS4.1, results were interred into ArcGIS.10.2, and using HEC-GeoRAS 10.2, flood zones and their areas were determined. HEC-GeoRAS was used to extract water surface profile data from HEC-RAS and to incorporate it into a floodplain map in GIS. The flooded areas were identified using the water surface data, and the digital elevation model (DEM) was created for the basin.
For analyzing the flow, the Gadar River discharge in three hydrometric stations was used (Table 3). Initially, the monthly discharge data of the Gadar River in a long-term period (1957–2014) were extracted, and the increase in the downstream flow of the Gadar River after implementation of the project was then calculated.
Table 3.
Gadar River watershed profile hydrometric stations in the study area.
After preparing the flood zoning map and land use map, these maps were overlaid in ArcGIS, and the areas of different land use that could be flooded after implementation of the water transfer project were identified. Figure 4 shows the framework of the methodology in the study area.
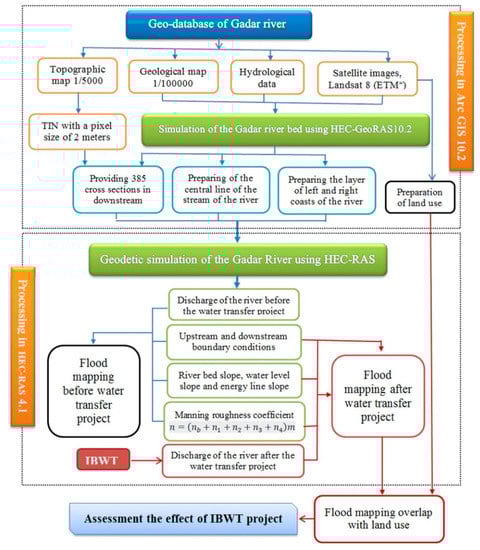
Figure 4.
The flowchart of the modeling process of the Inter-Basin Water Transfer (IBWT) project in the current study.
4. Results and Discussion
4.1. Estimating the Manning Roughness Coefficient
Since the roughness across the sections was not equal, cross-sections were divided into the main river and floodplain subsections. The final Manning’s roughness coefficient was determined by a weighted average of Manning’s roughness coefficient (Table 4). In order to evaluate the accuracy of the obtained coefficients, 10 and 20 percent of the original values were added to and subtracted from the coefficients, and the model was re-run. The differences in surface, depth, and speed were simulated. All results showed that the difference was less than 10%, so the coefficients were sufficiently valid.
Table 4.
Manning roughness coefficient values for downstream of the Gadar River based on the Cowen method.
4.2. Modeling the Water Discharge and Water Level of the Gadar River
Figure 5 shows the increase in water discharge of the water transfer project from the Zab river basin to Urmia Lake. This figure concludes that after the implementation of this project at the Bahramloo station, the most increase in discharge will be taken in May and April; however, the lowest ones will occur in August, September, and October. Table 4 shows the monthly percentage of increasing discharge after implementing the project (m3/s) in the 50-year period (1967 to 2017). The average discharge of the Gadar River in the 50-year period from 1967 to 2017 in the Bahramloo station was 355.47 mm3 per year [45]. After implementation of the project, the volume of discharge will be tripled and will reach 1166.77 mm3 per year (Table 5). Therefore, the channel transmission capacity of the Gadar River, from the interpolation of water transferred from Zab River to Urmia Lake, is highly necessary. Additionally, it indicates that the most increase in water discharge will be taken in drier months, such as September (6335%), August (2021%), and October (1752%). Meanwhile, the lowest values of increasing discharge will occur in April (277) and May (367.5) (Table 4 and Figure 5). This implies that the Gadar River in April and May had the highest water discharge before the project in comparison to other months. The obtained finding, an increasing in flow discharge at Destination River, has also been confirmed by some researchers in the world [39,46,47]. For example, Petitjean and Davies [47] reported that with transferring the water from Orange River to Great Fish River, the upper Great Fish River received a 500–800% increase in flow. Additionally, Stanford and Ward [46] also reported that a value of about 60% of water flow increased during water transferring from the Colorado River to the North Fork of the South Platte River via Roberts Tunnel.
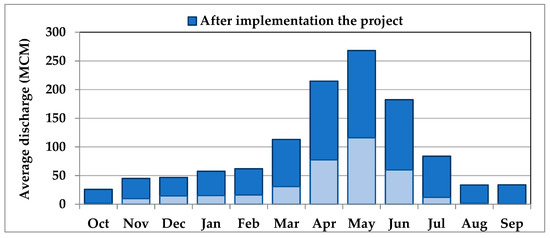
Figure 5.
Average discharge of the Gadar River during 57 years, before and after the implementation of the project [45].
Table 5.
Gadar river discharge in the 50-year period (1967 to 2017) and its discharge after the project (m3/s).
After preparing the cross-sections and discharge of Gadar River during two time periods—before and after the implementation of IBWT—and other information, such as the roughness coefficient in the main channel of the river and floodplain (Table 4), modeling was carried out. Studying the water rating curve in the Bahramloo hydro-station and places of the confluence of Mahmasha and Bagmqala branches to the Gadar River in different months showed that after the water transfer, the river water level will increase one meter above the average. For example, in May, before the implementation of the project at Bahramloo station the discharge was 43.31 m3/s, and the river water level was 1283.7 m. After water transmission, discharge of the river at this station will be 100.1 m3/s, and the water level will be 1284.6 m (Figure 6a). In July, while before the implementation of the project, the average river flow was very low at about 4.46 m3/s, after transferring water from the Zab River, this value will reach 31.3 m3/s, and the river will become a permanent stream (Figure 6b).
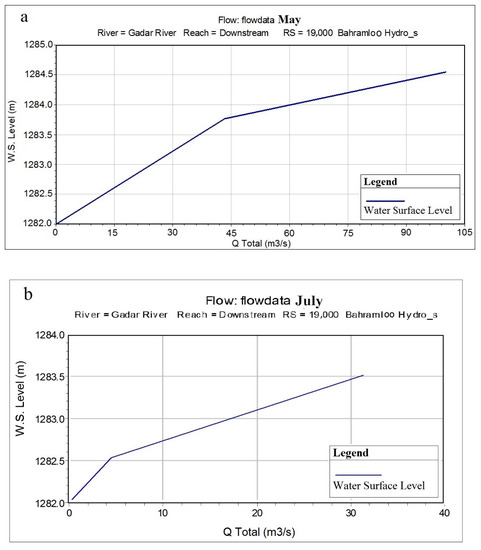
Figure 6.
Water rating curve at Bahramloo hydrometric station in May (a) and July (b).
Also, the comparison of the flow velocity between two periods—before and after the water transition at Bahramloo hydro-station in May—showed that the flow velocity before the project was 0.57 m/s, while after the implementation of the project and the outflow of water from the permanent bed, the flow velocity would decrease to 0.47 m/s. The reason is that before the implementation of the project, the water flowed in the permanent bed of the river, where the Manning’s roughness coefficient was about 0.062; however, after the implementation of the project and consequent increase in the volume of discharge, water will be transported to the floodplain, where the roughness coefficient is estimated to be about 0.124. After the implementation the project, the flow velocity will increase from 0.59 m/s to 0.76 m/s in the permanent bed (Figure 7).
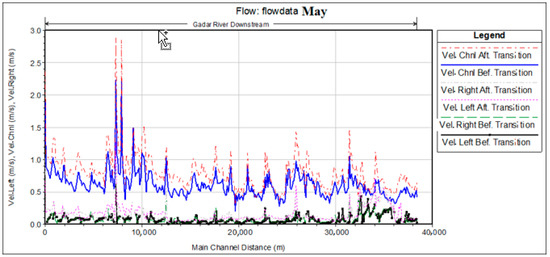
Figure 7.
Comparison of the flow velocity in different parts of the floodplain in periods before and after the water transition in May.
The results show that by increasing the water level of the Gadar River due to the transfer of water from the Zab basin, the highest development of the lateral flood zones will be in April, May, and June. Also, using the results of the simulation of the water level of the Gadar River in the periods before and after the water transfer, using the HEC-RAS4.1 software transferred to GIS and using the extension of HEC-GeoRAS 4.1, flood zones were determined for each period (Figure 8).
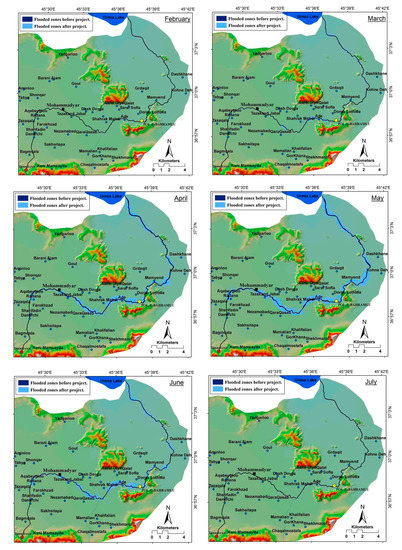
Figure 8.
Inundation maps after implementation of the IBWT from January to July.
According to the results, despite the increase in water level caused by inter-basin water transfer in the Gadar riverbed, from August to December, the channel will have the capacity for water transfer and will not threaten the surrounding areas. In February, with increasing discharge, the river flow will gradually outflow its permanent bed, and an area of 16.38 hectares of the floodplain will be inundated. This area will increase to 177.6 hectares in March and 952.21 hectares in April (Table 6). Most of the area would be flooded in May, so that about 1457 hectares of the floodplain will go underwater (Figure 8). Therefore, the prediction of this level of damage indicates that the implementation of this project is not consistent with UNESCO’s third criterion.
Table 6.
Inundation areas after increasing the Gadar River discharge, due to the IBWT Project (ha).
4.3. Consequences of Gadar River-Level Rise Due to IBWT
The compliance of floodplain with the land use map shows that Mahamadyar town and villages of Radana, Aqabyglo, Tazakand, Ade, and Mamend will be flooded in April, May, and June. Also, with a maximum spread of flood, approximately 1458.36 hectares of the surrounding lands of the river will be damaged, about 21% of it in the downstream includes barren land and salty land, and the rest consists of farmland, population centers, bushland, and grassland areas (Figure 9, Table 6).
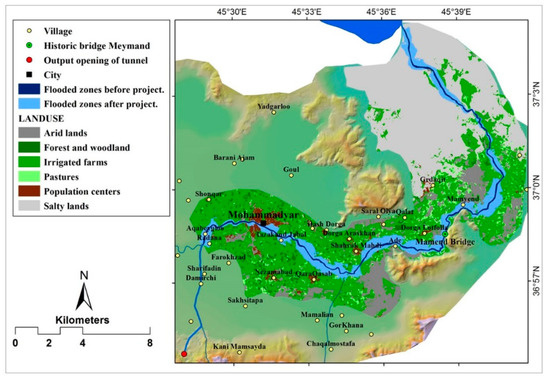
Figure 9.
Floodplain map covered by land use in May.
Evaluation of geological maps and field observations shows that almost all level plains of Naghada downstream of the Gadar River are composed of alluvial deposits and young terraces of the Quaternary period. These formations are basically sensitive and erodible to water erosion. Therefore, by increasing the power and area of water flows due to the transfer of water from the Zab River, terraces of the river are demolished and the resultant deposits are accumulated on the riverbed. The results of this part of the research corresponded with the results achieved by Du Plessis [20].
From Ade to Mamend villages, the southeast coast of the river is composed of massive limestone, and in terms of the topography, the area is hilly and overlooking the surrounding lowlands. This factor will be a barrier for lateral extension of the flood zone in this part of the basin. Another effective factor in reducing the transmission capacity of the Gadar river channels is the accumulation of sediment, debris, and waste products on the river bed, which reduces the cross-section of the river and increases its roughness coefficient especially, within Mahamadyar town and villages located on the riverbank of the Gadar river (Figure 10a,b). According to a cross-section of the Gadar River, the water level before the implementation of the water transfer project is about 1294.75 m; however, after it is predicted that this value will reach 1295.5 m at the transitional water junction from the Zab River to the Gadar River in May (Figure 10a). Moreover, Figure 10b shows the longitudinal section of the Gadar River downstream. As shown in this figure, the water level after implementation the project will arise about 1 m, along with the 38.5 km of downstream. It is concluded that most of the areas around the river will be inundated and flooded, which should be considered as one of the disadvantages of this water transfer project in the study area.
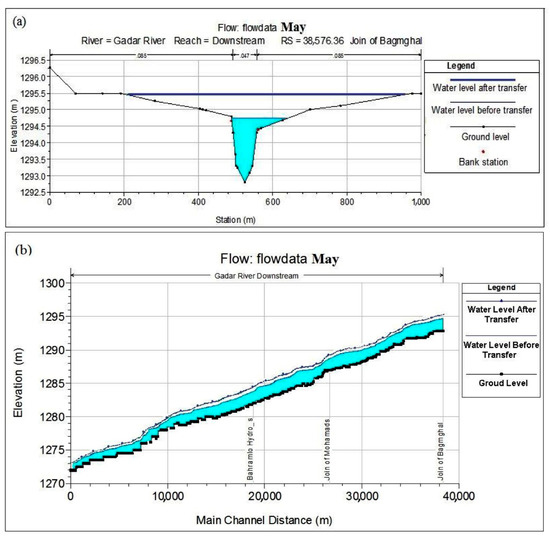
Figure 10.
Cross-section (a) and longitudinal section of downstream (b) and comparison of the flow levels before and after the project implementation at the transitional water junction from the Zab River to the Gadar River in May.
Another reason for the extension of the flood areas after the water transfer project in spring is the low height difference between the riverbed and the floodplain of the Gadar River. At some places, this difference is less than 2 m; therefore, in order to avoid extension of the flood, some infrastructures such as embankments have been built. It is noted that this structure, an embankment, could not prevent the flow of water from a permanent bed of the river by the April 2017 flood, and it was broken (Figure 11). This study predicted that an increase in the volume of discharge and rise of water level of the Gadar River, in addition to the destruction of farmlands, will cause the destruction of facilities that have been built in coasts of the river. A typical example of such destruction is the historical bridge of Mamend located between the Mamend and Dorga-e-Lotfollah villages. The floods on 23 March 2017 and 14 April 2017 (Figure 11) destroyed the Mamend historical bridge and the Gadar River embankment. Therefore, the findings indicate that with implementing an extended water transfer project, from the Zab to the Gadar River, infrastructures would be damaged, resulting in creating some environmental challenges that could be considered in future studies.
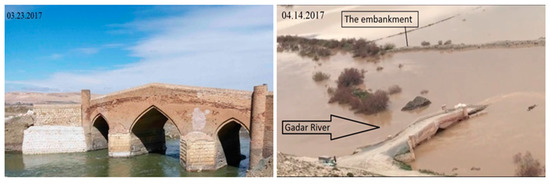
Figure 11.
Mamend historical bridge damaged due to flooding in the study area.
5. Conclusions
In IBWTPs, indicators such as efficiency, effectiveness, versatility, reversibility, and vulnerability should be adhered to by sustainable development principles for the project to be useful and effective in the long-term.
The results showed that after implementation of the project and an increase of 678.8 mm3 of water to the volume of the Gadar River, its discharge would triple and increase from 355.47 mm3 to 1034.27 mm3 per year. Therefore, the water level of the river rises 1 m above the average. Accordingly, the maximum development of the cross-flood zone would be in April, May, and June. Severe incision, erosion, and degradation of both the channel bed and banks would occur. In May, the peak flood zone will expand so that about 1458.36 hectares of adjacent lands (floodplain) will be submerged by water. Compliance of the floodplain with the land use map showed that Mahamadyar town and villages of Radana, Aqabyglo, Tazakand, Ade, and Mamend would be flooded in April, May, and June due to the low height difference between the permanent bed with floodplain and the lands surrounding the river.
Therefore, according to the results, the implementation of this project will cause environmental damages in the destination basin, and the net benefits resulting from its implementation will not be equitably divided between the destination and donor basins. As a result, UNESCO’s criteria 3 and 5 will be violated.
Water policy in Iran, in response to the increasing need for water, is based on “supply management” rather than “demand management”. This would not only not resolve the problem of water shortage in the destination basin, but would also generate more water, leading to further development of agriculture and industry. This results in more emigration of people to the area, and more need for water.
Therefore, transferring water from Zab River Basin to Urmia Lake is difficult and inefficient and is not a plausible eco-friendly solution, which in the past five decades has led Iran to instability of water in all sectors. In addition, common sense would suggest that for solving a problem, one should not generate new problems. In contrast, there are some effective alternative measures for IBWTs. The ultimate goal for solving the current issue of Urmia Lake and its watershed is a long-term integrated approach towards sustainability. Eco-friendly solutions are needed that contain a set of actions in parallel and under a greater plan of restoration. It is important to emphasize solutions that are integrated with all parts of society and where local participation can guarantee sustainable solutions in the long-term.
Finally, the modification efficiency and focus on demand management, as part of software management of water, are introduced as the only effective solution to solve the problem of water scarcity in the Urmia Lake Basin. In order to avoid disturbing the ecological balance of the Zab River Basin, as a result of a balance between the reciprocal effects of processes and forms during a long time, a fundamental change should be made in attitude and our perception of water. Comprehensive management of water as regional and national responsibilities should also be exercised with strong decision-making and planning. It might be essential to dredge the accumulated sediment, debris, and waste downstream of the Gadar River in order to increase the cross-sectional area and decrease the roughness coefficient of the river. Otherwise, the transfer of water can also be evaluated through artificial channels. It is strongly suggested to re-evaluate the project of water transfer from the Zab River to Urmia Lake within a framework of geomorphological considerations of the system perspective, in addition to an emphasis on the environmental management and quality of water resources. Finally, this study aimed to help the local government and other decision-makers to better understand the adverse effects of such IBWTPs on the physical and hydrodynamic processes in the Gadar River if they are implemented without caution and primary assessment. These findings can help water resources engineers to consider this effective when implementing an inter basin water transfer project (IBWTP).
Author Contributions
D.T.B., D.T.A., E.G., N.A.-A., S.K., K.C., A.A., and B.T.P. contributed equally to the work. D.T.A., and E.G. collected field data and conducted the water transfer analysis. D.T.A., E.G., N.A.-A., S.K., and B.T.P. wrote the manuscript. D.T.B., N.A.-A., and B.T.P. provided critical comments in planning this paper and edited the manuscript. All authors have read and agreed to the published version of the manuscript.
Funding
This research received no external funding.
Conflicts of Interest
The authors declare no conflict of interest.
References
- Zhuang, W. Eco-environmental impact of inter-basin water transfer projects: A review. Environ. Sci. Pollut. Res. 2016, 23, 12867–12879. [Google Scholar] [CrossRef]
- Zhao, Z.-Y.; Zuo, J.; Zillante, G. Transformation of water resource management: A case study of the south-to-north water diversion project. J. Clean. Prod. 2017, 163, 136–145. [Google Scholar] [CrossRef]
- Lafreniere, K.C.; Deshpande, S.; Bjornlund, H.; Hunter, M.G. Extending stakeholder theory to promote resource management initiatives to key stakeholders: A case study of water transfers in Alberta, Canada. J. Environ. Manag. 2013, 129, 81–91. [Google Scholar] [CrossRef]
- Soulsby, C.; Gibbons, C.; Robins, T. Inter-basin water transfers and drought management in the kielder/derwent system. Water Environ. J. 1999, 13, 213–223. [Google Scholar] [CrossRef]
- Quan, Y.; Wang, C.; Yan, Y.; Wu, G.; Zhang, H. Impact of inter-basin water transfer projects on regional ecological security from a telecoupling perspective. Sustainability 2016, 8, 162. [Google Scholar] [CrossRef]
- Xiao, L. Flash Floods in Arid and Semi-Arid Zones. International Hydrological Program, Technical Documents in Hydrology no. 23; UNESCO: Paris, France, 1999. [Google Scholar]
- Hoseinpour, M.; Fakheri Fard, A.; Naghili, R. Death of urmia lake, a silent disaster investigating causes, results and solutions of urmia lake drying. In Proceedings of the 1st International Applied Geological Congress, Department of Geology, Islamic Azad University, Islamic Azad University-Mashad Branch, Iran, 26–28 April 2010. [Google Scholar]
- Ghorbani-Aghdam, M.; Dinpashoh, Y.; Mostafaeipour, A. Application of factor analysis in defining drought prone areas in lake urmia basin. Nat. Hazards 2013, 69, 267–277. [Google Scholar] [CrossRef]
- Khatami, S.; Berndtsson, R. Urmia lake watershed restoration in iran: Short-and long-term perspectives. In Proceedings of the 6th International Perspective on Water Resources & the Environment (IPWE), Izmir, Turkey, 7–9 January 2013. [Google Scholar]
- Zeng, Q.; Qin, L.; Li, X. The potential impact of an inter-basin water transfer project on nutrients (nitrogen and phosphorous) and chlorophyll a of the receiving water system. Sci. Total Environ. 2015, 536, 675–686. [Google Scholar] [CrossRef]
- Gohari, A.; Eslamian, S.; Mirchi, A.; Abedi-Koupaei, J.; Bavani, A.M.; Madani, K. Water transfer as a solution to water shortage: A fix that can backfire. J. Hydrol. 2013, 491, 23–39. [Google Scholar] [CrossRef]
- Tang, C.; Yi, Y.; Yang, Z.; Cheng, X. Water pollution risk simulation and prediction in the main canal of the south-to-north water transfer project. J. Hydrol. 2014, 519, 2111–2120. [Google Scholar] [CrossRef]
- Zhang, J.-Y.; Wang, L.-C. Assessment of water resource security in chongqing city of china: What has been done and what remains to be done? Nat. Hazards 2015, 75, 2751–2772. [Google Scholar] [CrossRef]
- Yan, D.; Wang, H.; Li, H.; Wang, G.; Qin, T.; Wang, D.; Wang, L. Quantitative analysis on the environmental impact of large-scale water transfer project on water resource area in a changing environment. Hydrol. Earth Syst. Sci. 2012, 16, 2685–2702. [Google Scholar] [CrossRef]
- Li, S. China’s huge investment on water facilities: An effective adaptation to climate change, natural disasters, and food security. Nat. Hazards 2012, 61, 1473–1475. [Google Scholar] [CrossRef]
- Wang, L.; Ma, C. A study on the environmental geology of the middle route project of the south–north water transfer. Eng. Geol. 1999, 51, 153–165. [Google Scholar] [CrossRef]
- Shao, X.; Wang, H.; Wang, Z. Interbasin transfer projects and their implications: A china case study. Int. J. River Basin Manag. 2003, 1, 5–14. [Google Scholar] [CrossRef]
- Davies, B.R.; Thoms, M.; Meador, M. An assessment of the ecological impacts of inter-basin water transfers, and their threats to river basin integrity and conservation. Aquat. Conserv. Mar. Freshw. Ecosyst. 1992, 2, 325–349. [Google Scholar] [CrossRef]
- Brandt, S.A. Classification of geomorphological effects downstream of dams. Catena 2000, 40, 375–401. [Google Scholar] [CrossRef]
- Du Plessis, A.J.E. The Response of the Two Interrelated River Components, Geomorphology and Riparian Vegetation, to Interbasin Water Transfers in the Orange-Fish-Sundays River Interbasin Transfer Scheme. Available online: https://pdfs.semanticscholar.org/dd35/3c509bfd31f958d763bd243b8c3a72d38291.pdf (accessed on 23 January 2000).
- Worakijthamrong, S.; Cluckie, I. Groundwater–river interaction and management in the context of inter-basin transfers. Environ. Earth Sci. 2013, 70, 2039–2045. [Google Scholar] [CrossRef]
- Ahmadlou, M.; Karimi, M.; Alizadeh, S.; Shirzadi, A.; Parvinnejhad, D.; Shahabi, H.; Panahi, M. Flood susceptibility assessment using integration of adaptive network-based fuzzy inference system (anfis) and biogeography-based optimization (bbo) and bat algorithms (ba). Geocarto Int. 2019, 34, 1252–1272. [Google Scholar] [CrossRef]
- Khosravi, K.; Shahabi, H.; Pham, B.T.; Adamowski, J.; Shirzadi, A.; Pradhan, B.; Dou, J.; Ly, H.-B.; Gróf, G.; Ho, H.L. A comparative assessment of flood susceptibility modeling using multi-criteria decision-making analysis and machine learning methods. J. Hydrol. 2019, 573, 311–323. [Google Scholar] [CrossRef]
- Tien Bui, D.; Khosravi, K.; Shahabi, H.; Daggupati, P.; Adamowski, J.F.; Melesse, A.M.; Thai Pham, B.; Pourghasemi, H.R.; Mahmoudi, M.; Bahrami, S. Flood spatial modeling in northern iran using remote sensing and gis: A comparison between evidential belief functions and its ensemble with a multivariate logistic regression model. Remote Sens. 2019, 11, 1589. [Google Scholar] [CrossRef]
- Miraki, S.; Zanganeh, S.H.; Chapi, K.; Singh, V.P.; Shirzadi, A.; Shahabi, H.; Pham, B.T. Mapping groundwater potential using a novel hybrid intelligence approach. Water Resour. Manag. 2019, 33, 281–302. [Google Scholar] [CrossRef]
- Wang, Y.; Hong, H.; Chen, W.; Li, S.; Panahi, M.; Khosravi, K.; Shirzadi, A.; Shahabi, H.; Panahi, S.; Costache, R. Flood susceptibility mapping in dingnan county (china) using adaptive neuro-fuzzy inference system with biogeography based optimization and imperialistic competitive algorithm. J. Environ. Manag. 2019, 247, 712–729. [Google Scholar] [CrossRef]
- Chen, W.; Hong, H.; Li, S.; Shahabi, H.; Wang, Y.; Wang, X.; Ahmad, B.B. Flood susceptibility modelling using novel hybrid approach of reduced-error pruning trees with bagging and random subspace ensembles. J. Hydrol. 2019, 575, 864–873. [Google Scholar] [CrossRef]
- Bui, D.T.; Panahi, M.; Shahabi, H.; Singh, V.P.; Shirzadi, A.; Chapi, K.; Khosravi, K.; Chen, W.; Panahi, S.; Li, S. Novel hybrid evolutionary algorithms for spatial prediction of floods. Sci. Rep. 2018, 8, 15364. [Google Scholar] [CrossRef]
- Shafizadeh-Moghadam, H.; Valavi, R.; Shahabi, H.; Chapi, K.; Shirzadi, A. Novel forecasting approaches using combination of machine learning and statistical models for flood susceptibility mapping. J. Environ. Manag. 2018, 217, 1–11. [Google Scholar] [CrossRef]
- Khosravi, K.; Pham, B.T.; Chapi, K.; Shirzadi, A.; Shahabi, H.; Revhaug, I.; Prakash, I.; Bui, D.T. A comparative assessment of decision trees algorithms for flash flood susceptibility modeling at haraz watershed, northern iran. Sci. Total Environ. 2018, 627, 744–755. [Google Scholar] [CrossRef]
- Chapi, K.; Singh, V.P.; Shirzadi, A.; Shahabi, H.; Bui, D.T.; Pham, B.T.; Khosravi, K. A novel hybrid artificial intelligence approach for flood susceptibility assessment. Environ. Model. Softw. 2017, 95, 229–245. [Google Scholar] [CrossRef]
- Rahmati, O.; Choubin, B.; Fathabadi, A.; Coulon, F.; Soltani, E.; Shahabi, H.; Mollaefar, E.; Tiefenbacher, J.; Cipullo, S.; Ahmad, B.B. Predicting uncertainty of machine learning models for modelling nitrate pollution of groundwater using quantile regression and uneec methods. Sci. Total Environ. 2019, 688, 855–866. [Google Scholar] [CrossRef]
- Chen, W.; Pradhan, B.; Li, S.; Shahabi, H.; Rizeei, H.M.; Hou, E.; Wang, S. Novel hybrid integration approach of bagging-based fisher’s linear discriminant function for groundwater potential analysis. Nat. Resour. Res. 2019, 28, 1239–1258. [Google Scholar] [CrossRef]
- Rahmati, O.; Naghibi, S.A.; Shahabi, H.; Bui, D.T.; Pradhan, B.; Azareh, A.; Rafiei-Sardooi, E.; Samani, A.N.; Melesse, A.M. Groundwater spring potential modelling: Comprising the capability and robustness of three different modeling approaches. J. Hydrol. 2018, 565, 248–261. [Google Scholar] [CrossRef]
- McCuen, R.H. Modeling Hydrologic Change: Statistical Methods; CRC Press: Boca Raton, FL, USA, 2016. [Google Scholar]
- Tien Bui, D.; Khosravi, K.; Li, S.; Shahabi, H.; Panahi, M.; Singh, V.; Chapi, K.; Shirzadi, A.; Panahi, S.; Chen, W. New hybrids of anfis with several optimization algorithms for flood susceptibility modeling. Water 2018, 10, 1210. [Google Scholar] [CrossRef]
- Hong, H.; Panahi, M.; Shirzadi, A.; Ma, T.; Liu, J.; Zhu, A.-X.; Chen, W.; Kougias, I.; Kazakis, N. Flood susceptibility assessment in hengfeng area coupling adaptive neuro-fuzzy inference system with genetic algorithm and differential evolution. Sci. Total Environ. 2018, 621, 1124–1141. [Google Scholar] [CrossRef] [PubMed]
- Regional Water Company of West Azarbaijan. Report of Inter-Basin Water Transfer to Urmia Lake. 2017, pp. 33–52. Available online: https://en.mehrnews.com/news/136350/No-water-transfer-to-Lake-Urmia-DOE-chief (accessed on 25 February 2017).
- Tabari, M.M.R.; Yazdi, A. Conjunctive use of surface and groundwater with inter-basin transfer approach: Case study piranshahr. Water Resour. Manag. 2014, 28, 1887–1906. [Google Scholar] [CrossRef]
- Merufinia, E.; Aram, A.; Esmaeili, F. Saving the lake urmia: From slogan to reality (challenges and solutions). Bull. Environ. Pharmacol. Life Sci. 2014, 3, 277–288. [Google Scholar]
- OMRAN MAROON Engineers Company. Construction of the Kanisib Reservoir Dam and Associated Facilities. Available online: http://www.omran-maroon.com/ (accessed on 31 December 2019).
- Islamic Republic News Agency. Disaster in Water Resources of Urmia Lake. Available online: https://www.irna.ir/news (accessed on 15 October 2017).
- Kute, S.; Kakad, S.; Bhoye, V.; Walunj, A. Flood modeling of river godavari using hec-ras. Int. J. Res. Eng. Technol. 2014, 3, 81–87. [Google Scholar]
- ShahiriParsa, A.; Heydari, M.; Sadeghian, M.S.; Moharrampour, M. Flood Zoning Simulation By Hec-RAS Model (Case Study: Johor River-Kota Tinggi Region). Available online: https://www.researchgate.net/publication/280627215_Flood_Zoning_Simulation_by_HEC-RAS_Model_Case_Study_Johor_River-Kota_Tinggi_Region (accessed on 10 November 2013).
- Emdadi, A.; Emami, Y.; Zenouzi, M.; Lak, A.; Panahirad, B.; Lotfi, A.; Lak, F.; Kowalski, G.J. Potential of electricity generation by the salinity gradient energy conversion technologies in the system of urmia lake-gadar chay river. In Proceedings of the ASME 2014 8th International Conference on Energy Sustainability, Boston, MA, USA, 30 June–2 July 2014; p. V001T005A001. [Google Scholar]
- Stanford, J.A.; Ward, J.V. Stream regulation in north america. In The Ecology of Regulated Streams; Springer: Berlin/Heidelberg, Germany, 1979; pp. 215–236. [Google Scholar]
- Petitjean, B. Ecological impacts of inter-basin water transfers: Some case studies, research requirements and assessment procedures in Southern Africa. S. Afr. J. Sci. 1988, 84, 819–828. [Google Scholar]
© 2020 by the authors. Licensee MDPI, Basel, Switzerland. This article is an open access article distributed under the terms and conditions of the Creative Commons Attribution (CC BY) license (http://creativecommons.org/licenses/by/4.0/).