Article

Ancient Environmental Preference and the Site Selection Pattern Based on the Edge Effect and Network Structure in An Ecosystem

1
Chinese Academy of Sciences, Aerospace Information Research Institute, Beijing 100101, China
2
University of Chinese Academy of Sciences, Beijing 100049, China
3
School of Information and Communication Engineering, Hainan University, Haikou 050024, China
4
Key Lab of Lunar Science and Deep-Exploration, Chinese Academy of Sciences, National Astronomical Observatories, Beijing 100101, China
5
School of Management, Guizhou University, Guiyang 550025, China
*
Author to whom correspondence should be addressed.
Sustainability 2020, 12(1), 328; https://doi.org/10.3390/su12010328
Submission received: 22 November 2019 / Revised: 23 December 2019 / Accepted: 27 December 2019 / Published: 31 December 2019

Abstract

:
Archaeological sites are facing serious threats from environmental changes in the background of urban sprawl. More efforts are needed to enhance the cognition of human–environment interactions for better conservation. Under the traditional geomantic view, the environmental preference involved was presented to guide ancient life. In this study, we analyzed the edge effect and network structure of two periods in an ecological transition zone where the ancient sites were located. From the cases of Gouzhang and Yinxian, the separability of edge intensity indicated the different site selection patterns because of the discrepancy of patch fragmentation and ecological structure. Additionally, the different trends of the edge effect were thought to be related to the complexity of the ecological network. Besides that, the ancient cities located in or around the high-centrality terrain in the network of closed space could have provided the convenience of accessing living materials from early ecosystems. In practice, the comprehensive methods based on geomantic and ecological analysis proved effective when used to explore possible areas of the undiscovered archaeological sites. What is more important is that traditional environmental perceptions could be integrated into a scientific system of the ecological landscape and contribute more to archaeological research and the study of ancient culture.

1. Introduction

Archaeological sites provide a unique source for recognizing human–environment interactions and the ecosystems affected by differing degrees of human impact at a wide variety of temporal and spatial scales and thus both reconstruct past environmental conditions and reveal human behavior [1]. As early as 4000 BC, the ancient humans from the Banpo site had primary thoughts of utilizing the environment according to their residential locations along Weihe River [2]. With the increase of urban sprawl worldwide, archaeological sites are facing more threats from the shifting relationship between culture, climate, and land use changes [3], meaning that we need to re-recognize the various archaeological information and their cultural connotation under the human–environment relationship. Through the study of site selection pattern of archaeological sites, we can learn more about ancient environmental view and behavior patterns, which will help us with further archaeological research and in the conservation of cultural heritage.
Ancients’ environmental preference was to select a site following basic principles, of which geomancy was one of the most classical theories in ancient life [4,5]. Geomancy claims to utilize nature to harmonize individuals or their communities at scales ranging from vast landscapes to houses and is indicated as the method and practice employed to guide site selection of a settlement, city, or tomb according to the surrounding natural environment [6,7,8,9,10]. It is necessary for us to learn this kind of site selection pattern in archaeological study. In the 1950s, this theory began to formally enter into the perspective of modern science. As a milestone event, Subai introduced geomancy into an archaeological study of the tombs from the Song Dynasty in the northern Paisha Town [11]. Thereafter, analysis based on geomancy rules gained extreme attention from modern scholars for its hidden scientific value [12,13,14,15]. Magli [16] discussed the cultural links between topography and traditional geomancy for studying royal mausoleums. Moreover, Gui [17] studied cultural landscape changes and site selection under geomantic principles in the Dongcun settlement of the Taihu Basin. Yang [18] further emphasized the function of geomantic evaluation in landscape and human–land relations. The significance of landscape ecology analysis was to explain the ancient environmental preference from geomantic theory, and it has facilitated some valuable research [19,20,21,22,23]. This was also the point of view we focused on in our study.
The ancient view on the geomantic environment is essentially related to the ecological landscape. Typical ecological characteristics are shown in the edge effect in ecological transition zones and the interaction of ecological units in an ecosystem. The edge effect plays a decisive role in the formation of ecological structure and dynamics of ecological patches. In a variety of applications, it has been used in the fields of microclimate, plant diversity, and bird communities [24,25,26]. In particular, in forest ecosystems, the impact of the edge effect has received universal attention [27]. Zhou et al. [28] focused on the boundary sensitivity, which is associated with forest ecotone types and exhibits remarkable habit heterogeneity at different scales. Yuan [29] and Chen [30] studied the coupling network of forest landscape patches and analyzed the characteristics of the edge effect in major forestry landscapes mixed with the arborous layer, shrub layer, and herbaceous layer. Although the edge effect and its scale problem have rarely been considered in spatial archaeology studies, it cannot be ignored in practice. In our study of edge effect, we did not focus on biocenosis specifically but put emphasis on the syntagmatic relations of ecological patch to look for site selection patterns. Therefore, the calculation of edge effect was different from previous studies. However, we still considered the factors of shape and size of patches and the quantified form in the established model, as mentioned in some other studies [31,32].
For the other ecological characteristics, the internal relations of different units in the ecological network was proposed in cultural landscape analysis in this study. The ecological network provides an operational methodology in the practices of studying ecological structure that relies on the concept of connectivity included in landscape graphs [33,34]. In recent years, there has been a rapid increase of studies that advocate network analysis to ecologically manage landscapes that suffer from fragmentation and loss of connection [35]. The focus is on the aspects of establishment and evaluation of networks. For example, habitat networks were constructed to assess how climatic variability influences potential connectivity for water organisms in the Murray Darling Basin of Australia by Robbi et al. [36]. Andrea et al. [37] proposed one methodology to build a network with the patch’s area as the weight index of nodes for landscape planning in the peri-urban and urban areas of the town of Nuoro (Italy). When evaluating the network, connectivity metrics of landscape graphs have usually been applied to reflect a basic form of interaction between species and their environment [38,39,40]. Beyond ecological processes and social issues, network analysis is also meaningful in terms of cultural landscape perspectives. For instance, Agnieszka et al. [41] studied sustainability in terms of a cultural landscape service located in Malopolska Province (Poland) by quantitative assessment and qualitative categorization based on landscape diversity and connectivity. In fact, successful cases like this are rarely presented, except for the most qualitative discussions about network characteristics which are difficult to explain the internal mechanism of ecological structure [42,43,44]. In this study, we tried to build ecological networks to quantify the site selection pattern based on the connections between the ecological landscape and geomantic environment.
By both the edge effect and network structure in the ecosystem, the ancient site selection pattern and the scientific basis could be discussed according to the discovered archaeological sites in the study area. Multi-source remote sensing data in two times phases were used to reflect the changes of ecological structure. It could help us to speculate the major ecological structure and reveal the human–environment relationship in ancient times.

2. Methodology

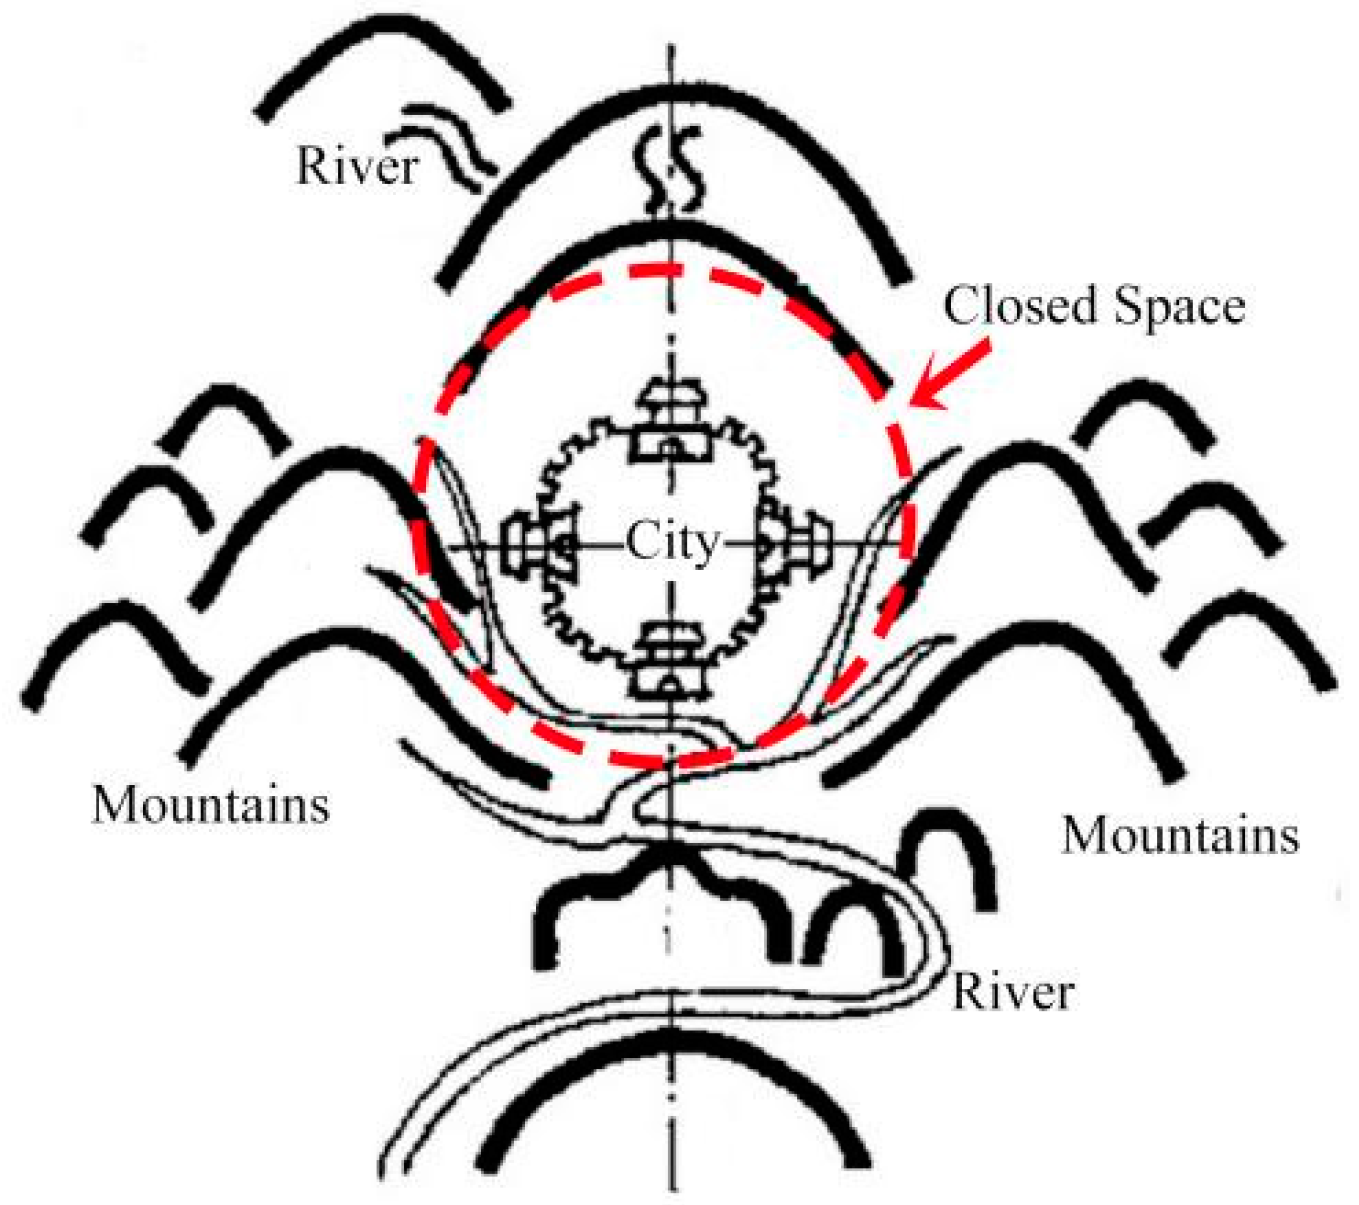
2.1. Geomantic Environment

The geomancy derived from traditional environmental preferences leads to a highly developed cultural synthesis between the social and natural environment to a certain degree and emphasizes finding auspicious site locations with a favorable ecology and aesthetic perception [9]. Its continuing popularity in practice is used to promote harmonizing with ecological equilibrium [45,46,47]. This theory is useful to study ancient site selection patterns. However, we have to emphasize that we do not utilize the whole complex theoretical system of geomancy but are only concerned with the method of choosing a good environmental layout in relation to mountains and river.
Mountains, which embrace a site (usually with a river flowing through them), have been inspected to identify an enclosed space for living and justify whether they are beneficial for settlement development [48,49]. The optimal position of a mountain group is presented by Shang [50] as in Figure 1. Mountains behind the site stretch from near to far along the central axis. On the left and right sides, the mountains protect the site area. There are still mountains guarding the exit out of the closed space across the river in a certain distance. This spatial arrangement of mountains can provide a secure and stable environment. Besides that, it also blocks the cold monsoon from the north in winter and gain more warm sunlight in the south. It is conducive to the formation of a warm and humid microclimate. Moreover, the river can be examined to locate a relatively optimum position. A water city is an ideal site location embraced by a river on three sides. This situation is generalized as three kinds of positional relations, as in Figure 2. The inner side of the river bend, which is called the embraced side, is preferred, in contrast to the reserve side [51]. We can conclude that an auspicious water position has great influence on the residential area for the convenience of water supply and traffic [52,53]. It is also beneficial for forming a closed area for defensive purposes and a moderate microclimate in local environments [54,55]. Additionally, in an ideal landscape, forests are routinely considered to be involved in biological diversity, ecosystem service, and spiritual expectations [6,56,57]. Especially in this study, bamboo forest, which covers almost the whole mountainous area, is the main ecological type in the geomantic environment [58,59].
In conclusion, the ideal location of the closed space consisting of mountains and a river lies back on a mountain and faces water toward the south [60]. It is the optimal geomantic environment appreciated by ancient peoples [61,62]. This environmental preference is of universal significance for the application of geomantic theory. We aimed to further study the ecological basis of site selection behind this environmental view and the behavior patterns in ancient times.

2.2. Edge Effect

The regular law of site selection was mostly studied based on the geospatial distribution of archaeological sites [63]. For example, many researchers focused on the slope, aspect, proximity, etc. [64,65]. However, selecting living environments was more complicated for ancient peoples. The edge effect was rarely considered by researchers. It is widely believed that the differences and interactions of ecological variables in transition zones of two or several different ecosystems may lead to the gradients starting at patch borders and proceeding along the edges [66]. The edge effect is a conspicuous consequence of the interactions between ecological units. The shape and size indices of a fragment patch, as well as the population structure, are widely used variables in edge effect calculations conducted by quantitative measurement [25,67,68]. In our study, we tried to organize the effective variables to describe the edge intensity in the locations of archaeological sites in the ecological transition zone. Even though we could not access the missing or not preserved sites, we focused on the general analysis of the known archaeological sites.
In the square buffer zone that is built with the edge width as its size for an archaeological object, the perimeter of each patch inside represents the actual contact interface used to exchange materials or energy with its neighboring patches. In this study, the fractal dimension index (FRAC) was used to reflect the edge complexity of each patch. In addition, the weights of different ecotypes (W) were defined according to their contributions to the environmental structure and resource utilization in terms of the nature status in ancient times. With the descending importance of forest, water, farmland, bare land, and settlement, the weights were set to 2.00, 1.75, 1.50, 1.25, and 1.00, respectively. To quantify the edge effect, the edge intensity was expressed as follows:
E = j = 1 n P j L F R A C j W j ,
where j represents one of the independent patches and n is the total number of patches in the square buffer zone. E means the edge intensity in a square buffer zone whose total length of the four edges is indicated with L, and the perimeter of an independent patch inside is Pj. Pj/L refers to the relative edge size. FRACj and Wj are the multiplicative factors of each patch.
Edge effects usually show significant variations at different spatial scales [30,69]. They are influenced by the transferring patch number and ecological constitution, as well as the interface size, shape complexity, and the weight of each component patch. Therefore, the scale problem is non-negligible for edge effect analysis. In this study, six edge widths of 100, 200, 400, 600, 800, and 1000 meters were selected to evaluate the changes of edge intensity. We aimed to test scale validity for analyzing the environmental preference of ancient sites. What was more important for us was to explain the site selection pattern based on the discrepancy of the edge effect in different scales among the archaeological sites in ecological transition zone.

2.3. Ecological Network

The ecological network can be built based on the interactive relationship between ecological patches that serve as network nodes connected by links that indicate the potential exchange of materials and energy between neighboring patches within an organism [35]. In network analysis, we use network properties and centrality measures to reflect the accessibility and the flow of energy, matter, or species to patches where archaeological sites are located. The general network is evaluated with circuitry (α), the node/line ratio (β), and network connectivity (γ), as presented in Table 1. The well-structured network represents the less possibility of ecological changes and the variation of edge effect. It can be used to measure the general stability in the geomantic environment of closed space. In fact, the centrality importance contributes more to the specific site selection pattern based on the analysis of every patch in the network.
The centrality metrics are popular indices used to describe the importance of local patches in a network, which mostly include the degree, betweenness, and closeness [37,73,74]. In this study, we wanted to assess the comprehensive importance of each patch in the ecosystem. Therefore, the centrality importance (CI) index was defined as
C I = B e + C l ,
where the Be (betweenness), characterizing the importance of a patch by the number of times the information passes through the shortest path between two nodes, and Cl (closeness), describing the central rank of a patch by measuring the total sum of the minimum distances from the given node to all other nodes, are deemed to have the same importance, with weight coefficients of 1. The relationship between the locations of ancient cities and high CI of a patch was constructed in this study to indicate superior status for getting more resources in network. It may represent one aspect of ancient site selection patterns.

2.4. Materials

In this study, Landsat images and the Digital Elevation Model (DEM) were used for analyzing the ecological landscape. Google Earth provided higher resolutions to recognize the local environmental features and help extract the historical environmental features in the Corona images. The remote sensing data are listed in Table 2. Because the city outskirts where the archaeological sites are located were less affected by urban sprawl before 1995 and have changed a lot under urbanization in recent years, as referred to in some other studies [75,76], we chose the phases of 1995 and 2017 for comparison. It is important to note that these images cannot reflect all the ecological information in the past. However, the multi-source remote sensing images in early time and variance analysis of two periods can help us learn the ecological characteristics in history combined with some documentaries.

3. Study Background

From 7 to 5 ka B.C., the plain of Ningbo was rarely influenced by marine corrosion except for three rising sea level events caused by the combined effects of regional tectonic subsidence and climate changes [77]. The relative variation of sea level did not cause cultural decline for a long period. The local culture flourished again with the retreat of the coastline, according to the historical changes map of Hangzhou Bay [78]. This area had been a continent of lakes for a long time after that, inferred by the strata information and the changes of paleovegetation composition [79]. Ningbo, with an age-old agricultural civilization, has been proven to have originated as early as 5.8 ka B.C. [80]. The area with a network of rivers and a humid subtropical monsoon climate provided a suitable environment for the development of civilization. This is supported by the evidence of archaeological excavations and the site distribution in early times [81].
At present, Ningbo a fast-developing city that is experiencing the universal problems of urban sprawl and population growth, which generate challenges for the conservation of archaeological sites, especially the early relics of important historical value. As shown in Figure 3a, all the archaeological sites are located in the transition area between the mountainous area and plain on the outskirts of Ningbo in Zhejiang Province. According to the FAO 1990 system of soil classification, all the sites are mainly on the boundaries of Humic Acrisols (ACu) and Cumulic Anthrosols (ATc), as in Figure 3b. The soil is the synthesis of physical, chemical, and biological characteristics. It is closely related to the ecological service system and human activities. Especially the presence of anthrosoils can be used to detect historical human habitation. It was formed due to long-term human activity, such as irrigation or anthropogenic organic matter [82,83]. Humus is the colloidal part of soil organic material with the nutrients and water molecules retained between cosmids [84]. The two types have a significant effect on promoting the formation of an ecosystem and settlement by ancients. Besides that, elevation and proximity to a river are also the important factors for ancient living (Figure 3c,d). Most of sites distribute in the gentle slope of the piedmont area or the river terrace with a certain altitude to avoid flood risk. At the same time, the proximity to rivers ensured adequate water supply for agricultural irrigation and daily life. These integrated demands for living environment causes that the archaeological sites almost locate in the transition of ecological environments. There are 158 archaeological sites from the Han–Jin Dynasties (206 B.C.–420 A.D.) located in this study area. Only three ancient cities named Gouzhang, Yinxian, and Maoxian (currently undiscovered) have been documented as the earliest cities in the basins of Yuyao River, Yinjiang River, and Yongjiang River, respectively [85]. The other sites are ancient tombs. This research focused on the site selection pattern of the three ancient cities compared with other tomb sites at the same time.
The ancient city of Gouzhang was discovered in 2004–2012. Its surface is covered with farmland and settlement (see Figure 4). After archaeological excavation, the profile was found to be an irregular rectangle with a 1200 m perimeter and 100,000 m2 area, whose culture accumulation was from the Warring States Time (475–221 B.C.) to Jin Dynasty (265–420 A.D.) [86,87]. The location of Gouzhang is circled by the Yuyao River in the south with mountains in the east and west. Another ancient city of Yinxian was discovered in 2015~2018. It was inhabited for nearly more than 800 years from the Qin Dynasty (221–206 B.C.) to early Sui Dynasty (589 A.D.) [88]. Yinxian is situated on the mountain of less than a 50 m height in the transition zone between the mountainous area and residential area, with encircling rivers. The site’s perimeter is about 760 m, and area is more than 38,000 m2. Its internal residential zone is mainly located in the mountain (see Figure 5). The Yinxian site has convenient transportation in terms of both land and water ways because it is next to the Ningbo Plain in the north and connects to the Xiangshan Port in the south. In terms of the last undiscovered city with the longest documented history, ancient Maoxian should be situated between the east of Maoshan Mountain and west of Ashoka Mountain [85,89], according to the records, which are mostly from the Song–Ming Dynasties (960–1644 A.D.). An ecological structure analysis was applied to discuss the possibility of exploring its site location under the impact of urban sprawl. Because of the ubiquitous ecological transition zone, the methodological application can also be tested in other areas.

4. Results and Discussion

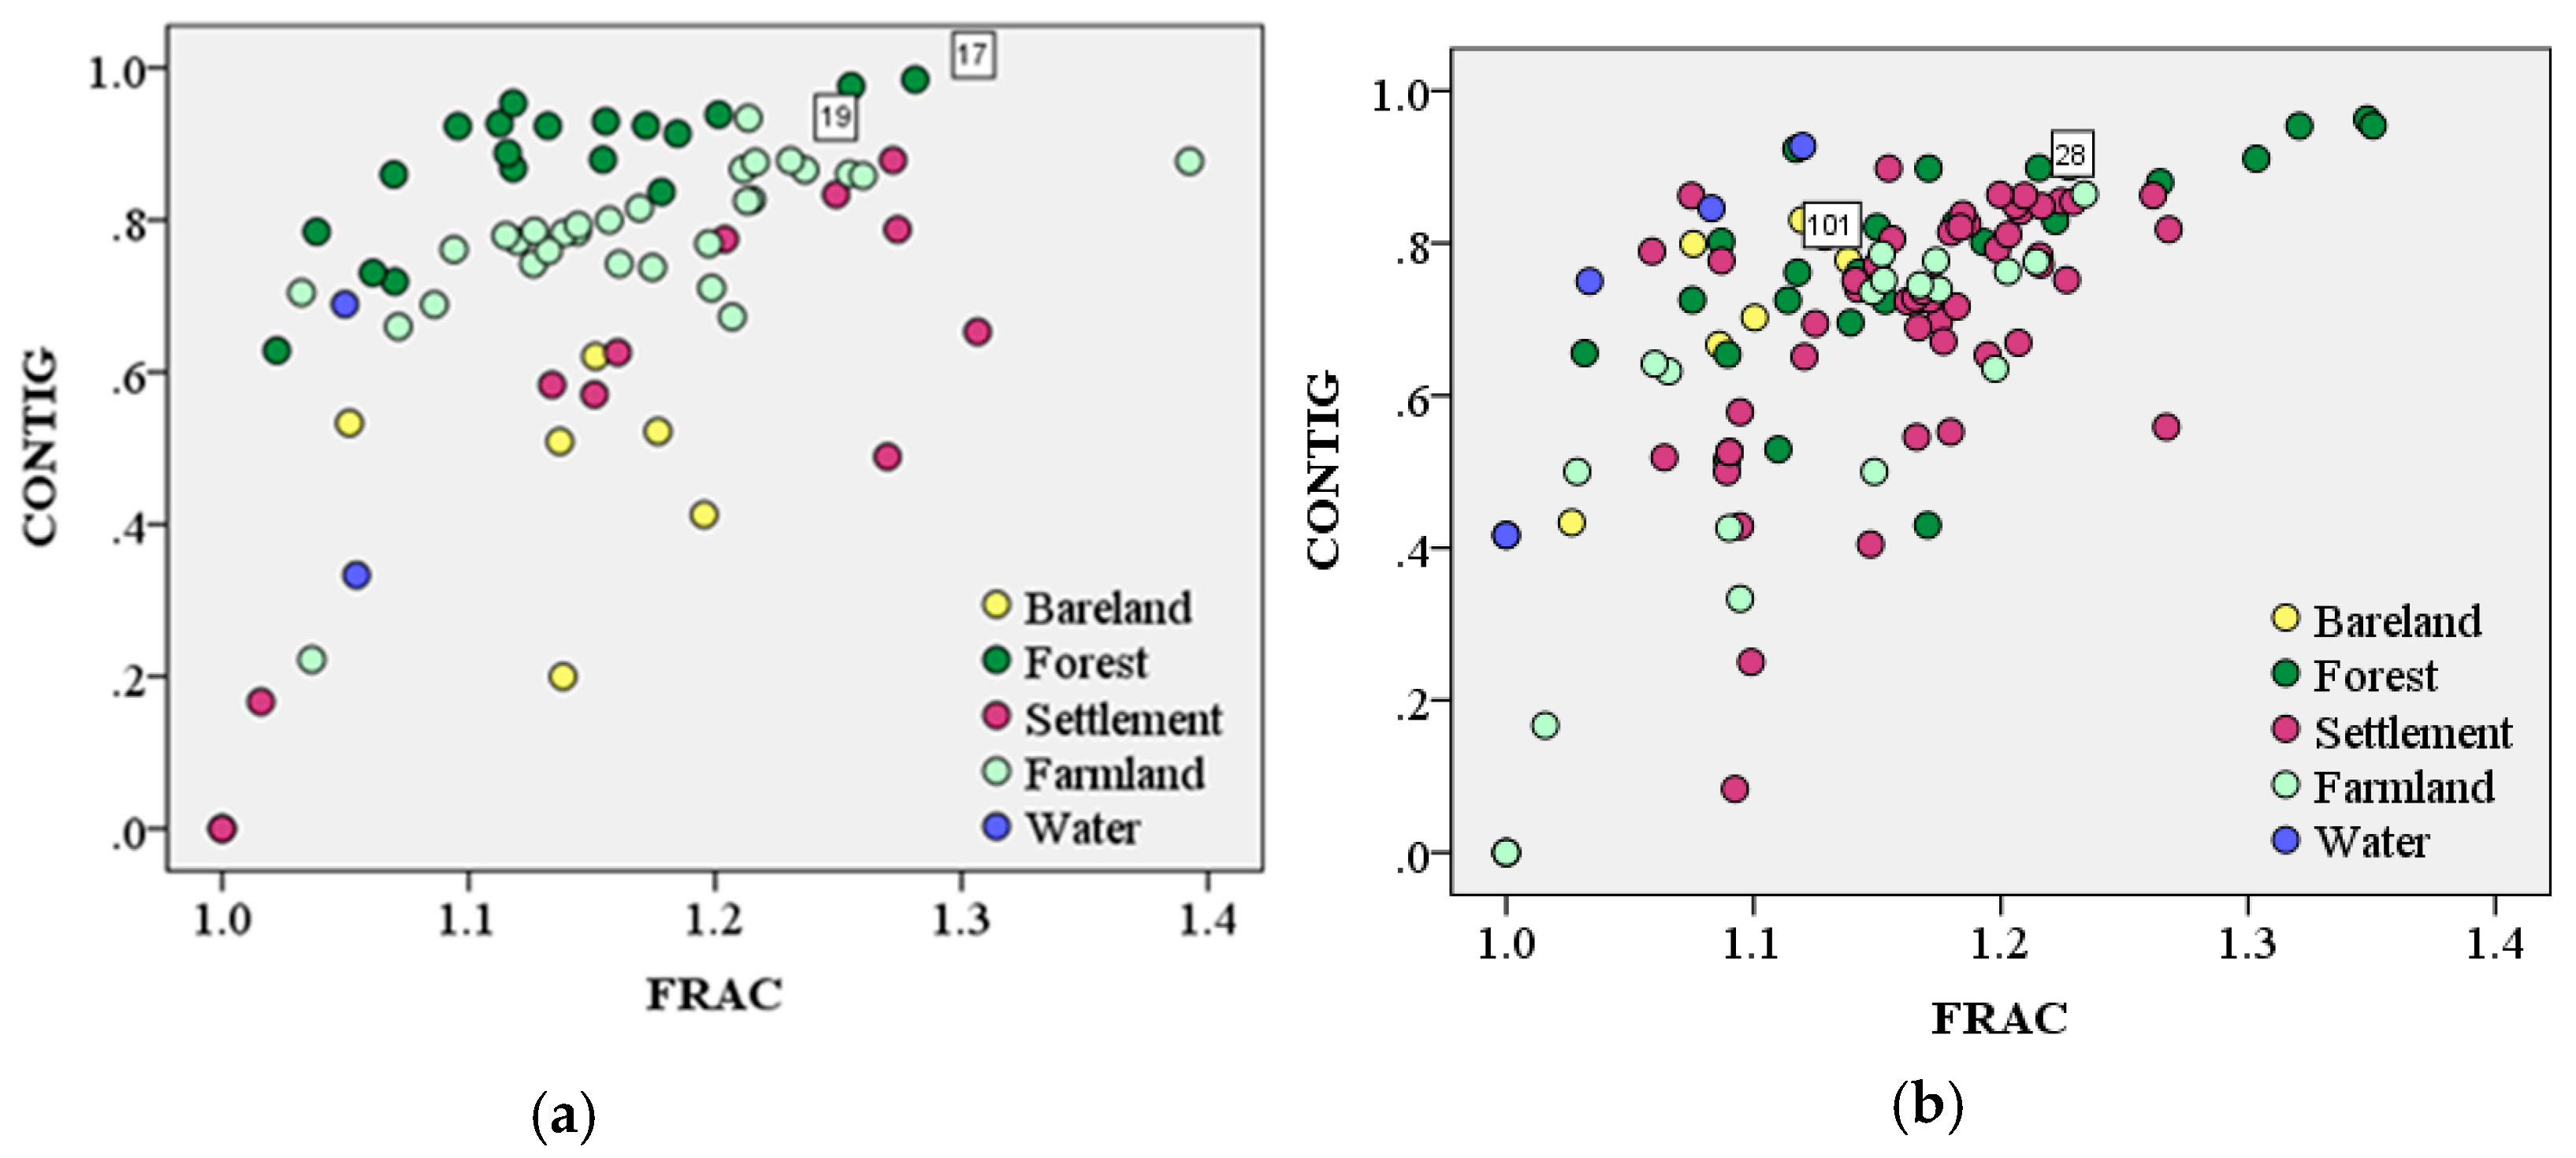
4.1. Ecological Pattern Analysis

The ecological environment in the study area was classified in Landsat images. As the results show in Figure 6, the urban sprawl ratio changed from 14.42% in 1995 to 30.73% in 2017 by calculating the settlement area. In contrast, the ratio of the forest area dropped a little, but stabilized at a higher equilibrium of more or less 50%. Generally speaking, the urban sprawl is marked by the tendency of multiplying human activities, but the geomantic environment made up of forest, mountains, and river remains basically invariant. Considering the locations of archaeological sites at the edge of mountains and the stable mountainous environment in early times, we assumed that the major environmental constitutions did not substantially change in ancient times compared with early remote sensing images. This has been proven by archaeological excavations [84,85].
The pattern of patches in an ecological service is helpful for analyzing the location preference and ecological changes of ancient sites. As shown in Table 3, most ancient sites were located in forest and farmland in 1995. After the extension of the settlement area, some locations of sites transferred to patches of settlement. However, the forest is still the major ecological type preferred by ancient sites. With long-term urban development, patches have gone through fragmentation, which is revealed by the greater number of patches and smaller area of each patch. The shapes of forest patches became more complicated due to the increasing mean perimeter but declining mean area at the same time.
As demonstrated by the analysis of shape metrics in Figure 7, high values of fractal dimension index (FRAC) that reflect high shape complexity of patches occur at several large patches of forest in both 1995 and 2017. The CONTIG index demonstrates the high spatial contiguity for most of the forest patches, representing strong ties in the ecosystem of 1995, but they decreased to a certain degree in 2017 due to the occupation by the settlement patches. The results of edge effect analysis depend on the ecological pattern.

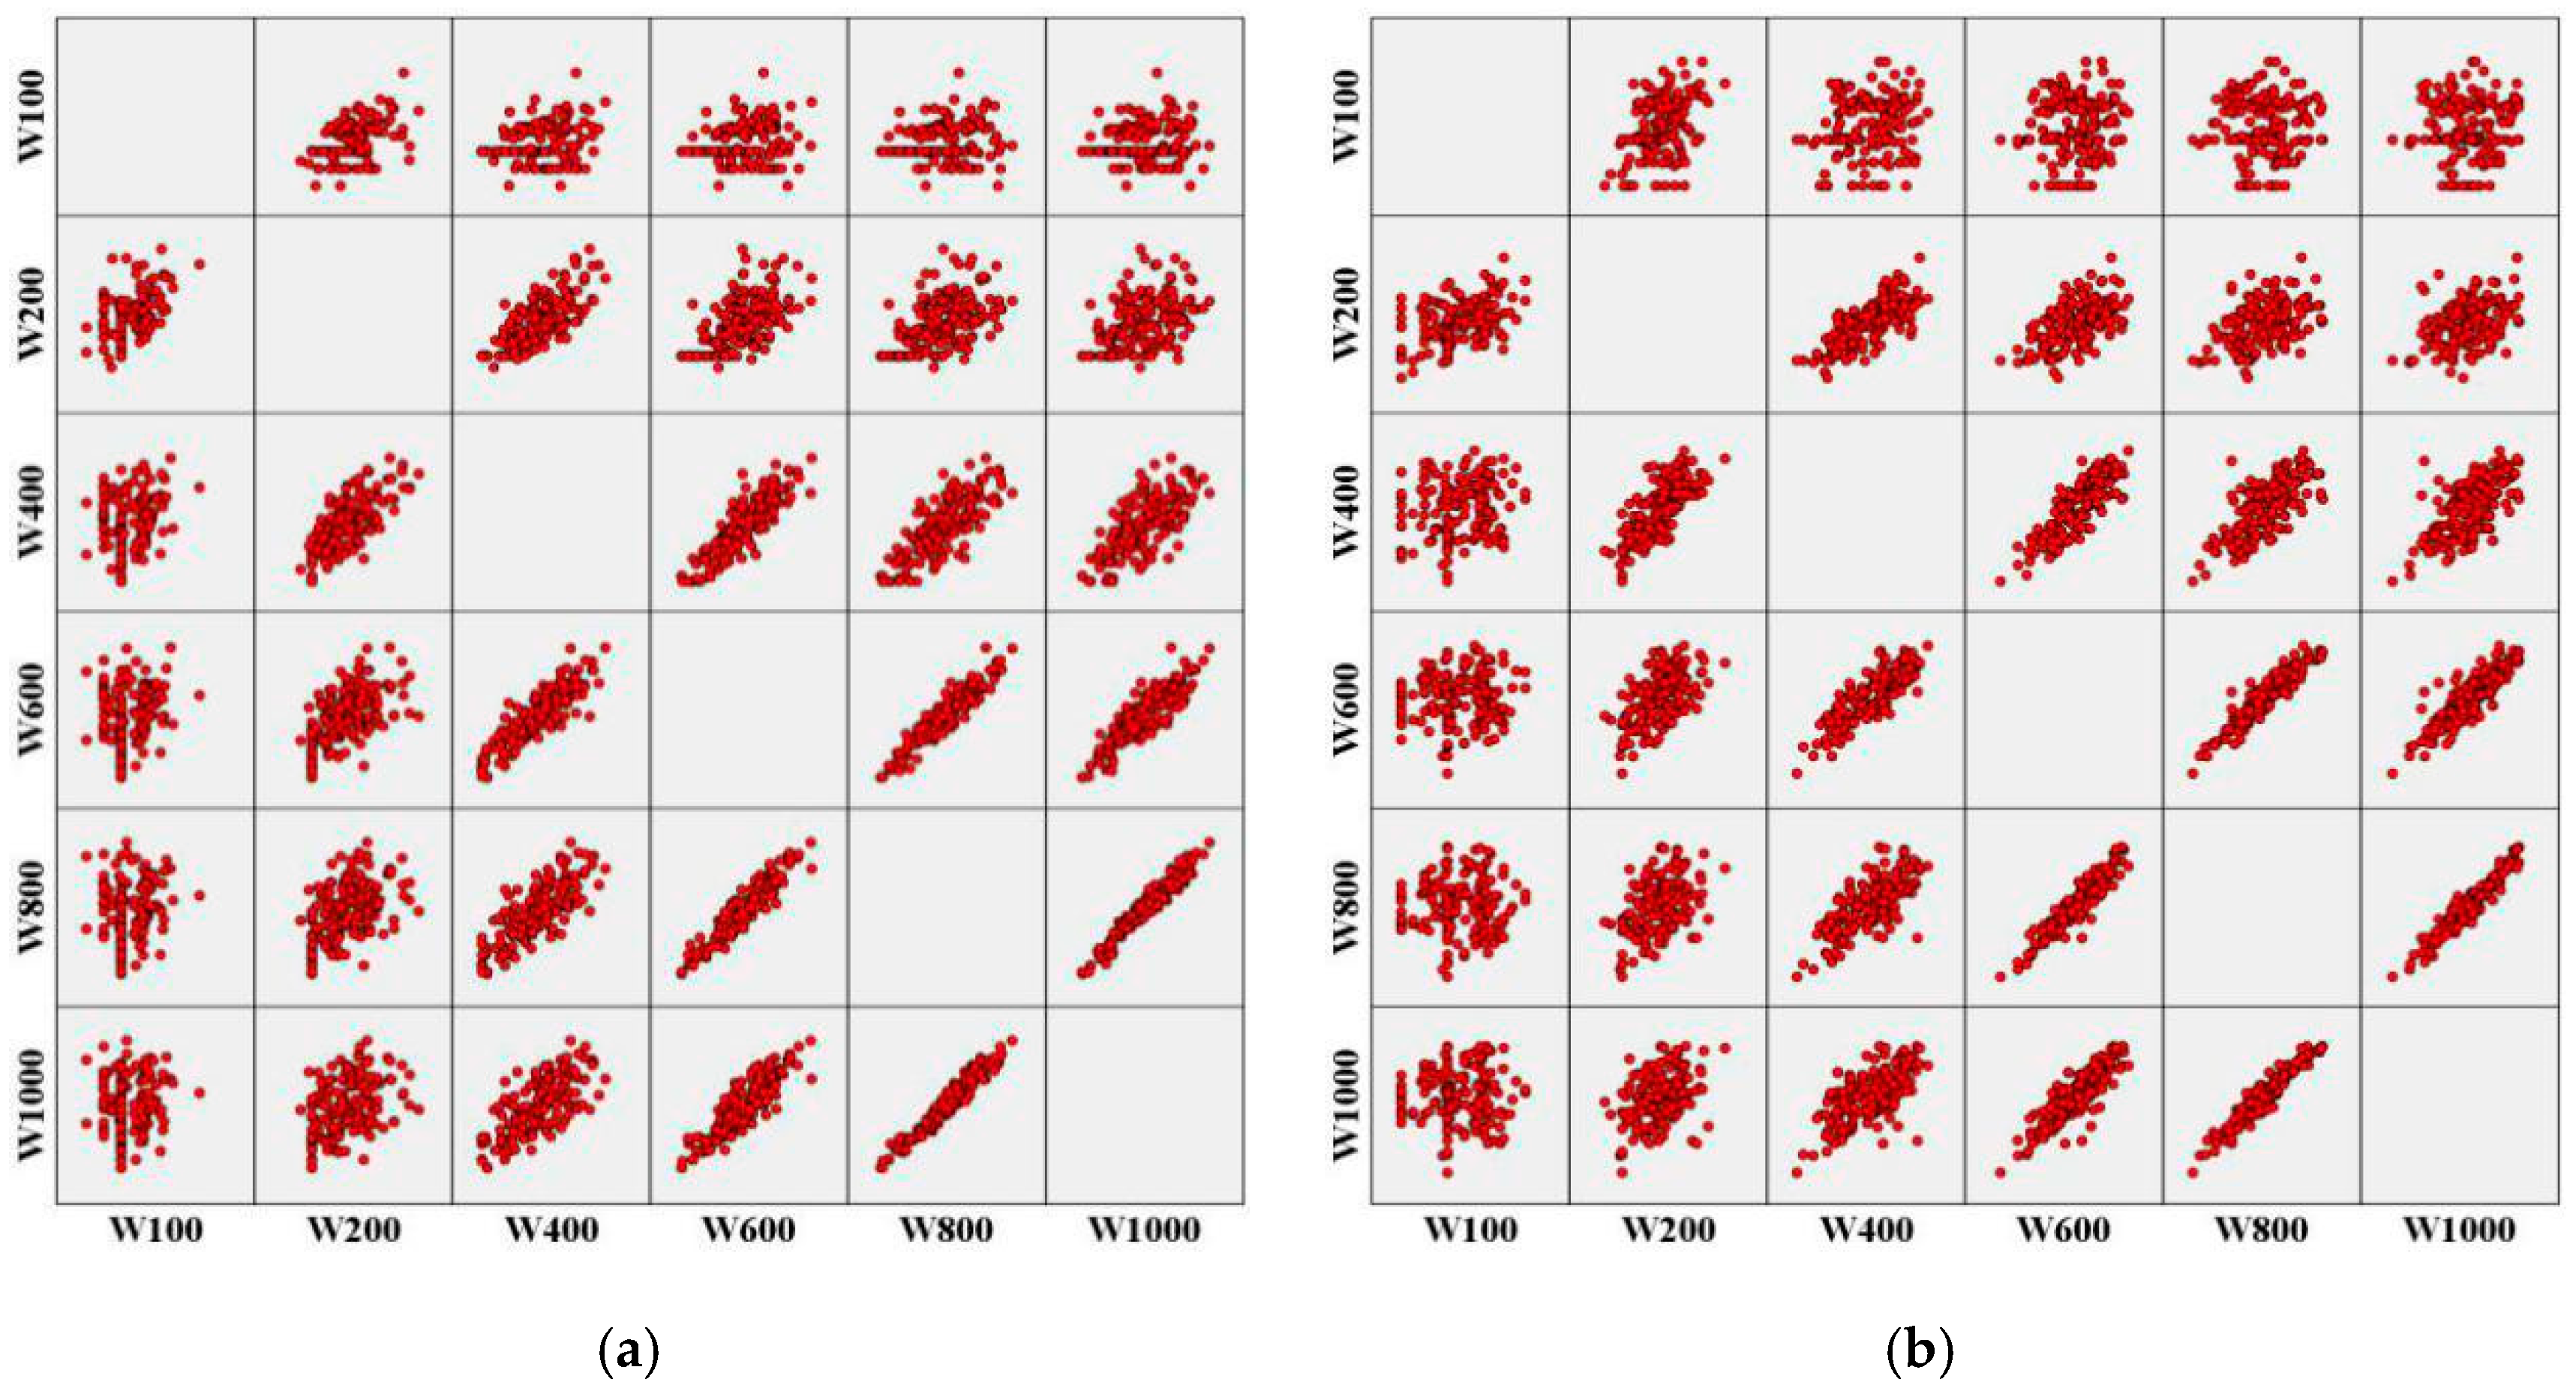
4.2. Edge Effect of the Ecological Transition Zone

In the study area, the archaeological sites are located along the border of the mountainous area in the ecological transition zone. Therefore, we tried to quantify the edge effect in the ecotope according to their spatial positions. Six scales were tested to discuss the edge effect changes with the varying edge width from 100 to 1000 m, which represented the buffer size for each site. Among the 158 sites, only the two ancient cities of Gouzhang and Yinxian are presented as an example in Figure 8.
The edge intensity of different ecological types in which the archaeological sites are located are shown in Table 4. Most of the edge intensity increases as the scale also increases, because of more edge complexity and constitutions in the higher scope of the edge width. Considering the different ecological types that existed in 1995 before extensive urbanization, the forest-domain area had few patches and simple shapes, and thus had a weak edge effect compared to other types of farmland, bare land, and settlement area. In general, the ecological types of forest and water make the edge effect more positive to be distinguished. Things are different in 2017, when all ecological types have a basically equivalent edge intensity for the ancient sites on any scale but a higher value than in 1995. This is the result of universal fragmentation along the edge of the forest and river. Therefore, the ecological structure (the constitution and fragmentation of different ecological types) is the reason for the edge effect discrepancy of ancient sites. It could have an effect on the site selection pattern.
From the matrix scatter graphs (see Figure 9), all the sites have no obvious relation with the low scale of 100 m, but the edge intensity shows approximate linear growth between adjacent widths with the augmentation of scales. The linearity becomes distinct, gradually referring to the R2 values of 0.242, 0.591, 0.768, 0.889, and 0.944 from the scale of 100 to 1000 m in 1995 and 0.179, 0.564, 0.696, 0.881, and 0.920 in 2017 with the same order. In practice, considering the redundant information which results from the linear relation of the neighboring scales, one optimum scale can be selected from the edge effect analysis at a medium or large scale. In the next step, we want to discuss how to choose the best analysis scale to recognize a site location using edge effect and further distinguish the ancient cities from other sites.
In order to validate the method of edge effect when distinguishing between a relics area and a no relics area, 158 relics and random points with an equal number were compared at six scales (see Figure 10 and Figure 11). In general, the separability aggrandizes based on the growth of average values and the enlarged difference between relics and random points as the scales increase. Moreover, the separability was more prominent at large scales in 2017. In Figure 11, the ancient cities of Gouzhang and Yinxian show the different degrees of separability among all the relics. The edge widths of 200 and 400 m are the scales that could be used to separate Gouzhang from most of the sites through the edge effect of 1995. After the ecological structure changes in 2017, the separability of Yinxian is better obtained through edge effect analysis at medium and large scales from 400 to 1000 m. The separability of the edge effect in the transition zone is helpful for differentiating the ecological patterns of ancient sites.
By the analysis above, we could conclude that the different variation tendency of the edge effect was based on the discrepancies of the ecological structure for the locations of ancient cities. This manifested in different site selection patterns by ancient peoples. In this study, two patterns were recognized. One is the ecologically balanced pattern that the preferred living environment was constituted of mountains, rivers, and other ecological types. Edge effect shows a unique trend of changes in low–medium scales in the processing of urbanization. Because of rich ecological types and a strong edge effect in the early ecosystem, ancient peoples could access abundant resources and materials. At the same time, the ecological environment remained stable and reduced the influence of patch fragmentation to some extent. Therefore, the growth of edge effect is slow in certain scales under the background urban sprawl. The ancient city of Gouzhang is the representative of this pattern. The other site selection pattern is shown from the preference of the mountainous (also the forest-domain pattern in this study) ecological environment. The variations of edge effect are basically consistent with the fragmentation of the transition zone in front of the mountain. The main ecological constitution is simple and not stable with low resistance to environmental changes in general. Therefore, the edge effect changed a lot during the settlement expansion in this area. However, this could help us highlight the edge effect of the ecological transition zone and separate the important but unremarkable environment in the early ecosystem. The site selection of ancient Yinxian is this pattern. The edge effect in the ecological transition zone was found to have some relevance in terms of ancients’ environmental cognition. Then, we aimed to discuss the two site selection patterns further with the ecological network method in a geomantic environment of closed spaces.

4.3. Ecological Networks and Centrality Importance

The geomantic analysis of site locations is concentrated on closed spaces, which are the minimum circles constituted of mountains and rivers. The internal closed area labeled as Zone 1 is the minimum circle consisting of the circling mountains, while the external closed space Zone 2 consists of mountains stretching far away. Both the spaces are traversed through by the flowing river. As an example, for Gouzhang City (see Figure 12a), we can identify the core geomantic environment of Zone 1 surrounded by adjacent mountains of Dawanshan and Xiaowanshan and some river branches, and the external closed space of Zone 2 is comprised of the mountains of Mashishan and Changmingshan in the distance. This site location may be selected by referencing both the landform and water position in the geomantic environments, as shown in Figure 1 and Figure 2. About 35 km away in the southeast is the ancient city of Yinxian. The closed spaces can also be constructed by the minimum and maximum closed circles (see Figure 12b). The Yongxin River runs through the spaces and approaches traffic corridor to the Xiangshan Port in the south.
As shown by the geomantic analysis above, both sites of Gouzhang and Yinxian generally follow geomantic principles and also acclimatize to local circumstances. Of course, this landscape of mountains and rivers usually restricts the desirable location to the ecological transition zone, thus causing the edge effect, as we analyzed. Furthermore, additional ecological meanings behind the geomancy in terms of site selection were discussed by network analysis in wider ranges of Zone 2.
For the network constructed by ecological patches and links between neighbors in the geomantic environment of closed space, Gouzhang has a higher density of vertices and edges than Yinxian, as demonstrated in Table 5. Its circuitry reaches 0.91, indicating a higher number of loops in the network, and the connectivity is 0.94, which shows that most of the vertices are well-connected in the network. It can be concluded that the ecological network is more stable, with a real benefit for the long-time exchange of material and energy, than that of Yinxian. In addition, the high ratios of edge to vertex show that the network structure is more complicated and complete. The network complexity of Yinxian rises up with the ecological fragmentation. It can be concluded that the complex and stable ecological network will bring small changes in the closed environmental space.
In order to quantify the importance of each patch in the ecosystem, centrality importance was introduced in our study (see Figure 13). In the network of the closed space in the Gouzhang region in 1995, the vertex of V5 representing the patch where the ancient city is located has the highest centrality of 1.10. It reflects that the selected location plays an important role in the ecological network. The adjacent patches of V54 (Mashishan Mountain) and V80 (Yuyao River) also have high centrality or closeness. It increases the importance of this site location. Although the patch number rises significantly in 2017, the centrality of the site location (V33) is still high, and the neighboring vertex of river patch V124 and forest patch V102 retains the high centrality. The river and mountain (covered with forest in the study area) always play important roles in the network, as in the geomantic environment. For the Yinxian site, its location of forest patch V26 (the Chengshan Mountain) had very high centrality in 1995. Until 2017, the centrality importance of Chenshan Mountain reduced to 0.40 at the medium level. However, the neighboring patches of V66 and V31, with high centrality, could make up the loss of its importance. We can conclude that the mountain and river patches play important roles in the geomantic environment and ecological network, and the locations of high centrality had important ecological meanings for site selection in ancient times. The site locations have the advantages of accessing the life necessities in ancient times because of their high centrality importance in the ecosystem.
Based on the above analysis of the edge effect and ecological network, some interrelations between the ecological structure and environmental preference were explained. In ancient times, the site location may have been selected for its complexity and diversity of ecological types (for example, the balanced portions of mountain, river, farmland, and others), which would have presented a stable ecological and geomantic environment for long-term occupation. Even though there has been an appreciable impact of urban sprawl in the whole area, large variation of the ecological structure would have not taken place. People could have accessed enough goods in the ecosystem to maintain their life, supported by its strong edge effect and high centrality. The waterborne and land transport also permitted them to settle there. As for another classic site selection pattern, few ecological types and a simple structure usually lead to a relatively weak stabilization in the local environment. At the same time, the strong edge effect represents the high possibility of energy flowing to anthropological needs in the ecosystem. Therefore, the regional environment is susceptible to change, especially in the background of resource shortage and population swell in the process of urbanization, sometimes accompanied by the growth of the settlement area and edge intensity. It also proves that a large edge intensity is the indicator of a high possibility of environmental satisfaction for site selection, whether in ancient or modern times. In addition, the preferred mountain-domain area can provide not only an auspicious living space in geomancy but also a defensive fort and energy hub. The study cases of Gouzhang and Yinxian correspond to the above two patterns, respectively. To some extent, the ecological significance behind ancient site selection pattern can help us to learn more about human–environment relationship in ancient times.

4.4. Exploration of Undiscovered Archaeological Site

The environment of Ningbo is classic for its mountainous area and dense network of rivers. It provides suitable locations for ancients’ settlement, which has been proved by the analysis of ancient site selection patterns in this research. The ecological method to recognize the environmental preference of this region is also applicable to other similar regions in the middle and lower reaches of the Yangtze River. Although the cultural and historical background varies along the Yangtze River, there are some universal environmental views shared among the local ancient people about how to utilize natural conditions and select site locations. Therefore, the site selection pattern may have a certain degree of similarity. For methodological validation of edge effect and ecological network, and a deeper revelation of cultural landscape in the Ningbo Plain, we analyzed the ecological structure and geomantic environment in the area of Maoshan Mountain in the basin of the Xiaojiajiang River. This comprehensive analysis was also used to find the new clues of the lost city of Maoxian.
There are 29 ancient sites in the transition zone around Maoshan Mountain, of which 16 were located in forest patches, three in settlement patches, and 10 in other patches in 1995. Until 2017, 14 were situated in forest patches, 13 in settlement patches, and only two in other patches. Therefore, the forest always provides the major environment for site locations. As the settlement region increases during urbanization, it plays a more important role in the ecological environment where the relics are located. The ecotone between the forest and settlement has significant meanings for ancient living. Although Maoxian has not yet been discovered, we can speculate its possible location around Maoshan Mountain in the basin of the Xiaojiajiang River, according to archaeological discoveries [68,69]. To narrow the scope further, the suspected zones of MX1~MX6 were divided by geomantic analysis and regarded as advantageous environments for ancients selecting a residential location through the systematic evaluation of the constitution of the mountain, water, and orientation in these closed spaces. The ecological transition zone was built to explore the ancient Maoxian, as demonstrated in Figure 14.
We divided this transition zone into 214 grids with a 400 m width. The edge effect analysis was conducted to reflect the edge intensity of each central point in a grid with the scales of 400, 600, 800, and 1000 meters. From the scatter diagram presented in Figure 15, the edge intensity of neighboring scales had a significant linear relationship in both 1995 and 2017, which coincides with the previous analysis results displayed in Figure 9. When considering the enlarged disparities of the edge effect on a large scale, a 1000 m scale was chosen for further analysis.
As shown in Figure 16a, Maoshan Mountain is composed of homogeneous forest patches and thus has a low edge effect. All the archaeological sites are located in this median zone of edge intensity, which imply that they had a similar ecological structure in early times. In Figure 16b, the medium zone appears differentiated for the ecological structure changes under the influence of urbanization development. The ancient sites are generally distributed in high-value regions in the ecosystem of 2017. These high anomaly regions signify the changes of ecological structure from patch fragmentation. In terms of the proximity of the environmental pattern and nearness of the spatial position, Maoxian might have similar high separability of edge effect as the ancient city of Yinxian. Therefore, the regions of MX2–MX5 with high edge intensity in front of mountains should be focused on when exploring the ancient site of Maoxian.
In the ecological network, the central patches play the role of connecting medium and interchange hubs in the network. In this transition zone along Maoshan Mountain, the ancient sites are distributed in the range of centrality transition from high to medium, as shown in Figure 17. What is different between the two periods is that the forest patches comprise the major part in 1995, with high values, but settlement patches have a central role in the ecosystem for urbanization in 2017. This change reveals that centrality transfers from the natural domain to human domain in the ecological network. Like Yinxian, the undiscovered city of Maoxian may have displayed a high centrality in the natural ecosystem, and with patch fragmentation under settlement sprawl, its central status may have decreased in the network for the unstable ecological network. The regions of MX2 and MX3 match this condition on the basis of the edge effect analysis result. The suspected area can thus be narrowed down to a smaller space.
By further interpretation of Google Earth images, some suspected archaeological features were extracted explicitly in the suspected zones of MX2 and MX3, as shown in Figure 18a, including the possible city walls and the reservoir nearby, but these were not found in other places around Maoshan Mountain. The size of this suspected area is 80 × 60 m. The reservoir might have been part of the city used for daily life and irrigation. Spatial analysis with the ArcGIS tool was used as an auxiliary method to confirm the importance of this location. The tomb groups in the target area around Maoshan Mountain in the basin of Xiaojiajiang River are concentrated in the standard deviation ellipse (SDE) and encircle the mean center, which was computed by the weight of relics count in the spatial analysis tool of ArcGIS and represents the residential center or high hierarchy position that may have some links with the ancient city of Maoxian. This result shows that the suspected site next to the mean center may have a central status among the contemporaneous sites in Figure 18b. Therefore, it seems that the site selection of ancient Maoxian may also emphasize the ecological structure, as analyzed by the edge effect and network structure. More important for us, this suspected site has been affirmed to have been built in a very early time, following a preliminary field investigation (sees Figure 18c–e), though we will not know more details before archaeological excavation. However, this methodological application demonstrates that the edge effect and ecological network are worth applying when trying to find the location of an ancient site.

5. Conclusions

Ancient environmental preference is rooted in the primary perception of nature and living practice when selecting a residential location. As the most popular method of site selection for ancient peoples, geomantic analysis was applied to find an auspicious environment based on constructing the closed space circled by the mountains and river, which illustrated that environmental utilization was focused on optimizing the overall layout of the living space from early times. As a matter of fact, it is only one aspect of the complicated environmental preference. The ecological meanings behind ancients’ behavior of site selection deserve universal attention. The methodologies of the edge effect and ecological network are helpful for further recognizing the ancient site selection pattern.
Many ancient sites are distributed in the ecological transition zone, with an obvious edge effect. By the analysis of edge effect at different scales, it has been shown that the edge intensity grows linearly between neighboring scales as the edge width increases. The effective scales were found at a medium and high level to separate the preferred locations of archaeological sites from the surrounding environment and the ancient city from other archaeological sites. The separability of edge effect shown up in the medium level under the ecologically balanced pattern in the ecosystem with various ecological types and an equilibrium constitution, while the optimal separability in the largest scale is useful to extract the high-value anomaly of edge effect to recognize the mountain-domain (or the forest-domain) environmental preference, especially after ecological fragmentation during urbanization with the transition from forest-domain ecology to settlement-domain ecology. Therefore, the edge effect can be used to reflect the site selection patterns. Its high-value region can be considered as possible locations with more chances of exchanging resources and energy with the neighbor ecological units to provide the basic material basis of ancient life. From the perspective of the ecological network, it is possible for a complex ecological structure to form a stable environment. This is reflected in the less frequent transfer of ecological constitutions in the network and changes of the edge effect in the ecologically balanced ecosystem. Significant variations of the edge effect are related to the simple network structure of the mountain-domain ecosystem. As for the centrality of patches in the ecological network, the river and forest patches have the highest centrality importance and play the vital roles in the regional environment. They also constitute the main part in the closed space in geomancy. That is an important reason why a geomantic environment was preferred by the ancients. In addition, the ancient sites are located in or next to the high-centrality terrain for accessing sufficient raw materials for ancient life. Of course, the site selection patterns are localized in a similar environment in the middle and lower reaches of the Yangtze River and may be widely applicable. They are also helpful to discover the unknown location of ancient cities. In practice, one suspected site was found through an analysis in the geomantic environment of closed space and its ecological characteristics, though more archaeological details are needed to confirm this speculation. However, a comprehensive analysis of the geomantic environment and ecological structure has been proved effective for research on ancient site selection and exploring undiscovered sites. The results were validated by the spatial analysis in ArcGIS and the field investigation.
In short, we have attempted to discuss the ecological significance of ancient site-selection patterns with the background of fast urban development. However, it is not enough to explain the individual behavior pattern and the rich meanings of sociology and culturology under environmental preference. Further work will be conducted to take archaeological sites as important carriers to extract more scientific information in order to reveal the inner connection between humans and the environment from multi-disciplinary perspectives. If traditional cultural perceptions can be integrated into a scientific system of ecological landscapes, it would contribute more to the conservation of archaeological sites and the study of ancient cultures.

Author Contributions

Methodology and writing, J.Z.; conceptualization, Y.N. and Y.Z.; data curation, L.Y.; investigation and validation, Y.S.; formal analysis, F.L.; software, W.S. All authors have read and agreed to the published version of the manuscript.

Funding

This research was funded and supported by the National Natural Science Foundation of China (NSFC), grant number 41801134 and “Remote sensing and geophysical comprehensive in archaeological research of China classical archaeological site” (No. 2015BAK01B01).

Acknowledgments

The SRTM DEM data set was provided by the International Scientific and Technical Data Mirror Site, Computer Network Information Center, the Chinese Academy of Sciences, http://www.gscloud.cn. The soil classification map is provided by Cold and Arid Regions Sciences Data Center at Lanzhou (http://westdc.westgis.ac.cn). Thanks are given to Chao X., a researcher at the Ningbo Municipal Institute of Cultural Relics and Archaeology, for providing help with the field investigation and data about archaeological sites in this study, as well as some suggestions on historical and archaeological study.

Conflicts of Interest

The authors declare no conflicts of interest.

References

  1. Hambrecht, G.; Anderung, C.; Brewington, S.; Dugmore, A.; Edvardsson, R.; Feeley, F.; Gibbons, K.; Harrison, R.; Hicks, M.; Jackson, R.; et al. Archaeological sites as distributed long-term observing networks of the past (DONOP). Quat. Int. 2018. [Google Scholar] [CrossRef] [Green Version]
  2. David, W.P. The cosmo-political background of heaven’s mandate. Early China 1995, 20, 121–176. [Google Scholar] [CrossRef]
  3. Agapiou, A.; Alexakis, D.D.; Lysandrou, V.; Sarris, A.; Cuca, B.; Themistocleous, K.; Hadjimitsis, D.G. Impact of urban sprawl to cultural heritage monuments: The case study of Paphos area in Cyprus. J. Cult. Herit. 2015, 16, 671–680. [Google Scholar] [CrossRef]
  4. Shi, Z. From the determining orientation to the compass: The great historical contribution of ancient geomancer. In Study of Feng Shui Theory, 2nd ed.; Wang, Q., Ed.; Tianjin University Press: Tianjin, China, 2005; pp. 266–291. ISBN 978-7-5618-1008-8. [Google Scholar]
  5. Guo, J. Joseph Needham’s science and civilisation in China and the founding of the institute for the history of natural science in China. Stud. Hist. Nat. Sci. 2007, 26, 273–292. [Google Scholar] [CrossRef]
  6. Coggins, C.; Chevrier, M.; Dwyer, L.; Longway, M.; Tiso, P.; Li, Z. Village fengshui forests of southern China: Culture, history, and conservation status. ASIA Netw. Exch. 2012, 19, 52–67. [Google Scholar] [CrossRef] [Green Version]
  7. Shao, C. The Influence of Fengshui to Ancient Emperor Mausoleum. Master’s Thesis, Shaanxi Normal University, Xi’an, China, 2013. [Google Scholar]
  8. Yun, Q. The Study on the Application of Chinese Traditional Fengshui Theory in Ancient Town’s Protection. Master’s Thesis, Sichuan Agricultural University, Chengdu, China, 2014. [Google Scholar]
  9. Wikipedia. Available online: https://en.wikipedia.org/wiki/Feng_shui (accessed on 26 October 2018).
  10. Bruun, O. Fengshui in China: Geomantic Divination between State Orthodoxy and Popular Religion, 2nd ed.; NIAS Press: Copenhagen, Denmark, 2011; pp. 1–3. ISBN 978-87-91114-57-1. [Google Scholar]
  11. Su, B. A Brief Description of the Three Sung Dynasty Tombs Excavated at Pai-Sha, 2nd ed.; Cultural Relics Press: Beijing, China, 2002; pp. 99–124. ISBN 7-5010-1338-1/K·587. [Google Scholar]
  12. Wang, Q. Study of golden well in underground palace of Qing Dynasty. Cult. Relics 1986, 7, 67–76. [Google Scholar]
  13. Liu, P.L. Fengshui—Chinese View of the Environment, 1st ed.; San Lien Book Store: Shanghai, China, 1995; pp. 1–8. ISBN 9787542608963. [Google Scholar]
  14. Yu, X. The Theory and Practice of Fengshui in Ancient China, 1st ed.; Guangming Daily Press: Beijing, China, 2005; pp. 1–32. ISBN 780206151. [Google Scholar]
  15. Eilel, J.E.; Michell, J. Fengshui—The Science of Sacred Landscape in Old China, 7th ed.; Synergetic Press: Sante Fe, NM, USA, 1993; pp. 1–13. ISBN 9780907791188. [Google Scholar]
  16. Magli, G. Royal mausoleums of the western Han and of the Song Chinese dynasties: A satellite imagery analysis. Archaeol. Res. Asia 2018, 15, 45–54. [Google Scholar] [CrossRef] [Green Version]
  17. Gui, P. Study on the Evolution and Reconstruction of the Cultural Landscape of DongCun Village. Master’s Thesis, Suzhou University of Science and Technology, Suzhou, China, 2014. [Google Scholar]
  18. Yang, L. The Research of Fenghui Theory and the Building of Ancient Shangshui Cities. Ph.D. Thesis, Chongqing University, Chonqing, China, 2005. [Google Scholar]
  19. Ye, Q. The Space Syntax Research on Inhabitation Environment of Traditional Settlement. Master’s Thesis, Zhejiang University, Hangzhou, China, 2006. [Google Scholar]
  20. Spear, W. Fengshui Made Easy: Designing Your Life with the Ancient Art of Placement, 1st ed.; HarperSanFrancisco Press: San Francisco, CA, USA, 2016; pp. 5–13. ISBN 9780062510235. [Google Scholar]
  21. Wydra, N.; Baigelman, L. Feng Shui Principles for Building and Remodeling: Creating a Space That Meets Your Needs and Promotes Well-Being, 1st ed.; McGraw-Hill Press: New York, NY, USA, 2002; pp. 1–8. ISBN 978-0809297382. [Google Scholar]
  22. Wang, J.; Wang, J. The relationship between the choice of village location and geomantic pattern in ancient Chinese agricultural society. J. Xi’an Univ. Arch. Technol. 2005, 24, 17–21. [Google Scholar]
  23. Heidari, A.A.; Ghalavand, S.T.; Vasigh, B. Making the public spaces with spiritual strategy in Bushehr. Procedia Soc. Behav. Sci. 2014, 159, 722–731. [Google Scholar] [CrossRef] [Green Version]
  24. Hofmeister, J.; Hošek, J.; Brabec, M.; Střalková, R.; Mýlová, P.; Bouda, M.; Pettit, J.L.; Rydval, M.; Svoboda, M. Microclimate edge effect in small fragments of temperate forests in the context of climate change. For. Ecol. Manag. 2019, 448, 48–56. [Google Scholar] [CrossRef]
  25. Andrieu, E.; Cabanettes, A.; Alignier, A.; Halder, I.V.; Alard, D.; Archaux, F.; Barbaro, L.; Bouget, C.; Bailey, S.; Corcket, E.; et al. Edge contrast does not modulate edge effect on plants and pollinators. Basic Appl. Ecol. 2018, 27, 83–95. [Google Scholar] [CrossRef] [Green Version]
  26. Mahmoudi, S.; Ilanloo, S.S.; Shahrestanaki, A.K.; Valizadegan, N.; Yousefi, M. Effect of human-induced forest edges on the understory bird community in Hyrcanian forests in Iran: Implication for conservation and management. For. Ecol. Manag. 2016, 382, 120–128. [Google Scholar] [CrossRef]
  27. Tian, C.; Yang, X.; Liu, Y. Edge effect and its impacts on forest ecosystem: A review. Chin. J. Appl. Ecol. 2011, 22, 2184–2192. [Google Scholar] [CrossRef]
  28. Zhou, T.; Peng, S. Spatial scale and measurement of edge effect in ecology. Acta Ecol. Sin. 2004, 9, 3322–3333. [Google Scholar]
  29. Yuan, X. Research on Forest Landscape Patches Coupling Network and Dynamics: A Case Study in West Dongting Lake. Ph.D. Thesis, Central South University of Forestry and Technology, Changsha, China, 2012. [Google Scholar]
  30. Chen, L. Study on the Characteristics of Weighted Forest Landscape Patch Coupled Network Nodes. Master’s Thesis, Central South University of Forestry and Technology, Changsha, China, 2017. [Google Scholar]
  31. Freitas, S.R.; Constantino, E.; Alexandrino, M.M. Computational geometry applied to develop new metrics of road and edge effects and their performance to understand the distribution of small mammals in an Atlantic forest landscape. Ecol. Modell. 2018, 388, 24–30. [Google Scholar] [CrossRef]
  32. Chen, L.; Xu, J.; Fu, B.; Lv, Y. Quantitative assessment of patch edge effects and its ecological implications. Acta Ecol. Sin. 2008, 7, 1827–1832. [Google Scholar]
  33. Foltête, J. How ecological networks could benefit from landscape graphs: A response to the paper by Spartaco Gippoliti and Corrado Battisti. Land Use Policy 2019, 80, 391–394. [Google Scholar] [CrossRef]
  34. Vimal, R.; Mathevet, R.; Thompson, J.D. The changing landscape of ecological networks. J. Nat. Conserv. 2012, 20, 49–55. [Google Scholar] [CrossRef]
  35. Bergsten, A.; Zetterberg, A. To model the landscape as a network: A practitioner’s perspective. Landsc. Urban Plann. 2013, 119, 35–43. [Google Scholar] [CrossRef]
  36. Taylor, R.B.; Tulbure, M.G.; Broich, M. Impact of hydroclimatic variability on regional-scale landscape connectivity across a dynamic dryland region. Ecol. Indic. 2018, 94, 142–150. [Google Scholar] [CrossRef]
  37. Montis, S.D.; Caschili, S.; Mulas, M.; Modica, G.; Ganciu, A.; Bardi, A.; Ledda, A.; Dessena, L.; Laudari, L.; Fichera, C.R. Urban–rural ecological networks for landscape planning. Land Use Policy 2016, 50, 312–327. [Google Scholar] [CrossRef]
  38. Galpern, P.; Manseau, M.; Fall, A. Patch-based graphs of landscape connectivity: A guide to construction, analysis and application for conservation. Biol. Conserv. 2011, 144, 44–55. [Google Scholar] [CrossRef]
  39. Montis, A.D.; Ganciu, A.; Cabras, M.; Bardi, A.; Mulas, M. Comparative ecological network analysis: An application to Italy. Land Use Policy 2019, 81, 714–724. [Google Scholar] [CrossRef]
  40. Gao, Y.; Li, J.; Yuan, X.; Li, R.; Chen, L.; Chen, J. Comparison and analysis based on assessment on the importance of forest landscape patches coupling network node. J. Cent. South Univ. For. Technol. 2017, 37, 43–47. [Google Scholar] [CrossRef]
  41. Nowak, A.; Grunewald, K. Landscape sustainability in terms of landscape services in rural areas: Exemplified with a case study area in Poland. Ecol. Indic. 2018, 94, 12–22. [Google Scholar] [CrossRef]
  42. Wang, Y.; Lv, D. Nested structure analysis on the network scheme of traditional culture landscape space. South Archit. 2014, 3, 60–66. [Google Scholar] [CrossRef]
  43. Xu, L.; Wang, Y. A study of landscape feature protection planning based on heritage corridor network construction. J. Chin. Urban For. 2016, 14, 17–21. [Google Scholar] [CrossRef]
  44. Yang, L.; Yang, B. The variations of culture landscape and the changes of the structure of social network—A case study of the old town of Jinze and Liantang in the suburban of Shanghai. Fujian Archit. Constr. 2005, 2, 24–26. [Google Scholar]
  45. Jenkins, T.N. Chinese traditional thought and practice lessons for an ecological economics worldview. Ecol. Econ. 2002, 40, 39–52. [Google Scholar] [CrossRef]
  46. Xiao, W.; Zhang, S. Fully exploring traditional Chinese culture and promoting organic development of green city. Procedia Eng. 2017, 180, 1531–1540. [Google Scholar] [CrossRef]
  47. Liang, X. View the Chinese people’s feng shui from the settlement site. New Archit. 1988, 4, 67–71. [Google Scholar]
  48. Du, Y. The Research on the Planning of Mountain Residence Community Related Problems of Fengshui—Take the Qinling Angou Mountain Residence Community Planning as an Example. Master’s Thesis, Northwest University, Xi’an, China, 2010. [Google Scholar]
  49. Luo, G. Spacial Environmental Research of Residence and Water in Chongqing. Master’s Thesis, Chongqing University, Chongqing, China, 2002. [Google Scholar]
  50. Shang, K. The composition, ecological environment and landscape of Chinese feng shui pattern. In Study of Feng Shui Theory, 2nd ed.; Wang, Q., Ed.; Tianjin University Press: Tianjin, China, 2005; pp. 37–43. ISBN 978-7-5618-1008-8. [Google Scholar]
  51. Liu, S. Research on the Waterscape of the Ancient Hakka Village of Peitian in Fujian Province. Master’s Thesis, Fujian Agriculture and Forestry University, Fuzhou, China, 2014. [Google Scholar]
  52. Chen, W. Study on Utilization of Geomantic Theory in the Waterscape Build of Modern Living Environment. Master’s Thesis, Shanghai Jiaotong University, Shanghai, China, 2009. [Google Scholar]
  53. Wang, P.; Zheng, G.; Ge, X. On the scientific inquiry of the geomancy based on the geography. J. Anhui Agric. Sci. 2016, 44, 21–215. [Google Scholar] [CrossRef]
  54. Ma, J. Eco-design and the Application of Water of Traditional Houses in the Yangtze River Delta Region. Master’s Thesis, Southeast University, Nanjing, China, 2015. [Google Scholar]
  55. Zeng, Z. Research of Chinese Ancient Urban Mrphologies Based on Climate Adaptability. Ph.D. Thesis, Huazhong University of Science & Technology, Wuhan, China, 2011. [Google Scholar]
  56. Chen, B.; Coggins, C.; Minor, J.; Zhang, Y. Fengshui forests and village landscapes in China geographic extent, socioecological significance, and conservation prospects. Urban For. Urban Green. 2018, 31, 79–92. [Google Scholar] [CrossRef]
  57. Theatre, E.K.; Chow, C.H.S.H. The geographer and the fengshui practitioner: So close and yet so far apart? Aust. Geogr. 2000, 31, 309–332. [Google Scholar] [CrossRef]
  58. Liang, Y. Environmental ecology perspective in geomantic view of traditional village location layout in China. J. Guizhou Educ. Coll. 1997, 1, 86–89. [Google Scholar] [CrossRef]
  59. Xie, B. Discuss the Fengshui Folk by Geography Scientific Methods. Master’s Thesis, Westsouth University, Chongqing, China, 2014. [Google Scholar]
  60. Sun, F.; Feng, C.; Wang, Z.; Yan, T. Philosophical foundation of Chinese feng shui geography and man-land relationship. Trop. Geogr. 2014, 34, 581–590. [Google Scholar] [CrossRef]
  61. Mao, Y. Study on the Constructing Theory and Examples on Spatial from of Human Settlement in Mountainous Region—Case of Ancient China. Master’s Thesis, Chongqing University, Chongqing, China, 2009. [Google Scholar]
  62. Yang, K. Geographical thinking in feng shui theory. Zhouyi Res. 2006, 4, 92–96. [Google Scholar] [CrossRef]
  63. Marcos-Saiz, F.J.; Fernandez-Lomana, J.C. The Holocene archaeological research around Sierra de Atapuerca (Burgos, Spain) and its projection in a GIS geospatial database. Quat. Int. 2015, 1–23. [Google Scholar] [CrossRef]
  64. Garcia, A. GIS-based methodology for Palaeolithic site location preferences analysis. A case study from Late Palaeolithic Cantabria (Northern Iberian Peninsula). J. Archaeol. Sci. 2013, 40, 217–226. [Google Scholar] [CrossRef]
  65. Graves, D. The use of predictive modelling to target Neolithic settlement and occupation activity in mainland Scotland. J. Archaeol. Sci. 2011, 38, 633–656. [Google Scholar] [CrossRef]
  66. Murcia, C. Edge effects in fragmented forests: Implications for conservation. Trends Ecol. Evol. 1995, 10, 58–62. [Google Scholar] [CrossRef]
  67. Wang, B.; Peng, S. Analysis on the forest communities of Dinghushan Guangdong. X. Communities edge effect. Acta Sci. Nat. Univ. Sunyatseni 1986, 25, 52–56. [Google Scholar]
  68. Wang, G.; Li, J.; Zhao, C. Analysis of forest landscape edge effect intensity based on analytic hierarchy process. J. Cent. South Univ. For. Technol. 2012, 32, 110–116. [Google Scholar] [CrossRef]
  69. Wang, W.; He, D. Research progress of the edge effect of ecological landscape. J. Agric. Sci. 2012, 33, 62–66. [Google Scholar]
  70. Zhang, L.; Wang, H. Planning an ecological network of Xiamen Island (China) using landscape metrics and network analysis. Landsc. Urban Plann. 2006, 78, 449–456. [Google Scholar] [CrossRef]
  71. Patarasuk, R. Road network connectivity and land-cover dynamics in Lop Buri province, Thailand. J. Transp. Geogr. 2013, 18, 111–123. [Google Scholar] [CrossRef]
  72. Song, Y.; Liu, Y.; Wei, X. The characteristics of Wuhan city landscape ecology network pattern based on network analysis. Geomat. Spat. Inf. Technol. 2016, 39, 95–98. [Google Scholar] [CrossRef]
  73. Upadhyay, S.; Roy, A.; Ramprakash, M.; Idiculla, J.; Kumar, A.S.; Bhattacharya, S. A network theoretic study of ecological connectivity in Western Himalayas. Ecol. Modell. 2017, 359, 246–257. [Google Scholar] [CrossRef] [Green Version]
  74. Zhu, J.; Nie, Y.; Gao, H.; Liu, F.; Yu, L. GIS-based visibility network and defensibility model to reconstruct defensive system of the han dynasty in central Xinjiang, China. ISPRS Int. J. Geo Inf. 2017, 6, 247. [Google Scholar] [CrossRef] [Green Version]
  75. Duan, Y. Analysis of Urban Land Utilization Spatial-Temporal Change in Ningbo Based on Remote Sensing. Master’s Thesis, Ningbo University, Ningbo, China, 2011. [Google Scholar]
  76. Zhao, L. The Research of Ningbo City’s Urban Landscape System Spatial and Temporal Evolution Features. Master’s Thesis, Huazhong University of Science and Technology, Wuhan, China, 2015. [Google Scholar]
  77. Li, M.; Mo, D.; Sun, G.; Zhou, K.; Mao, L. Paleosalinity in Tianluoshan site and the relation between Hemudu Culture and its environmental background. J. Geogr. Sci. 2010, 20, 441–454. [Google Scholar] [CrossRef]
  78. Kang, Y.; Cheng, D.; Liang, Q. The characteristic of spatio-temporal evolution analysis of Hangzhou Bay om historical period. J. Zhejiang Norm. Univ. 2019, 42, 88–95. [Google Scholar] [CrossRef]
  79. Wu, W. Evolution of the Yaojiang River plain in alst 7000 years. Acta Ecol. Sin. 1988, 3, 269–275. [Google Scholar]
  80. Yang, Z. Prehistoric cultural sites of 5800 years ago was found in Xialwangdu, Fenghua District, where ningbo ancestors lived. Ningbo News Rep. 2017, 18, 66–67. [Google Scholar] [CrossRef]
  81. Feng, X.; Gao, M. Archaeogeographic analysis of early sites in ningshao area. Southeast Cult. 2004, 6, 31–37. [Google Scholar] [CrossRef]
  82. Menze, B.H.; Ur, J.A. Mapping patterns of long-term settlement in Northern Mesopotamia at a large scale. Proc. Natl. Acad. Sci. USA 2012, 109, E778–E787. [Google Scholar] [CrossRef] [Green Version]
  83. Nyle, C.B.; Ray, R.W. The Nature and Properities of Soil, 14th ed.; Li, B., Ed.; Science Press: Beijing, China, 2019; pp. 72–114. ISBN 978-03-060490-3. [Google Scholar]
  84. Jia, J. Environemtal Soil Science, 2nd ed.; Chemical Industry Press: Beijing, China, 2018; pp. 1–5. ISBN 978-7-122-32594-5. [Google Scholar]
  85. Ningbo Municipal Institute of Cultural Relics and Archaeology; Ningbo Cultural Relics Protection and Management institute. The Ancient Cities of Ningbo recorded in Literature. In Collection of Archaeological Research of Ningbo Relics (2), 1st ed.; Wang, J., Ed.; Science Press: Beijing, China, 2012; pp. 25–38. ISBN 9787030356215. [Google Scholar]
  86. Wang, J.; Xu, C.; Zhang, H. Some issues of the site of Gouzhang. Southeast Cult. 2013, 2, 94–100. [Google Scholar] [CrossRef]
  87. Ningbo Municipal Institute of Cultural Relics and Archaeology. Gouzhang City Site Archaeological Investigation and Exploration Report, 1st ed.; Science Press: Beijing, China, 2015; pp. 25–33. ISBN 978-7-03-040674-3. [Google Scholar]
  88. An Ancient Border City That Has Been Gone for Thousands of Years—Archaeological Investigation and Discovery of Yinxian in Baidu Country of Fenghua, Ningbo. Available online: http://www.kaogu.cn/cn/kaoguyuandi/kaogusuibi/2018/0619/62284.html (accessed on 19 June 2018).
  89. Lin, C. The integration of administrative divisions and local society: A case study of Shan and Mao Counties during the Qin, Han and Six Dynasties. Hist. Res. 2014, 6, 63–80. [Google Scholar]
Figure 1. Schematic diagram of geomantic analysis. The closed space is circled by mountains and a river under ideal conditions for site selection.
Sustainability 12 00328 g001
Figure 2. Schematic diagram of the auspicious position of a water city. Positions (a,b) represent the place of the river bend with branches converging, while position (c) refers to the bay of the river.
Sustainability 12 00328 g002
Figure 3. The spatial distribution of archaeological sites in (a) a remote sensing map and (b) a soil classification map based on the FAO 1990 system (provided by Cold and Arid Regions Sciences Data Center at Lanzhou (http://westdc.westgis.ac.cn)). The spatial characteristics were analyzed based on (c) the elevation range of archaeological sites and (d) the proximity to the river.
Sustainability 12 00328 g003
Figure 4. The scenery of the Gouzhang site (photographed in December 2018) and the ancient port discovered by archaeologists [87].
Sustainability 12 00328 g004
Figure 5. The western wall ruin of the Yinxian site and its classic unearthed relics [88] in the Han and Jin Dynasties.
Sustainability 12 00328 g005
Figure 6. The ecological classification based on Landsat images in (a) 1995 and (b) 2017.
Sustainability 12 00328 g006
Figure 7. Ecological metrics analysis of 1995 is shown in (a), thereinto, the patch number 17 is the location of Yinxian and 19 represents the location of Gouzhang. Ecological metrics analysis of 2017 is shown in (b), in which patch number 28 is the location of Gouzhang and 101 is the location of Yinxian.
Sustainability 12 00328 g007
Figure 8. Ecological patches distribution of Gouzhang and Yinxian sites. Edge effects with six edge widths (100, 200, 400, 600, 800, and 1000 m) were calculated.
Sustainability 12 00328 g008
Figure 9. Edge effect relationship between neighboring scales in (a) 1995 and (b) 2017.
Sustainability 12 00328 g009
Figure 10. Comparison of the edge intensity between the locations of relics and random points in (a) 1995 and (b) 2017.
Sustainability 12 00328 g010
Figure 11. The separability of the ancient cities of Gouzhang and Yinxian based on the average edge intensity in (a) 1995 and (b) 2017.
Sustainability 12 00328 g011
Figure 12. Geomantic analysis of the ancient cities of (a) Gouzhang and (b) Yinxian as shown in Google Earth images from 31 December 1984.
Sustainability 12 00328 g012
Figure 13. Ecological network analysis of Gouzhang in (a) 1995 and (b) 2017, as well as Yinxian in (c) 1995 and (d) 2017. The red dots represent the patches where the two ancient cities are located.
Sustainability 12 00328 g013aSustainability 12 00328 g013b
Figure 14. Geomantic analysis of the possible location of the Maoxian site. The river system was extracted from a Corona image of 1964 and partly refers to the Google image of 1984. The closed spaces of MX1–MX6 are mainly constituted of mountain and water with a suitable orientation.
Sustainability 12 00328 g014
Figure 15. Edge intensity calculation with different scales in the transition zone around Maoshan Mountain: (a) the evenly distributed sampling points for edge intensity computing, and (bd) the edge intensity relationship between different neighboring edge widths.
Sustainability 12 00328 g015
Figure 16. Regional edge effect distribution obtained by the Kriging interpolation method for (a) 1995 and (b) 2017.
Sustainability 12 00328 g016
Figure 17. The centrality distribution in the ecological network of (a) 1995 and (b) 2017.
Sustainability 12 00328 g017
Figure 18. Suspected archaeological target from remote sensing interpretation and a field investigation, (a) the interpretation of archaeological features in a Google image, (b) the centrality analysis of tomb groups in the same period of ancient Maoxian in ArcGIS, (c,d) ancient wall of the suspected site, and (e) the reservoir next to the suspected site now covered with dense grass.
Sustainability 12 00328 g018
Table 1. General descriptions of the ecological network [70,71,72].
EquationDescription
α = e     v   +   p v     5 p α: the ratio of the number of links in a network to the maximum number of links possible. α = 0 means no loop circuit in the network, and α = 1 means the maximum possible number of loops in the network.
β = e v β: the average connections of each vertex. When β = 0, there is no network connection between nodes; when β < 1, it represents incomplete structures of the network; β = 3 means the best network structure.
γ = e 3 ( v     2 p ) γ: the ratio of the number of links in a network to the maximum number of possible links. The condition γ = 0 occurs when no vertex is connected, while γ = 1 occurs when every vertex is connected in the network.
Note: e means the number of connections, v means the number of nodes, and p is the number of disconnected subgraphs (p = 1 in this studied ecological network).
Table 2. Remote sensing images used in this study.
DataLandsat OLILandsat TMSRTM DEMCoronaGoogle Earth
Time24 August 201712 August 1995200321 December 196421 December 1984
The data sets of Landsat and DEM were provided by the Geospatial Data Cloud site, Computer Network Information Center, Chinese Academy of Sciences (http://www.gscloud.cn).
Table 3. Classification statistics of the patches where the relics are located.
ClassificationRelics NumberPatch NumberMean PerimeterMean Area
19952017199520171995201719952017
Bare land9777977.141474.291.625.57
Farmland3920302061,046.005946.00412.7635.24
Forest96661925244,812.63413,988.0012,128.988092.58
Settlement1261115415,027.276907.7873.0433.04
Water2424510.003345,001.1733.23
Table 4. Comparison of the edge intensity for different ecological types the ancient sites are located in.
YearMean Edge Intensity in 1995Mean Edge Intensity in 2017
Scale (m)10020040060080010001002004006008001000
Forest2.262.984.325.927.749.032.503.485.367.639.9611.61
Water2.465.697.16.658.939.782.273.885.768.0710.0111.54
Farmland2.23.505.557.549.5210.992.414.066.478.3711.0112.78
Bare land2.674.265.978.2010.3011.841.762.735.478.2210.2411.50
Settlement2.163.335.027.109.3610.852.053.725.737.8210.2212.03
Table 5. Network analysis of Gouzhang (GZ) and Yinxian (YX) regions.
Holistic EvaluationGZ 1995GZ 2017YX 1995YX 2017
Area, a (km2)47.7647.7625.8325.83
Vertex Number, v811253268
Edge Number, e22334679182
Circuitry, α0.910.910.810.88
Ratio of Edge to Vertex, β2.752.772.472.68
Connectivity, γ0.940.940.880.92

