1. Introduction
With recent advances in internet applications and widespread communication technologies, customers are able to share their travel or purchase experiences, feelings, and reviews online. These online reviews play a vital role in acquiring tourism-related services [
1] and exert a significant impact on the decision-making behaviors of other users [
2]. The development of information and communication technologies has a significant impact on the behaviors of both travelers and the tourism industry [
3].
Furthermore, the percentage of people who search for information for their upcoming holidays is over 80%, according to Google statistics [
4]. It has also been shown that people visit around 26 websites and spend around two hours searching for places to visit that have affordable deals [
5]. Online reviews can be viewed as a form of internet communication, and are enabled by different internet applications, websites, review and rating sites, social networking sites (SNS), and blogs.
Key to the flourishing tourism industry is addressing how it can thrive and enhance a country’s economy and socio-cultural systems. To harness the remarkable potential of tourism to elevate sustainable development, it is vitally important to accentuate that it can directly or indirectly add value to Sustainable Development Goals (SDGs) [
6]. Tourism is an intrinsic part of many SDGs, such as decent work and economic growth, sustainable production and consumption, sustainable cities and communities, and underwater life [
7,
8]. By taking SDGs into account, many organizations have experienced improved performance in terms of sustainability through utilizing sustainable and innovative business models. The core concept of any sustainable business model is to add value for which a customer is willing to pay [
6,
7,
8,
9,
10]. Therefore, in order for the tourism industry to perpetuate sustainability, countries must consider factors that are able to improve tourists’ interest and satisfaction levels through enhancing and attending to tourist experiences. This can help tourism-based companies cultivate the overall experience of tourists. To achieve long-term and attainable tourist satisfaction, there is a need to have satisfied tourists who are interested in returning, and who can also recommend the destination to others [
11]. This necessitates obtaining regular feedback from travelers and paying attention to their reviews. Thus, in this study, we aim to focus on tourists’ experiences and their views regarding different tourist spots, and to aid administrative parties in developing their policies and marketing strategies accordingly.
Our proposed recommendation system contributes towards sustainability in two primary ways. First, it prioritizes travelers’ satisfaction, views, and experiences, as this is the primary motivation of any sustainable business model [
6,
9,
10,
11,
12,
13]. Second, it helps destination marketing organizations to strategize their promotional and marketing activities based on travelers’ needs and interests, which, according to the works of [
14,
15,
16], is important for diagnosing and enhancing customer satisfaction. Also, effective destination promotions and marketing is one of the primary tasks of destination management organizations (DMOs) nowadays [
15].
For tourism sustainability, the aim is to provide the most enjoyable and satisfactory experience [
12,
13] in order to increase the number of satisfied travelers who would like to come back and will recommend the destination to others. Currently, a large percentage of people are influenced by social media, along with pictures and videos posted by others. According to Social Media Today, around 49% of people visit travel content-related web portals before planning their trips [
17]. Therefore, there is a high probability that places that are not well-promoted by DMOs will not be visited by tourists. Thus, marketing organizations, along with placing a greater emphasis on sustainability, are focusing on technologies that are able to help them better connect with customers [
18].
Our goal is to focus on discovering under-emphasized locations and top-ranked locations to attract tourists. Under-emphasized places are locations that are highly rated, but have not received sufficient advertisement or coverage from tourism administrative and marketing parties. In this study, we cover tourist blogs, and their reviews and location ratings. This abundant data are used along with user history-based data that are available online. The effective use and analysis of tourist destination picks, and their remarks based on different factors such as food, conveyance, admission fee, and travel time, could help other tourists to make well-informed decisions. The challenge here is the abundant amount of online available data on different forums. It takes a great amount of time for a tourist to go through a reasonable amount of content to decide and plan their trip. With the help of emerging and advancing technologies, people are more comfortable and can easily share their travel experiences and reviews through different portals such as TripAdvisor and Trip.com. These high-quality blogs and experience tales can help discover different patterns and reasons behind the selection of tourist destinations. Many recommendation systems effectively make use of them. There have been many recommendation systems proposed that focus on tourist movements, destination choices, reviews, and history [
19,
20,
21,
22]. However, these recommendation systems only suggest places that are popular or those that receive the most reviews. In such recommendations, there is the possibility of missing places that are worth visiting. Hence, owing to receiving less exposure and fewer advertisements, such places are often overlooked by these recommendation systems. We refer to such places as “under-emphasized” locations. We selected Jeju Island as a target tourist destination. The reason behind this is that, although the tourism industry of South Korea has improved in recent years, for Jeju Island—a land of abundant natural attractions—keeping pace with tourist demands and the consistent improvement of tourist spots remains a challenge for tourism companies. According to the Jeju Tourism Association, the number of tourists to Jeju dropped from 15 million to 14.7 million in 2017, and further to 14.3 million in 2018 [
23].
We propose a recommendation system that has the following aims, including using user-history-based data and learning the ratings to recommend top-rated places according to user’s requirements and recommending under-emphasized locations by learning from mapping tables, location’s related context-aware sentiments, and relevant topics. We have extracted all possible tourist locations and collected travel blogs most relevant to the user search query. Travel blogs are analyzed to discover hidden or latent topics. We have used latent Dirichlet allocation (LDA) for topic modeling in tourists’ blogs. LDA represents any given document as a mixture of topics with different probabilities of words. These topics are then used along with the reviews relevant to a location to discover emotions and sentiments. Reviews are extracted from Google and TripAdvisor. Support vector machine (SVM) is a supervised machine learning algorithm and is used for both classification and regression. We have used SVM for the sentiment classification task.
The proposed system takes input from all data sources and uses an artificial neural network (ANN)-based learning model. The ANN-based module takes topics learned through the topic modeling module, sentiment scores through sentiment analyzer, and labels through ratings as input. The system then predicts the locations based on the user preferences and recommends both the under-emphasized and top-ranked locations. According to our results, when all the features from SVM, LDA, ratings, and cross-mappings are used in a combined manner, better and optimal recommendations can be obtained. The formulated objective function prioritizes the factors that have a positive influence on prediction accuracy and helps us achieve 94% prediction accuracy as compared with other configurations.
In the rest of this paper, we first perform the literature review related to this work. Then, the background on all the algorithmic approaches is presented in the proposed methodology section, which covers the basics of language modeling and SVMs. In this section, we have also discussed our optimization objective function. The proceeding section sheds light on the implementation environment. After that, we present preliminary results for the proposed approach and compare them with other models. Next, we talk about the recommender system and how we formalized our methods to get the optimal recommendations for the users. The last sections conclude this work with discussions and future work.
2. Related Works
In this section, we present the literature review of the related works. We have divided the related works into three sub-sections. In
Section 2.1, we present related works on recommendation systems;
Section 2.2 presents research related to sentiment analysis and lexicon-based SVM classification; and
Section 2.3 briefly presents work done on topic classification.
2.1. Recommendation System
Social networks play a pivotal role in enhancing the importance of recommendation systems in today’s world. The growth of scientific papers related to recommendation systems has also increased since the year 2004 owing to the open-access of social networking data [
20]. The check-in data available on Facebook, Twitter, or Foursquare can be used as recommendation information for tourists and also the comments can be utilized to satisfy the frequently asked queries of the tourists [
21]. Information technology fields are the recent innovators for the tourism industry resolving cold-start problem, recommendation of attractions, and user model adaptations for improving the recommendation system [
21]. Trust-based recommendation systems such as location recommendations using social pertinent trust walkers are being worked on by many researchers [
22]. The classification algorithms like SVMs, decision trees, and multi-layer perceptron show promising experimental results for destination recommendation systems [
24].
A novel algorithm has been proposed by Hsiu-Sen Chiang and Tien-Chi Huang in their paper, for a personalized user-adapted scheduled recommendation system, which has given excellent outcomes [
24]. The LDA method happened to generate good results for online dating recommendations using a two-sided matching framework [
25]. The cold start problem that occurs for new users in the recommendation system has been approached to be resolved using a collaborative filtering method [
26]. Data mining techniques like associative classification methods can deal with many shortcomings of the recommender system [
27]. Apart from collaborative filtering, content-based filtering and demographic filtering are also widely used in the suggestion of tourist attraction for an individual as well as a group of users [
28]. A point of interest (POI) recommendation system proposed by Guandong Xu et al. has used the tripartite graph for side information and also a predicted personalized POI recommendation using a sentiment supervised random walk algorithm [
29]. A time-aware recommendation system is also an emerging approach in dealing with recommendation strategies [
30]. SigTur/E-Destination is a personalized recommendation system based on an ontology that finds the correlation between recommendation and user motivation [
31]. Content filtering can lead to inappropriate data, which has been resolved in the work of [
32] by the usage of intelligent decision making. A virtual intelligent system is also a part of solving issues related to content-based filtering [
33] in recommendation systems.
2.2. Sentiment Analysis and Lexicon Based SVM Classification
Many frameworks have been built for sentiment analysis and classification that are based on Twitter data, and can deal with sentiment analysis of untagged sentences [
34]. The technique that is most widely used for sentiment analysis is bag-of-words, which has two shortcomings. One of them is a manual evaluation of words and the second being ignorant of grammar and semantics of words, leading to low accuracy [
35]. These have been resolved both at the lexical and syntactic level and many review works have been presented previously [
36,
37]. Recently developed techniques in the field of opinion mining and sentiment analysis still have drawbacks in solving multi-domain problems owing to the unavailability of sufficient labeled data [
38,
39,
40].
Naïve Bayes, maximum entropy, and support vector machine algorithms along with ensemble methodology, namely, weighted combination, meta-classifier combination, and the fixed combination, is considered a good approach in dealing with sentiment classification of microblogs such as Twitter [
41,
42,
43,
44,
45,
46,
47]. Sentiment analysis can be handled in two ways; lexicon-based approach and machine learning. Machine learning generates better results in maximum cases compared with the lexicon-based approach. SVM approaches using sentiment lexicons improve the accuracy of sentiment analysis and also create domain-specific sentiment lexicons for learning purposes [
48,
49,
50]. Sentiment bias processing and multiple clustered-based support vector machine classifiers applied to the lexicon-based sentiment analysis method where a sentiment scoring formula is used to classify the reviews is considered to improve the performance of lexicon-based review [
51,
52,
53].
2.3. Topic Classification
The baseline classification of topics includes data collection, analysis of data for labeling, weighing and construction of features, selecting features and projecting it, training the classification model, and then the evolution of results [
54]. Much work has been proposed based on the metrics related to popularity and rarity to extract features for topic classification [
55]. Decision tree learner and network-based classification for topic recognition are widely used apart from the bag-of-words approach [
56,
57]. Another approach proposed in the work of [
58] describes the deeply contextualized representation of words that model complex characteristics of words used in topic classification and how they vary in linguistic contexts. Deep learning approaches along with the Rocchio algorithm and long short-term memory neural network are also trending methodologies in topic classification [
59,
60]. In [
61], topic modeling based deep neural network approach is proposed for recommendations.
2.4. Analysis of Online Reviews
The concept of using user reviews for prediction and recommendation is not new. Many studies have examined the impact and power of online reviews on the purchasing behaviors of users and their decision making [
62,
63]. Some studies have used the data from reviews to find the contentment and satisfaction of hotel guests [
64], tourist satisfaction [
65], and sentiments related to a movie [
66]. Online reviews are often referred to as electronic word of mouth. According to the work of [
1], these reviews are the most vital source of information that impacts a customer’s behavior in different sectors such as tourism services.
There is no doubt that these reviews are capable of shaping a user’s decision and play a significant role in tourism-related research and applications. In the work of [
63], a cognitive fit theory is applied to reviews and both the review type and many reviews are considered for the experiments. Besides the statistical features, the behavioral features data are also very critical for the e-tourism business, as these behavioral features can help us identify different trends such as fraudulent reviews [
67,
68,
69,
70]. Reviews credibility is also very important for the management of hotels, tourists’ spots, or any product [
71].
In the work of [
72], sentiment analysis is applied to find people’s reviews about tourism in Oman on Twitter data. A domain-specific ontology is created, and entities identified by a part-of-speech (POS) tagger are compared with the domain-specific concept. A further study [
73] builds a model to examine the helpfulness of online reviews based on five novel linguistic features such as noun-singular, noun-general, preposition, personal-pronouns, and adverbs. They have also used visibility features, such as the review age and rating of the review. The linguistic features proved to be better predictors for review helpfulness.
3. Data
In this section, we present the characteristic details of the data used for experiments. The data collection phase is one of the primary tasks in the knowledge discovery process. The knowledge discovery process identifies hidden patterns from an enormous amount of data. We perform knowledge discovery by identifying latent topics from large text data files and classify users’ sentiments.
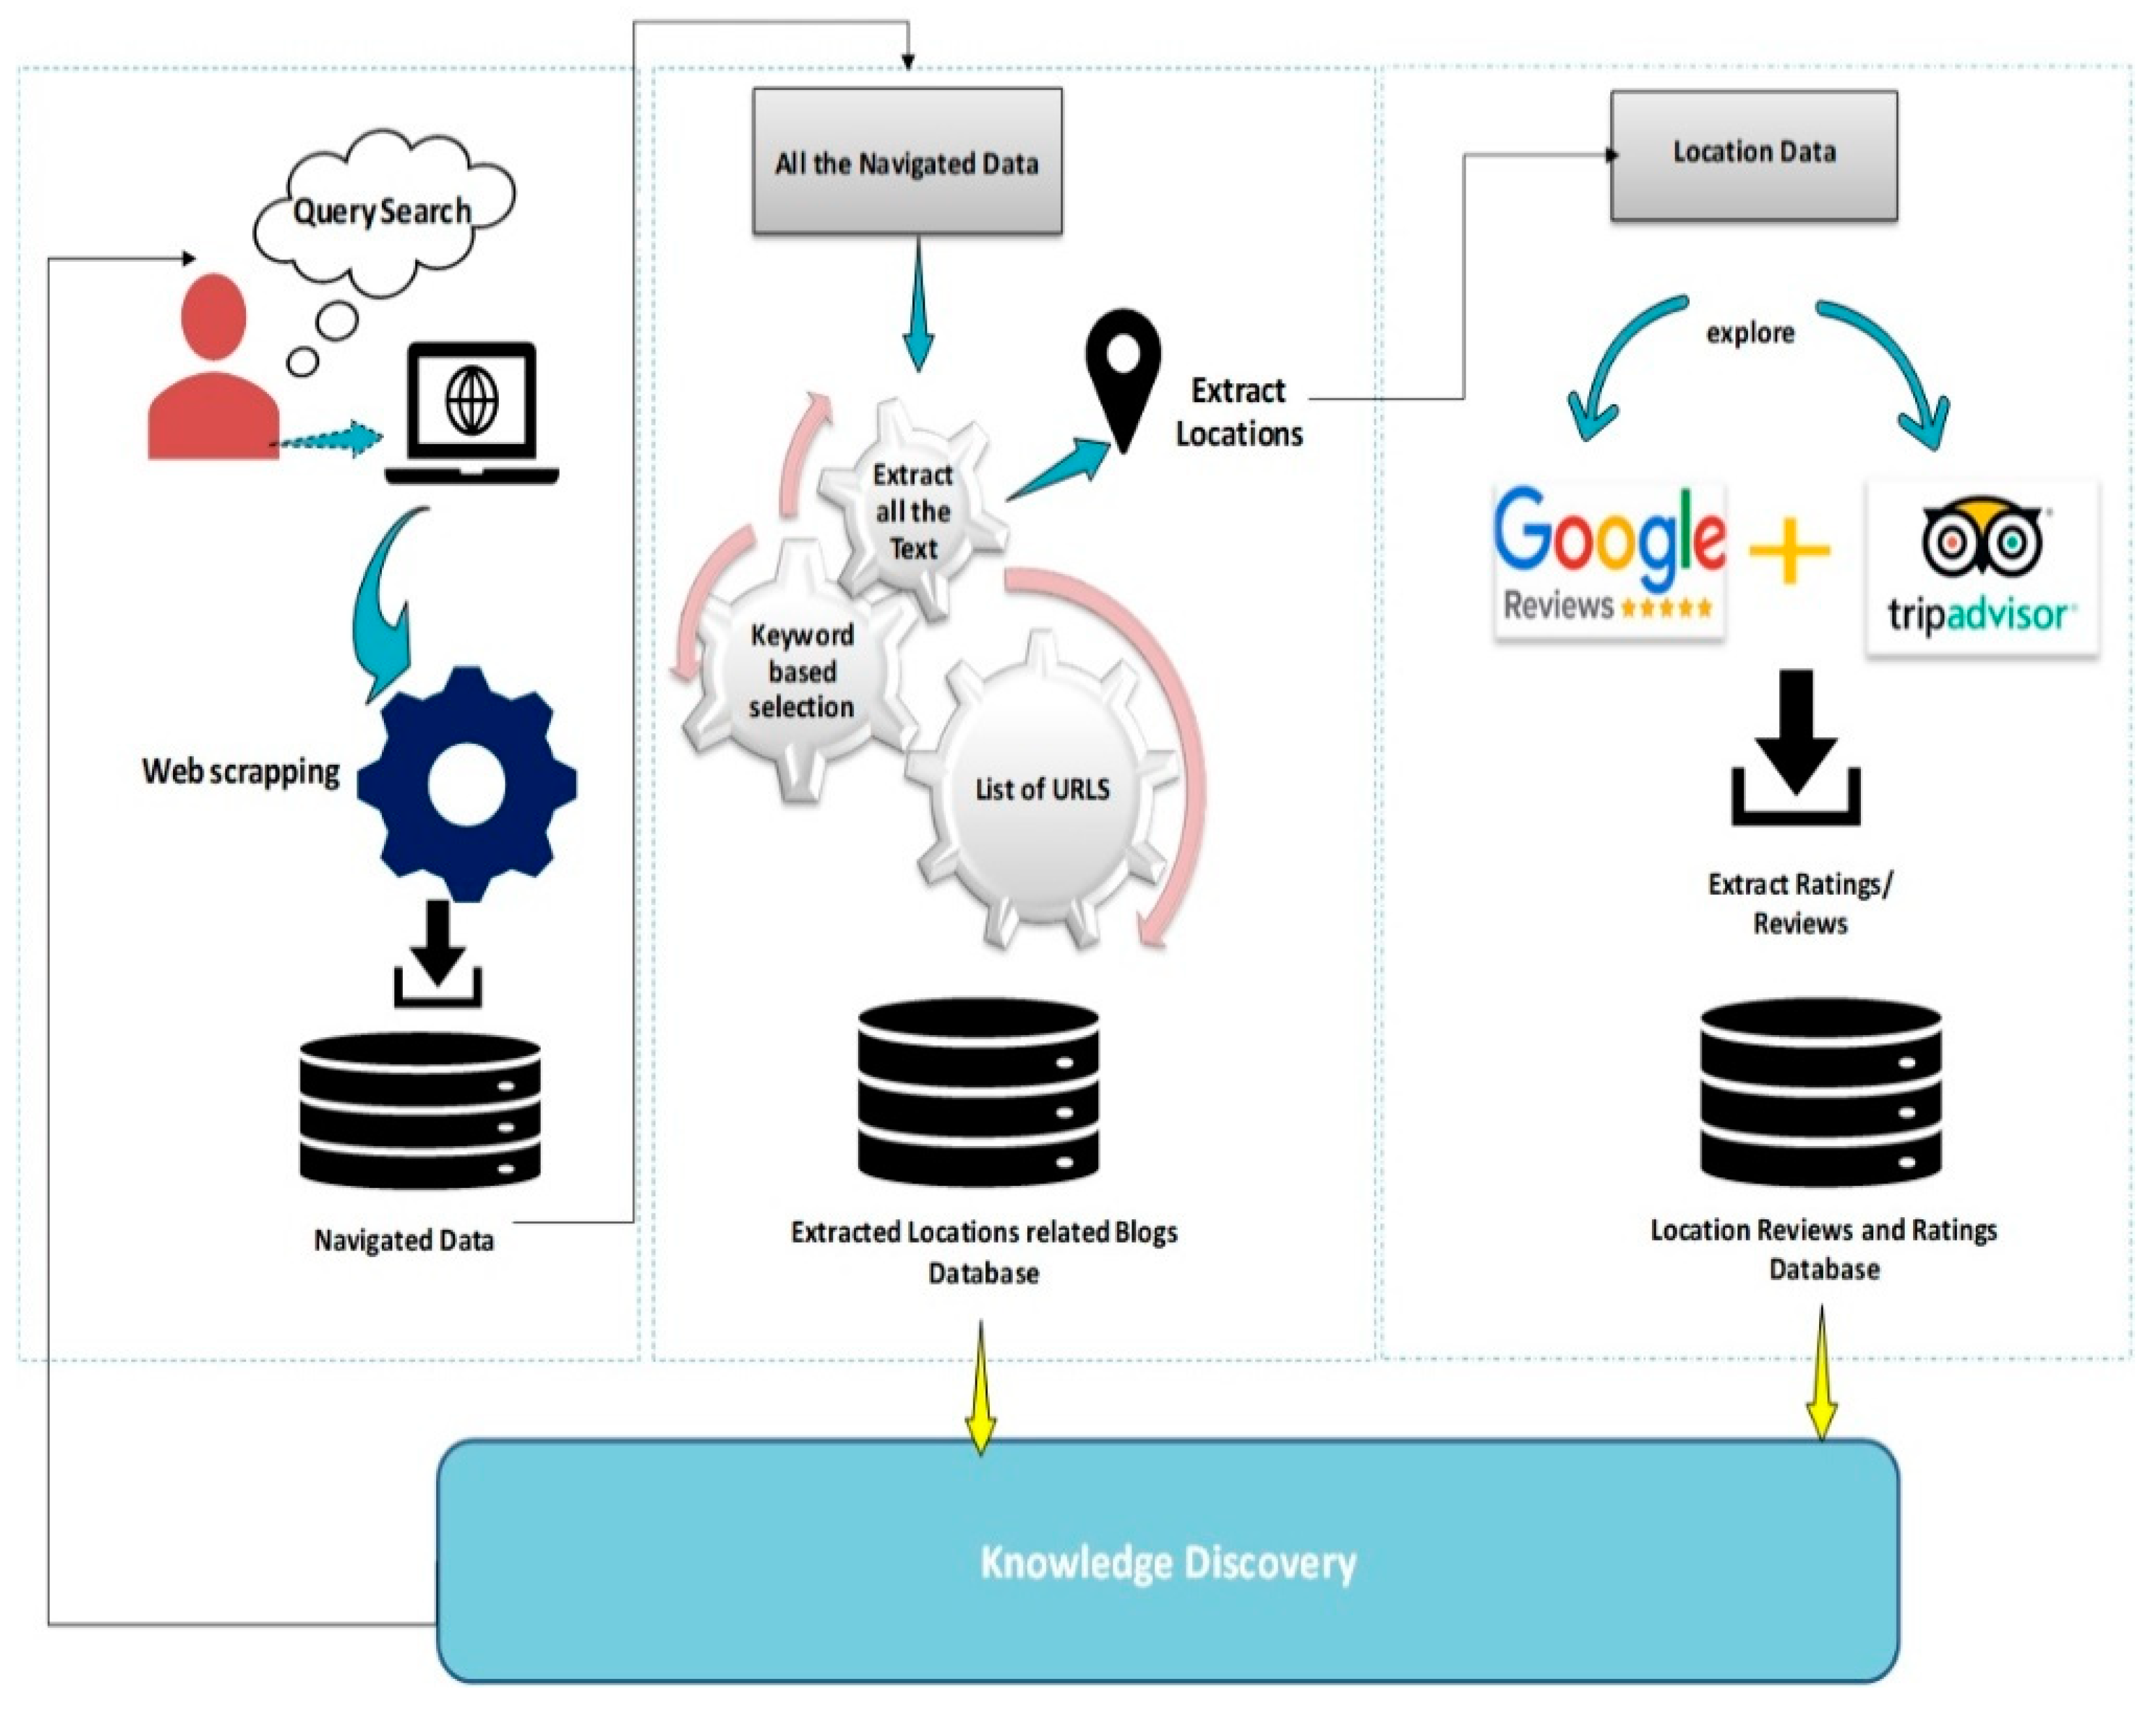
As we are targeting Jeju Island tourism for the experiments, our data crawling process is customized accordingly. We first searched for the term ‘tourism’, in combination with ‘Jeju’ in general. Second, we used different synonyms for tourism such as ‘travel’, ‘tourists’, and ‘tourist destinations’, as well as alternative terms such as ‘tourist spots’, ‘best places’, ‘where to go or visit’, ‘all places’, and ’list of places’ combined with the word ‘Jeju’. We also searched Google maps for all these terms and search queries. We primarily collected various travel blogs data, reviews against different locations and their respective ratings, location’s weather, and user’s history-based data. We collected and managed a list of universal resource locators (referred as URLs in
Figure 1) for all the blogs. We removed redundant URLs and extracted data using the remaining links. After this, the data are stored in the relevant database and knowledge discovery tasks are performed, such as topic discovery and sentiment analysis, as shown in
Figure 1. The description of each data source is given below.
3.1. Blogs
Blogs are of the online user-generated data type. A travel blog is like a story in which people elaborate their thoughts and experiences in detail. There are many blog websites. We collected all the blogs related to a user’s search query.
3.2. Reviews
Reviews are also of the online user-generated data type and are shorter in comparison with blogs. Reviews are usually summarized using few sentences. We used Google reviews and TripAdvisor.
3.3. Ratings
Ratings are usually in numeric form, ranging between 1 and 5. We collected ratings from Google and TripAdvisor.
3.4. User History Data
These data are based on the travel patterns of a user. The user’s demographics are recorded, such as age, reasons for traveling, such as business or vacations, gender, and local or foreigner. For training our model, we used the national open data portal [
74] of South Korea, which has many categories of data publicly available for use.
4. Proposed Methodology for Tourist Spots Recommendations
This section presents the proposed methodology for tourist spot recommendations. In
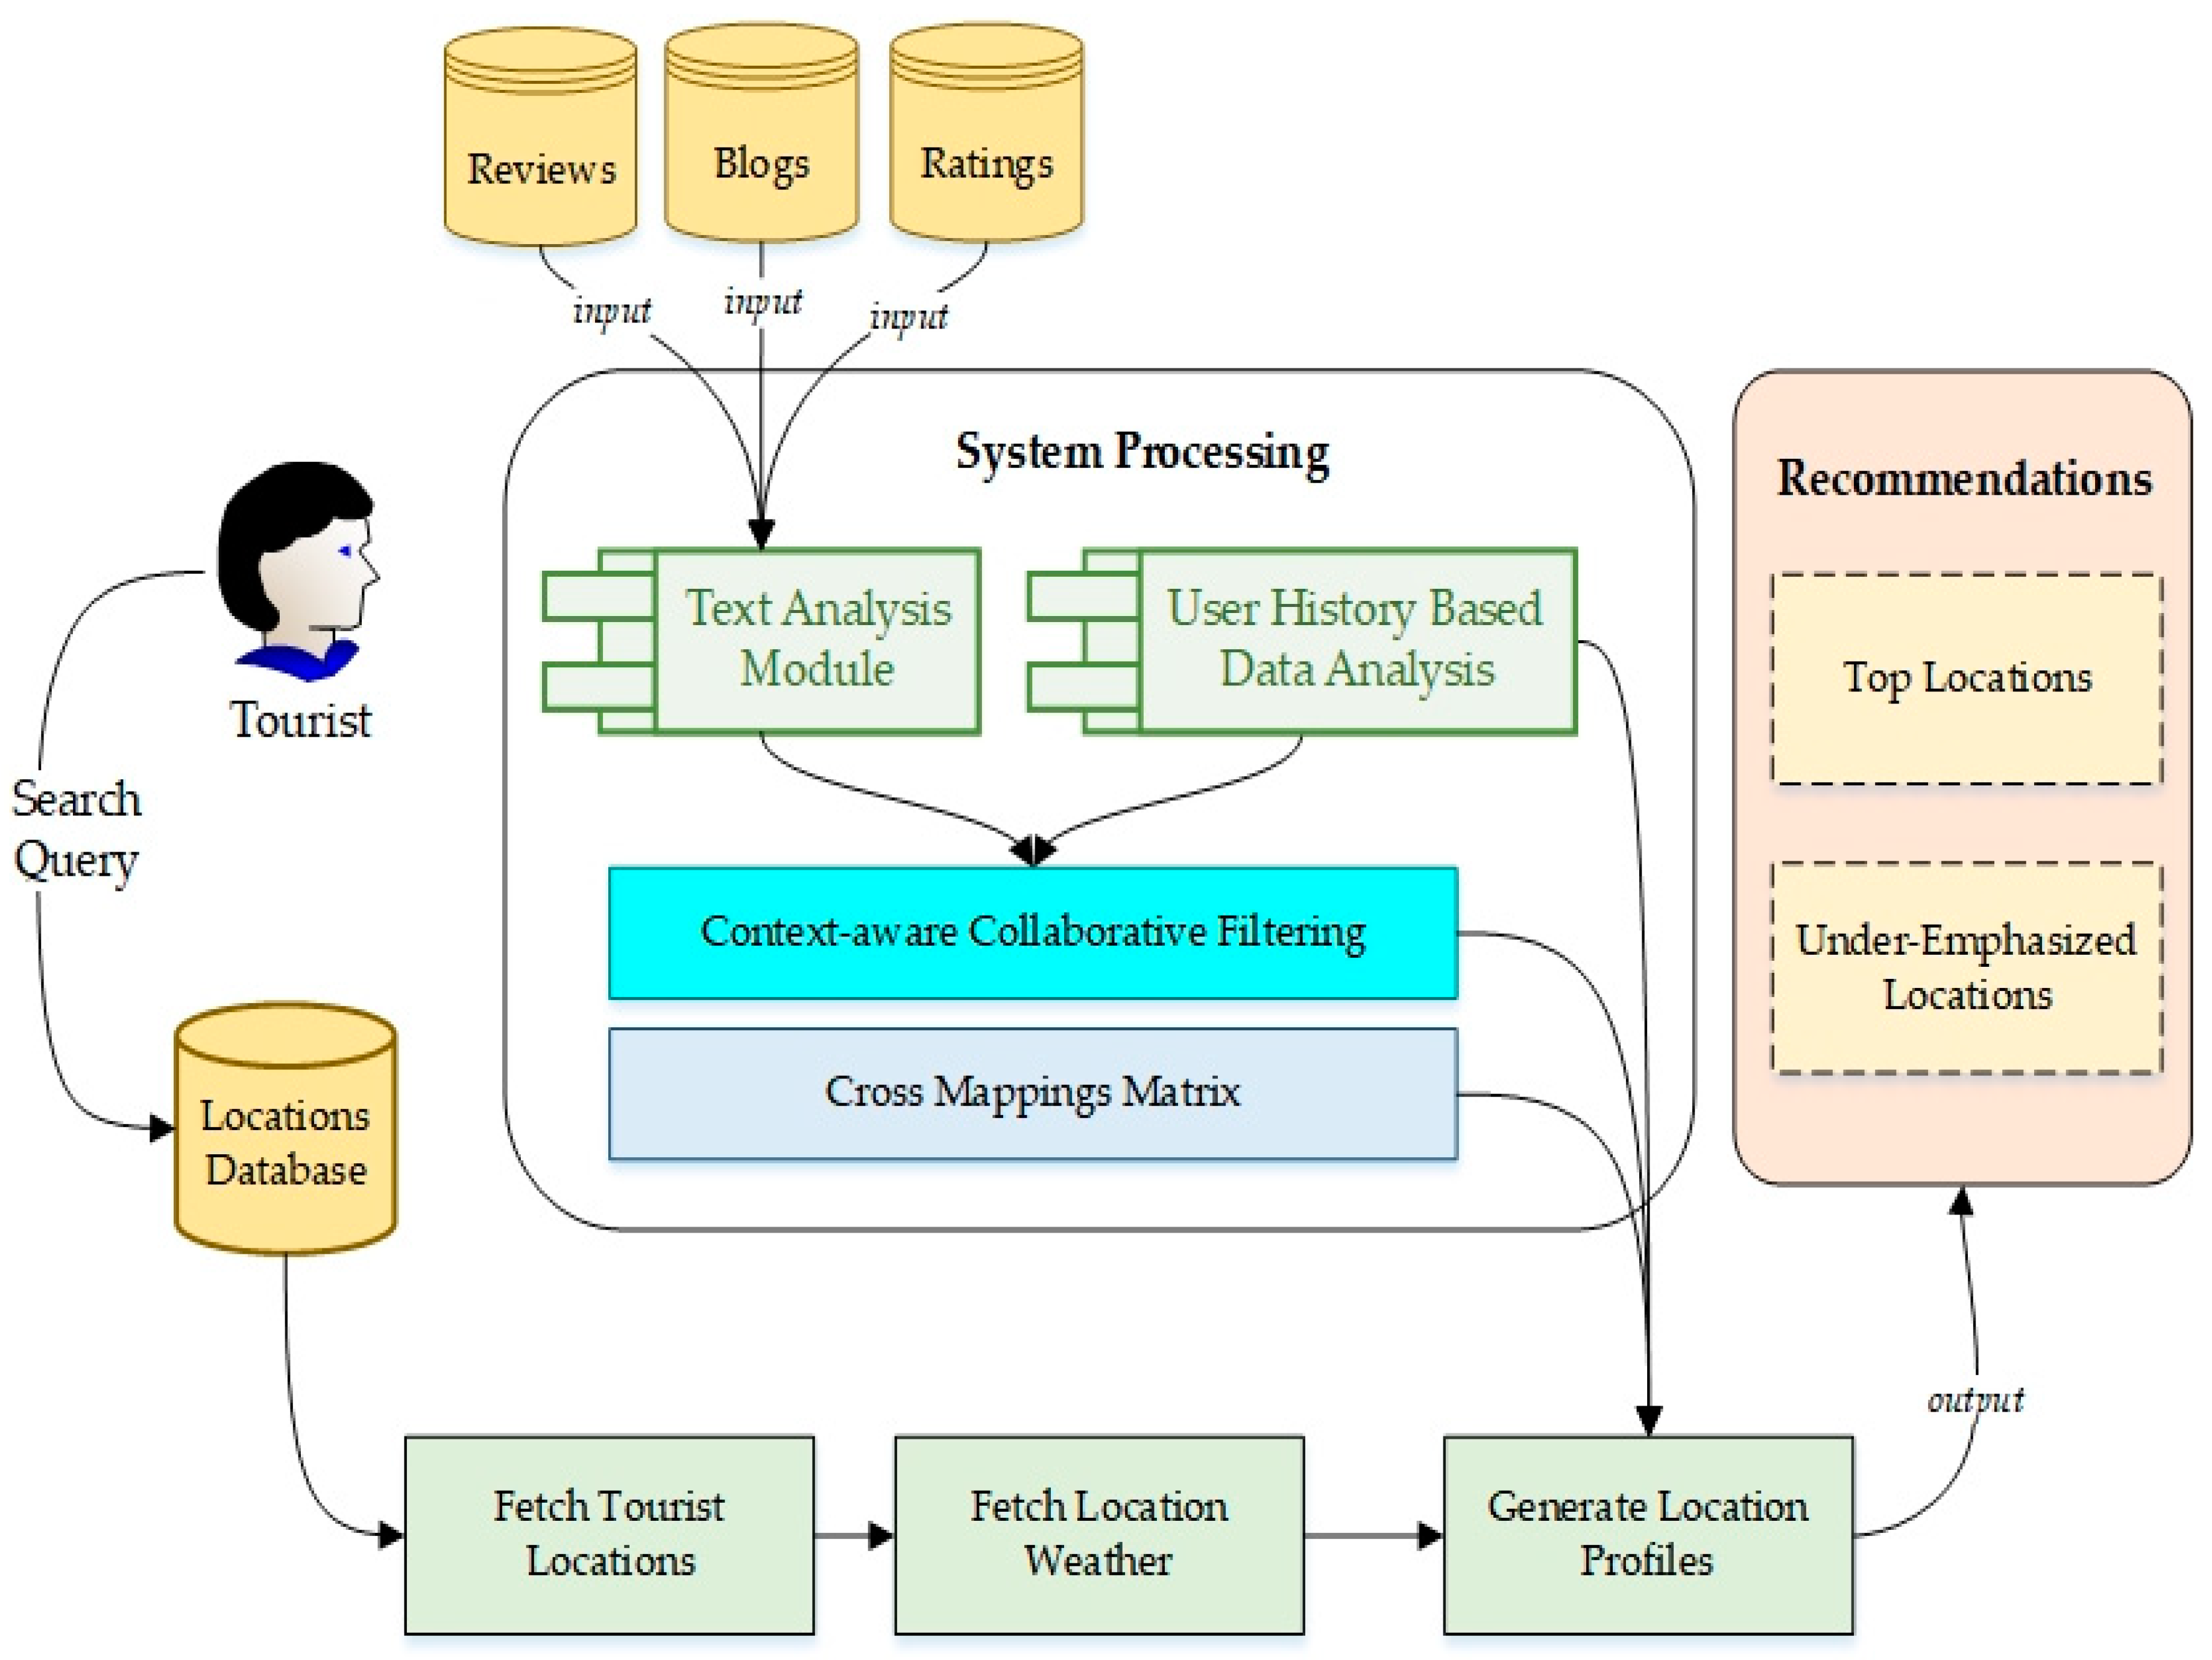
Figure 2, we present our conceptual model and the complete system flow. For simplicity, we will explain through an example. When a tourist visits a new country or city, he or she can ask for friends’ recommendations or can search for top tourist places trailed by different review sites and different user blogs. With such abundant data available, there is a dire need to help a tourist with efficient search results for his query and recommend places accordingly.
A location database is maintained with all the possible spots that can be visited. In our conceptual model of the system, all the relevant blogs, ratings, and reviews are extracted against a user query. The collected data are both in numeric and textual form. The system comprises of the text analysis module, which performs topic modeling and sentiment analysis based on context-aware collaborative filtering. The user history-based data analysis module takes demographic data, such as age, gender, and number of visitors at a location. The preferences of a new user are first compared with the history-based data.
For under-emphasized location recommendations, a location profile is generated for each location in the database, which is built on the history data, collaborative filtering, and cross-mapping matrices. Therefore, when a user searches something, the location database is checked first and then all of the tourist locations are fetched, the weather of each location is fetched, and location profiles are calculated based on the system processing. The user is then recommended with all the top locations based on historical data and under-emphasized places based on location profiles.
This section is further comprised of applied algorithms, with detailed explanations in
Section 4.1, architectural details of the system in
Section 4.2, and the approach towards optimization in
Section 4.3.
4.1. Algorithmic Approaches Used in Methodology
This section is divided into four subsections covering all the approaches used for each module. In
Section 4.1.1, LDA is explained, followed by SVM-based sentiment classification in
Section 4.1.2. In
Section 4.1.3, we present the location’s popularity index calculation technique, and
Section 4.1.4 introduces corresponding mappings.
4.1.1. Topic Modeling Using Latent Dirichlet Allocation (LDA)
Topic modeling is one of the primary tasks of natural language processing. The most suitable topic modeling approach considers each document as a collection of different topics. LDA is an example of such approach. In LDA, a user blog is treated as a document and, after some preprocessing, it is passed to the LDA model. LDA generates clusters of similar words indicating a topic or a theme. This process is repeated for all the blogs in the dataset.
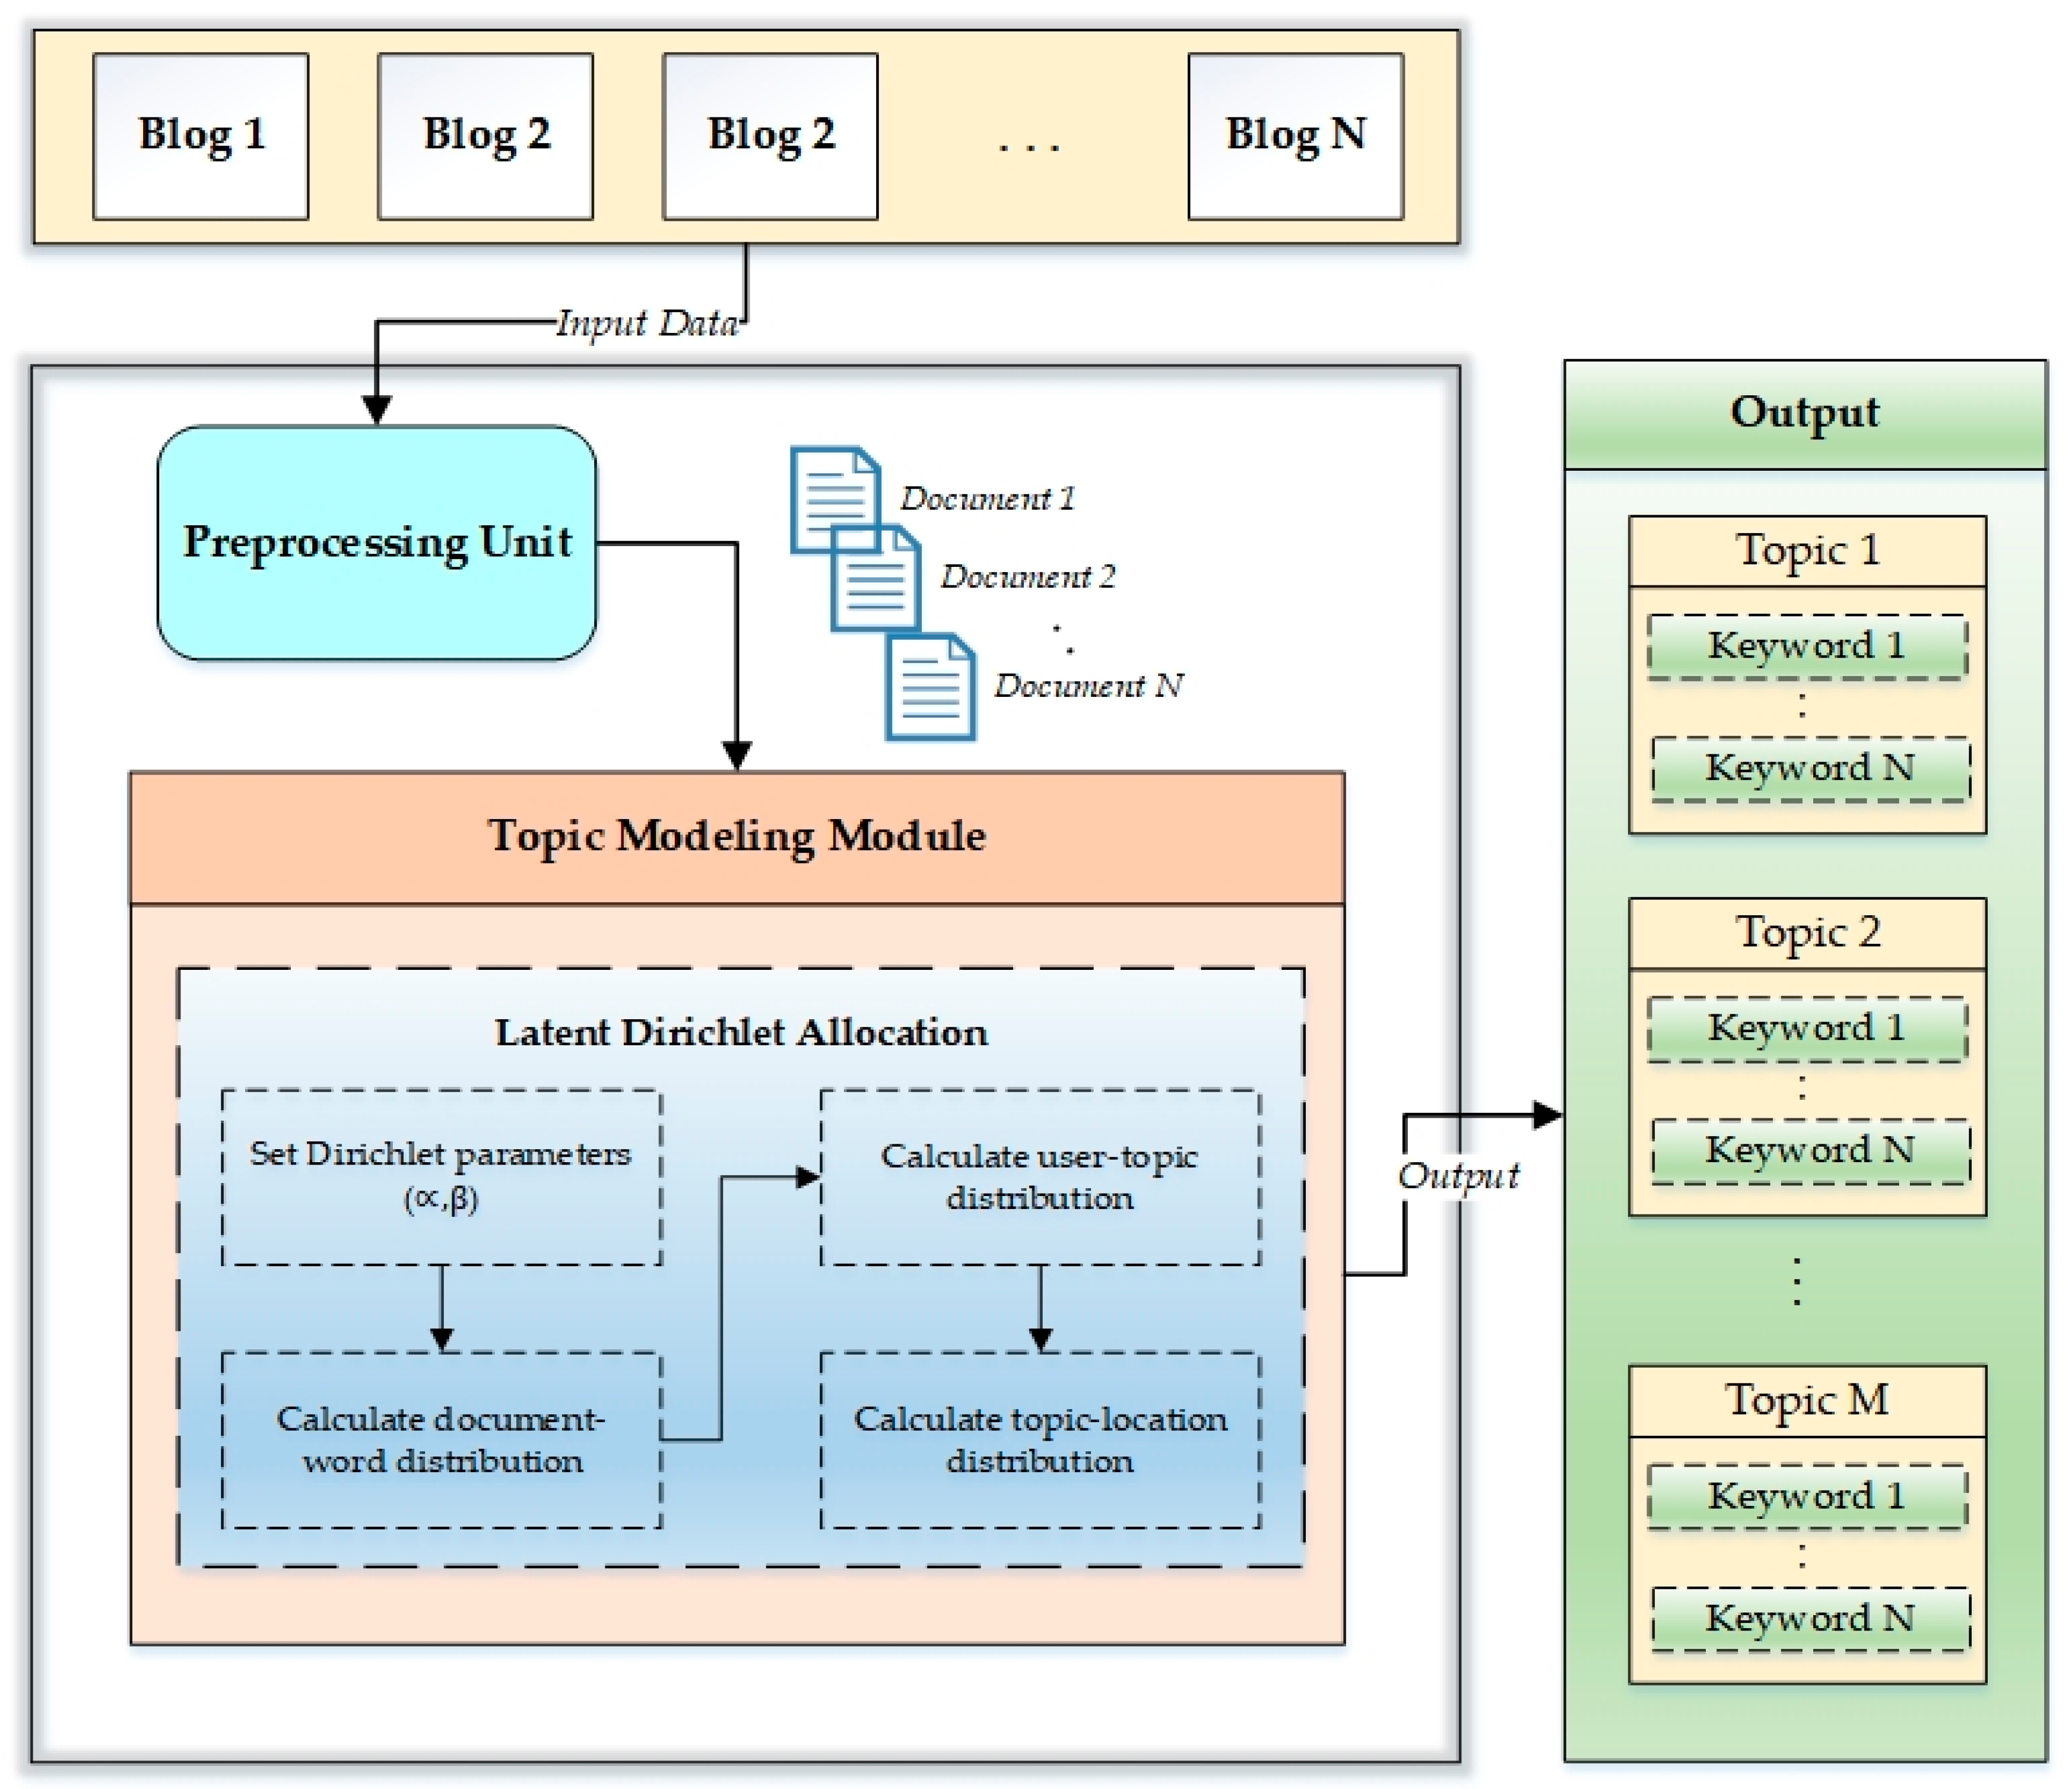
Furthermore, there are Dirichlet priors, which result in more effective mixtures of topics for the probability distributions. As shown in
Figure 3, the LDA process takes all the blog data as input. These data are then passed to the preprocessing unit, where the text cleansing is done. The primary preprocessing tasks are performed such as removal of stop words, tokenization, and stemming. These blogs are converted into preprocessed documents, which are ready for further computations by the topic modeling module. Topic modeling is based on a function that computes the log probability of a task, such as
(ω|model), or a sentence, such as ω = (ω1, ω2, …, ωn). LDA is the most frequently used topic model and, owing to its probabilistic nature, it generates interpretable topics.
The topic modeling module that uses LDA as a baseline algorithm calculates the Dirichlet parameters, such as ∝ and β. The Dirichlet priors ∝ and β are the vectors that signify the average of multinomial distribution of the document and topic mixture distributions, respectively. The probability distribution of topics with respect to each location is calculated. The output is clusters of keywords, each falling into a specific topic category. These keyword clusters are then labeled with unique topics. Therefore, the output represents a list of topics from 1 to M, each containing a list of keywords from 1 to N.
Table 1 presents the LDA parameters with corresponding definitions.
4.1.2. Sentiment Analysis
There is an abundant amount of reviews available on the Internet for any specific tourist location. We have crawled data from the largest and popular review sites, that is, TripAdvisor (tripadvisor.com) and Google Recommendations (location reviews). Both of these review sites present the location reviews along with the ratings. The motivation of the platforms is to screen ranking-based content, derived from user ratings. Both have different categories of reviews, such as food, entertainment, cleanliness, fee, and value.
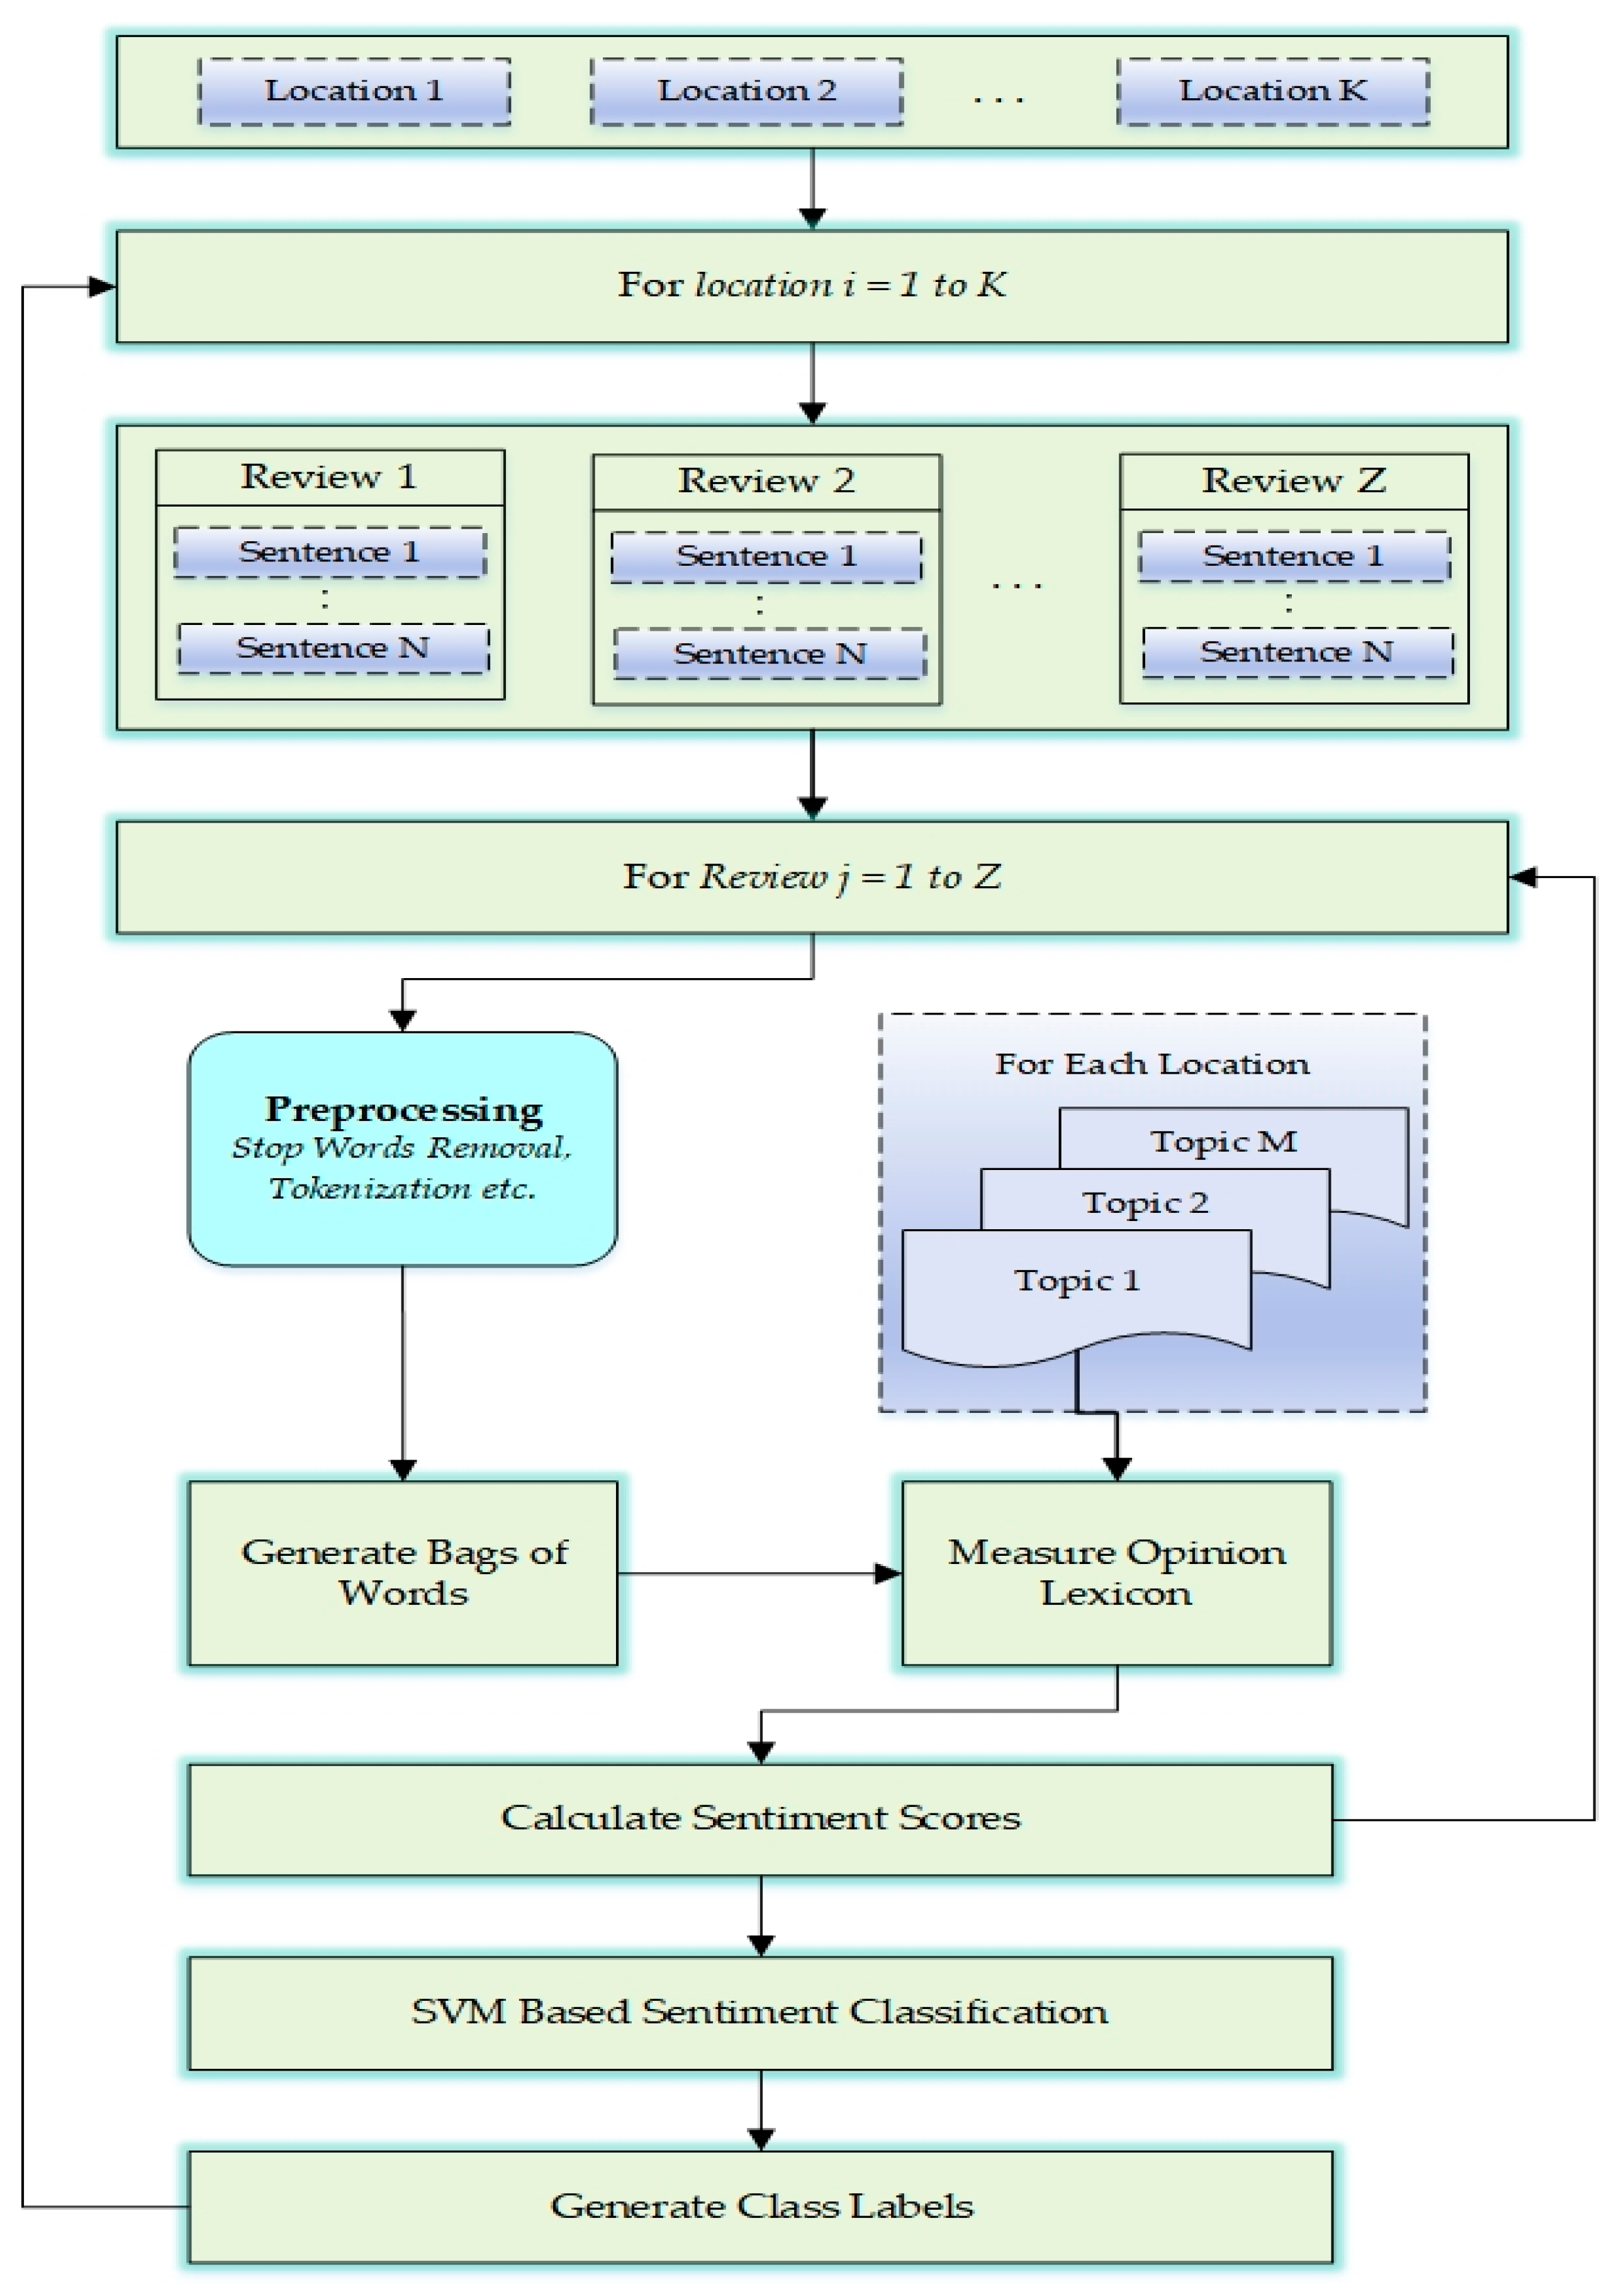
The rudimentary procedure of sentiment classification by supervised machine learning algorithms is shown in
Figure 4. We have locations as input ranging from 1 to
K. For each location, we have reviews and ratings collected from TripAdvisor and Google reviews. The location ratings are separately stored and only reviews from both sites are considered for this step. For each location, the reviews from both sources are accumulated, which results in a total number of reviews of Z. Each review is fractionalized into N sentences. Now, for each review, preprocessing is performed and bags-of-words are generated. After preprocessing, opinion lexicons are calculated. The overall process involves the following primary tasks.
Measuring Lexicons
The sentiment values of each review document are derived exclusively from the lexicon entries. Here, the lexicon entry is basically defined as a token with its tag, such as a part-of-speech (POS)-tag.
Table 2 presents some examples of identified lexicons along with their respective POS-tags. To have a more specific lexicon, we used vocabulary from the existing training data and used no other source. The results of the sentiment analysis prove the usefulness of such a highly domain-specific dictionary.
Sentiments Score Calculation
The assignment of sentiment scores can impact the effectiveness of the entire sentiment classification process. For each lexicon, we calculate a score (st), which is further processed through a series of natural language processing tasks to find its POS-tag. Then, all the similar meaning words are extracted after mapping them to their relevant POS-tags. At the final step, st is calculated as a weighted average of sentiment scores for all the similar words. We take advantage of the SentiWordNet approach, a popular lexicon-based sentiment analysis tool, to collect sentiment words.
These POS-tags are generated for the topics discovered in the topic modeling process for each location. After that, sentiment scores are calculated for each lexicon. If a score is less than zero, it is classified as negative; a zero score represents the neutral category; and a score greater than 0 is considered positive. To calculate the score, the lexicon words were looked up in the dictionary containing the emotion categories. We removed the irrelevant categories of emotions from our data. As a result, we were left with eight categories of emotions (e
N): love, excited, surprised, happy, sad, boring, angry, and disappointed, as shown in
Table 3.
SVM-Based Sentiment Classification
SVMs are a class of supervised machine learning algorithms that are generally applied to classification or regression problems. Many studies have implemented SVMs in different classification problems like reviews classification and prediction problems such as river flow forecasting [
75] or to estimate dew point temperature [
76]. SVM is a learning mechanism for classification and regression problems [
77]. It has many advantages for text classification and it works effectively while handling large features sets. Also, the performance of SVM is robust if the examples set is sparse. As SVM can be extended easily to multiple class classification by the one versus one method, it plays an important role in evaluating SVM performance. In many studies related to sentiment analysis, SVM has shown promising results [
78,
79,
80].
We used SVMs for classification as they have been proven to be highly effective as a traditional text categorization approach. In the works of [
77,
81,
82], SVM clearly showed better performance as compared with traditional methods. Also, in the work of [
82], SVM outperformed deep learning model and achieved higher accuracy. We used it to classify rest of our data, that is, reviews into emotional classes. An SVM is trained to classify labeled data by defining a separating hyperplane (q-1 dimensional hyperplane in q dimensional space) to simplify the features (q in total). This separating hyperplane divides the multi-dimensional space along with the support vector to minimize the classification error.
As we are classifying the sentiment words into multi classes, we use the ‘one versus rest’ classifier to classify the test data. The equations below for the SVM model of multiclass classification can be given as in Equations (1) and (2):
where
is the ith instance of input data and
is the output against
. The number of classes vary between 1 and
, and
is a regularization parameter used to trade-off between training error and margin sizes. The loss function is given by
, which is computed for all y in [1
]. The loss function returns 0 if the output label is same as of
, that is,
equals y, and returns 1 otherwise. The above Equations (1) and (2) are computed based on the work of [
83].
4.1.3. Measuring Popularity Index of the Location
The popularity of the location is generally measured based on visiting frequency, category of visitor, and the time spent there [
48]. We combined these features with our extended set of features to get more insight on effective trends of popularity. For under-emphasized locations, all the features are incorporated to find the popular location, even if it did not get enough promotions. Therefore, the popularity of the location is dependent on the parameters listed in
Table 4. Though there are many features relevant to a location, all of them do not have the same importance for the popularity. Also, if explanatory variables are larger in size, the chance for the model to overfit increases. Therefore, principle component analysis (PCA) is used with dimensionality reduction according to Equation (3) given below [
84]:
where
is the ith feature in the features set and
is the corresponding weight of the feature
. Here, ∑
= 1.
The reason for using PCA is to minimize the features and categorize them into parsimonious and adaptable classes. There are two key components of PCA, that is, eigenvalues and correlation coefficients. They are also known as loading factors or loading scores. Each class encompasses correlated features. Therefore, eigenvalues and loading scores are computed and values falling into a specific range are kept and others are discarded. The components with eigenvalues >1 are considered significant. Similarly, the percentage of loading scores is considered significant when it is above 75%. The rest of the features are discarded. Finally, the popularity index referred to as
is expressed using the following Equation (4) [
85]:
where
is eigenvalue of component I; and
and
are the loading scores and standardized value for index j, respectively.
All the parameters that are used to calculate the popularity index of a location are listed In
Table 4. Additional features are number of shares on social networks
(X8), number of nearby restaurants (
X12), nearby hotels (
X11) and nearby tourist locations (
X10), total likes (
X9), and number of people who has added the location into their wish list (
X13). The visitor types (
X7) can help provide accurate recommendations for the people in the same category.
4.1.4. Proximity Measures and Corresponding Mapping Tables
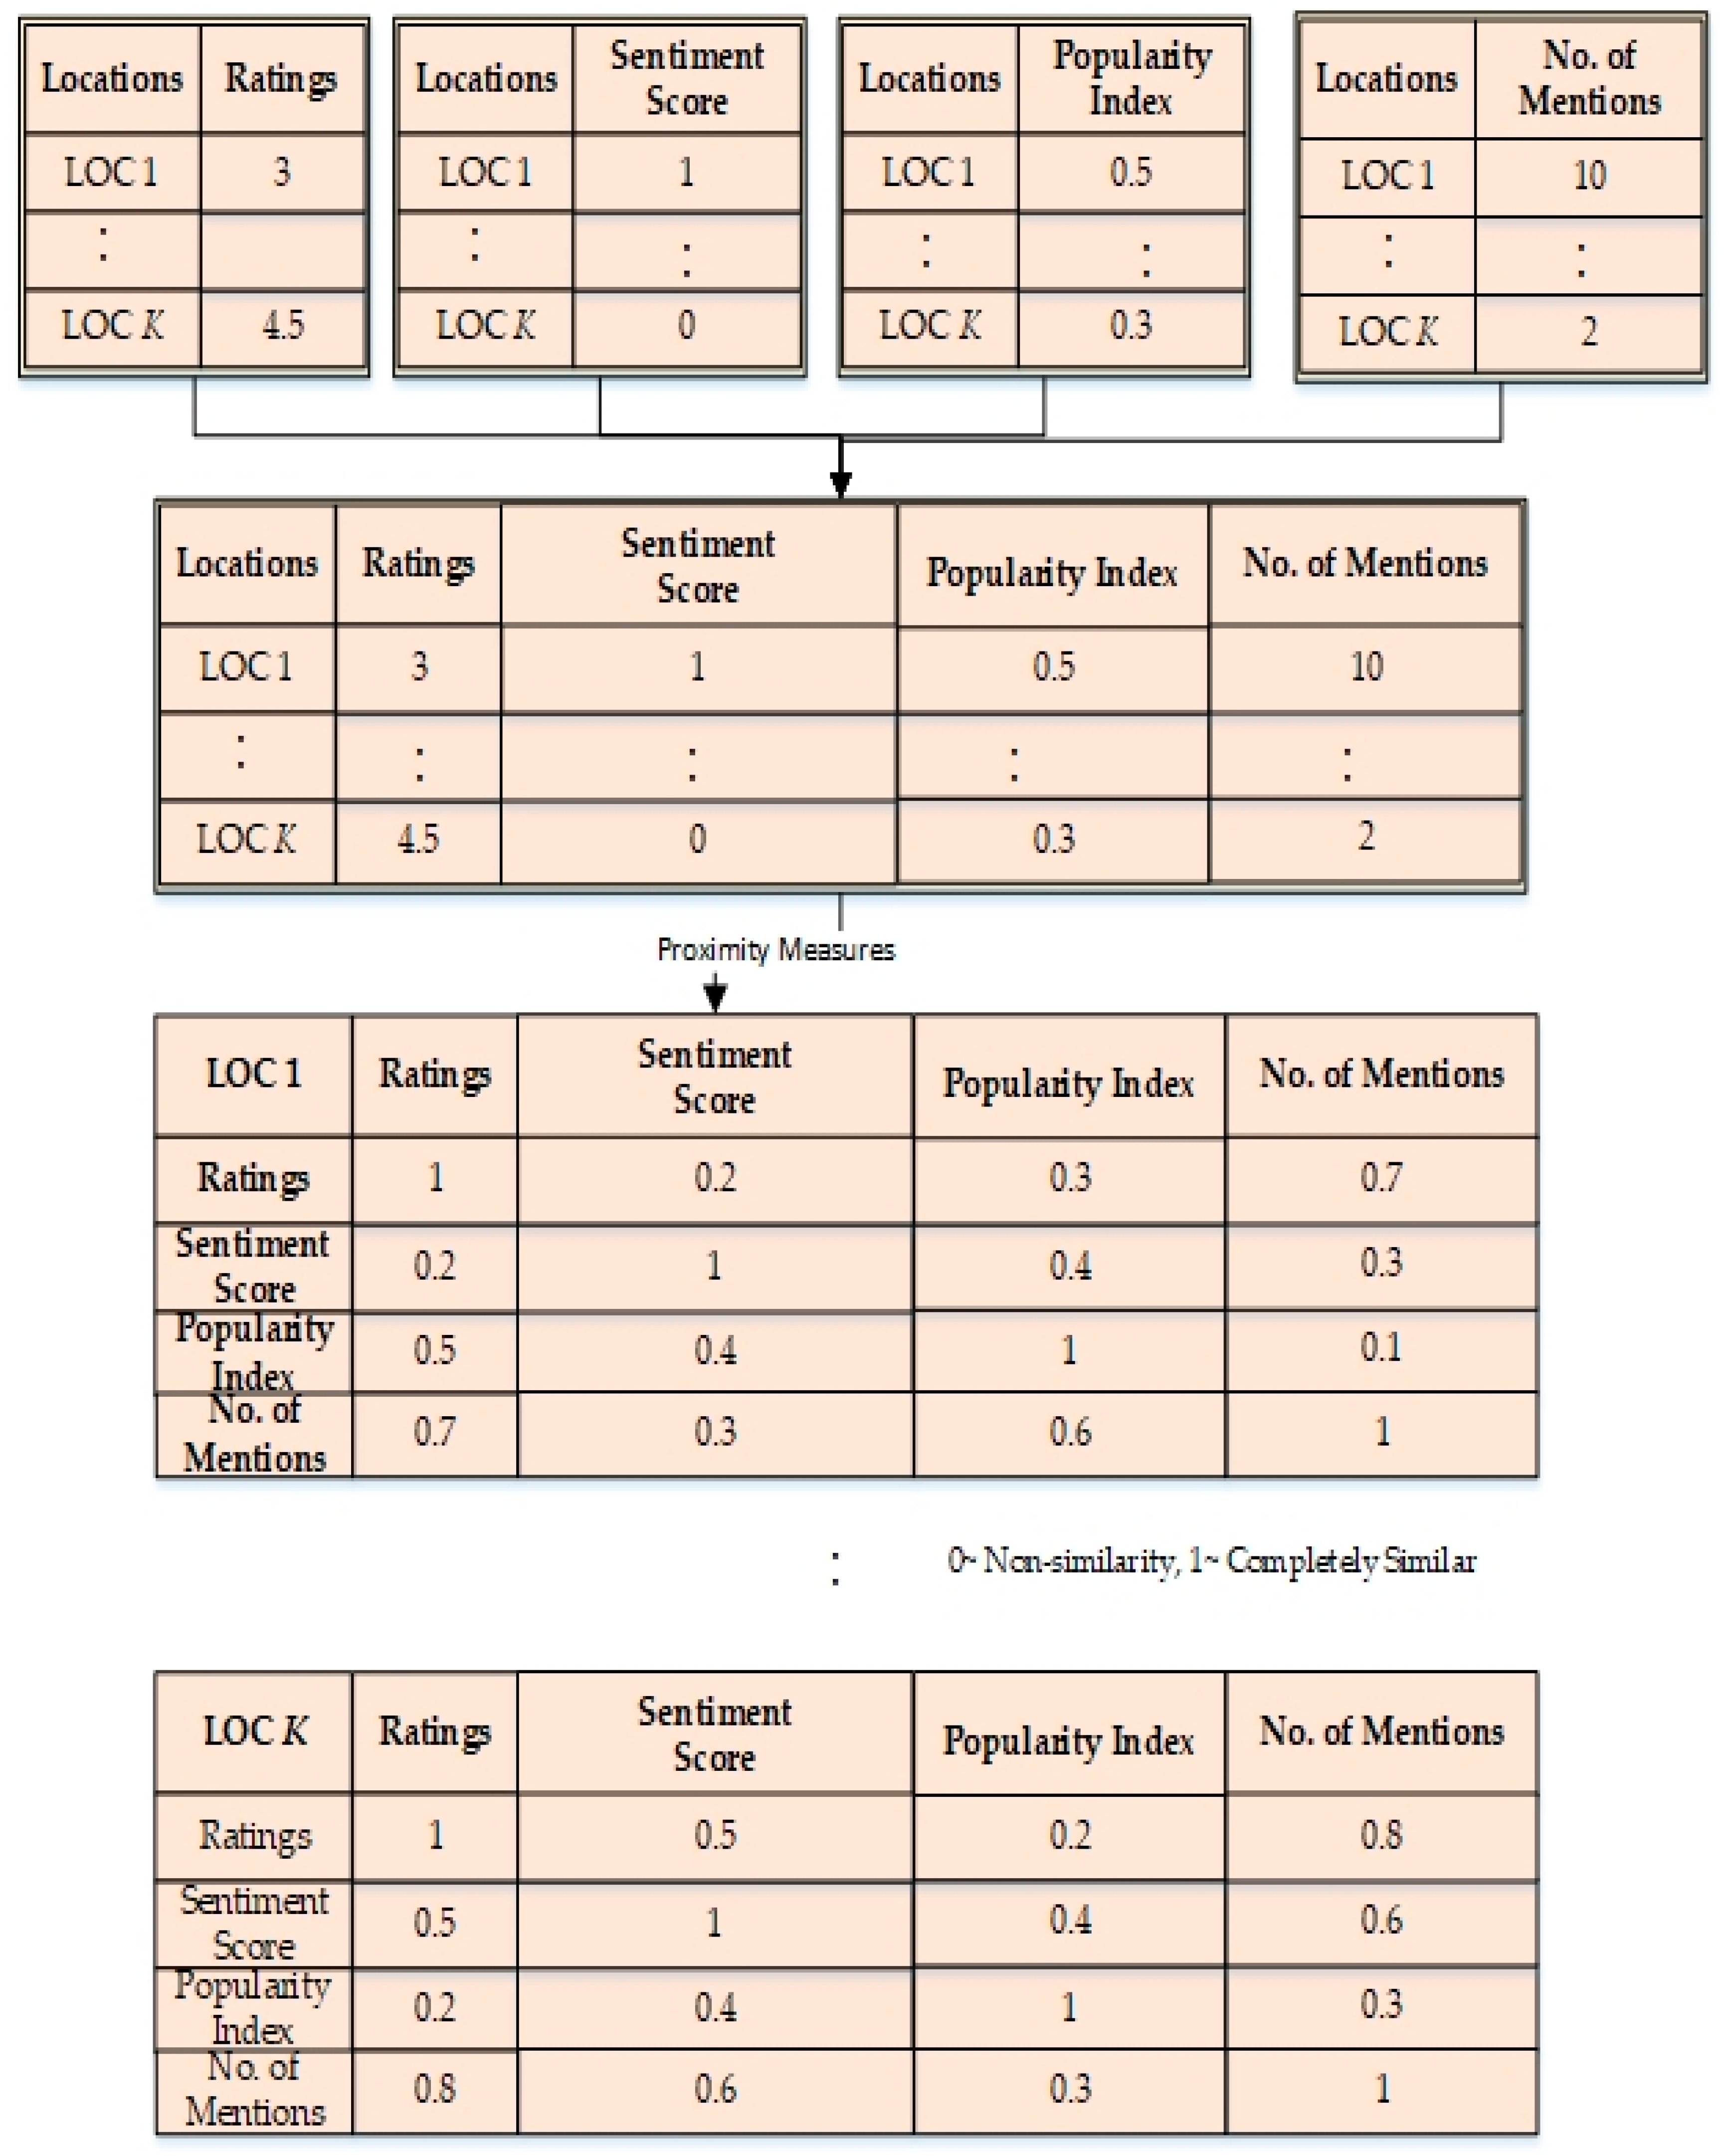
To perform recommendations for under-emphasized locations, we must compare all the relevant data sources for finding places that are worth giving a visit, but those places are not well promoted on the Internet. For this purpose, for locations 1 to K, we stored their different features in separate tables, that is, location ratings, sentiment scores based on the reviews and topics, the number of location mentions, and the popularity index of a location. The proximity measures for each location are calculated to find the similarities between different parameters of a specific location.
For the proximity measures, we used the Minkowski distance formula, which is an extension of Euclidean distance. The Minkowski distance formulas are used to calculate the distances and similarities between different information sources in order to find the optimal one. The following Equation (5) based on the Minkowski distance formula [
86] is used to measure the similarity between two points; 1 means completely similar and 0 means completely dissimilar. The
and
are two features of a location. Therefore, for any two features, distance is calculated using Equation (5):
The final cross-mapping table presents the similarity score of one point with every other point. Hence, we have
K cross-mapping functions for each location.
Figure 5 gives an idea of how the cross-mapping tables will look like. All locations are stored referred as LOC which ranges between 1 and
K. All features related to all LOCs are stored in a table. After taking the proximity measures between all features, multiple tables are generated for each LOC to compare all the features with each other.
As we are considering the similarity between any two features at a given time t, 1 means two features are completely similar. Therefore, except for the same features, all others have values less than or near to 1. A value closer to one indicates that the feature is highly similar to the given feature.
4.2. Top and Under-Emphasized Tourist Spots Recommendation Model
In this sub-section, we present a detailed methodology for the recommendation model based on the spot prediction module and an optimization module.
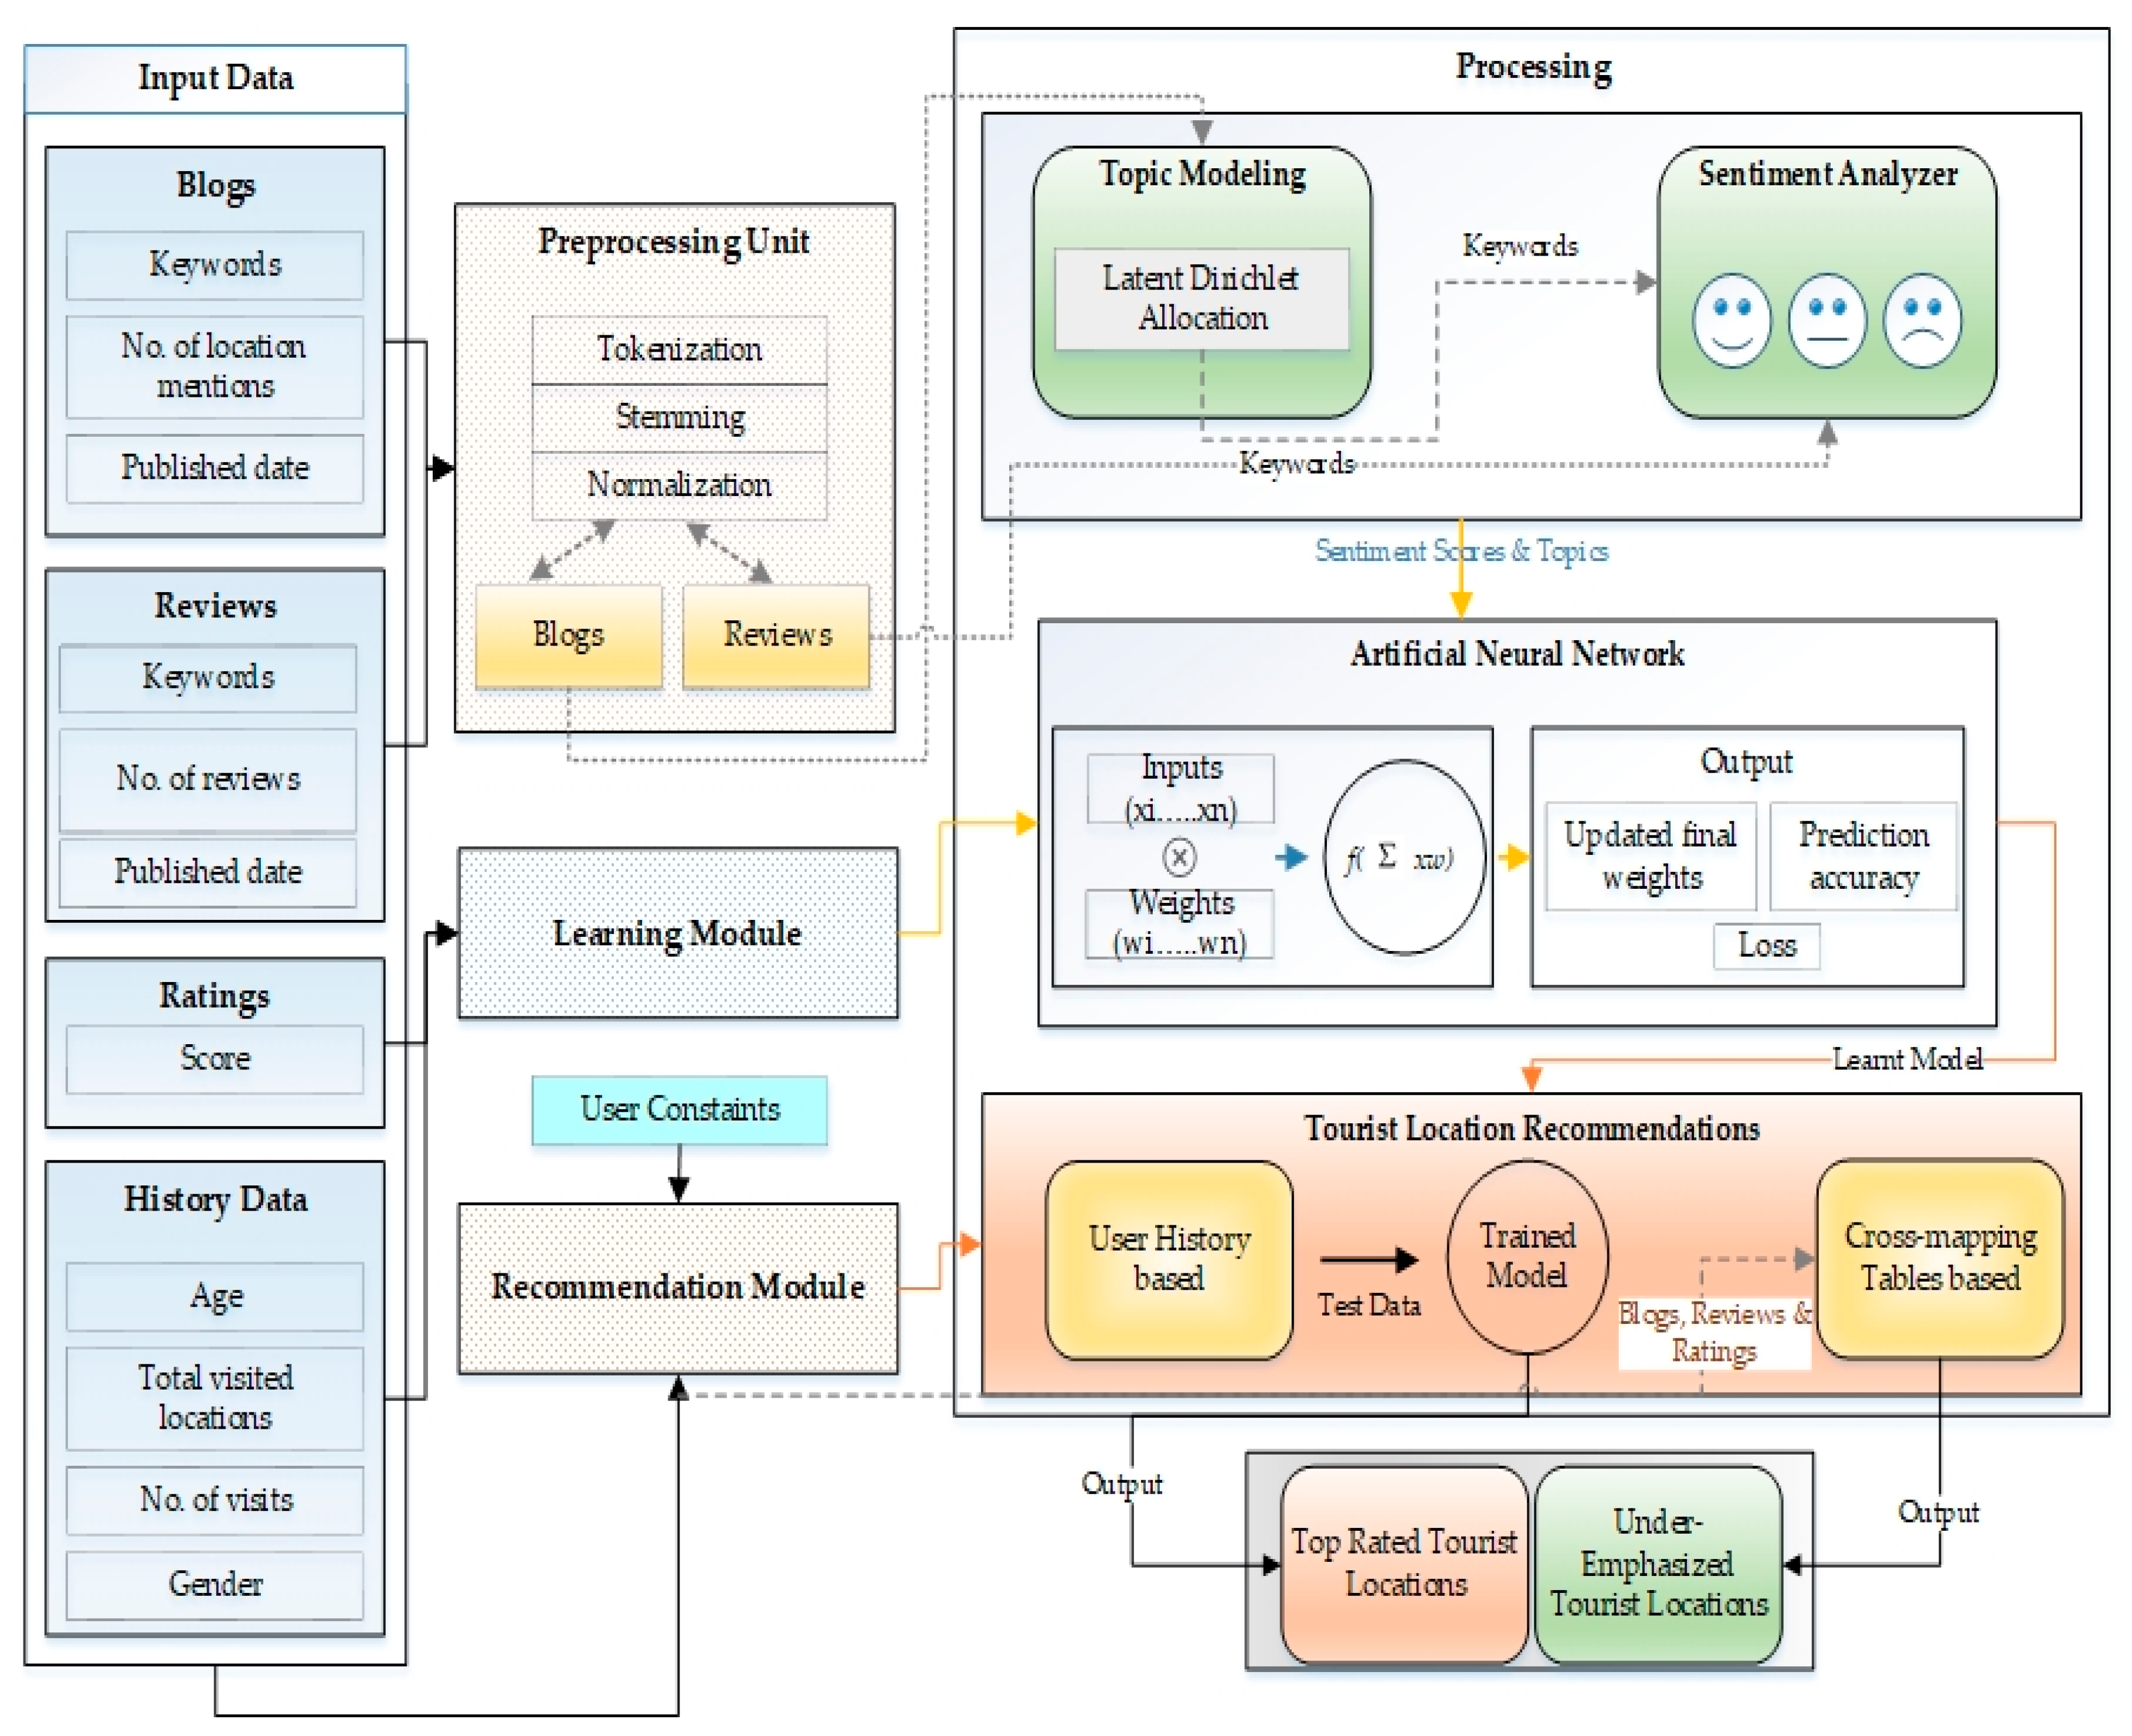
Figure 6 below presents the basic flow and formulations for an ANN-based tourist spot prediction and recommendation system. This architecture can be explained in layers. The first layer is the input layer, which incorporates all the data collected from different sources. The second layer has a preprocessing unit, a learning module, and a recommendation module. All the input data are passed to the preprocessing unit before the ANN training. Once processed, the data are forwarded to their respective modules, for example, blog data are passed to the topic modeling module, which generates latent topics and keywords. These keywords along with the sentiment scores of the reviews are passed to ANN.
All the inputs are merged and weights are assigned for the network training, which results in a learned model. After this, the test data are passed to the recommendation module, which can present two types of recommendations, the top-rated tourist locations and the under-emphasized locations.
4.3. Optimization Objective Function
As we aim to recommend under-emphasized locations for a healthier tourist experience, we need to formulate an objective function that can optimally select those locations that are not just top-ranked, but also worth visiting regardless of their publicity level. Different factors can have a positive or negative effect on the tourist location recommendation. The objective function aims to incorporate these factors to generate the best location profiles. For this purpose, the optimization function does the following:
Maximizes the factors that have a positive influence on effective and accurate tourist location recommendations. In our scenario, such factors include popularity index (
), final rating of the location calculated after taking average of ratings on different platforms and expressed as (
, final sentiment score of the location based on all the reviews and blogs topics
), total mentions of the location (
), and working hours
. α, β, γ, ω, and ϕ are the corresponding weights of these factors, respectively. Thus, we have formulated our maximization function given as
in Equation (6):
Minimizes the effect of factors that can negatively impact a location’s profile, and such factors include travel time towards the location referred as
, the time of the article or relevant blog posts on the internet referred as
and the location’s entrance fee referred as
. The corresponding weights against each factor are given by α1, β1, and γ1. Thus, we have formulated our minimization function given as
in Equation (7):
From Equations (6) and (7), we can say that
Therefore, from Equation (8) we can define the
function in Equation (9):
By combining all the above equations and fulfilling the requirements of the objective function, we define the objective function for optimized recommendations as given in Equation (10):
Here, Wi is the weight assigned to the weather of the ith tourist location. We accessed OpenWeatherMap application program interface (API) to discover the current weather situation of the location. If there is rain at the location, the value of W is 1, otherwise it is 0. If the result of the above objective function is positive, then it is a highly probable and decent place to be recommended. A higher value of the objective function for a location means it is the most suitable location to be visited.
5. Implementation and Testing Environment
In this section, we discuss our implementation environment in detail. This section includes experimental setup details, explanation of data collection process and data description, and the model structure.
5.1. Experimental Setup
The experimental setup is summarized in
Table 5. The core system components include a long-term support (LTS) version of Ubuntu 18.04.1 as an operating system, with 32 Gb memory, and graphics processing unit (GPU) is Nvidia GForce 1080. The implementation is done in Python language along with Tensorflow API.
5.2. Experimental Data
The details for the experimental data are presented in
Table 6. For all experiments, we divided the data into 70% training data and 30% testing data. The total number of locations was 94, with a total of 147,834 reviews, and 150 top relevant blogs.
6. Results
This section presents the results and analysis for tourist location predictions and recommendations both for top-rated and under-emphasized locations. In
Section 6.1, we present results related to LDA-based topic modeling for the travel blogs. In
Section 6.2, SVM-based sentiment classification results are presented. In
Section 6.3, the top and worst rated locations are discussed, followed by a comparison of prediction accuracies of under-emphasized locations in
Section 6.4.
6.1. Topic Modeling in Tourist Blogs
As proposed earlier, our text analysis module aims to find the top themes or topics in any travel blog. We applied the LDA model to the travel blog data. For experiments, we extracted the top 150 blogs on Jeju tourism. After the preprocessing, LDA was run to identify the topic clusters. These clusters were then labeled into different topics. We described the top 11 topics discovered from the given blogs in
Table 7. These topics include
Locations, Timings, Food, Weather, Entertainment, Environment, Accommodations, Transportation, Expense, Services, and
Rent-a-Car. The redundant topics were eliminated. Many bloggers have mentioned and talked about renting a car in Jeju and about how to travel by driving yourself. This is the very reason we dedicated a separate topic class for this service labeled as Rent-a-Car.
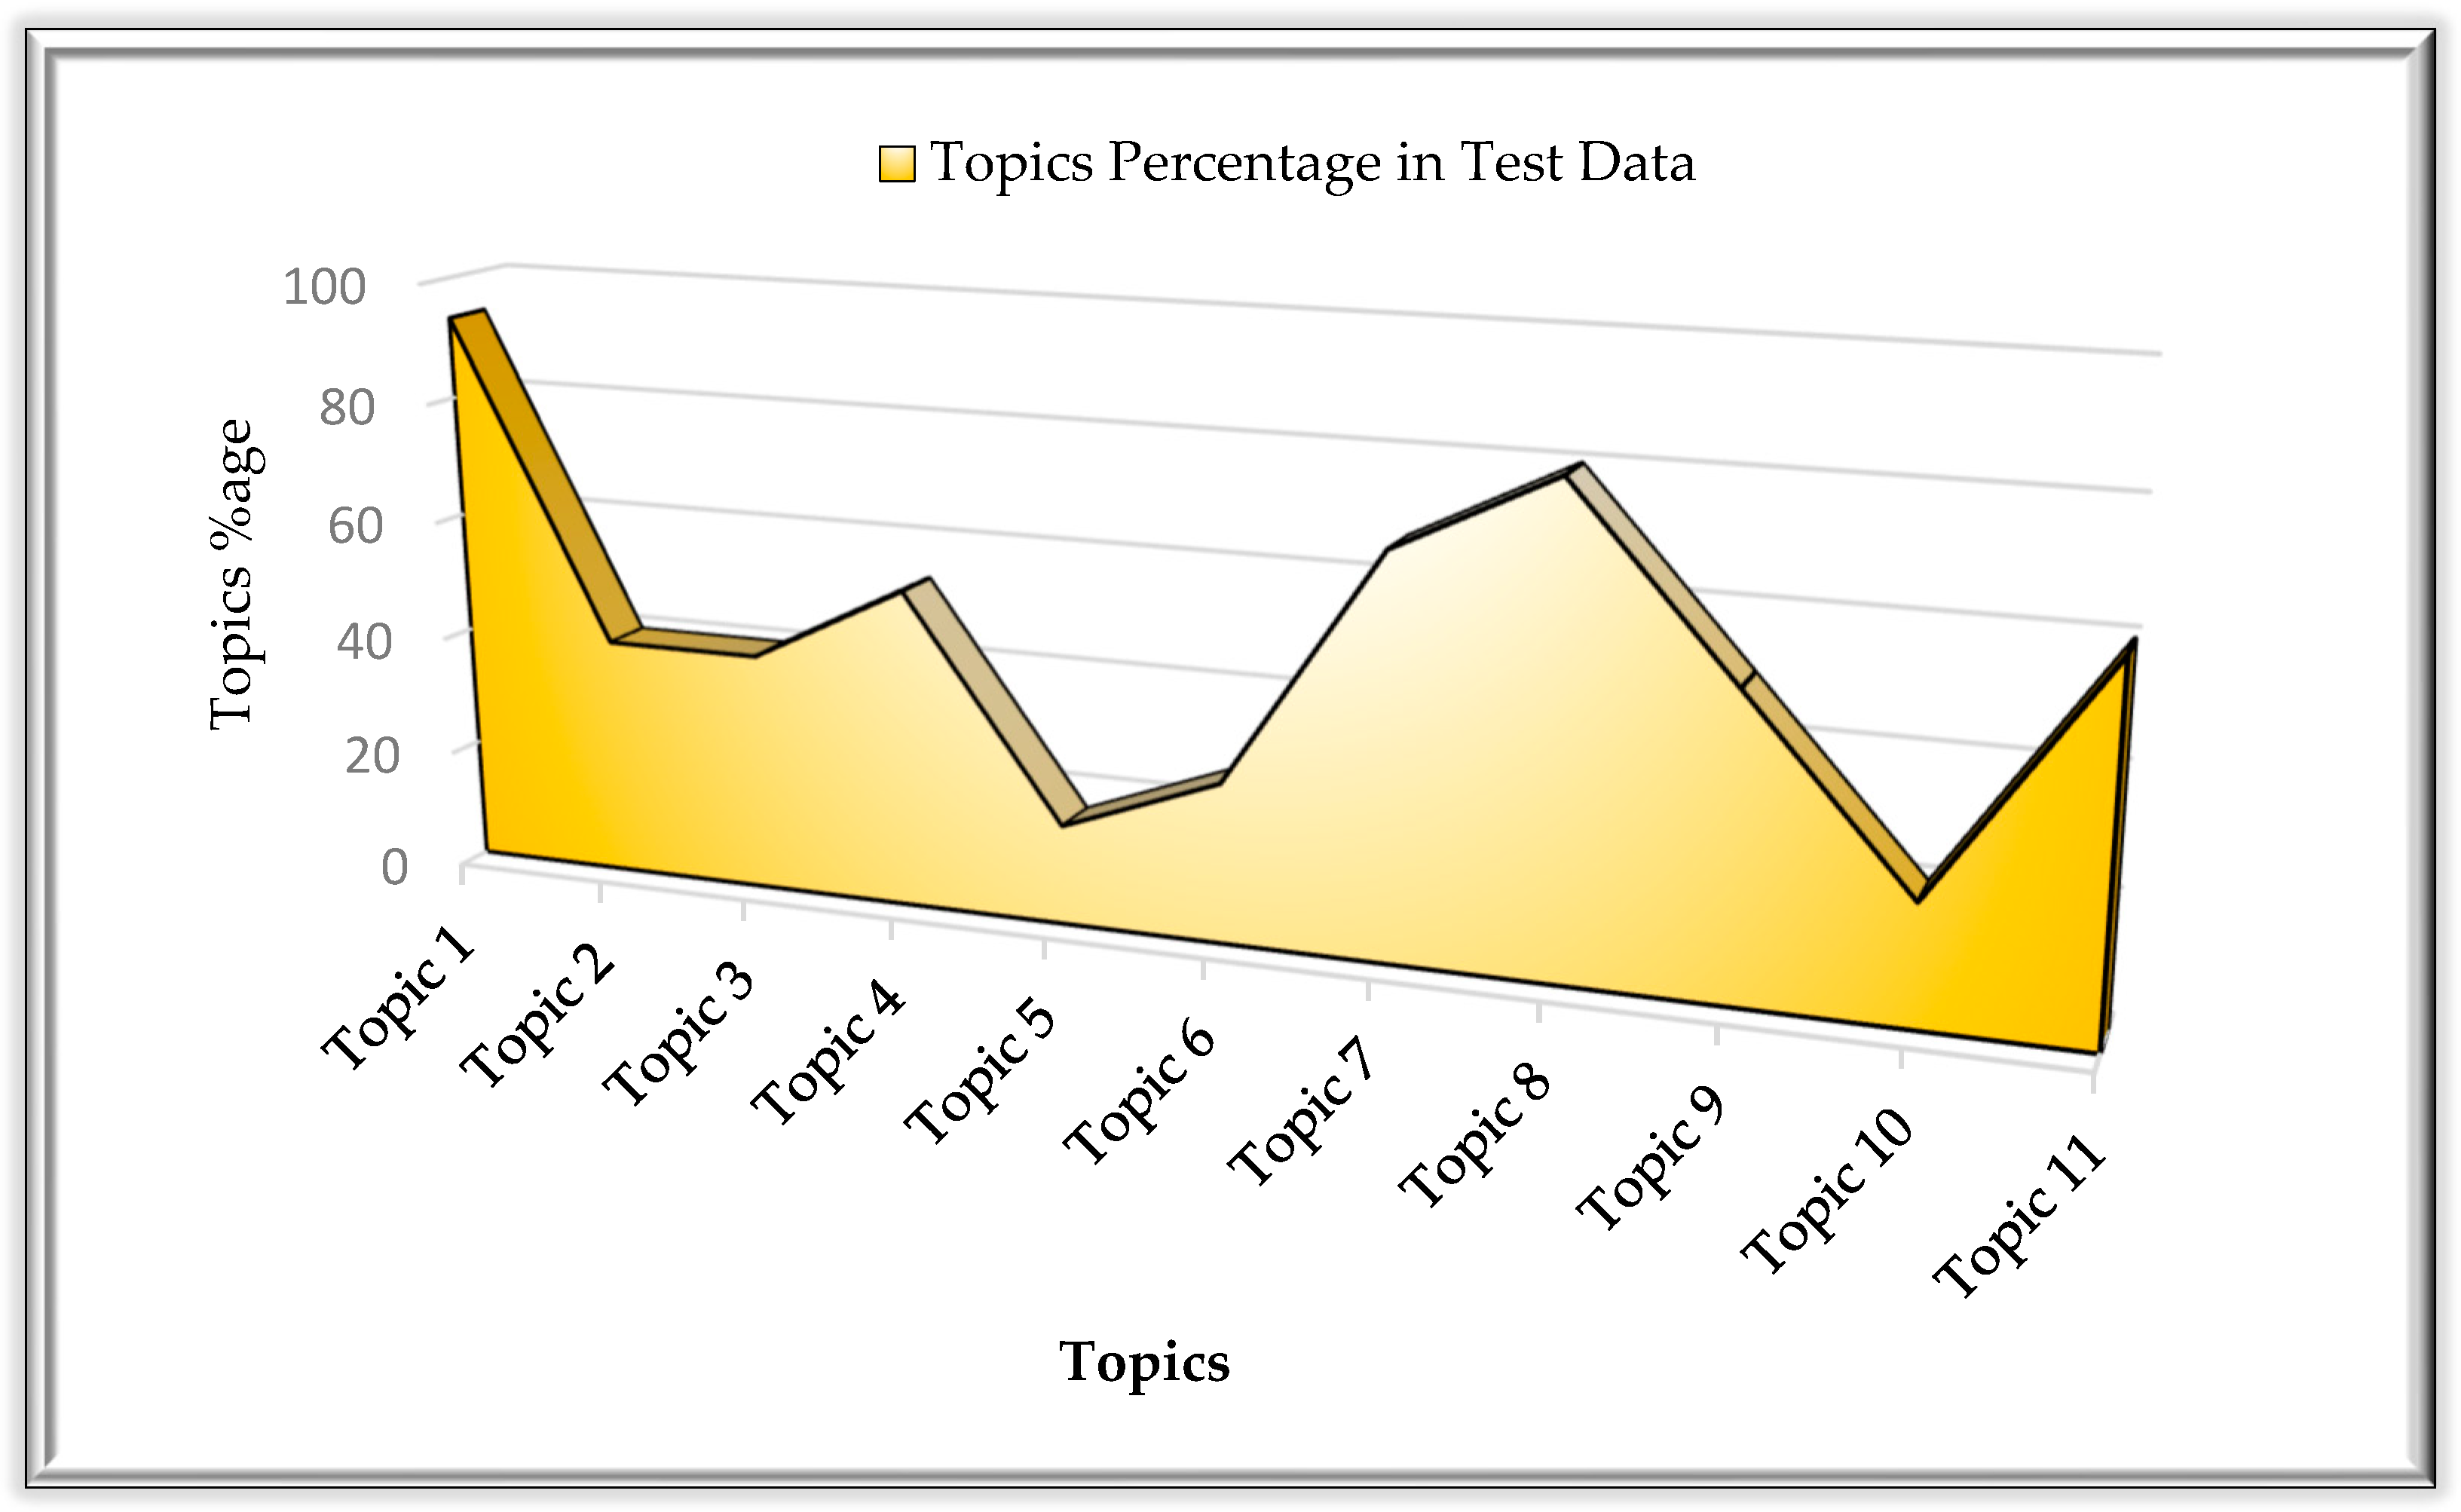
The following graph presented in
Figure 7 demonstrates the percentage of each topic in the test data. We can observe that most of the bloggers covered the tourist locations they visited and the accommodations in detail, but overlooked other factors such as entertainment, food, weather, services, and environment.
6.2. SVM-Based Sentiment Classification
For sentiment classification, we trained our SVM model on reviews and keywords related to each location.
The graph shown in
Figure 8 presents the results of sentiment classification based on the locations collected from the data mappings. These mappings are generated by comparing the total number of reviews against the percentage of each basic sentiment class. There are three basic sentiment classes; positive, neutral, and negative. Therefore, we can observe that the under-emphasized attractions have mostly positive reviews with very few or near to zero negative reviews.
6.3. Top- and Worst-Rated Tourists Attractions
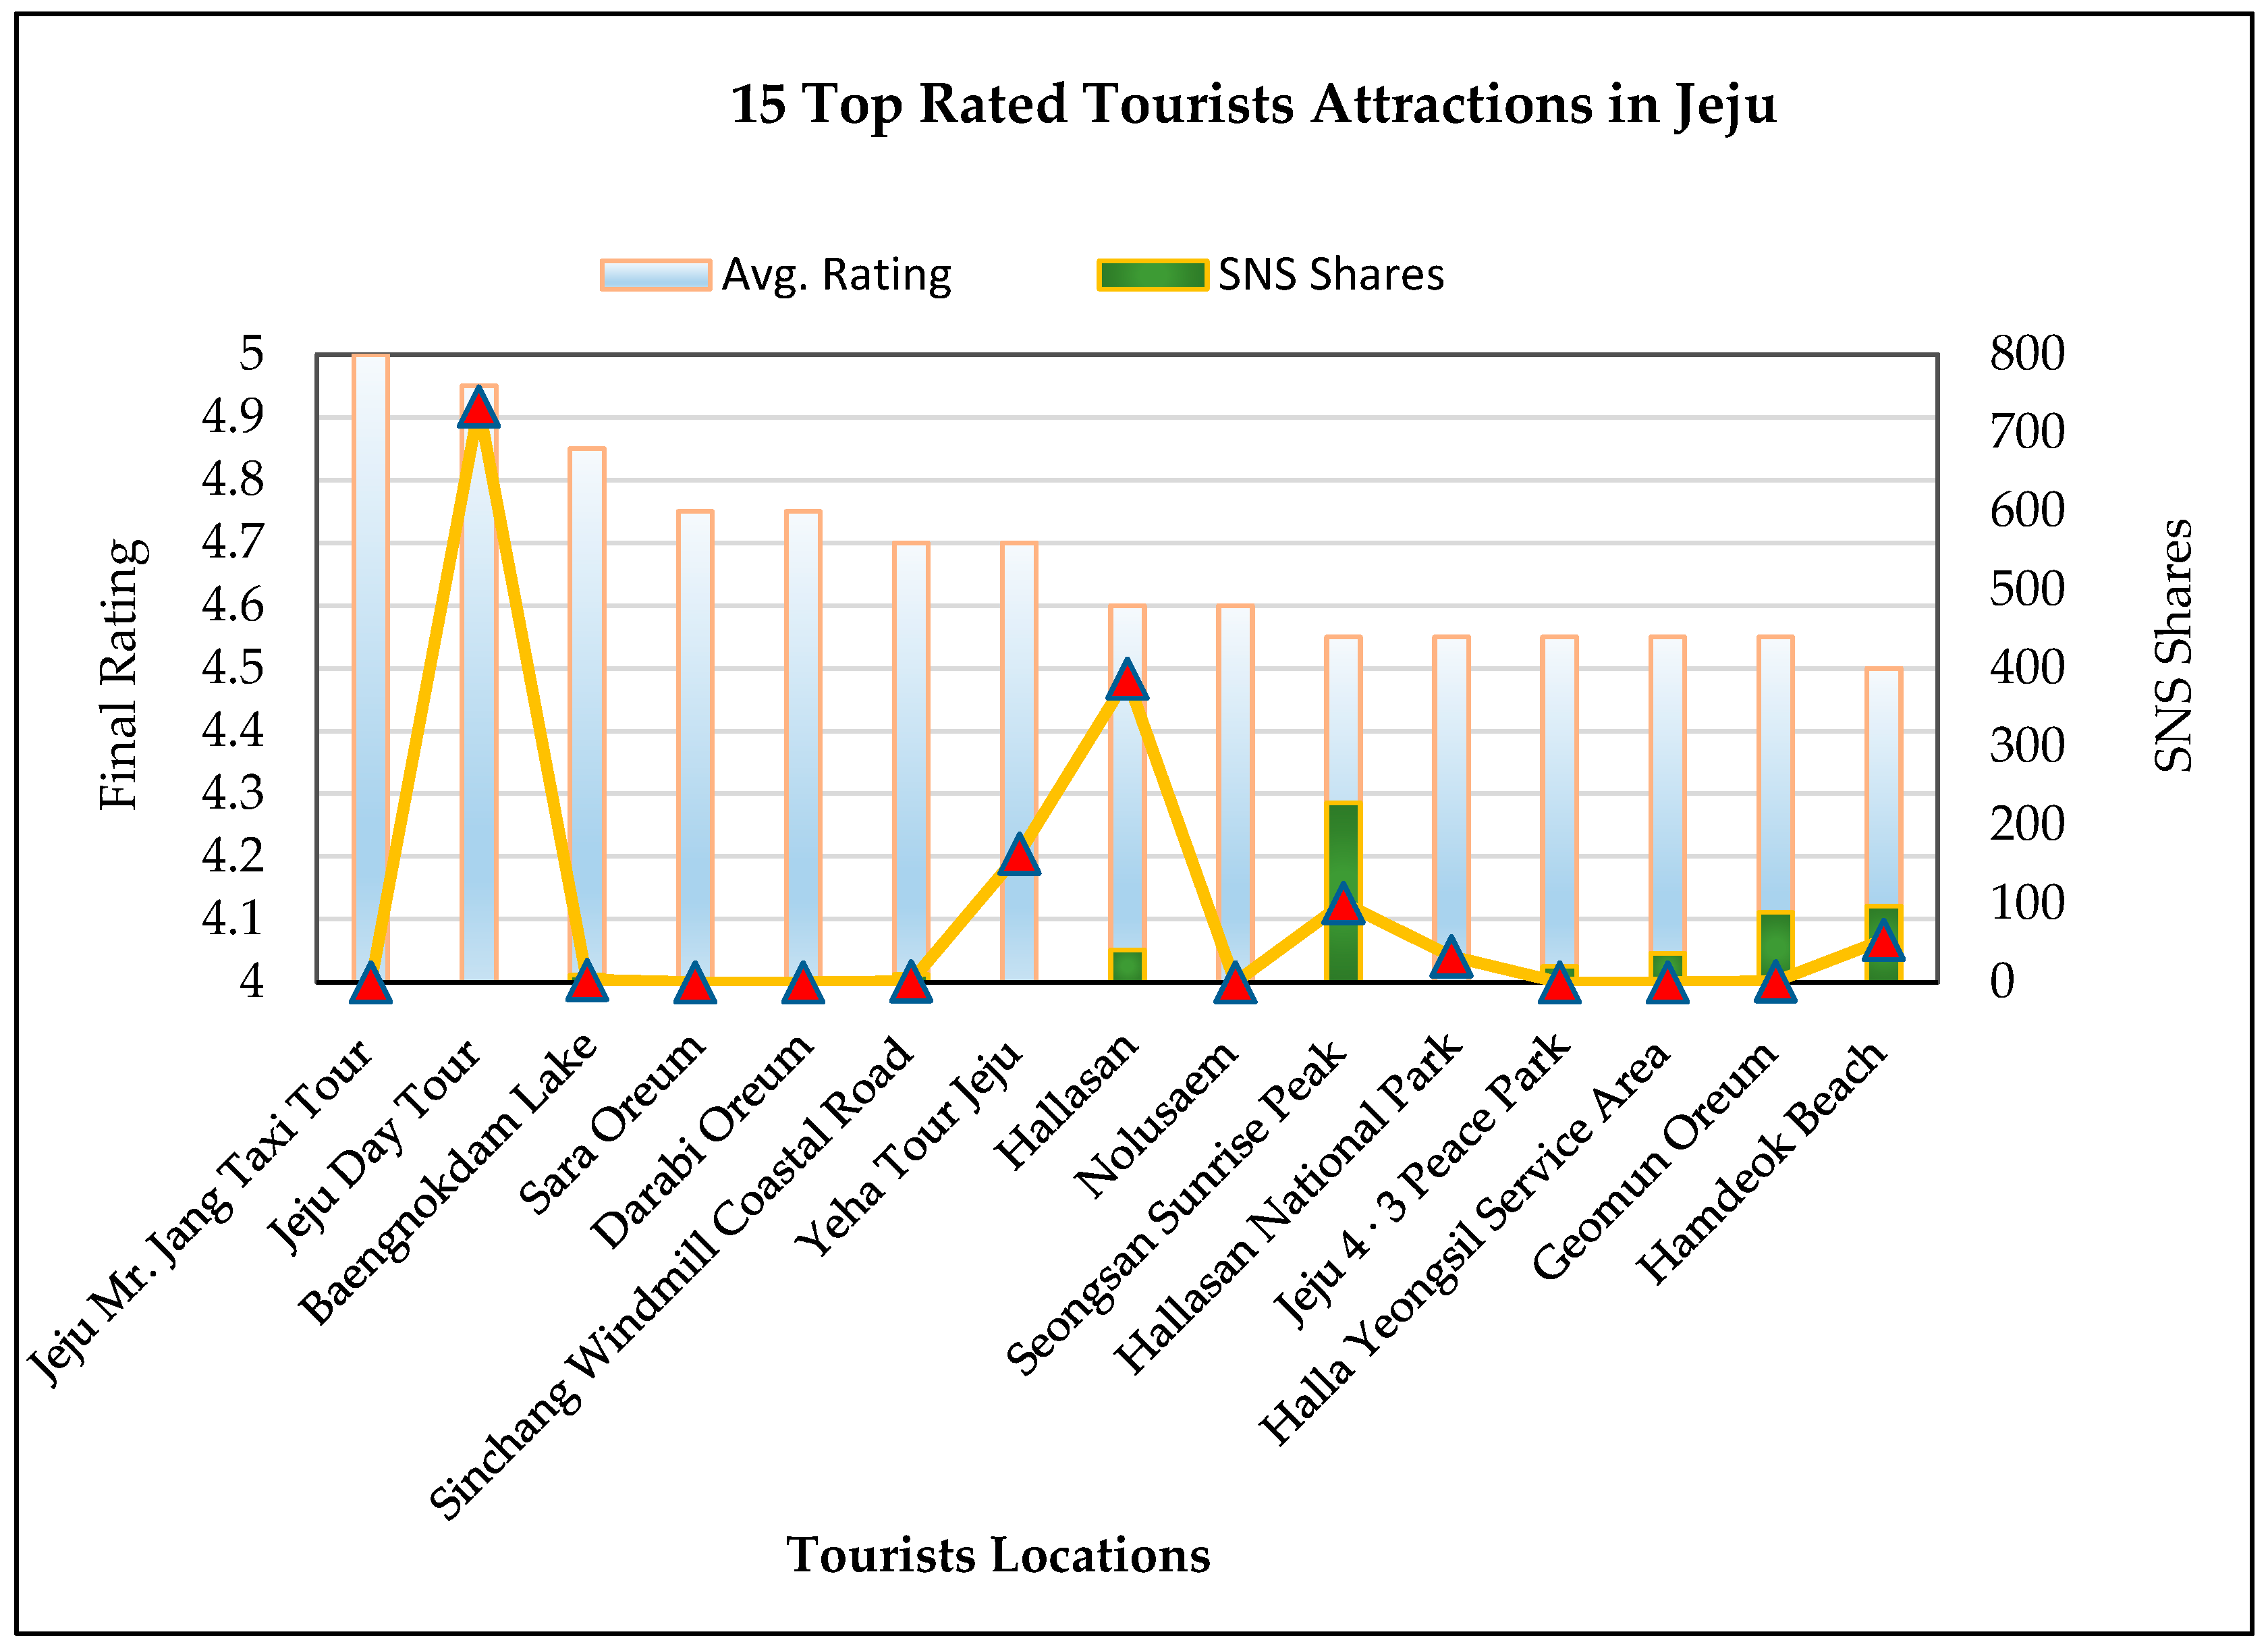
In the following
Figure 9, the trend for the top 15 tourists’ attractions is presented based on their SNS shares, final ratings, and number of mentions for each location. The SNS shares are the number of times a location has been shared on other social media networks, and the final rating is the average of all the recorded ratings.
We can perceive that most of the locations failed to have a high number of mentions regardless of having high ratings. In other words, we can say that the top-rated activities or locations are not well advertised, except Hallasan and Jeju day tour. As Hallasan is undoubtedly the top attraction in Jeju and is highly promoted on different forums, that is why the number of mentions is very high. For Jeju day tour, there can be two reasons for the high number of mentions; either it is very well endorsed or it is a very casual term that can be used by tourists. Jeju Mr. Jang Taxi tour and other locations such as Nolusaem, Sara Oreum, Darabi Oreum, and Baengnokdam lake need to be endorsed in a more effective and interesting manner, to attract more tourists toward these places.
In the following
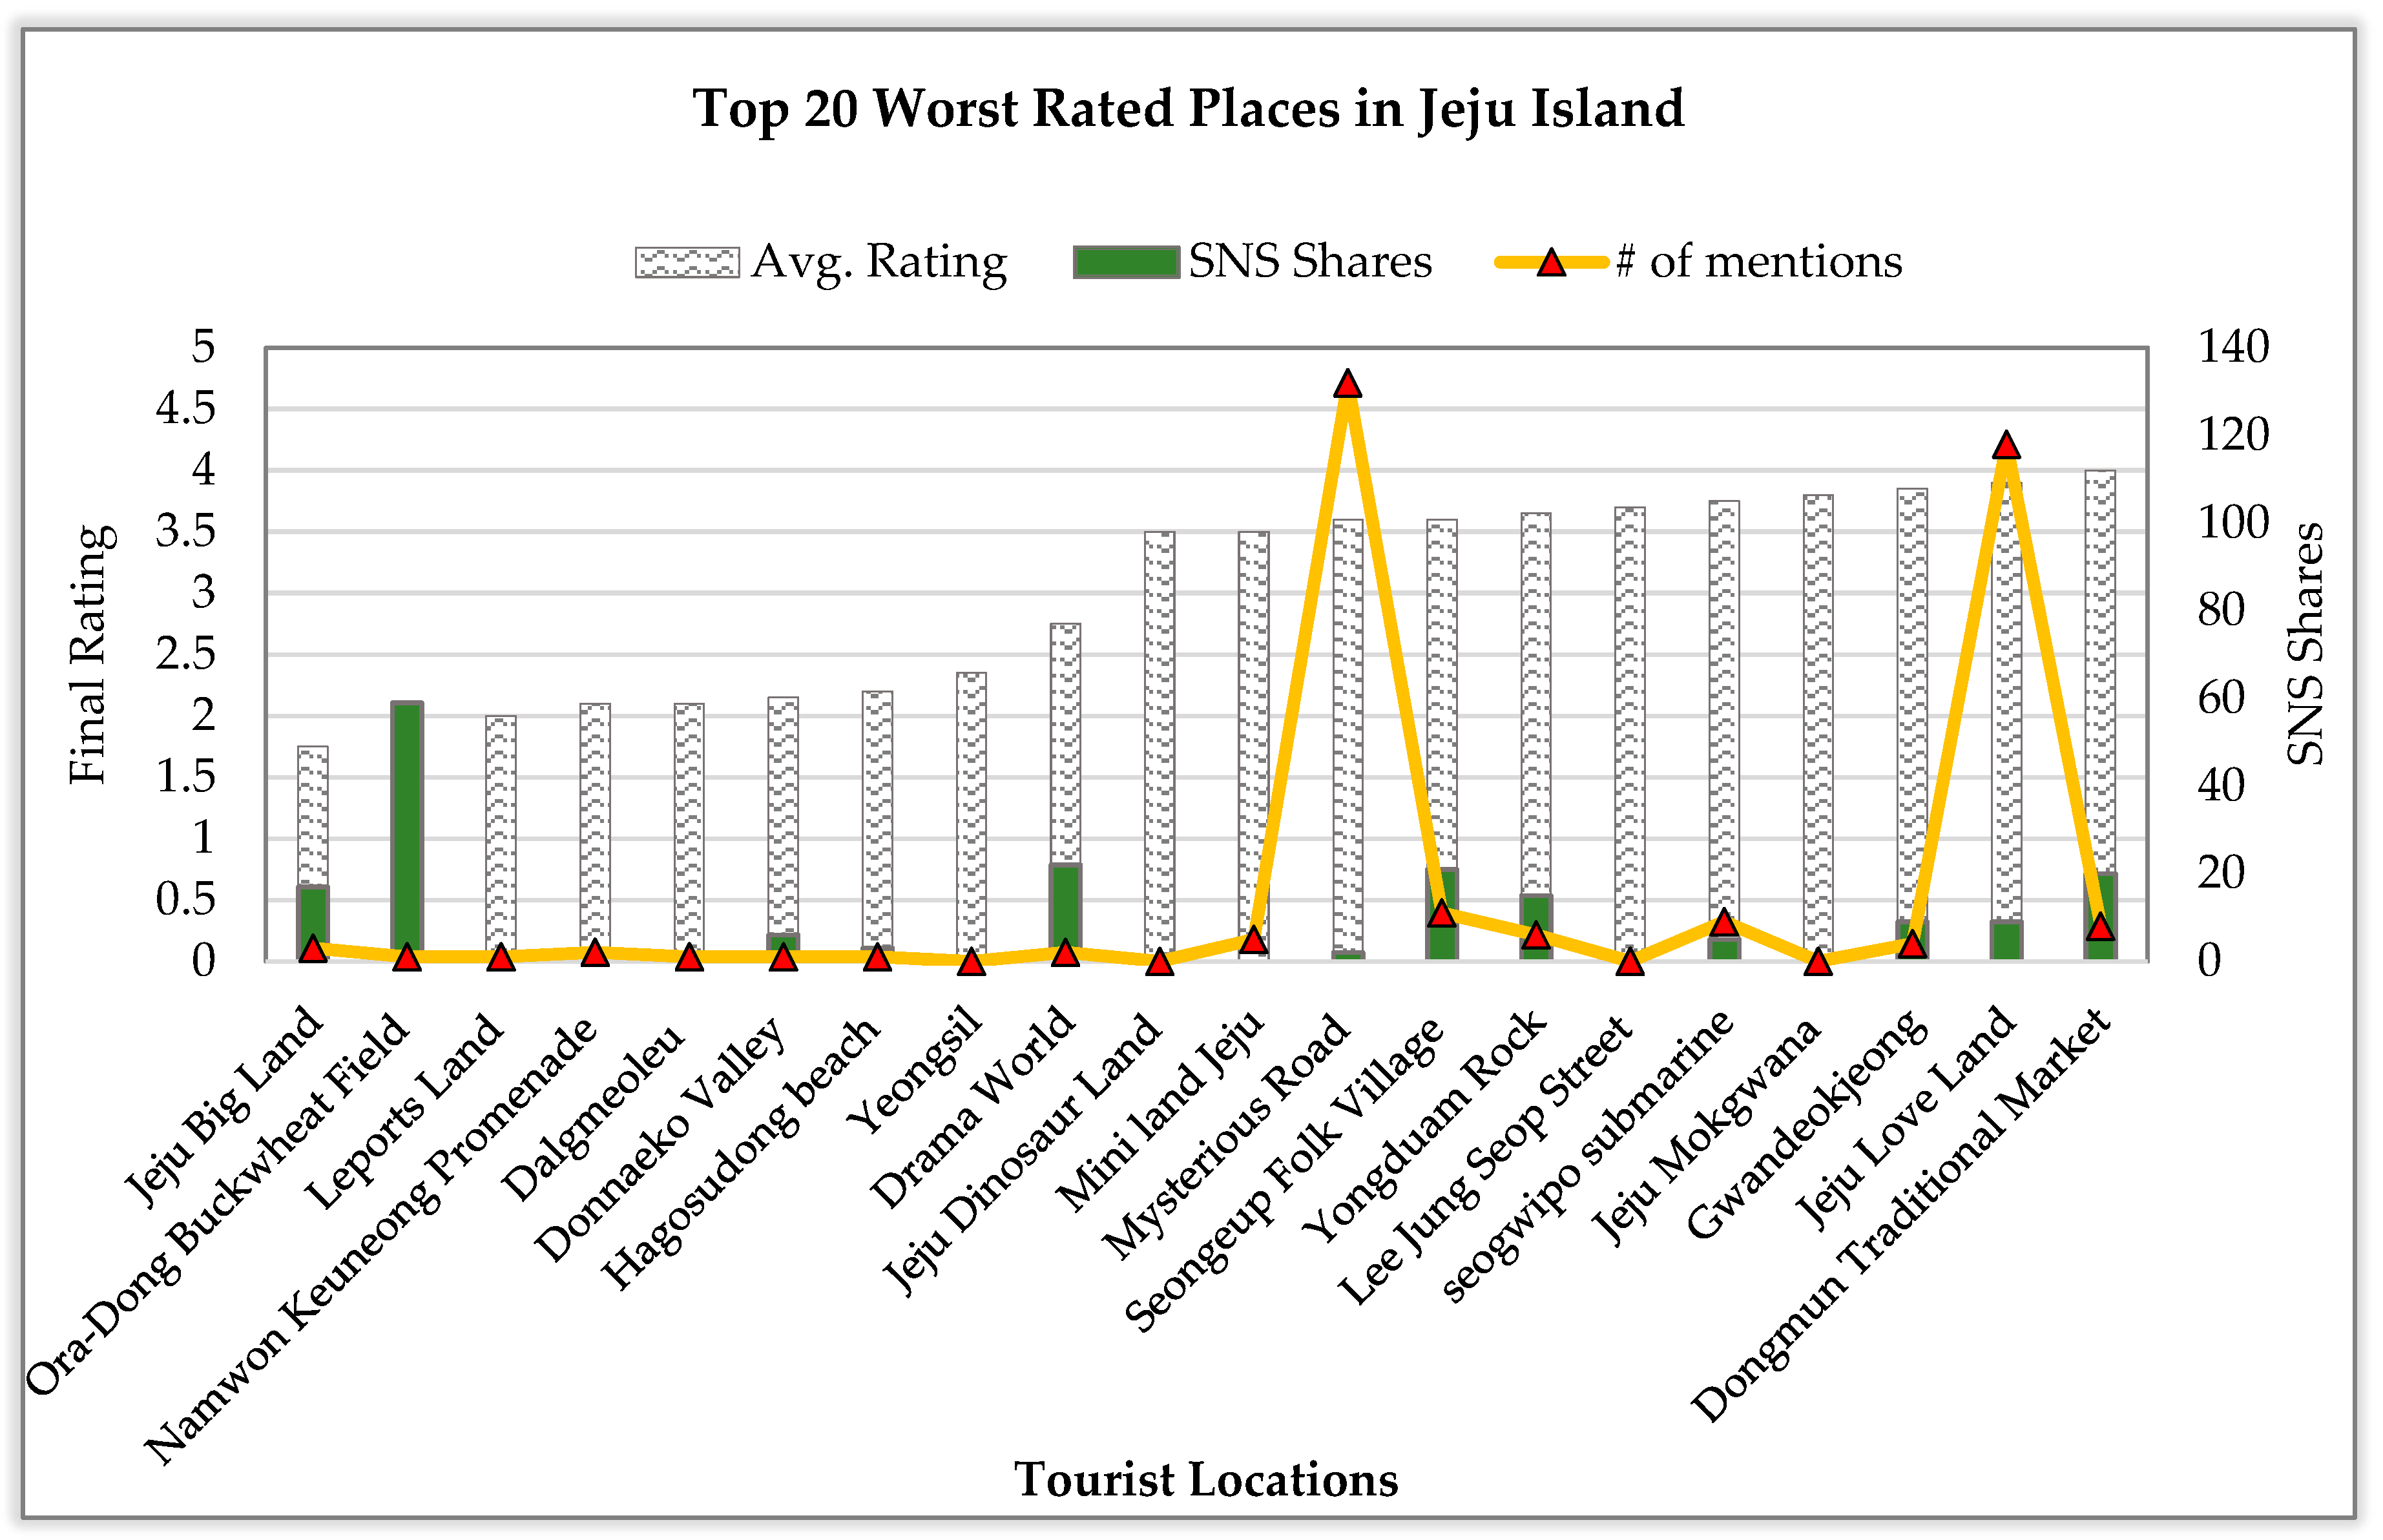
Figure 10, the trend for the top 20 worst-rated attractions is presented based on their SNS shares, final ratings, and number of mentions for each location.
Regardless of the low ratings, locations like Mysterious road, Love Land, and so on got a higher number of mentions. The reason behind it is that, when you search for tourists’ places to visit in Jeju, these two places are among the highly mentioned places by others.
The average rating and SNS shares for both places are comparatively less, indicating that, although these places are very well advertised and promoted, they are now failing to amuse the tourists. This trend can help these tourists’ sites to improve the tourist spots and bring some interesting dimensions to them by adding more activities to increase tourist involvement.
6.4. Predicting Under-Emphasized Locations
Here, we investigated and performed experiments with different tunings of the proposed system.
We did a comparison of our system by training it with different parameters or features. We first experimented on our recommendation system based on LDA feature only, that is, topics and keywords. Then, we used SVM classification and ratings, separately.
Then, we trained our model with different combinations of these features, that is, LDA features combined with ratings, ratings combined with SVM features, and SVM with LDA and ratings. The recorded prediction accuracies are comparatively higher when different features are combined, as shown in
Figure 11.
6.5. Testing Error
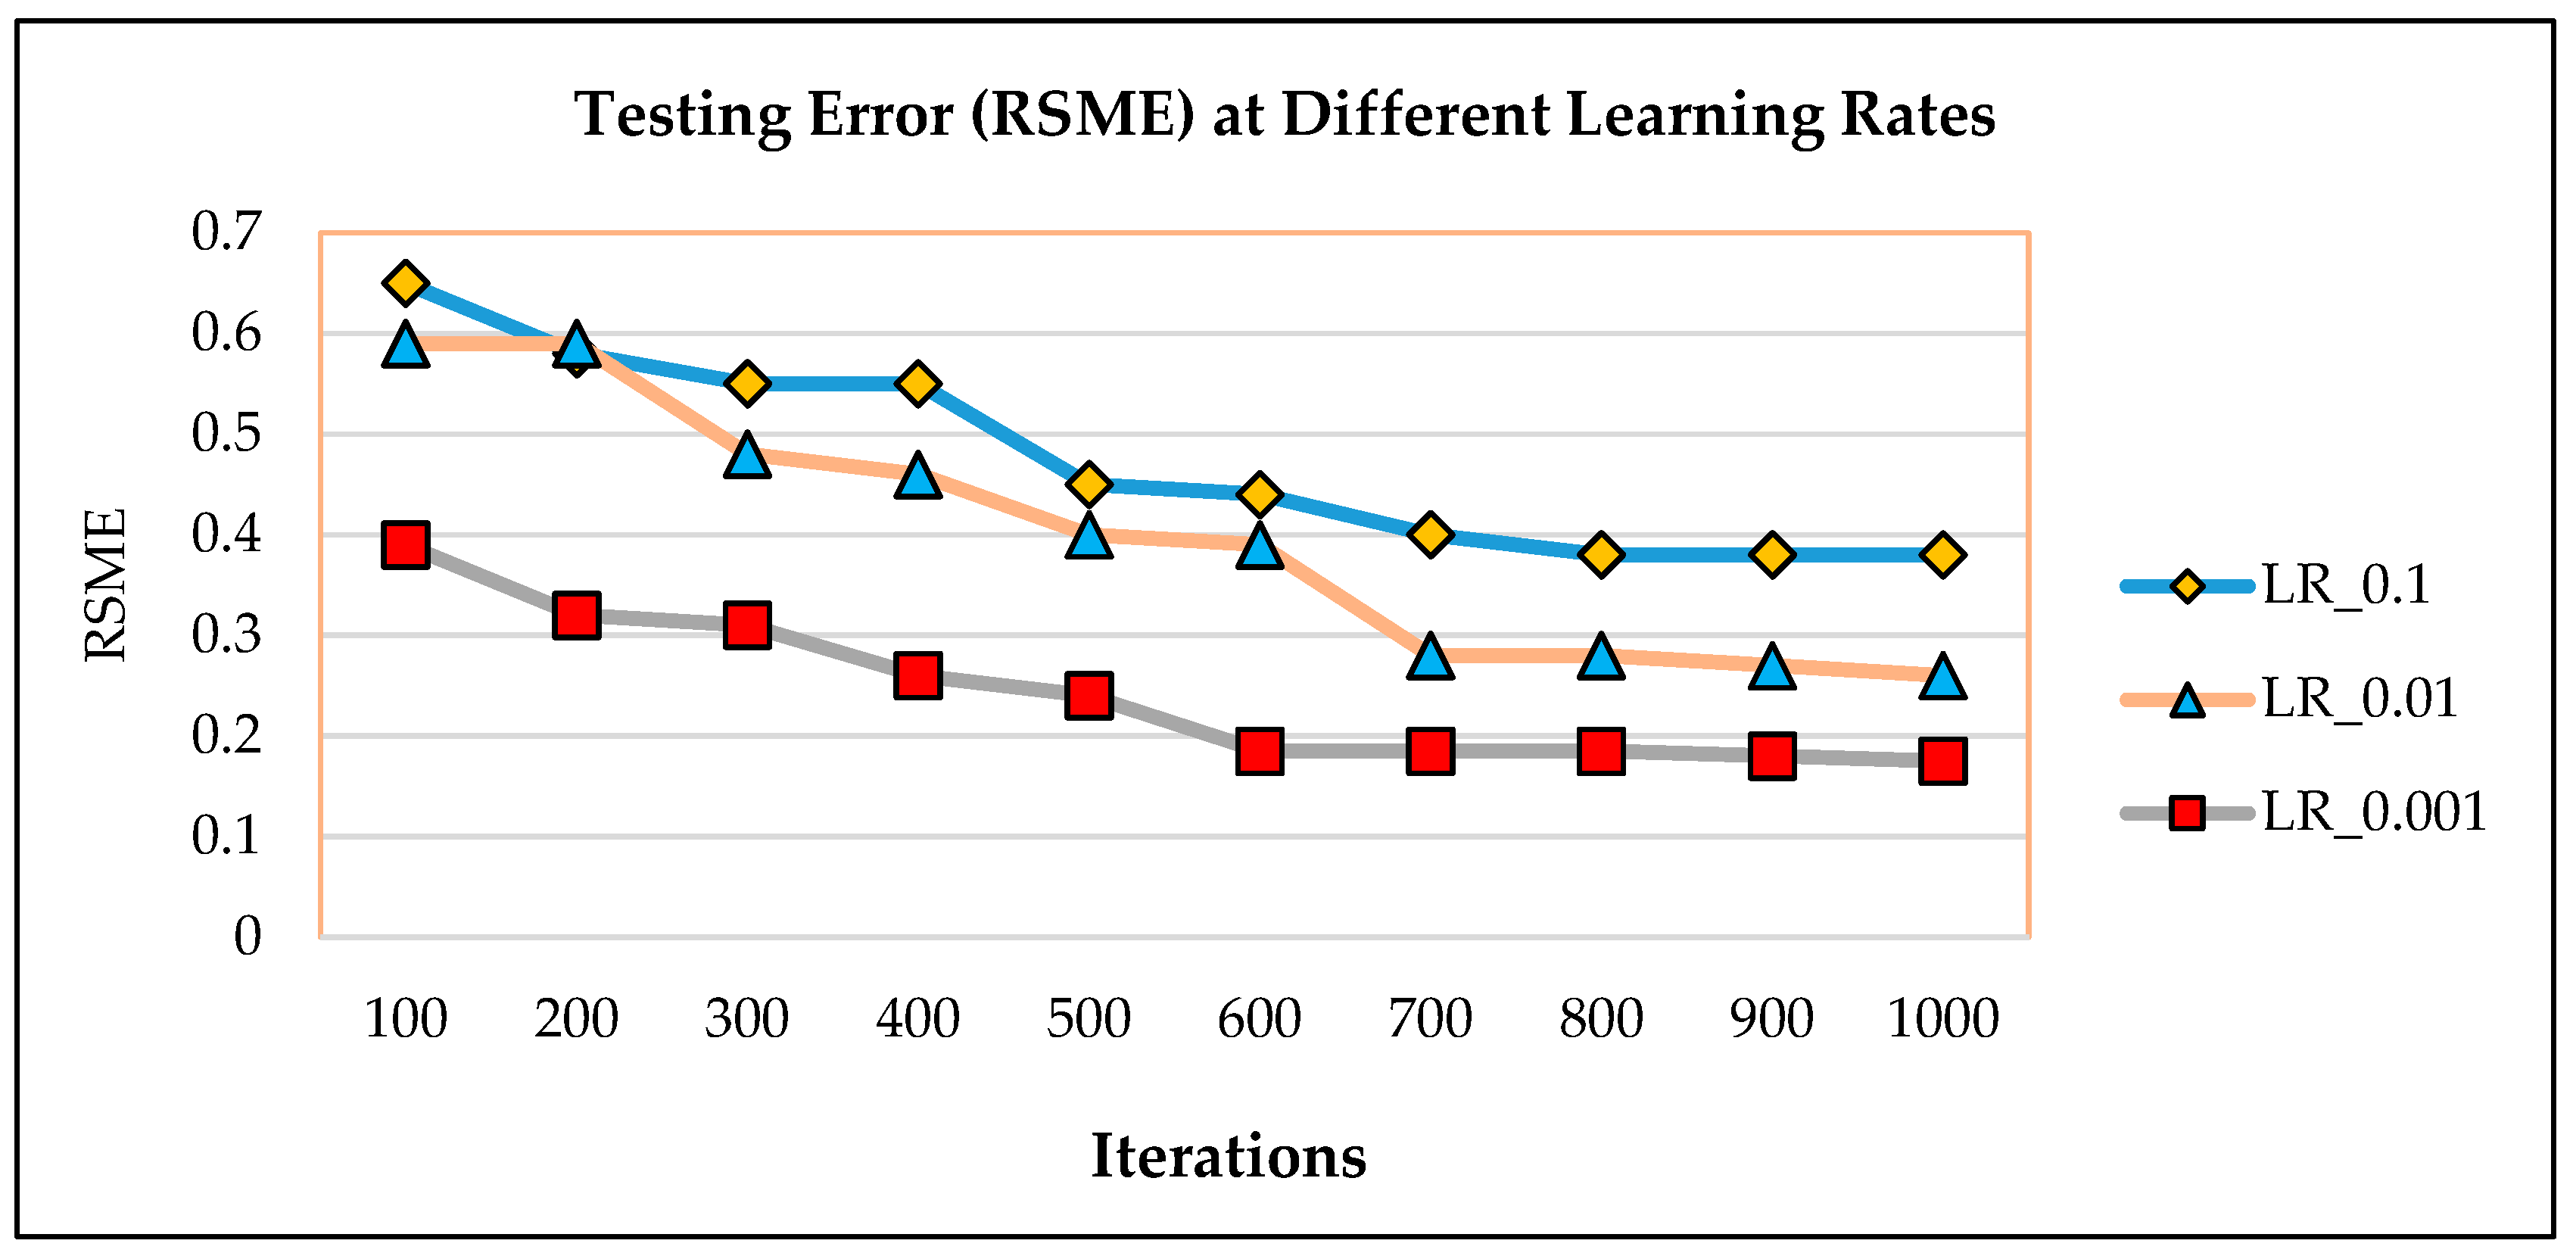
We used different learning rates to analyze the testing error of our proposed system. We used root mean square error (RSME) as a measure of testing error. The learning rates were varied between 0.1 and 0.001, represented as LR_0.1, LR_0.01, and LR_0.001 in
Figure 12. Testing errors minimize with smaller values of the learning rate, such as for 0.001, RSME values are less than 0.2. This means the model performance is good if the learning rate is small.
7. Discussion and Challenges
This section covers the motivations, challenges, implications, limitations, and contributions of the proposed recommendation system. In this rapidly growing world of internet, users feel overwhelmed by excessive availability of abundant data in the form of reviews, blogs, text, and stats on different sites. For every research domain, ample data can be extracted from the Internet. The travel experiences shared by the tourists are very important for recommendation systems to learn about user preferences. It is not convenient to search the best and relevant places by browsing all social media networks, and specifically travel blogs. That is why, in recent years, many recommendation systems are designed based on these travel blogs and user reviews. These recommendation systems play a vital role in achieving sustainability in tourism by targeting maximum SDGs. Therefore, the proposed tourist spot recommendation system is designed to help tourists visit the best places based on the reviews and travel experiences of others. The motivation behind it is to explore and find places for tourists that are new and have some extra-ordinary elements, for example, outstanding services or better quality.
As going through all the blogs and relevant data for a location is quite a tedious task, people usually read few top links and visit places accordingly. Therefore, in most of the cases, they end up visiting places that are well promoted and excessively advertised, and they might not be able to explore other less advertised, yet breathtaking places. Also, visiting the same famous locations again and again can be boring, especially if those locations are not upgraded with time. Therefore, in this work, we have presented an approach that recommends places that are popular among people and are experientially great, regardless of their promotions. Previously, many studies have focused on site recommendation and route recommendation, but targeting under-emphasized locations by considering all the relevant features has not been given significant attention.
For experiments, we focused on the parameters such as weather conditions, location popularity index, related sentiments to a location, its SNS shares, its coverage, or number of times it got mentioned on different forums. To the best of our knowledge, this is the first approach that combines all the features and data sources relevant to a particular location for predicting and recommending the top and under-emphasized places in Jeju. In
Table 8 below, we compare some recent relevant studies with our proposed approach based on eight parameters. Most of the studies relevant to tourist spot recommendations focus on few parameters. In the works of [
87,
88], only user preferences are considered. In the work of [
89], two parameters such as user preferences and sentiments are considered. Similarly, in the work of [
90], user preferences are considered, and topic modeling and sentiment analysis are performed. The more recent study [
91] used the maximum number of parameters including user preferences, sentiment analysis, topic modeling, weather conditions, and optimization function. In summary, the maximum number of parameters considered is five out of eight. Our proposed system uses additional features such as SNS shares, number of mentions of a particular site, and location popularity index.
There were some challenges during the development of the proposed system such as handling an abundant volume of user-generated data, changing user preferences, and data format handling as we collected data from multiple sources. Moreover, the weather of each location is fetched, which is unpredictable.
The proposed system recommends the under-emphasized places based on user preferences and location profiles, which implies that the best location profiles not necessarily always reflect the optimal combination of all influencing factors. For example, weather conditions are very important for tourists and can heavily impact user’s trip plans. Therefore, owing to the uncertainty and unpredictability of weather conditions, the recommended spot does not necessarily meet all the users’ preferences at all times. Thus, we used OpenWeatherAPI service to get the weather predictions for optimal recommendations.
Our proposed system has many contributions to sustainability as it achieves many SDGs. First, it can be used by tourists to search for the best tourist places according to their preferences. Second, in tourism operations and management tasks, it helps the tourism administrative parties to enhance and upgrade tourist attractions in order to sustain their interests. Third, most importantly, tourism promotions and marketing agencies can take benefit from the recommendation system to figure out where do they need to direct more efforts in terms of advertisements and promotions. Fourth, it will help towards building a better tourist experience by suggesting places that they could not have simply explored without an extensive search. Besides these major contributions, by having the knowledge about the discussion topics in blogs and reviews, this recommendation system can help in tourism planning at destinations such as focusing on accommodation services, transportations services, or public restrooms.
Though we achieved the objective of this study, there are some limitations too. First, we used Jeju relevant data for experiments primarily using Google search, and all data are in English. Therefore, there might be some content, such as a blog presented in the native Korean language, which we have not considered. The number of links was extracted for all scenarios, however, owing to the lack of understanding of the language, we cannot process the data that are available for local tourists of a country. Therefore, in the future, we aim to incorporate this limitation and make our recommendation system intelligent enough for both locals and foreigners.
8. Conclusions
Tourists’ experience and satisfaction are two vital components of SDGs in tourism [
7]. With the rise of internet applications, it has become a lot easier for travelers to plan their trips and decide target locations to visit based on the reviews and experiences of others. Many recommendation systems have been proposed in recent years for tourist recommendations. Most of the recommendation systems are built on user reviews and ratings. Therefore, users will be recommended with places having the highest ratings or positive sentiments. One of the shortcomings of this approach is that the places with a smaller number of views or mentions by the travel bloggers are less likely to be visited by others. We propose a recommendation system that overcomes this limitation by exploring all kinds of relevant data and discovers all the places with positive mentions. The primary contributions of this study are as follows:
Discovering under-emphasized locations to be recommended.
Recommending popular places based on the history data and ratings.
Recommendation based on the topics discovered from travel blogs and their relevance with user preferences.
Cross mapping matrices for finding similarity measures among user experience-based generated data.
Providing a thorough analysis of travel-related information for tourism industries to improve their services and help them strategize the promotions of a tourist spot.
Focuses on achieving maximum SDGs by helping in tourism planning, tourism management and organization, promotions and marketing, and sustaining destination’s attraction by covering all the relevant factors such as transportation facilities, weather conditions, or maintenance of public restrooms.
We have used topic modeling on travel blogs; user sentiment analysis on reviews; and fetched other fundamental features such as mentions, SNS shares, weather conditions, and location popularity index, and combined them to generate cross mappings for each location. The results show that, when topic modeling is combined with sentiment analysis, ratings, user history data, and user preferences, the system gives weight to the locations with maximum values of interest and achieves around 94% accurate results.
