Material Flows and Stocks in the Urban Building Sector: A Case Study from Vienna for the Years 1990–2015

Abstract
:1. Introduction
1.1. Background
1.2. State of Research
2. Materials and Methods
2.1. Material Flow Analysis
2.1.1. Background
2.1.2. System under Investigation
2.1.3. Overview on the Calculation Procedure
2.2. Calculation of the Material Stock in the Year 2013
2.3. Calculation of the Material Stocks and Flows for Residential Buildings 1990–2015
2.3.1. Development of the Useable Floor Area
2.3.2. Calculating Material Stocks and Flows Using the Material Intensity per Useable Floor Area
2.4. Material Stocks and Flows Calculation for Non-Residential Buildings
2.5. Overview of Assumptions
3. Results and Discussion
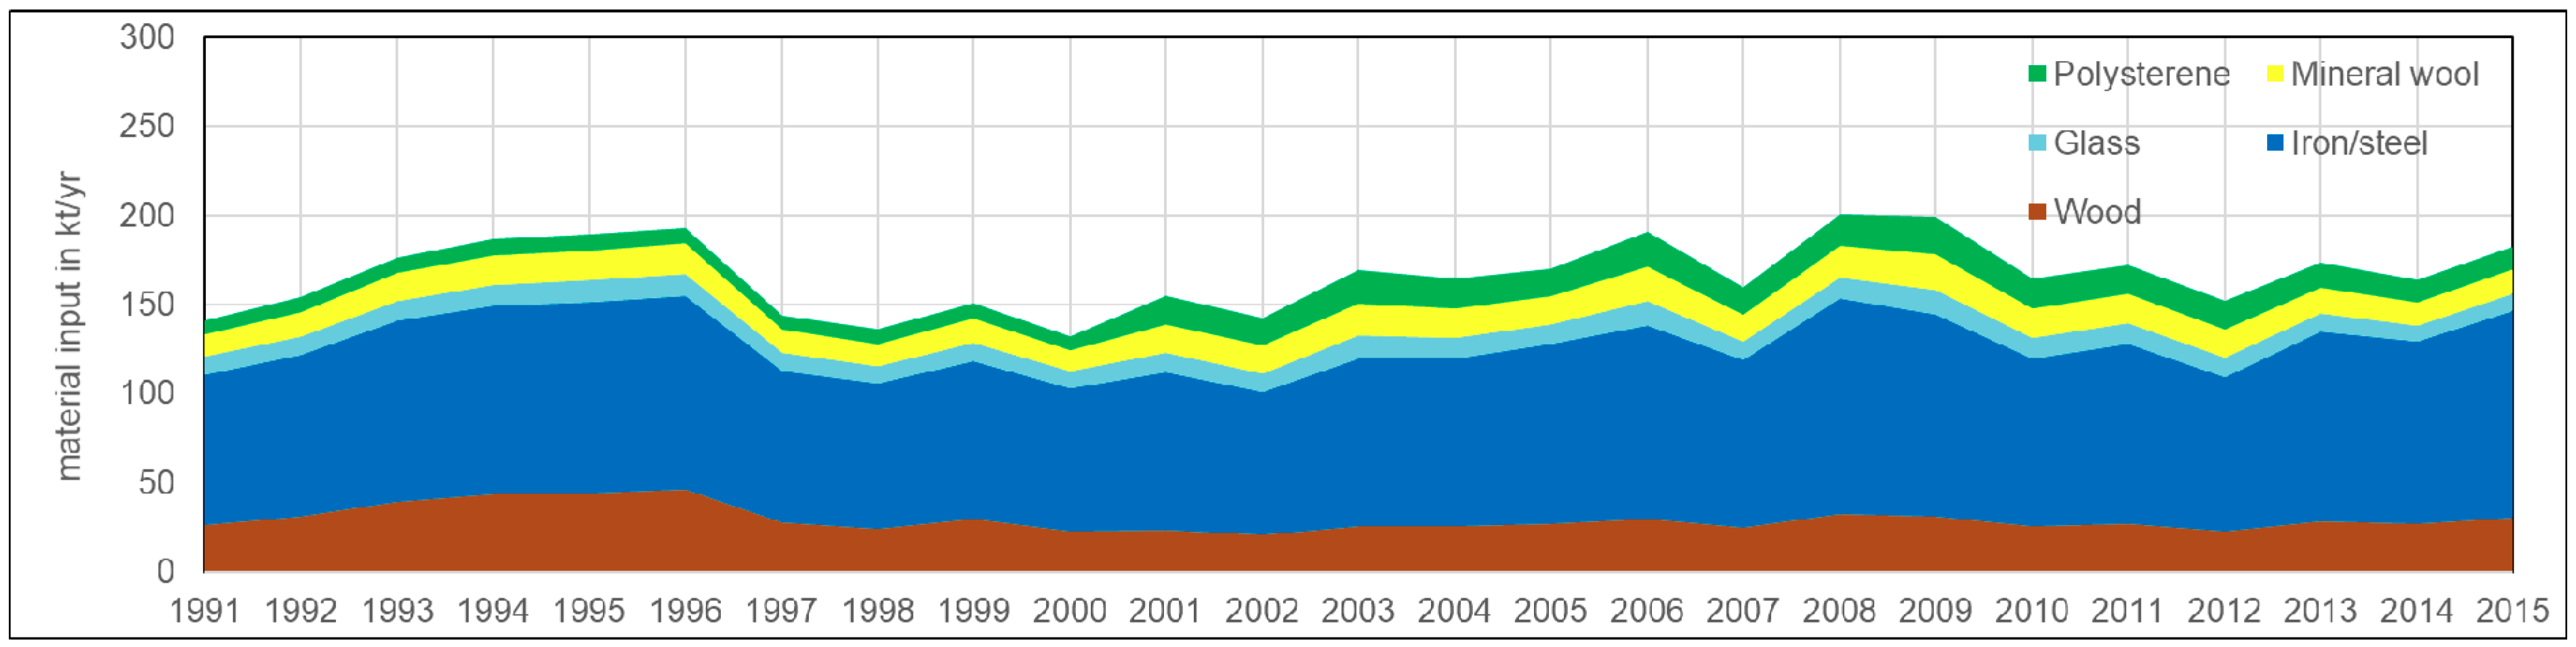
3.1. Building Material Inputs
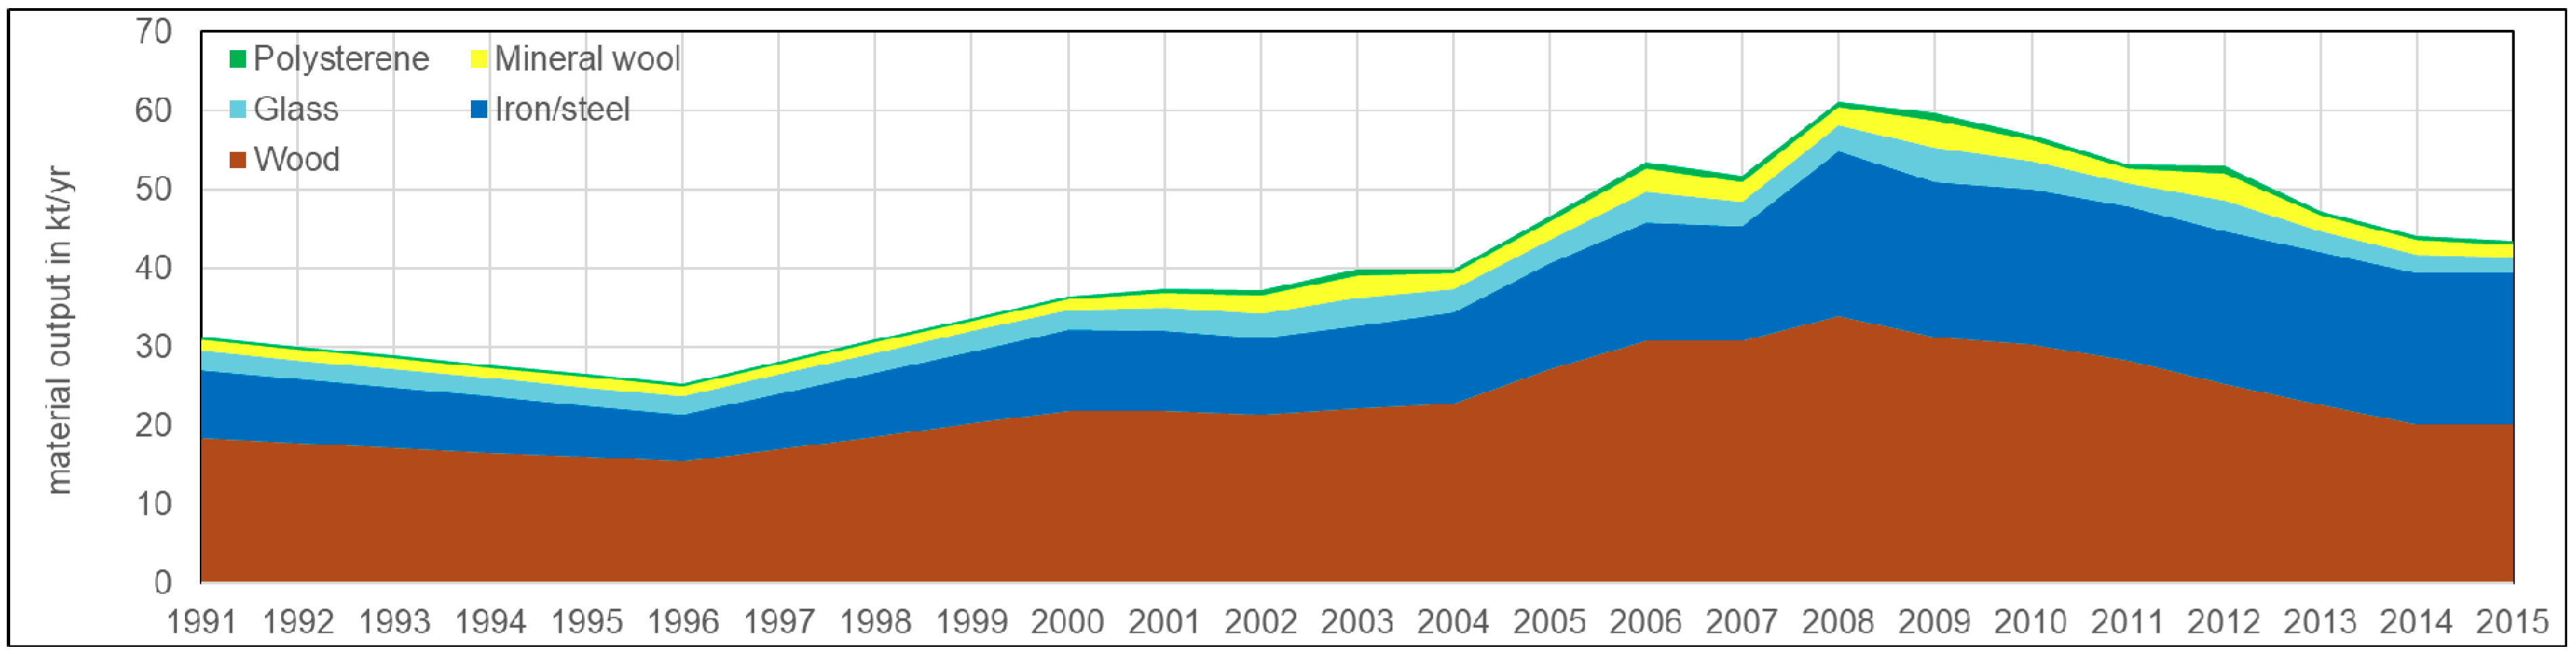
3.2. Building Material Outputs
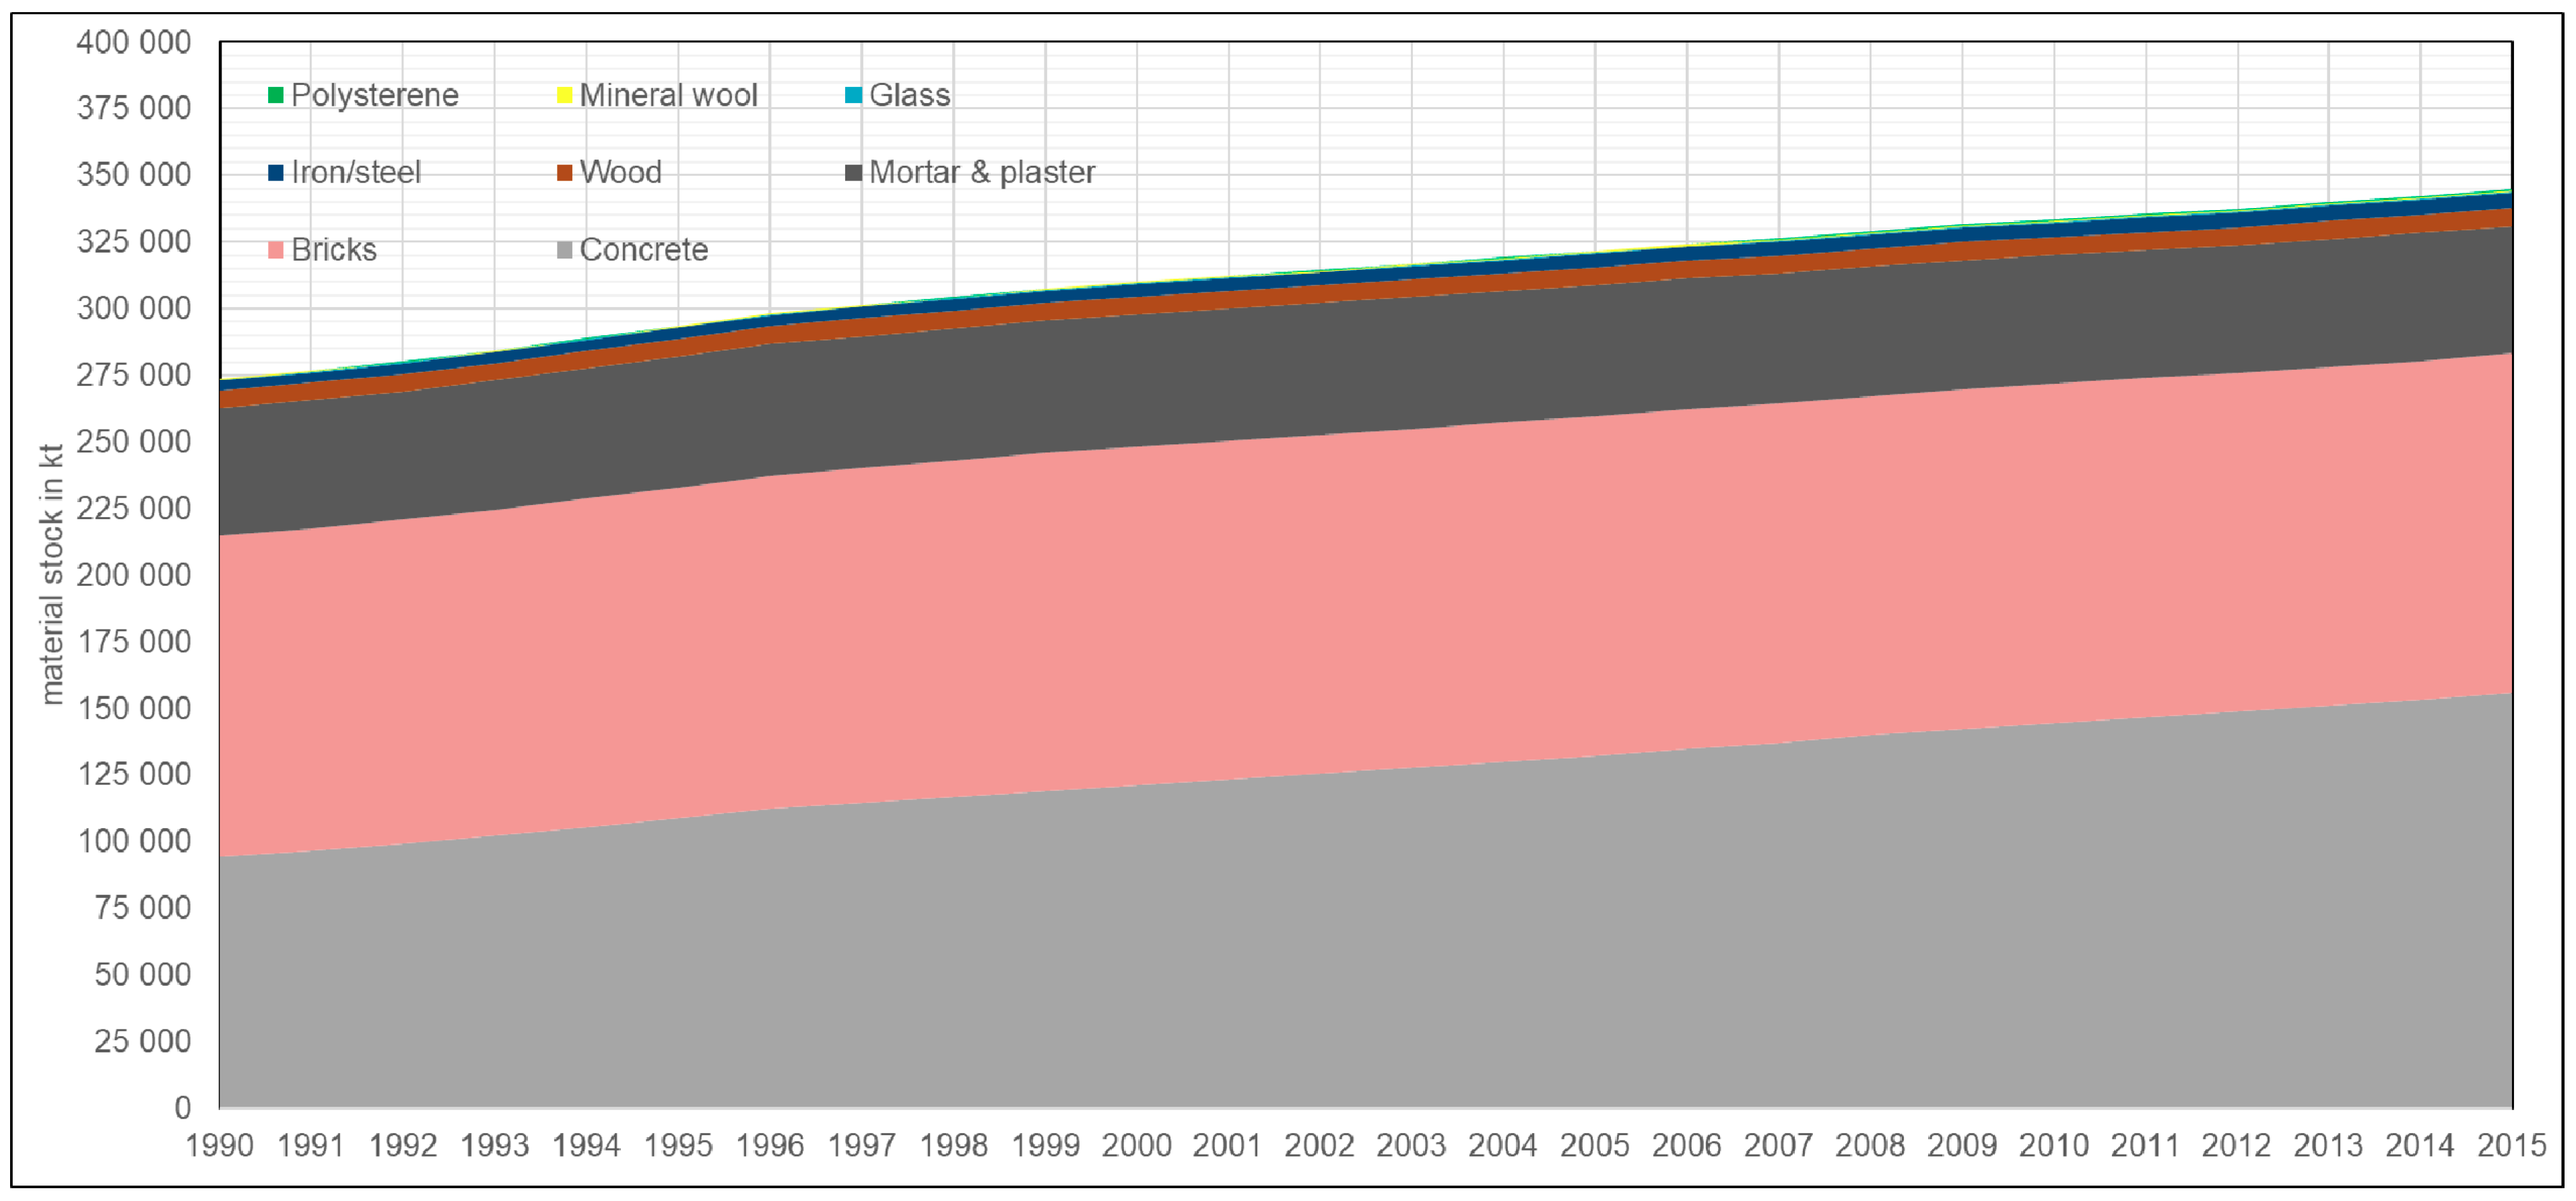
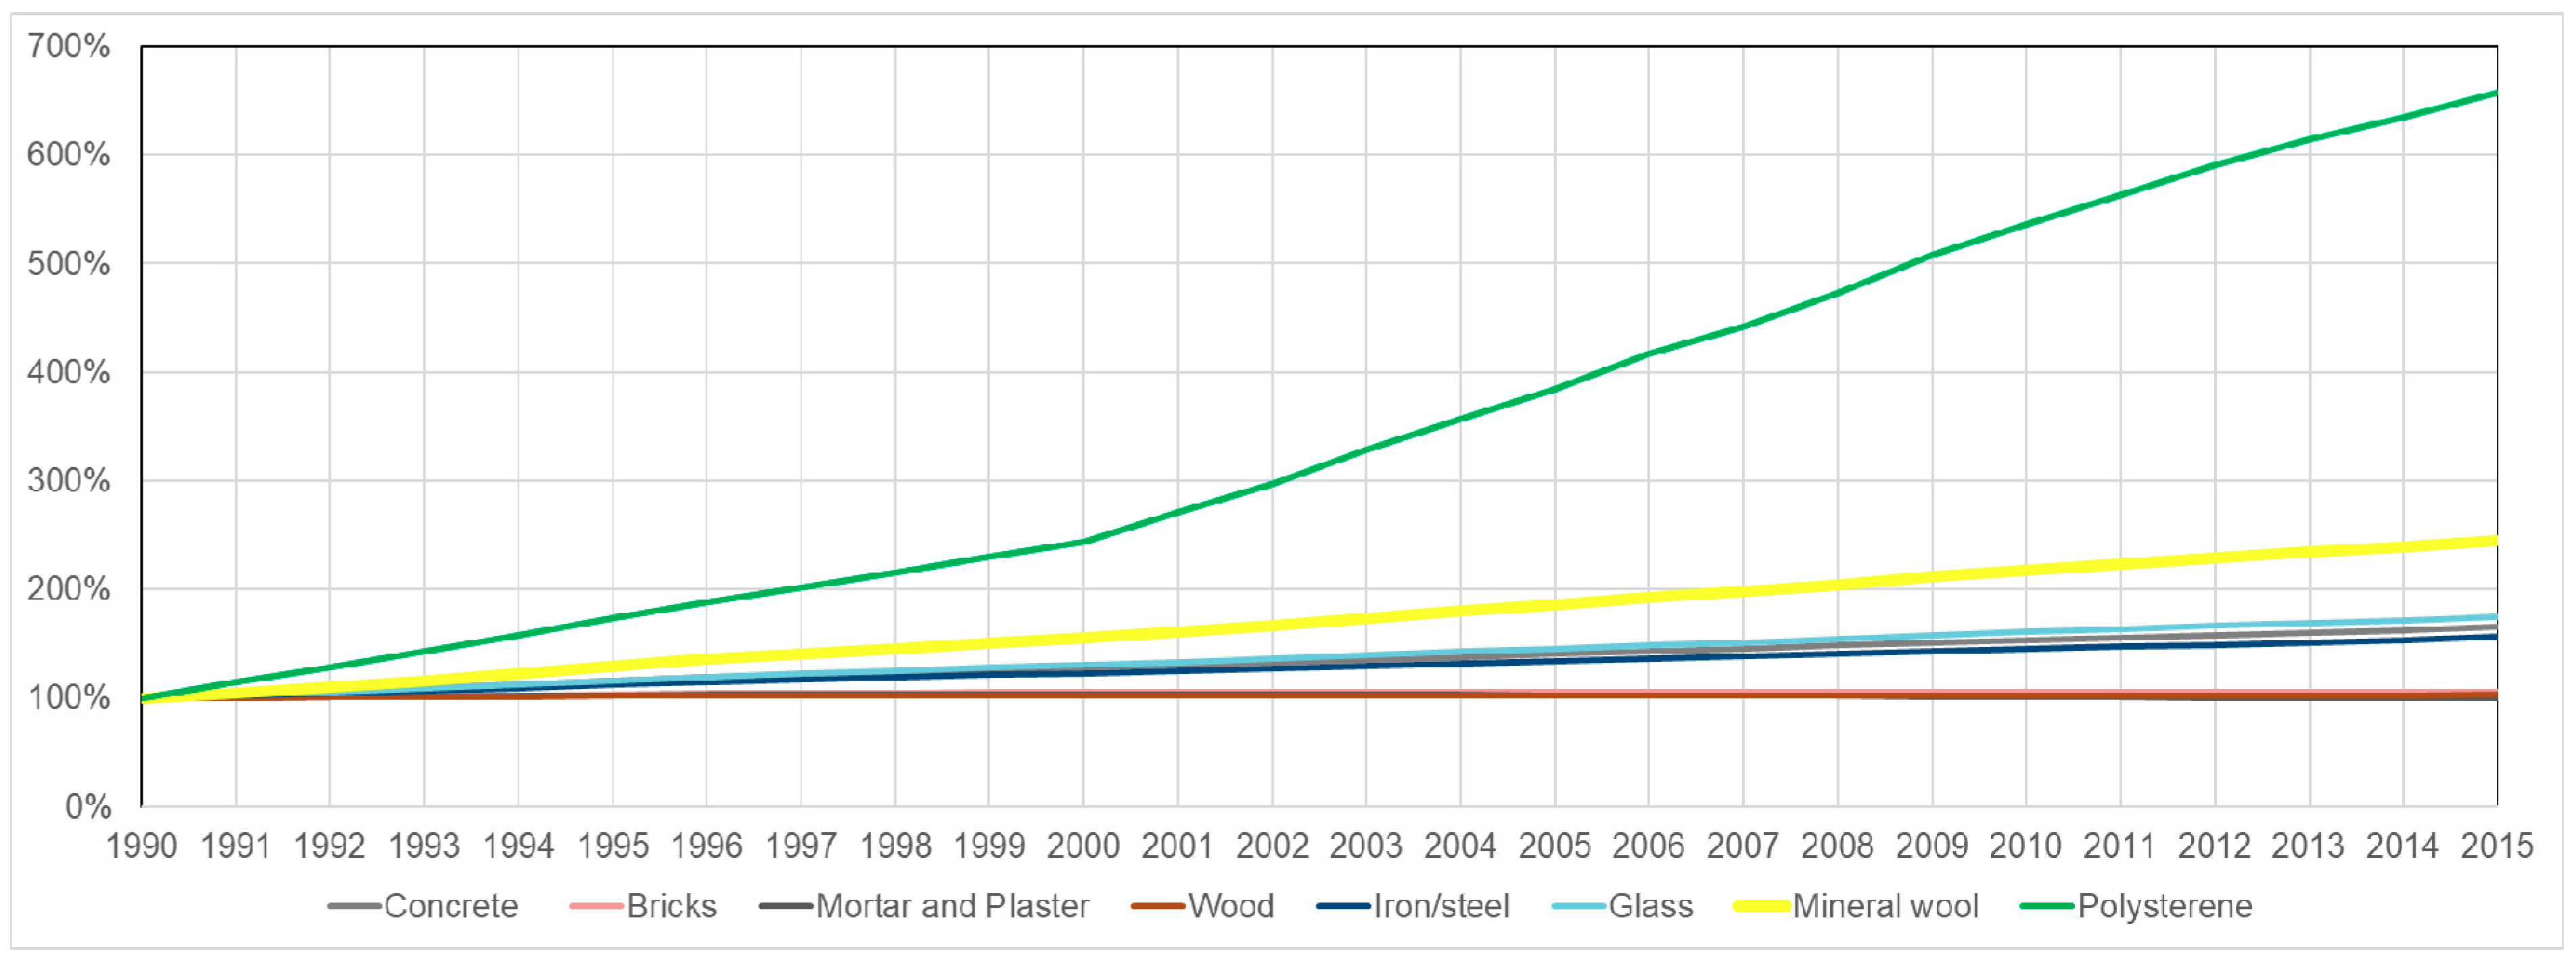
3.3. Building Material Stock Dynamics
4. Conclusions
Author Contributions
Funding
Acknowledgments
Conflicts of Interest
Appendix A

| [m2/y] | [m2/y] | [m2/y] | [m2] | |||||||||||
|---|---|---|---|---|---|---|---|---|---|---|---|---|---|---|
| Year | 1946–1980 | 1919–1945 | 1946–1980 | 1981–2000 | 1800–1918 | 1800–1918 | 1946–1980 | 1919–1945 | 1946–1980 | 1946–1980 | 1919–1945 | 1946–1980 | 1981–2000 | 2001–2015 |
| 1990 | 21,260,446 | 5,854,541 | 23,809,274 | 5,697,633 | - | |||||||||
| 1991 | 60,046 | 20,492 | 4154 | 118,368 | 29,592 | 137,708 | 66,882 | 137,708 | 21,318,767 | 5,863,642 | 23,805,120 | 6,100,011 | - | |
| 1992 | 58,102 | 19,828 | 4019 | 118,368 | 29,592 | 137,708 | 66,882 | 137,708 | 21,379,033 | 5,873,405 | 23,801,101 | 6,623,486 | - | |
| 1993 | 56,158 | 19,165 | 3885 | 118,368 | 29,592 | 137,708 | 66,882 | 137,708 | 21,441,244 | 5,883,833 | 23,797,216 | 7,365,443 | - | |
| 1994 | 54,213 | 18,501 | 3750 | 118,368 | 29,592 | 137,708 | 66,882 | 137,708 | 21,505,398 | 5,894,923 | 23,793,466 | 8,204,338 | - | |
| 1995 | 52,269 | 17,838 | 3616 | 118,368 | 29,592 | 137,708 | 66,882 | 137,708 | 21,571,497 | 5,906,678 | 23,789,850 | 9,069,718 | - | |
| 1996 | 50,325 | 17,174 | 3481 | 118,368 | 29,592 | 137,708 | 66,882 | 137,708 | 21,639,541 | 5,919,096 | 23,786,369 | 9,973,137 | - | |
| 1997 | 55,651 | 18,992 | 3850 | 118,368 | 29,592 | 137,708 | 66,882 | 137,708 | 21,702,257 | 5,929,696 | 23,782,519 | 10,402,000 | - | |
| 1998 | 60,978 | 20,810 | 4218 | 118,368 | 29,592 | 137,708 | 66,882 | 137,708 | 21,759,647 | 5,938,478 | 23,778,301 | 10,751,483 | - | |
| 1999 | 66,305 | 22,628 | 4587 | 118,368 | 29,592 | 137,708 | 66,882 | 137,708 | 21,811,710 | 5,945,442 | 23,773,715 | 11,242,170 | - | |
| 2000 | 71,632 | 24,445 | 4955 | 118,368 | 29,592 | 137,708 | 66,882 | 137,708 | 21,858,446 | 5,950,589 | 23,768,760 | 11,556,615 | - | |
| 2001 | 72,296 | 24,672 | 5001 | 131,520 | 32,880 | 235,774 | 78,152 | 235,774 | 21,917,671 | 5,958,797 | 23,763,759 | 11,556,615 | 505,357 | |
| 2002 | 72,960 | 24,899 | 5047 | 131,520 | 32,880 | 351,580 | 83,655 | 351,580 | 21,976,231 | 5,966,778 | 23,758,712 | 11,556,615 | 934,014 | |
| 2003 | 73,624 | 25,125 | 5093 | 131,520 | 32,880 | 443,463 | 104,324 | 443,463 | 22,034,127 | 5,974,533 | 23,753,619 | 11,556,615 | 1,495,794 | |
| 2004 | 74,288 | 25,352 | 5139 | 131,520 | 32,880 | 247,216 | 80,173 | 247,216 | 22,091,359 | 5,982,061 | 23,748,480 | 11,556,615 | 2,057,575 | |
| 2005 | 92,583 | 31,596 | 6404 | 131,520 | 32,880 | 336,671 | 65,494 | 336,671 | 22,130,296 | 5,983,346 | 23,742,076 | 11,556,615 | 2,678,441 | |
| 2006 | 103,205 | 35,220 | 7139 | 131,520 | 32,880 | 449,415 | 99,969 | 449,415 | 22,158,610 | 5,981,005 | 23,734,937 | 11,556,615 | 3,372,731 | |
| 2007 | 103,488 | 35,317 | 7159 | 131,520 | 32,880 | 360,826 | 69,001 | 360,826 | 22,186,642 | 5,978,568 | 23,727,778 | 11,556,615 | 3,928,162 | |
| 2008 | 110,397 | 37,675 | 7637 | 131,520 | 32,880 | 269,753 | 62,885 | 269,753 | 22,207,765 | 5,973,774 | 23,720,142 | 11,556,615 | 4,729,872 | |
| 2009 | 99,938 | 34,105 | 6913 | 131,520 | 32,880 | 539,853 | 106,348 | 539,853 | 22,239,347 | 5,972,548 | 23,713,228 | 11,556,615 | 5,467,682 | |
| 2010 | 96,006 | 32,763 | 6641 | - | 131,520 | 32,880 | 338,462 | 81,270 | 338,462 | 22,274,862 | 5,972,665 | 23,706,587 | 11,556,615 | 6,030,896 |
| 2011 | 84,771 | 27,419 | 11,333 | 1142 | 131,520 | 32,880 | 155,160 | 66,216 | 155,160 | 22,321,610 | 5,978,126 | 23,695,254 | 11,555,473 | 6,654,036 |
| 2012 | 73,537 | 22,074 | 16,025 | 2283 | 131,520 | 32,880 | 506,162 | 88,787 | 506,162 | 22,379,593 | 5,988,932 | 23,679,229 | 11,553,190 | 7,140,186 |
| 2013 | 62,302 | 16,729 | 20,717 | 3425 | 131,520 | 32,880 | 203,239 | 41,241 | 203,239 | 22,448,811 | 6,005,083 | 23,658,512 | 11,549,765 | 7,813,586 |
| 2014 | 51,068 | 11,384 | 25,409 | 4567 | 131,520 | 32,880 | 163,828 | 28,854 | 163,828 | 22,529,263 | 6,026,578 | 23,633,104 | 11,545,198 | 8,446,456 |
| 2015 | 51,068 | 11,384 | 25,409 | 4567 | 131,520 | 32,880 | 100,782 | 18,661 | 100,782 | 22,609,715 | 6,048,074 | 23,607,695 | 11,540,632 | 9,204,556 |
| Name | 1990 | 1991 | 1992 | 1993 | 1994 | 1995 | 1996 | 1997 | 1998 | 1999 | 2000 | 2001 | 2002 | 2003 | 2004 | 2005 | 2006 | 2007 | 2008 | 2009 | 2010 | 2011 | 2012 | 2013 | 2014 | 2015 |
|---|---|---|---|---|---|---|---|---|---|---|---|---|---|---|---|---|---|---|---|---|---|---|---|---|---|---|
| Debris | 560,000 | 510,677 | 728,139 | 734,135 | 914,938 | 1,033,872 | 1,174,444 | 1,090,976 | 987,620 | 806,611 | ||||||||||||||||
| Gravel | 276,000 | 376,016 | 208,255 | 171,186 | 65,560 | 144,539 | 181,596 | 121,182 | 132,668 | 226,852 | ||||||||||||||||
| Concrete | 200,000 | 113,095 | 179,746 | 215,962 | 201,859 | 241,778 | 199,760 | 432,296 | 421,395 | 555,020 | ||||||||||||||||
| Ballast | 73 | 16,760 | 8376 | 20,682 | 30,599 | |||||||||||||||||||||
| Asphalt | 87,783 | 86,740 | 68,231 | 74,550 | 78,032 | 83,543 | 76,991 | 206,978 | ||||||||||||||||||
| CDW buildings | ||||||||||||||||||||||||||
| Debris | 560,001 | 552,152 | 544,303 | 536,454 | 528,605 | 520,756 | 512,907 | 567,197 | 621,488 | 675,778 | 730,069 | 681,519 | 635,314 | 693,070 | 736,871 | 917,189 | 1,022,549 | 1,165,929 | 1,094,652 | 995,370 | 958,295 | 921,221 | 884,147 | 847,072 | 809,998 | 809,998 |
| Concrete | 136,000 | 120,626 | 105,252 | 89,878 | 74,504 | 59,130 | 43,756 | 64,106 | 84,456 | 104,806 | 125,155 | 136,381 | 127,135 | 138,693 | 168,400 | 177,187 | 201,377 | 151,883 | 394,544 | 382,732 | 395,070 | 407,408 | 419,746 | 432,083 | 444,421 | 444,421 |
| Sub-total | 746,001 | 721,491 | 696,982 | 672,473 | 647,964 | 623,454 | 598,945 | 678,501 | 758,058 | 837,614 | 917,170 | 874,053 | 814,795 | 888,868 | 964,191 | 1,153,203 | 1,293,099 | 1,409,709 | 1,570,491 | 1,463,621 | 1,432,679 | 1,401,737 | 1,370,795 | 1,339,853 | 1,308,911 | 1,308,911 |
| Disaggregation 1991–2010 | ||||||||||||||||||||||||||
| Debris | 0.04 | 0.04 | 0.04 | 0.04 | 0.04 | 0.03 | 0.04 | 0.04 | 0.05 | 0.05 | 0.05 | 0.04 | 0.05 | 0.05 | 0.06 | 0.07 | 0.08 | 0.07 | 0.07 | 0.07 | ||||||
| Concrete | 0.04 | 0.03 | 0.03 | 0.02 | 0.02 | 0.01 | 0.02 | 0.03 | 0.03 | 0.04 | 0.04 | 0.04 | 0.04 | 0.05 | 0.06 | 0.06 | 0.05 | 0.13 | 0.12 | 0.13 | ||||||
| Relative CDW generation using the year 2014 as reference | ||||||||||||||||||||||||||
| Debris | 0.68 | 0.67 | 0.66 | 0.65 | 0.64 | 0.63 | 0.70 | 0.77 | 0.83 | 0.90 | 0.84 | 0.78 | 0.86 | 0.91 | 1.13 | 1.26 | 1.44 | 1.35 | 1.23 | 1.18 | 1.14 | 1.09 | 1.05 | 1.00 | 1.00 | |
| Concrete | 0.27 | 0.24 | 0.20 | 0.17 | 0.13 | 0.10 | 0.14 | 0.19 | 0.24 | 0.28 | 0.31 | 0.29 | 0.31 | 0.38 | 0.40 | 0.45 | 0.34 | 0.89 | 0.86 | 0.89 | 0.92 | 0.94 | 0.97 | 1.00 | 1.00 | |
| CDW infrastructure | ||||||||||||||||||||||||||
| Gravel+Asphalt | 276,000 | 292,669 | 309,339 | 326,008 | 342,677 | 359,347 | 376,016 | 356,021 | 336,027 | 316,032 | 296,038 | 257,363 | 239,915 | 261,725 | 257,926 | 133,790 | 219,088 | 259,629 | 204,725 | 209,660 | 254,494 | 299,328 | 344,162 | 388,996 | 433,830 | 433,830 |
| Concrete | 64,000 | 64,890 | 65,780 | 66,669 | 67,559 | 68,449 | 69,339 | 65,652 | 61,965 | 58,278 | 54,591 | 47,459 | 44,241 | 48,263 | 47,563 | 24,671 | 40,401 | 47,877 | 37,752 | 38,662 | 46,930 | 55,197 | 63,465 | 71,732 | 80,000 | 80,000 |
| Ballast track | - | - | - | 16,760 | 13,966 | 11,171 | 8376 | 20,682 | 22,665 | 24,649 | 26,632 | 28,616 | 30,599 | 30,599 | ||||||||||||
| Sub-total | 340,000 | 357,559 | 375,118 | 392,677 | 410,237 | 427,796 | 445,355 | 421,673 | 397,992 | 374,310 | 350,629 | 304,822 | 284,156 | 309,989 | 305,488 | 175,222 | 273,455 | 318,676 | 250,854 | 269,003 | 324,089 | 379,174 | 434,259 | 489,344 | 544,429 | 544,429 |
| Building Period | MIstock [kg/m3 GV] | MIinput,t [kg/m3 GV] | MIoutput,t [kg/m3 GV] | Conversion Factor [-] | MIstock [kg/m2 UFA] | MIinput [kg/m2 UFA] | MIoutput [kg/m2 UFA] | ||||||||||
|---|---|---|---|---|---|---|---|---|---|---|---|---|---|---|---|---|---|
| Building Use | R | C | I | O | R | C | I | O | R | C | I | O | R | R | R | R | |
| Concrete | 1800–1918 | 22 | 23 | 48 | 23 | 0 | 0 | 0 | 0 | 22 | 23 | 48 | 23 | 9.5 | 276 | 0 | 209.4 |
| 1800–1918 renov. | 22 | 23 | 48 | 23 | 0 | 0 | 0 | 0 | 0 | 0 | 0 | 0 | 9.5 | 276 | 0 | 0 | |
| 1800–1918 rooftop | 321 | 0 | 0 | 0 | 321 | 0 | 0 | 0 | 0.9 | 0 | 0 | 0 | 2.9 | 929.9 | 929.9 | 2.6 | |
| 1919–1945 | 100 | 120 | 110 | 104 | 0 | 0 | 0 | 0 | 100 | 120 | 110 | 104 | 7.8 | 1020.1 | 0 | 784.7 | |
| 1919–1945 renov. | 100 | 120 | 110 | 104 | 0 | 0 | 0 | 0 | 0 | 0 | 0 | 0 | 7.8 | 1020.1 | 0 | 0 | |
| 1919–1945 rooftop | 119 | 0 | 0 | 0 | 119 | 0 | 0 | 0 | 0.3 | 0 | 0 | 0 | 7.8 | 929.9 | 929.9 | 2.6 | |
| 1946–1980 | 240 | 270 | 250 | 246 | 0 | 0 | 0 | 0 | 240 | 270 | 250 | 246 | 6.3 | 1501.4 | 0 | 1501.4 | |
| 1946–1980 renov. | 240 | 270 | 250 | 246 | 0 | 0 | 0 | 0 | 0 | 0 | 0 | 0 | 6.3 | 1501.4 | 0 | 0 | |
| 1981–2000 | 300 | 350 | 150 | 296 | 300 | 350 | 150 | 296 | 300 | 350 | 150 | 295 | 7.3 | 1973.2 | 2192.4 | 2192.4 | |
| 2001–2015 | 360 | 310 | 270 | 336 | 360 | 310 | 270 | 336 | 360 | 310 | 270 | 336 | 7.3 | 2557.9 | 2630.9 | 2630.9 | |
| Bricks | 1800–1918 | 220 | 270 | 170 | 229 | 0 | 0 | 0 | 0 | 220 | 270 | 170 | 229 | 9.5 | 2189.2 | 0 | 2094 |
| 1800–1918 renov. | 220 | 270 | 170 | 229 | 0 | 0 | 0 | 0 | 0 | 0 | 0 | 0 | 9.5 | 2189.2 | 0 | 0 | |
| 1800–1918 rooftop | 53 | 0 | 0 | 0 | 53 | 0 | 0 | 0 | 49 | 0 | 0 | 0 | 2.9 | 154.9 | 154.9 | 141.7 | |
| 1919–1945 | 180 | 180 | 180 | 180 | 0 | 0 | 0 | 0 | 180 | 180 | 180 | 180 | 7.8 | 1537.9 | 0 | 1412.4 | |
| 1919–1945 renov. | 180 | 180 | 180 | 180 | 0 | 0 | 0 | 0 | 0 | 0 | 0 | 0 | 7.8 | 1537.9 | 0 | 0 | |
| 1919–1945 rooftop | 20 | 0 | 0 | 0 | 20 | 0 | 0 | 0 | 18.1 | 0 | 0 | 0 | 7.8 | 154.9 | 154.9 | 141.7 | |
| 1946–1980 | 150 | 150 | 150 | 150 | 0 | 0 | 0 | 0 | 150 | 150 | 150 | 150 | 6.3 | 829.5 | 0 | 938.4 | |
| 1946–1980 renov. | 150 | 150 | 150 | 150 | 0 | 0 | 0 | 0 | 0 | 0 | 0 | 0 | 6.3 | 829.5 | 0 | 0 | |
| 1981–2000 | 100 | 100 | 100 | 100 | 100 | 100 | 100 | 100 | 100 | 100 | 100 | 100 | 7.3 | 877 | 730.8 | 730.8 | |
| 2001–2015 | 58 | 58 | 58 | 58 | 58 | 58 | 58 | 58 | 58 | 58 | 58 | 58 | 7.3 | 394.6 | 423.9 | 423.9 | |
| Mortar/plaster | 1800–1918 | 92 | 81 | 52 | 88 | 0 | 0 | 0 | 0 | 92 | 81 | 52 | 88 | 9.5 | 856.6 | 0 | 875.7 |
| 1800–1918 renov. | 87 | 80 | 51 | 88 | 3.8 | 7.5 | 0 | 0 | 9.2 | 8.1 | 0 | 0 | 9.5 | 866.2 | 36.2 | 87.6 | |
| 1800–1918 rooftop | 21 | 0 | 0 | 0 | 21 | 0 | 0 | 0 | 12.2 | 0 | 0 | 0 | 2.9 | 60.9 | 60.9 | 35.4 | |
| 1919–1945 | 93 | 73 | 29 | 84 | 0 | 0 | 0 | 0 | 93 | 73 | 29 | 84 | 7.8 | 667 | 0 | 729.7 | |
| 1919–1945 renov. | 88 | 73 | 29 | 84 | 3.8 | 7.5 | 0 | 0 | 9.3 | 7.3 | 0 | 0 | 7.8 | 678.7 | 29.8 | 73 | |
| 1919–1945 rooftop | 7.8 | 0 | 0 | 0 | 7.8 | 0 | 0 | 0 | 4.5 | 0 | 0 | 0 | 7.8 | 60.9 | 60.9 | 35.4 | |
| 1946–1980 | 72 | 44 | 51 | 65 | 0 | 0 | 0 | 0 | 72 | 44 | 51 | 65 | 6.3 | 431.6 | 0 | 450.4 | |
| 1946–1980 renov. | 69 | 47 | 54 | 59 | 3.8 | 7.5 | 0 | 0 | 7.2 | 4.4 | 5.1 | 6.5 | 6.3 | 451 | 23.8 | 45 | |
| 1981–2000 | 50 | 16 | 3.6 | 32 | 50 | 16 | 3.6 | 32 | 50 | 16 | 3.6 | 32 | 7.3 | 453.1 | 365.4 | 365.4 | |
| 2001–2015 | 3.8 | 7.5 | 5 | 5.2 | 3.8 | 7.5 | 5 | 5.2 | 3.8 | 7.5 | 5 | 5.2 | 7.3 | 73.1 | 27.8 | 27.8 | |
| Wood | 1800–1918 | 18 | 3.3 | 5.8 | 14 | 0 | 0 | 0 | 0 | 18 | 3.3 | 5.8 | 14 | 9.5 | 161.8 | 0 | 171.3 |
| 1800–1918 renov. | 18 | 3 | 5.5 | 14 | 0.2 | 0 | 0 | 0 | 0.4 | 0.4 | 0 | 0 | 9.5 | 160.2 | 1.9 | 3.5 | |
| 1800–1918 rooftop | 6.4 | 0 | 0 | 0 | 6.4 | 0 | 0 | 0 | 9.3 | 0 | 0 | 0 | 2.9 | 18.5 | 18.5 | 27 | |
| 1919–1945 | 13 | 6.6 | 28 | 14 | 0 | 0 | 0 | 0 | 13 | 6.6 | 28 | 14 | 7.8 | 94.2 | 0 | 102 | |
| 1919–1945 renov. | 13 | 6.3 | 28 | 14 | 0.2 | 0 | 0 | 0 | 0.3 | 0.3 | 0 | 0 | 7.8 | 93 | 1.6 | 2.7 | |
| 1919–1945 rooftop | 2.4 | 0 | 0 | 0 | 2.4 | 0 | 0 | 0 | 3.4 | 0 | 0 | 0 | 7.8 | 18.5 | 18.5 | 27 | |
| 1946–1980 | 5.9 | 3.6 | 3.6 | 5.3 | 0 | 0 | 0 | 0 | 5.9 | 3.6 | 3.6 | 5.3 | 6.3 | 50 | 0 | 36.9 | |
| 1946–1980 renov. | 6.1 | 3.6 | 3.6 | 5.3 | 0.2 | 0 | 0 | 0 | 0 | 0 | 0 | 0 | 6.3 | 51.3 | 1.2 | 0 | |
| 1981–2000 | 5.4 | 1.2 | 1.2 | 3.3 | 5.4 | 1.2 | 1.2 | 3.3 | 5.4 | 1.2 | 1.2 | 3.3 | 7.3 | 70.2 | 39.5 | 39.5 | |
| 2001–2015 | 4.3 | 0.8 | 2.1 | 2.9 | 4.3 | 0.8 | 2.1 | 2.9 | 4.3 | 0.8 | 2.1 | 2.9 | 7.3 | 60.7 | 31.4 | 31.4 | |
| Iron/Steel | 1800–1918 | 2.7 | 4.1 | 8.7 | 3.2 | 0 | 0 | 0 | 0 | 2.7 | 4.1 | 8.7 | 3.2 | 9.5 | 33.3 | 0 | 25.7 |
| 1800–1918 renov. | 2.7 | 4.1 | 8.7 | 3.2 | 0 | 0 | 0 | 0 | 0 | 0 | 0 | 0 | 9.5 | 33.3 | 0 | 0 | |
| 1800–1918 rooftop | 6.5 | 0 | 0 | 0 | 6.5 | 0 | 0 | 0 | 0 | 0 | 0 | 0 | 2.9 | 18.9 | 18.9 | 0 | |
| 1919–1945 | 4.6 | 6 | 5.8 | 4.9 | 0 | 0 | 0 | 0 | 4.6 | 6 | 5.8 | 4.9 | 7.8 | 39.2 | 0 | 36.1 | |
| 1919–1945 renov. | 4.6 | 6 | 5.8 | 4.9 | 0 | 0 | 0 | 0 | 0 | 0 | 0 | 0 | 7.8 | 39.2 | 0 | 0 | |
| 1919–1945 rooftop | 2.4 | 0 | 0 | 0 | 2.4 | 0 | 0 | 0 | 0 | 0 | 0 | 0 | 7.8 | 18.9 | 18.9 | 0 | |
| 1946–1980 | 6.9 | 5.7 | 12 | 7.2 | 0 | 0 | 0 | 0 | 6.9 | 5.7 | 12 | 7.2 | 6.3 | 51.9 | 0 | 43.2 | |
| 1946–1980 renov. | 6.9 | 5.7 | 12 | 7.2 | 0 | 0 | 0 | 0 | 0 | 0 | 0 | 0 | 6.3 | 51.9 | 0 | 0 | |
| 1981–2000 | 6.7 | 13 | 14 | 9.9 | 6.7 | 13 | 14 | 9.9 | 6.7 | 13 | 14 | 9.9 | 7.3 | 80.4 | 49 | 49 | |
| 2001–2015 | 15 | 9.5 | 13 | 12.8 | 15 | 9.5 | 13 | 12.8 | 15 | 9.5 | 13 | 13 | 7.3 | 109.6 | 109.6 | 109.6 | |
| Glass | 1800–1918 | 0.3 | 0.3 | 0.7 | 0.3 | 0 | 0 | 0 | 0 | 0.3 | 0.3 | 0.7 | 0.3 | 9.5 | 2.9 | 0 | 2.5 |
| 1800–1918 renov. | 0.9 | 0.6 | 1 | 0.3 | 0.9 | 0.6 | 0 | 0 | 0.3 | 0.3 | 0 | 0 | 9.5 | 12.4 | 8.6 | 2.5 | |
| 1800–1918 rooftop | 2.3 | 0 | 0 | 0 | 2.3 | 0 | 0 | 0 | 0 | 0 | 0 | 0 | 2.9 | 6.6 | 6.6 | 0.1 | |
| 1919–1945 | 0.5 | 0.5 | 0.3 | 0.5 | 0 | 0 | 0 | 0 | 0.5 | 0.5 | 0.3 | 0.5 | 7.8 | 4.1 | 0 | 3.8 | |
| 1919–1945 renov. | 0.9 | 0.6 | 0.4 | 0.5 | 0.9 | 0.6 | 0 | 0 | 0.5 | 0.5 | 0 | 0 | 7.8 | 10.2 | 7.1 | 3.8 | |
| 1919–1945 rooftop | 0.8 | 0 | 0 | 0 | 0.8 | 0 | 0 | 0 | 0 | 0 | 0 | 0 | 7.8 | 6.6 | 6.6 | 0.1 | |
| 1946–1980 | 0.5 | 0.6 | 0 | 0.5 | 0 | 0 | 0 | 0 | 0.5 | 0.6 | 0 | 0.5 | 6.3 | 4.1 | 0 | 3.4 | |
| 1946–1980 renov. | 0.9 | 0.6 | 0 | 0.5 | 0.9 | 0.6 | 0 | 0 | 0.5 | 0.6 | 0 | 0 | 6.3 | 8.1 | 5.6 | 3.4 | |
| 1981–2000 | 0.6 | 0.9 | 0 | 0.6 | 0.6 | 0.9 | 0 | 0.6 | 0.6 | 0.9 | 0 | 0.6 | 7.3 | 4.2 | 4 | 4 | |
| 2001–2015 | 0.9 | 0.6 | 0.5 | 0.8 | 0.9 | 0.6 | 0.5 | 0.8 | 0.9 | 0.6 | 0.5 | 0.8 | 7.3 | 9.5 | 6.6 | 6.6 | |
| Mineral wool | 1800–1918 | 0 | 0.3 | 0.1 | 0.1 | 0 | 0 | 0 | 0 | 0 | 0.3 | 0.1 | 0.1 | 9.5 | 3.2 | 0 | 0.2 |
| 1800–1918 renov. | 1.3 | 1.2 | 1 | 0.1 | 1.3 | 1.2 | 0 | 0 | 0 | 0.3 | 0 | 0 | 9.5 | 18.1 | 12.4 | 0.2 | |
| 1800–1918 rooftop | 1.5 | 0 | 0 | 0 | 1.5 | 0 | 0 | 0 | 0.1 | 0 | 0 | 0 | 2.9 | 4.3 | 4.3 | 0.3 | |
| 1919–1945 | 0 | 0.1 | 0 | 0 | 0 | 0 | 0 | 0 | 0 | 0.1 | 0 | 0 | 7.8 | 1.8 | 0 | 0.1 | |
| 1919–1945 renov. | 1.3 | 1.2 | 1.1 | 0 | 1.3 | 1.2 | 0 | 0 | 0 | 0.1 | 0 | 0 | 7.8 | 14.9 | 10.2 | 0.1 | |
| 1919–1945 rooftop | 0.6 | 0 | 0 | 0 | 0.6 | 0 | 0 | 0 | 0 | 0 | 0 | 0 | 7.8 | 4.3 | 4.3 | 0.3 | |
| 1946–1980 | 0.7 | 0.9 | 0 | 0.7 | 0 | 0 | 0 | 0 | 0.7 | 0.9 | 0 | 0.7 | 6.3 | 11.2 | 0 | 4.4 | |
| 1946–1980 renov. | 1.3 | 1.2 | 0.3 | 0.7 | 1.3 | 1.2 | 0 | 0 | 0.7 | 0.9 | 0 | 0 | 6.3 | 11.9 | 8.1 | 4.4 | |
| 1981–2000 | 1.3 | 0.3 | 0 | 0.8 | 1.3 | 0.3 | 0 | 0.8 | 1.3 | 0.3 | 0 | 0.8 | 7.3 | 0 | 9.5 | 9.5 | |
| 2001–2015 | 1.3 | 1.2 | 0.8 | 1.2 | 1.3 | 1.2 | 0.8 | 1.2 | 1.3 | 1.2 | 0.8 | 1.2 | 7.3 | 13.9 | 9.5 | 9.5 | |
| Polystyrene | 1800–1918 | 0 | 0 | 0 | 0 | 0 | 0 | 0 | 0 | 0 | 0 | 0 | 0 | 9.5 | 0 | 0 | 0 |
| 1800–1918 renov. | 1.6 | 0.4 | 0.4 | 0 | 1.6 | 0.4 | 0 | 0 | 0 | 0 | 0 | 0 | 9.5 | 14.3 | 15.2 | 0 | |
| 1800–1918 rooftop | 0.7 | 0 | 0 | 0 | 0.7 | 0 | 0 | 0 | 0.3 | 0 | 0 | 0 | 2.9 | 2.1 | 2.1 | 1 | |
| 1919–1945 | 0 | 0 | 0 | 0 | 0 | 0 | 0 | 0 | 0 | 0 | 0 | 0 | 7.8 | 0 | 0 | 0 | |
| 1919–1945 renov. | 1.6 | 0.4 | 0.4 | 0 | 1.6 | 0.4 | 0 | 0 | 0 | 0 | 0 | 0 | 7.8 | 11.8 | 12.6 | 0 | |
| 1919–1945 rooftop | 0.3 | 0 | 0 | 0 | 0.3 | 0 | 0 | 0 | 0.1 | 0 | 0 | 0 | 7.8 | 2.1 | 2.1 | 1 | |
| 1946–1980 | 0.2 | 0.2 | 0.2 | 0.2 | 0 | 0 | 0 | 0 | 0.2 | 0.2 | 0.2 | 0.2 | 6.3 | 1.4 | 0 | 1.4 | |
| 1946–1980 renov. | 1.6 | 0.4 | 0.4 | 0.2 | 1.6 | 0.4 | 0 | 0 | 0.2 | 0.2 | 0 | 0 | 6.3 | 9.4 | 10 | 1.4 | |
| 1981–2000 | 0.2 | 0 | 0 | 0.1 | 0.2 | 0 | 0 | 0.1 | 0.2 | 0 | 0 | 0.1 | 7.3 | 1.3 | 1.3 | 1.3 | |
| 2001–2015 | 1.6 | 0.4 | 0.7 | 1.1 | 1.6 | 0.4 | 0.7 | 1.1 | 1.6 | 0.4 | 0.7 | 1.1 | 7.3 | 11 | 11.7 | 11.7 | |
| Year | 1990 | 1991 | 1992 | 1993 | 1994 | 1995 | 1996 | 1997 | 1998 | 1999 | 2000 | 2001 | 2002 | 2003 | 2004 | 2005 | 2006 | 2007 | 2008 | 2009 | 2010 | 2011 | 2012 | 2013 | 2014 | 2015 |
|---|---|---|---|---|---|---|---|---|---|---|---|---|---|---|---|---|---|---|---|---|---|---|---|---|---|---|
| Population | 1,502,772 | 1,522,449 | 1,537,523 | 1,549,436 | 1,542,667 | 1,539,002 | 1,542,191 | 1,540,875 | 1,542,252 | 1,548,537 | 1,571,123 | 1,553,956 | 1,592,846 | 1,610,410 | 1,632,569 | 1,652,449 | 1,661,246 | 1,671,221 | 1,680,135 | 1,689,995 | 1,702,855 | 1,717,084 | 1,741,246 | 1,766,746 | 1,797,337 | 1,840,226 |
| 0. All buildings | ||||||||||||||||||||||||||
| MAT_FLOW_INPUT | 3610.25 | 4021.00 | 4762.08 | 5090.88 | 5180.72 | 5309.75 | 3700.09 | 3430.83 | 3909.79 | 3311.99 | 2996.34 | 2747.64 | 3189.69 | 3180.65 | 3363.21 | 3618.09 | 3151.85 | 3951.11 | 3761.23 | 3184.12 | 3374.52 | 2934.29 | 3523.70 | 3386.10 | 3789.07 | |
| Concrete | 2424.48 | 2689.97 | 3168.99 | 3381.51 | 3439.58 | 3522.98 | 2482.54 | 2308.51 | 2618.09 | 2231.69 | 2365.78 | 2163.98 | 2514.22 | 2514.22 | 2669.67 | 2862.84 | 2497.52 | 3145.46 | 2977.35 | 2517.99 | 2675.66 | 2315.24 | 2807.89 | 2701.25 | 3030.73 | |
| Bricks | 795.07 | 883.57 | 1043.24 | 1114.08 | 1133.44 | 1161.24 | 814.43 | 756.42 | 859.61 | 730.81 | 405.93 | 373.42 | 429.85 | 429.85 | 454.90 | 486.02 | 427.16 | 531.55 | 504.46 | 430.46 | 455.86 | 397.79 | 477.16 | 459.98 | 513.06 | |
| Mortar and plaster | 249.43 | 293.68 | 373.52 | 408.94 | 418.62 | 432.52 | 259.11 | 230.10 | 281.70 | 217.30 | 69.89 | 68.08 | 76.27 | 71.87 | 68.85 | 78.76 | 67.72 | 73.83 | 80.77 | 71.33 | 70.83 | 69.55 | 65.29 | 61.32 | 62.76 | |
| Wood | 26.32 | 31.10 | 39.72 | 43.55 | 44.59 | 46.09 | 27.36 | 24.23 | 29.80 | 22.85 | 23.48 | 21.09 | 25.51 | 25.28 | 26.89 | 29.61 | 24.87 | 32.57 | 31.02 | 25.29 | 27.06 | 22.89 | 28.28 | 26.86 | 30.69 | |
| Iron/steel | 84.32 | 90.25 | 100.94 | 105.69 | 106.99 | 108.85 | 85.61 | 81.73 | 88.64 | 80.01 | 88.16 | 79.75 | 94.34 | 94.34 | 100.82 | 108.87 | 93.65 | 120.65 | 113.64 | 94.50 | 101.07 | 86.05 | 106.58 | 102.14 | 115.87 | |
| Glass | 9.98 | 10.47 | 11.35 | 11.74 | 11.84 | 11.99 | 10.09 | 9.77 | 10.34 | 9.63 | 11.13 | 10.70 | 12.64 | 11.60 | 10.88 | 13.23 | 10.61 | 12.06 | 13.70 | 11.47 | 11.35 | 11.05 | 10.04 | 9.10 | 9.44 | |
| Mineral wool | 12.60 | 13.75 | 15.83 | 16.75 | 17.00 | 17.36 | 12.85 | 12.10 | 13.44 | 11.77 | 16.28 | 15.66 | 18.46 | 16.96 | 15.93 | 19.32 | 15.54 | 17.63 | 20.00 | 16.77 | 16.60 | 16.16 | 14.71 | 13.35 | 13.84 | |
| Polystyrene | 8.05 | 8.21 | 8.50 | 8.62 | 8.66 | 8.71 | 8.09 | 7.98 | 8.17 | 7.94 | 15.70 | 14.94 | 18.38 | 16.53 | 15.26 | 19.43 | 14.78 | 17.36 | 20.28 | 16.30 | 16.09 | 15.55 | 13.76 | 12.09 | 12.69 | |
| MAT_FLOW_OUTPUT | 622.65 | 594.16 | 565.66 | 537.16 | 508.67 | 480.17 | 543.39 | 606.60 | 669.82 | 733.03 | 739.06 | 718.39 | 762.18 | 801.20 | 935.38 | 1061.90 | 1031.37 | 1313.12 | 1243.33 | 1217.67 | 1179.91 | 1150.48 | 1094.62 | 1054.07 | 1049.21 | |
| Concrete | 170.08 | 157.65 | 145.21 | 132.78 | 120.35 | 107.91 | 130.13 | 152.35 | 174.57 | 196.79 | 200.28 | 189.94 | 203.73 | 228.68 | 262.43 | 295.21 | 274.97 | 438.89 | 415.29 | 417.97 | 425.93 | 433.89 | 441.85 | 449.81 | 449.81 | |
| Bricks | 275.12 | 264.00 | 252.88 | 241.76 | 230.64 | 219.52 | 247.73 | 275.95 | 304.17 | 332.38 | 330.81 | 323.08 | 336.68 | 354.06 | 430.74 | 481.40 | 486.80 | 571.83 | 526.38 | 514.65 | 487.46 | 460.28 | 433.09 | 405.90 | 405.90 | |
| Mortar and plaster | 146.28 | 142.50 | 138.72 | 134.94 | 131.16 | 127.38 | 137.40 | 147.42 | 157.43 | 167.45 | 170.68 | 168.15 | 181.97 | 178.67 | 195.62 | 231.87 | 217.97 | 241.39 | 241.98 | 228.23 | 213.48 | 203.43 | 172.50 | 154.32 | 150.15 | |
| Wood | 18.35 | 17.76 | 17.18 | 16.59 | 16.01 | 15.42 | 17.04 | 18.65 | 20.26 | 21.87 | 21.78 | 21.33 | 22.13 | 22.82 | 27.15 | 30.70 | 30.71 | 33.95 | 31.29 | 30.37 | 28.22 | 25.29 | 22.71 | 20.16 | 20.11 | |
| Iron/steel | 8.66 | 8.13 | 7.60 | 7.07 | 6.54 | 6.01 | 7.06 | 8.12 | 9.17 | 10.22 | 10.28 | 9.81 | 10.46 | 11.51 | 13.48 | 15.13 | 14.60 | 20.93 | 19.65 | 19.62 | 19.52 | 19.42 | 19.33 | 19.23 | 19.23 | |
| Glass | 2.48 | 2.45 | 2.42 | 2.39 | 2.35 | 2.32 | 2.39 | 2.45 | 2.52 | 2.58 | 2.91 | 3.13 | 3.67 | 3.03 | 2.98 | 3.89 | 3.17 | 3.27 | 4.33 | 3.61 | 3.09 | 3.89 | 2.60 | 2.30 | 2.03 | |
| Mineral wool | 1.38 | 1.36 | 1.35 | 1.33 | 1.32 | 1.30 | 1.33 | 1.36 | 1.39 | 1.42 | 1.85 | 2.33 | 2.77 | 1.94 | 2.35 | 2.91 | 2.48 | 2.28 | 3.45 | 2.56 | 1.80 | 3.35 | 2.04 | 1.89 | 1.61 | |
| Polystyrene | 0.31 | 0.31 | 0.31 | 0.30 | 0.30 | 0.30 | 0.30 | 0.31 | 0.31 | 0.32 | 0.46 | 0.63 | 0.76 | 0.49 | 0.63 | 0.80 | 0.67 | 0.58 | 0.96 | 0.67 | 0.42 | 0.93 | 0.51 | 0.46 | 0.37 | |
| MAT_STOCK | 273,662.28 | 276,649.88 | 280,076.72 | 284,273.14 | 288,826.86 | 293,498.92 | 298,328.49 | 301,485.20 | 304,309.43 | 307,549.40 | 310,128.35 | 312,385.63 | 314,414.88 | 316,842.39 | 319,221.84 | 321,649.66 | 324,205.86 | 326,326.34 | 328,964.33 | 331,482.23 | 333,448.68 | 335,643.29 | 337,427.10 | 339,856.18 | 342,188.21 | 344,928.07 |
| Concrete | 94,483.40 | 96,737.79 | 99,270.12 | 102,293.90 | 105,542.63 | 108,861.87 | 112,276.93 | 114,629.35 | 116,785.50 | 119,229.02 | 121,263.93 | 123,429.42 | 125,403.47 | 127,713.96 | 129,999.51 | 132,406.75 | 134,974.38 | 137,196.93 | 139,903.50 | 142,465.56 | 144,565.59 | 146,815.32 | 148,696.67 | 151,062.71 | 153,314.16 | 155,895.08 |
| Bricks | 120,381.47 | 120,901.42 | 121,521.00 | 122,311.36 | 123,183.69 | 124,086.49 | 125,028.22 | 125,594.91 | 126,075.37 | 126,630.82 | 127,029.24 | 127,104.37 | 127,154.72 | 127,247.88 | 127,323.67 | 127,347.83 | 127,352.44 | 127,292.80 | 127,252.52 | 127,230.60 | 127,146.41 | 127,114.81 | 127,052.33 | 127,096.40 | 127,150.48 | 127,257.64 |
| Mortar and plaster | 47,969.37 | 48,072.52 | 48,223.70 | 48,458.50 | 48,732.49 | 49,019.94 | 49,325.08 | 49,446.79 | 49,529.48 | 49,653.74 | 49,703.59 | 49,602.80 | 49,502.74 | 49,397.04 | 49,290.24 | 49,163.47 | 49,010.37 | 48,860.12 | 48,692.56 | 48,531.36 | 48,374.46 | 48,231.81 | 48,097.92 | 47,990.71 | 47,897.72 | 47,810.32 |
| Wood | 6481.21 | 6489.18 | 6502.51 | 6525.06 | 6552.01 | 6580.59 | 6611.26 | 6621.59 | 6627.18 | 6636.72 | 6637.70 | 6639.40 | 6639.16 | 6642.54 | 6645.00 | 6644.74 | 6643.65 | 6637.82 | 6636.44 | 6636.17 | 6631.10 | 6629.95 | 6627.55 | 6633.12 | 6639.81 | 6650.39 |
| Iron/steel | 3780.08 | 3855.73 | 3937.85 | 4031.20 | 4129.82 | 4230.26 | 4333.10 | 4411.66 | 4485.27 | 4564.74 | 4634.53 | 4712.41 | 4782.34 | 4866.22 | 4949.05 | 5036.40 | 5130.14 | 5209.18 | 5308.90 | 5402.88 | 5477.77 | 5559.32 | 5625.95 | 5713.20 | 5796.11 | 5892.75 |
| Glass | 274.89 | 282.40 | 290.42 | 299.35 | 308.70 | 318.19 | 327.86 | 335.56 | 342.87 | 350.69 | 357.73 | 365.95 | 373.52 | 382.49 | 391.06 | 398.95 | 408.29 | 415.74 | 424.53 | 433.91 | 441.77 | 450.03 | 457.19 | 464.62 | 471.43 | 478.84 |
| Mineral wool | 236.28 | 247.50 | 259.89 | 274.37 | 289.78 | 305.47 | 321.52 | 333.05 | 343.78 | 355.84 | 366.18 | 380.61 | 393.94 | 409.64 | 424.66 | 438.24 | 454.65 | 467.71 | 483.06 | 499.61 | 513.82 | 528.62 | 541.43 | 554.09 | 565.55 | 577.78 |
| Polystyrene | 55.59 | 63.33 | 71.23 | 79.42 | 87.74 | 96.10 | 104.52 | 112.30 | 119.98 | 127.83 | 135.44 | 150.68 | 164.99 | 182.61 | 198.65 | 213.29 | 231.93 | 246.04 | 262.82 | 282.14 | 297.77 | 313.44 | 328.06 | 341.32 | 352.95 | 365.27 |
| Year | 1990 | 1991 | 1992 | 1993 | 1994 | 1995 | 1996 | 1997 | 1998 | 1999 | 2000 | 2001 | 2002 | 2003 | 2004 | 2005 | 2006 | 2007 | 2008 | 2009 | 2010 | 2011 | 2012 | 2013 | 2014 | 2015 |
|---|---|---|---|---|---|---|---|---|---|---|---|---|---|---|---|---|---|---|---|---|---|---|---|---|---|---|
| Population | 1,502,772 | 1,522,449 | 1,537,523 | 1,549,436 | 1,542,667 | 1,539,002 | 1,542,191 | 1,540,875 | 1,542,252 | 1,548,537 | 1,571,123 | 1,553,956 | 1,592,846 | 1,610,410 | 1,632,569 | 1,652,449 | 1,661,246 | 1,671,221 | 1,680,135 | 1,689,995 | 1,702,855 | 1,717,084 | 1,741,246 | 1,766,746 | 1,797,337 | 1,840,226 |
| 1. Residential buildings | ||||||||||||||||||||||||||
| MAT_FLOW_INPUT | 1574.74 | 1985.49 | 2726.57 | 3055.37 | 3145.21 | 3274.24 | 1664.58 | 1395.32 | 1874.28 | 1276.48 | 1876.77 | 1628.07 | 2070.12 | 2061.08 | 2243.64 | 2498.52 | 2032.28 | 2831.54 | 2641.66 | 2064.55 | 2254.95 | 1814.72 | 2404.13 | 2266.53 | 2669.50 | |
| Concrete | 1019.78 | 1285.28 | 1764.29 | 1976.82 | 2034.88 | 2118.28 | 1077.85 | 903.81 | 1213.39 | 826.99 | 1482.43 | 1280.64 | 1630.88 | 1630.88 | 1786.33 | 1979.50 | 1614.18 | 2262.12 | 2094.00 | 1634.65 | 1792.31 | 1431.90 | 1924.55 | 1817.91 | 2147.39 | |
| Bricks | 316.99 | 405.48 | 565.16 | 636.00 | 655.35 | 683.15 | 336.34 | 278.33 | 381.52 | 252.72 | 239.68 | 207.16 | 263.59 | 263.59 | 288.64 | 319.76 | 260.90 | 365.29 | 338.21 | 264.20 | 289.60 | 231.53 | 310.90 | 293.72 | 346.81 | |
| Mortar and plaster | 172.08 | 216.33 | 296.16 | 331.58 | 341.26 | 355.16 | 181.75 | 152.75 | 204.35 | 139.95 | 42.07 | 40.27 | 48.46 | 44.06 | 41.04 | 50.95 | 39.90 | 46.02 | 52.96 | 43.51 | 43.01 | 41.73 | 37.48 | 33.51 | 34.94 | |
| Wood | 19.46 | 24.23 | 32.86 | 36.68 | 37.73 | 39.23 | 20.50 | 17.37 | 22.94 | 15.99 | 19.87 | 17.47 | 21.89 | 21.66 | 23.27 | 25.99 | 21.25 | 28.95 | 27.40 | 21.68 | 23.44 | 19.27 | 24.66 | 23.24 | 27.07 | |
| Iron/steel | 22.50 | 28.43 | 39.13 | 43.88 | 45.17 | 47.04 | 23.80 | 19.91 | 26.83 | 18.20 | 58.51 | 50.10 | 64.70 | 64.70 | 71.17 | 79.22 | 64.00 | 91.00 | 83.99 | 64.85 | 71.42 | 56.41 | 76.93 | 72.49 | 86.22 | |
| Glass | 6.39 | 6.87 | 7.75 | 8.14 | 8.25 | 8.40 | 6.49 | 6.18 | 6.74 | 6.03 | 8.67 | 8.25 | 10.19 | 9.14 | 8.43 | 10.78 | 8.16 | 9.61 | 11.25 | 9.02 | 8.90 | 8.59 | 7.59 | 6.65 | 6.99 | |
| Mineral wool | 9.95 | 11.10 | 13.18 | 14.10 | 14.35 | 14.71 | 10.20 | 9.45 | 10.79 | 9.11 | 11.68 | 11.07 | 13.87 | 12.36 | 11.33 | 14.72 | 10.94 | 13.03 | 15.41 | 12.17 | 12.00 | 11.57 | 10.11 | 8.75 | 9.24 | |
| Polystyrene | 7.60 | 7.76 | 8.05 | 8.17 | 8.21 | 8.26 | 7.63 | 7.53 | 7.72 | 7.48 | 13.85 | 13.10 | 16.54 | 14.69 | 13.42 | 17.59 | 12.94 | 15.52 | 18.44 | 14.46 | 14.25 | 13.71 | 11.92 | 10.25 | 10.85 | |
| MAT_FLOW_OUTPUT | 318.84 | 309.83 | 300.82 | 291.82 | 282.81 | 273.80 | 298.48 | 323.15 | 347.83 | 372.50 | 380.05 | 383.15 | 397.23 | 390.28 | 462.28 | 531.13 | 514.39 | 545.17 | 517.41 | 488.71 | 447.89 | 415.42 | 356.51 | 312.91 | 308.04 | |
| Concrete | 34.89 | 33.76 | 32.63 | 31.50 | 30.37 | 29.24 | 32.34 | 35.43 | 38.53 | 41.62 | 42.01 | 42.39 | 42.78 | 43.16 | 53.79 | 59.97 | 60.13 | 64.14 | 58.07 | 55.78 | 58.78 | 61.78 | 64.79 | 67.79 | 67.79 | |
| Bricks | 158.58 | 153.44 | 148.31 | 143.17 | 138.04 | 132.90 | 146.97 | 161.04 | 175.11 | 189.17 | 190.93 | 192.68 | 194.43 | 196.19 | 244.50 | 272.56 | 273.30 | 291.55 | 263.93 | 253.54 | 227.71 | 201.87 | 176.03 | 150.20 | 150.20 | |
| Mortar and plaster | 106.57 | 104.32 | 102.07 | 99.82 | 97.58 | 95.33 | 101.49 | 107.64 | 113.80 | 119.96 | 124.33 | 124.45 | 134.95 | 127.50 | 136.25 | 166.20 | 150.20 | 157.57 | 163.23 | 150.06 | 135.89 | 126.42 | 96.07 | 78.47 | 74.30 | |
| Wood | 13.74 | 13.34 | 12.93 | 12.53 | 12.12 | 11.71 | 12.83 | 13.94 | 15.05 | 16.16 | 16.27 | 16.17 | 16.53 | 16.69 | 19.87 | 22.57 | 22.15 | 23.73 | 21.76 | 20.96 | 18.92 | 16.11 | 13.65 | 11.22 | 11.17 | |
| Iron/steel | 2.46 | 2.38 | 2.30 | 2.22 | 2.14 | 2.06 | 2.28 | 2.50 | 2.72 | 2.94 | 2.96 | 2.99 | 3.02 | 3.05 | 3.80 | 4.23 | 4.24 | 4.53 | 4.10 | 3.94 | 3.71 | 3.49 | 3.27 | 3.04 | 3.04 | |
| Glass | 1.70 | 1.69 | 1.69 | 1.68 | 1.67 | 1.66 | 1.68 | 1.70 | 1.73 | 1.75 | 2.08 | 2.32 | 2.82 | 2.14 | 2.02 | 2.86 | 2.16 | 1.97 | 3.08 | 2.35 | 1.82 | 2.62 | 1.33 | 1.02 | 0.75 | |
| Mineral wool | 0.69 | 0.69 | 0.69 | 0.69 | 0.69 | 0.69 | 0.69 | 0.69 | 0.70 | 0.70 | 1.13 | 1.63 | 2.05 | 1.18 | 1.56 | 2.08 | 1.67 | 1.28 | 2.47 | 1.58 | 0.82 | 2.36 | 1.05 | 0.90 | 0.62 | |
| Polystyrene | 0.20 | 0.20 | 0.20 | 0.20 | 0.20 | 0.20 | 0.20 | 0.20 | 0.20 | 0.21 | 0.35 | 0.51 | 0.65 | 0.36 | 0.49 | 0.66 | 0.53 | 0.40 | 0.79 | 0.50 | 0.24 | 0.75 | 0.33 | 0.28 | 0.19 | |
| MAT_STOCK | 180,064.39 | 181,320.29 | 182,995.95 | 185,421.70 | 188,185.25 | 191,047.65 | 194,048.08 | 195,414.17 | 196,486.35 | 198,012.79 | 198,916.77 | 200,413.49 | 201,658.41 | 203,331.29 | 205,002.10 | 206,783.46 | 208,750.85 | 210,268.74 | 212,555.12 | 214,679.36 | 216,255.20 | 218,062.26 | 219,461.56 | 221,509.19 | 223,462.81 | 225,824.26 |
| Concrete | 57,284.21 | 58,269.10 | 59,520.62 | 61,252.27 | 63,197.59 | 65,202.10 | 67,291.15 | 68,336.66 | 69,205.04 | 70,379.90 | 71,165.27 | 72,605.70 | 73,843.95 | 75,432.06 | 77,019.78 | 78,752.32 | 80,671.85 | 82,225.90 | 84,423.88 | 86,459.81 | 88,038.68 | 89,772.22 | 91,142.33 | 93,002.09 | 94,752.22 | 96,831.82 |
| Bricks | 79,293.71 | 79,452.12 | 79,704.16 | 80,121.01 | 80,613.84 | 81,131.15 | 81,681.41 | 81,870.78 | 81,988.07 | 82,194.49 | 82,258.04 | 82,306.79 | 82,321.27 | 82,390.43 | 82,457.84 | 82,501.97 | 82,549.17 | 82,536.77 | 82,610.52 | 82,684.79 | 82,695.45 | 82,757.35 | 82,787.01 | 82,921.89 | 83,065.42 | 83,262.03 |
| Mortar and plaster | 35,695.36 | 35,760.87 | 35,872.88 | 36,066.97 | 36,298.73 | 36,542.41 | 36,802.24 | 36,882.51 | 36,927.62 | 37,018.16 | 37,038.15 | 36,955.89 | 36,871.71 | 36,785.21 | 36,701.77 | 36,606.56 | 36,491.32 | 36,381.02 | 36,269.47 | 36,159.21 | 36,052.67 | 35,959.79 | 35,875.11 | 35,816.52 | 35,771.56 | 35,732.21 |
| Wood | 5343.30 | 5349.02 | 5359.91 | 5379.84 | 5403.99 | 5429.60 | 5457.12 | 5464.79 | 5468.22 | 5476.11 | 5475.94 | 5479.54 | 5480.84 | 5486.20 | 5491.17 | 5494.58 | 5498.00 | 5497.10 | 5502.32 | 5507.96 | 5508.67 | 5513.19 | 5516.35 | 5527.36 | 5539.38 | 5555.28 |
| Iron/steel | 2064.39 | 2084.43 | 2110.48 | 2147.31 | 2188.97 | 2232.00 | 2276.97 | 2298.49 | 2315.90 | 2340.01 | 2355.28 | 2410.82 | 2457.93 | 2519.61 | 2581.26 | 2648.64 | 2723.63 | 2783.39 | 2869.86 | 2949.76 | 3010.67 | 3078.38 | 3131.30 | 3204.97 | 3274.41 | 3357.59 |
| Glass | 178.46 | 183.14 | 188.32 | 194.39 | 200.86 | 207.44 | 214.18 | 218.99 | 223.46 | 228.48 | 232.76 | 239.36 | 245.29 | 252.65 | 259.66 | 266.07 | 273.98 | 279.98 | 287.62 | 295.79 | 302.46 | 309.54 | 315.51 | 321.76 | 327.39 | 333.62 |
| Mineral wool | 163.21 | 172.46 | 182.87 | 195.36 | 208.76 | 222.42 | 236.44 | 245.95 | 254.70 | 264.80 | 273.21 | 283.76 | 293.20 | 305.02 | 316.19 | 325.97 | 338.60 | 347.87 | 359.63 | 372.56 | 383.15 | 394.34 | 403.54 | 412.60 | 420.46 | 429.09 |
| Polystyrene | 41.75 | 49.15 | 56.70 | 64.55 | 72.52 | 80.52 | 88.58 | 96.01 | 103.33 | 110.84 | 118.12 | 131.63 | 144.21 | 160.11 | 174.43 | 187.36 | 204.30 | 216.71 | 231.83 | 249.48 | 263.44 | 277.45 | 290.41 | 302.00 | 311.97 | 322.63 |
| Year | 1990 | 1991 | 1992 | 1993 | 1994 | 1995 | 1996 | 1997 | 1998 | 1999 | 2000 | 2001 | 2002 | 2003 | 2004 | 2005 | 2006 | 2007 | 2008 | 2009 | 2010 | 2011 | 2012 | 2013 | 2014 | 2015 |
|---|---|---|---|---|---|---|---|---|---|---|---|---|---|---|---|---|---|---|---|---|---|---|---|---|---|---|
| Population | 1,502,772 | 1,522,449 | 1,537,523 | 1,549,436 | 1,542,667 | 1,539,002 | 1,542,191 | 1,540,875 | 1,542,252 | 1,548,537 | 1,571,123 | 1,553,956 | 1,592,846 | 1,610,410 | 1,632,569 | 1,652,449 | 1,661,246 | 1,671,221 | 1,680,135 | 1,689,995 | 1,702,855 | 1,717,084 | 1,741,246 | 1,766,746 | 1,797,337 | 1,840,226 |
| 2. Commercial buildings | ||||||||||||||||||||||||||
| MAT_FLOW_INPUT | 1488.78 | 1488.78 | 1488.78 | 1488.78 | 1488.78 | 1488.78 | 1488.78 | 1488.78 | 1488.78 | 1488.78 | 849.05 | 849.05 | 849.05 | 849.05 | 849.05 | 849.05 | 849.05 | 849.05 | 849.05 | 849.05 | 849.05 | 849.05 | 849.05 | 849.05 | 849.05 | |
| Concrete | 1074.91 | 1074.91 | 1074.91 | 1074.91 | 1074.91 | 1074.91 | 1074.91 | 1074.91 | 1074.91 | 1074.91 | 669.99 | 669.99 | 669.99 | 669.99 | 669.99 | 669.99 | 669.99 | 669.99 | 669.99 | 669.99 | 669.99 | 669.99 | 669.99 | 669.99 | 669.99 | |
| Bricks | 307.12 | 307.12 | 307.12 | 307.12 | 307.12 | 307.12 | 307.12 | 307.12 | 307.12 | 307.12 | 125.35 | 125.35 | 125.35 | 125.35 | 125.35 | 125.35 | 125.35 | 125.35 | 125.35 | 125.35 | 125.35 | 125.35 | 125.35 | 125.35 | 125.35 | |
| Mortar and plaster | 57.13 | 57.13 | 57.13 | 57.13 | 57.13 | 57.13 | 57.13 | 57.13 | 57.13 | 57.13 | 24.20 | 24.20 | 24.20 | 24.20 | 24.20 | 24.20 | 24.20 | 24.20 | 24.20 | 24.20 | 24.20 | 24.20 | 24.20 | 24.20 | 24.20 | |
| Wood | 3.73 | 3.73 | 3.73 | 3.73 | 3.73 | 3.73 | 3.73 | 3.73 | 3.73 | 3.73 | 1.86 | 1.86 | 1.86 | 1.86 | 1.86 | 1.86 | 1.86 | 1.86 | 1.86 | 1.86 | 1.86 | 1.86 | 1.86 | 1.86 | 1.86 | |
| Iron/steel | 39.93 | 39.93 | 39.93 | 39.93 | 39.93 | 39.93 | 39.93 | 39.93 | 39.93 | 39.93 | 20.53 | 20.53 | 20.53 | 20.53 | 20.53 | 20.53 | 20.53 | 20.53 | 20.53 | 20.53 | 20.53 | 20.53 | 20.53 | 20.53 | 20.53 | |
| Glass | 3.30 | 3.30 | 3.30 | 3.30 | 3.30 | 3.30 | 3.30 | 3.30 | 3.30 | 3.30 | 2.00 | 2.00 | 2.00 | 2.00 | 2.00 | 2.00 | 2.00 | 2.00 | 2.00 | 2.00 | 2.00 | 2.00 | 2.00 | 2.00 | 2.00 | |
| Mineral wool | 2.26 | 2.26 | 2.26 | 2.26 | 2.26 | 2.26 | 2.26 | 2.26 | 2.26 | 2.26 | 3.87 | 3.87 | 3.87 | 3.87 | 3.87 | 3.87 | 3.87 | 3.87 | 3.87 | 3.87 | 3.87 | 3.87 | 3.87 | 3.87 | 3.87 | |
| Polystyrene | 0.41 | 0.41 | 0.41 | 0.41 | 0.41 | 0.41 | 0.41 | 0.41 | 0.41 | 0.41 | 1.23 | 1.23 | 1.23 | 1.23 | 1.23 | 1.23 | 1.23 | 1.23 | 1.23 | 1.23 | 1.23 | 1.23 | 1.23 | 1.23 | 1.23 | |
| MAT_FLOW_OUTPUT | 174.71 | 162.06 | 149.41 | 136.76 | 124.11 | 111.46 | 134.20 | 156.93 | 179.67 | 202.41 | 204.24 | 190.96 | 207.55 | 235.91 | 267.14 | 299.74 | 282.04 | 455.06 | 432.61 | 436.85 | 441.08 | 445.31 | 449.54 | 453.77 | 453.77 | |
| Concrete | 86.07 | 78.00 | 69.92 | 61.84 | 53.76 | 45.68 | 58.41 | 71.13 | 83.85 | 96.58 | 99.96 | 93.19 | 101.66 | 118.59 | 131.34 | 148.36 | 130.15 | 248.63 | 238.11 | 242.59 | 247.06 | 251.54 | 256.02 | 260.49 | 260.49 | |
| Bricks | 59.71 | 56.30 | 52.89 | 49.47 | 46.06 | 42.65 | 50.11 | 57.58 | 65.04 | 72.51 | 71.35 | 66.52 | 72.56 | 81.08 | 94.83 | 106.45 | 106.78 | 147.55 | 138.66 | 138.49 | 138.32 | 138.14 | 137.97 | 137.80 | 137.80 | |
| Mortar and plaster | 23.19 | 22.39 | 21.60 | 20.80 | 20.00 | 19.21 | 21.13 | 23.05 | 24.98 | 26.90 | 26.41 | 25.11 | 26.74 | 28.84 | 32.78 | 35.87 | 36.65 | 45.36 | 42.90 | 42.68 | 42.47 | 42.25 | 42.03 | 41.81 | 41.81 | |
| Wood | 1.24 | 1.18 | 1.12 | 1.06 | 1.00 | 0.94 | 1.07 | 1.19 | 1.32 | 1.44 | 1.43 | 1.35 | 1.45 | 1.59 | 1.81 | 2.00 | 1.99 | 2.71 | 2.56 | 2.56 | 2.56 | 2.57 | 2.57 | 2.57 | 2.57 | |
| Iron/steel | 3.07 | 2.80 | 2.53 | 2.26 | 1.99 | 1.72 | 2.16 | 2.61 | 3.05 | 3.49 | 3.58 | 3.34 | 3.64 | 4.22 | 4.71 | 5.32 | 4.78 | 8.65 | 8.27 | 8.40 | 8.53 | 8.66 | 8.79 | 8.93 | 8.93 | |
| Glass | 0.68 | 0.66 | 0.64 | 0.62 | 0.60 | 0.58 | 0.61 | 0.65 | 0.68 | 0.71 | 0.72 | 0.70 | 0.72 | 0.77 | 0.80 | 0.85 | 0.81 | 1.09 | 1.06 | 1.07 | 1.08 | 1.09 | 1.10 | 1.11 | 1.11 | |
| Mineral wool | 0.66 | 0.65 | 0.64 | 0.63 | 0.61 | 0.60 | 0.62 | 0.65 | 0.67 | 0.69 | 0.69 | 0.68 | 0.70 | 0.73 | 0.76 | 0.79 | 0.77 | 0.95 | 0.93 | 0.93 | 0.94 | 0.94 | 0.95 | 0.95 | 0.95 | |
| Polystyrene | 0.08 | 0.08 | 0.08 | 0.08 | 0.08 | 0.08 | 0.08 | 0.08 | 0.08 | 0.09 | 0.09 | 0.09 | 0.09 | 0.09 | 0.10 | 0.10 | 0.10 | 0.12 | 0.12 | 0.12 | 0.12 | 0.12 | 0.12 | 0.12 | 0.12 | |
| MAT_STOCK | 58,908.63 | 60,222.71 | 61,549.43 | 62,888.80 | 64,240.82 | 65,605.49 | 66,982.82 | 68,337.40 | 69,669.25 | 70,978.36 | 72,264.73 | 72,909.54 | 73,567.63 | 74,209.12 | 74,822.26 | 75,404.16 | 75,953.47 | 76,520.48 | 76,914.46 | 77,330.89 | 77,743.09 | 78,151.06 | 78,554.80 | 78,954.31 | 79,349.58 | 79,744.86 |
| Concrete | 22,941.05 | 23,929.88 | 24,926.79 | 25,931.78 | 26,944.85 | 27,965.99 | 28,995.21 | 30,011.71 | 31,015.48 | 32,006.54 | 32,984.86 | 33,554.89 | 34,131.70 | 34,700.03 | 35,251.43 | 35,790.08 | 36,311.71 | 36,851.56 | 37,272.92 | 37,704.80 | 38,132.21 | 38,555.14 | 38,973.59 | 39,387.57 | 39,797.07 | 40,206.57 |
| Bricks | 26,778.22 | 27,025.62 | 27,276.44 | 27,530.67 | 27,788.31 | 28,049.37 | 28,313.84 | 28,570.84 | 28,820.38 | 29,062.45 | 29,297.06 | 29,351.06 | 29,409.90 | 29,462.69 | 29,506.97 | 29,537.48 | 29,556.39 | 29,574.96 | 29,552.77 | 29,539.46 | 29,526.32 | 29,513.36 | 29,500.57 | 29,487.95 | 29,475.51 | 29,463.06 |
| Mortar and plaster | 7717.26 | 7751.21 | 7785.94 | 7821.48 | 7857.81 | 7894.94 | 7932.87 | 7968.87 | 8002.94 | 8035.10 | 8065.33 | 8063.12 | 8062.22 | 8059.68 | 8055.05 | 8046.47 | 8034.80 | 8022.35 | 8001.20 | 7982.50 | 7964.01 | 7945.75 | 7927.71 | 7909.88 | 7892.28 | 7874.67 |
| Wood | 425.55 | 428.05 | 430.61 | 433.22 | 435.90 | 438.63 | 441.42 | 444.09 | 446.63 | 449.05 | 451.34 | 451.78 | 452.30 | 452.72 | 453.00 | 453.05 | 452.92 | 452.79 | 451.95 | 451.25 | 450.55 | 449.85 | 449.15 | 448.45 | 447.74 | 447.04 |
| Iron/steel | 909.39 | 946.25 | 983.37 | 1020.77 | 1058.43 | 1096.37 | 1134.57 | 1172.34 | 1209.66 | 1246.53 | 1282.97 | 1299.92 | 1317.11 | 1334.00 | 1350.32 | 1366.14 | 1381.35 | 1397.10 | 1408.98 | 1421.25 | 1433.38 | 1445.38 | 1457.25 | 1468.99 | 1480.60 | 1492.20 |
| Glass | 71.31 | 73.93 | 76.57 | 79.23 | 81.92 | 84.62 | 87.34 | 90.03 | 92.68 | 95.30 | 97.89 | 99.17 | 100.47 | 101.75 | 102.99 | 104.18 | 105.33 | 106.52 | 107.43 | 108.37 | 109.30 | 110.22 | 111.13 | 112.03 | 112.92 | 113.81 |
| Mineral wool | 59.31 | 60.90 | 62.51 | 64.14 | 65.77 | 67.42 | 69.09 | 70.73 | 72.34 | 73.93 | 75.50 | 78.68 | 81.87 | 85.05 | 88.19 | 91.31 | 94.39 | 97.49 | 100.41 | 103.35 | 106.29 | 109.22 | 112.15 | 115.07 | 117.99 | 120.91 |
| Polystyrene | 6.54 | 6.86 | 7.18 | 7.51 | 7.83 | 8.16 | 8.49 | 8.81 | 9.13 | 9.45 | 9.77 | 10.91 | 12.05 | 13.19 | 14.32 | 15.45 | 16.58 | 17.71 | 18.82 | 19.93 | 21.04 | 22.15 | 23.26 | 24.37 | 25.48 | 26.59 |
| Year | 1990 | 1991 | 1992 | 1993 | 1994 | 1995 | 1996 | 1997 | 1998 | 1999 | 2000 | 2001 | 2002 | 2003 | 2004 | 2005 | 2006 | 2007 | 2008 | 2009 | 2010 | 2011 | 2012 | 2013 | 2014 | 2015 |
|---|---|---|---|---|---|---|---|---|---|---|---|---|---|---|---|---|---|---|---|---|---|---|---|---|---|---|
| Population | 1,502,772 | 1,522,449 | 1,537,523 | 1,549,436 | 1,542,667 | 1,539,002 | 1,542,191 | 1,540,875 | 1,542,252 | 1,548,537 | 1,571,123 | 1,553,956 | 1,592,846 | 1,610,410 | 1,632,569 | 1,652,449 | 1,661,246 | 1,671,221 | 1,680,135 | 1,689,995 | 1,702,855 | 1,717,084 | 1,741,246 | 1,766,746 | 1,797,337 | 1,840,226 |
| 3. Industrial buildings | ||||||||||||||||||||||||||
| MAT_FLOW_INPUT | 324.27 | 324.27 | 324.27 | 324.27 | 324.27 | 324.27 | 324.27 | 324.27 | 324.27 | 324.27 | 125.35 | 125.35 | 125.35 | 125.35 | 125.35 | 125.35 | 125.35 | 125.35 | 125.35 | 125.35 | 125.35 | 125.35 | 125.35 | 125.35 | 125.35 | |
| Concrete | 180.95 | 180.95 | 180.95 | 180.95 | 180.95 | 180.95 | 180.95 | 180.95 | 180.95 | 180.95 | 96.67 | 96.67 | 96.67 | 96.67 | 96.67 | 96.67 | 96.67 | 96.67 | 96.67 | 96.67 | 96.67 | 96.67 | 96.67 | 96.67 | 96.67 | |
| Bricks | 120.64 | 120.64 | 120.64 | 120.64 | 120.64 | 120.64 | 120.64 | 120.64 | 120.64 | 120.64 | 20.77 | 20.77 | 20.77 | 20.77 | 20.77 | 20.77 | 20.77 | 20.77 | 20.77 | 20.77 | 20.77 | 20.77 | 20.77 | 20.77 | 20.77 | |
| Mortar and plaster | 4.34 | 4.34 | 4.34 | 4.34 | 4.34 | 4.34 | 4.34 | 4.34 | 4.34 | 4.34 | 1.79 | 1.79 | 1.79 | 1.79 | 1.79 | 1.79 | 1.79 | 1.79 | 1.79 | 1.79 | 1.79 | 1.79 | 1.79 | 1.79 | 1.79 | |
| Wood | 1.45 | 1.45 | 1.45 | 1.45 | 1.45 | 1.45 | 1.45 | 1.45 | 1.45 | 1.45 | 0.75 | 0.75 | 0.75 | 0.75 | 0.75 | 0.75 | 0.75 | 0.75 | 0.75 | 0.75 | 0.75 | 0.75 | 0.75 | 0.75 | 0.75 | |
| Iron/steel | 16.89 | 16.89 | 16.89 | 16.89 | 16.89 | 16.89 | 16.89 | 16.89 | 16.89 | 16.89 | 4.65 | 4.65 | 4.65 | 4.65 | 4.65 | 4.65 | 4.65 | 4.65 | 4.65 | 4.65 | 4.65 | 4.65 | 4.65 | 4.65 | 4.65 | |
| Glass | - | - | - | - | - | - | - | - | - | 0.00 | 0.18 | 0.18 | 0.18 | 0.18 | 0.18 | 0.18 | 0.18 | 0.18 | 0.18 | 0.18 | 0.18 | 0.18 | 0.18 | 0.18 | 0.18 | |
| Mineral wool | - | - | - | - | - | - | - | - | - | 0.00 | 0.30 | 0.30 | 0.30 | 0.30 | 0.30 | 0.30 | 0.30 | 0.30 | 0.30 | 0.30 | 0.30 | 0.30 | 0.30 | 0.30 | 0.30 | |
| Polystyrene | - | - | - | - | - | - | - | - | - | 0.00 | 0.24 | 0.24 | 0.24 | 0.24 | 0.24 | 0.24 | 0.24 | 0.24 | 0.24 | 0.24 | 0.24 | 0.24 | 0.24 | 0.24 | 0.24 | |
| MAT_FLOW_OUTPUT | 109.55 | 103.47 | 97.40 | 91.32 | 85.24 | 79.16 | 92.74 | 106.33 | 119.91 | 133.49 | 131.08 | 122.19 | 133.30 | 148.65 | 174.30 | 195.59 | 197.30 | 268.61 | 252.18 | 251.59 | 250.99 | 250.40 | 249.81 | 249.21 | 249.21 | |
| Concrete | 44.52 | 41.63 | 38.75 | 35.86 | 32.97 | 30.08 | 35.86 | 41.64 | 47.42 | 53.20 | 52.89 | 49.30 | 53.79 | 60.64 | 70.13 | 78.82 | 77.03 | 113.93 | 107.56 | 107.95 | 108.33 | 108.72 | 109.10 | 109.49 | 109.49 | |
| Bricks | 46.68 | 44.40 | 42.11 | 39.83 | 37.54 | 35.26 | 40.86 | 46.45 | 52.05 | 57.65 | 56.13 | 52.33 | 57.09 | 63.18 | 74.79 | 83.84 | 86.37 | 110.98 | 103.76 | 103.05 | 102.34 | 101.63 | 100.92 | 100.21 | 100.21 | |
| Mortar and plaster | 12.58 | 11.96 | 11.33 | 10.70 | 10.08 | 9.45 | 10.97 | 12.48 | 14.00 | 15.51 | 15.12 | 14.09 | 15.38 | 17.03 | 20.14 | 22.58 | 23.20 | 30.03 | 28.09 | 27.91 | 27.74 | 27.56 | 27.38 | 27.21 | 27.21 | |
| Wood | 2.77 | 2.66 | 2.55 | 2.45 | 2.34 | 2.23 | 2.55 | 2.86 | 3.18 | 3.49 | 3.35 | 3.13 | 3.41 | 3.73 | 4.48 | 5.02 | 5.34 | 6.25 | 5.80 | 5.72 | 5.63 | 5.55 | 5.46 | 5.38 | 5.38 | |
| Iron/steel | 2.89 | 2.72 | 2.55 | 2.39 | 2.22 | 2.05 | 2.41 | 2.78 | 3.14 | 3.50 | 3.45 | 3.22 | 3.51 | 3.93 | 4.59 | 5.15 | 5.15 | 7.18 | 6.75 | 6.75 | 6.74 | 6.74 | 6.73 | 6.73 | 6.73 | |
| Glass | 0.08 | 0.08 | 0.07 | 0.07 | 0.07 | 0.07 | 0.08 | 0.08 | 0.09 | 0.10 | 0.09 | 0.09 | 0.10 | 0.10 | 0.13 | 0.14 | 0.16 | 0.16 | 0.15 | 0.15 | 0.14 | 0.14 | 0.13 | 0.13 | 0.13 | |
| Mineral wool | 0.01 | 0.01 | 0.01 | 0.01 | 0.01 | 0.01 | 0.01 | 0.01 | 0.01 | 0.01 | 0.01 | 0.01 | 0.01 | 0.01 | 0.01 | 0.02 | 0.02 | 0.02 | 0.02 | 0.02 | 0.02 | 0.02 | 0.02 | 0.01 | 0.01 | |
| Polystyrene | 0.02 | 0.02 | 0.02 | 0.02 | 0.02 | 0.01 | 0.02 | 0.02 | 0.02 | 0.03 | 0.03 | 0.02 | 0.03 | 0.03 | 0.03 | 0.04 | 0.04 | 0.06 | 0.06 | 0.06 | 0.06 | 0.06 | 0.06 | 0.06 | 0.06 | |
| MAT_STOCK | 20,757.91 | 20,972.63 | 21,193.43 | 21,420.30 | 21,653.26 | 21,892.29 | 22,137.39 | 22,368.92 | 22,586.86 | 22,791.23 | 22,982.01 | 22,976.29 | 22,979.45 | 22,971.50 | 22,948.20 | 22,899.25 | 22,829.01 | 22,757.06 | 22,613.81 | 22,486.98 | 22,360.75 | 22,235.11 | 22,110.06 | 21,985.61 | 21,861.75 | 21,737.89 |
| Concrete | 9221.97 | 9358.40 | 9497.72 | 9639.93 | 9785.03 | 9933.01 | 10,083.89 | 10,228.99 | 10,368.30 | 10,501.84 | 10,629.59 | 10,673.38 | 10,720.75 | 10,763.64 | 10,799.67 | 10,826.21 | 10,844.07 | 10,863.71 | 10,846.45 | 10,835.56 | 10,824.29 | 10,812.63 | 10,800.58 | 10,788.15 | 10,775.34 | 10,762.52 |
| Bricks | 8363.35 | 8437.31 | 8513.55 | 8592.07 | 8672.88 | 8755.97 | 8841.35 | 8921.13 | 8995.31 | 9063.89 | 9126.88 | 9091.52 | 9059.96 | 9023.64 | 8981.23 | 8927.20 | 8864.13 | 8798.53 | 8708.31 | 8625.32 | 8543.04 | 8461.47 | 8380.60 | 8300.45 | 8221.00 | 8141.56 |
| Mortar and plaster | 2153.61 | 2145.38 | 2137.76 | 2130.78 | 2124.42 | 2118.68 | 2113.57 | 2106.95 | 2098.81 | 2089.15 | 2077.99 | 2064.66 | 2052.35 | 2038.77 | 2023.52 | 2005.17 | 1984.39 | 1962.97 | 1934.74 | 1908.44 | 1882.32 | 1856.38 | 1830.61 | 1805.01 | 1779.60 | 1754.18 |
| Wood | 390.90 | 389.58 | 388.37 | 387.26 | 386.26 | 385.37 | 384.58 | 383.48 | 382.07 | 380.34 | 378.29 | 375.69 | 373.32 | 370.66 | 367.68 | 363.95 | 359.68 | 355.10 | 349.60 | 344.55 | 339.59 | 334.71 | 329.91 | 325.20 | 320.58 | 315.96 |
| Iron/steel | 611.66 | 625.66 | 639.83 | 654.16 | 668.67 | 683.34 | 698.18 | 712.65 | 726.76 | 740.51 | 753.90 | 755.10 | 756.54 | 757.69 | 758.41 | 758.48 | 757.99 | 757.50 | 754.97 | 752.88 | 750.79 | 748.70 | 746.62 | 744.54 | 742.47 | 740.39 |
| Glass | 10.90 | 10.82 | 10.75 | 10.67 | 10.60 | 10.53 | 10.47 | 10.39 | 10.31 | 10.22 | 10.12 | 10.20 | 10.30 | 10.39 | 10.47 | 10.52 | 10.56 | 10.59 | 10.61 | 10.64 | 10.68 | 10.72 | 10.77 | 10.82 | 10.87 | 10.92 |
| Mineral wool | 1.18 | 1.17 | 1.16 | 1.15 | 1.15 | 1.14 | 1.13 | 1.12 | 1.11 | 1.10 | 1.09 | 1.38 | 1.67 | 1.95 | 2.24 | 2.52 | 2.80 | 3.08 | 3.36 | 3.64 | 3.92 | 4.21 | 4.49 | 4.77 | 5.05 | 5.33 |
| Polystyrene | 4.34 | 4.31 | 4.29 | 4.28 | 4.26 | 4.24 | 4.23 | 4.21 | 4.19 | 4.17 | 4.14 | 4.36 | 4.57 | 4.78 | 4.98 | 5.19 | 5.38 | 5.58 | 5.76 | 5.94 | 6.12 | 6.31 | 6.49 | 6.66 | 6.84 | 7.02 |
| Year | 1990 | 1991 | 1992 | 1993 | 1994 | 1995 | 1996 | 1997 | 1998 | 1999 | 2000 | 2001 | 2002 | 2003 | 2004 | 2005 | 2006 | 2007 | 2008 | 2009 | 2010 | 2011 | 2012 | 2013 | 2014 | 2015 |
|---|---|---|---|---|---|---|---|---|---|---|---|---|---|---|---|---|---|---|---|---|---|---|---|---|---|---|
| Population | 1,502,772 | 1,522,449 | 1,537,523 | 1,549,436 | 1,542,667 | 1,539,002 | 1,542,191 | 1,540,875 | 1,542,252 | 1,548,537 | 1,571,123 | 1,553,956 | 1,592,846 | 1,610,410 | 1,632,569 | 1,652,449 | 1,661,246 | 1,671,221 | 1,680,135 | 1,689,995 | 1,702,855 | 1,717,084 | 1,741,246 | 1,766,746 | 1,797,337 | 1,840,226 |
| 4. Other buildings | ||||||||||||||||||||||||||
| MAT_FLOW_INPUT | 222.46 | 222.46 | 222.46 | 222.46 | 222.46 | 222.46 | 222.46 | 222.46 | 222.46 | 222.46 | 145.17 | 145.17 | 145.17 | 145.17 | 145.17 | 145.17 | 145.17 | 145.17 | 145.17 | 145.17 | 145.17 | 145.17 | 145.17 | 145.17 | 145.17 | |
| Concrete | 148.84 | 148.84 | 148.84 | 148.84 | 148.84 | 148.84 | 148.84 | 148.84 | 148.84 | 148.84 | 116.67 | 116.67 | 116.67 | 116.67 | 116.67 | 116.67 | 116.67 | 116.67 | 116.67 | 116.67 | 116.67 | 116.67 | 116.67 | 116.67 | 116.67 | |
| Bricks | 50.33 | 50.33 | 50.33 | 50.33 | 50.33 | 50.33 | 50.33 | 50.33 | 50.33 | 50.33 | 20.14 | 20.14 | 20.14 | 20.14 | 20.14 | 20.14 | 20.14 | 20.14 | 20.14 | 20.14 | 20.14 | 20.14 | 20.14 | 20.14 | 20.14 | |
| Mortar and plaster | 15.88 | 15.88 | 15.88 | 15.88 | 15.88 | 15.88 | 15.88 | 15.88 | 15.88 | 15.88 | 1.82 | 1.82 | 1.82 | 1.82 | 1.82 | 1.82 | 1.82 | 1.82 | 1.82 | 1.82 | 1.82 | 1.82 | 1.82 | 1.82 | 1.82 | |
| Wood | 1.68 | 1.68 | 1.68 | 1.68 | 1.68 | 1.68 | 1.68 | 1.68 | 1.68 | 1.68 | 1.00 | 1.00 | 1.00 | 1.00 | 1.00 | 1.00 | 1.00 | 1.00 | 1.00 | 1.00 | 1.00 | 1.00 | 1.00 | 1.00 | 1.00 | |
| Iron/steel | 5.00 | 5.00 | 5.00 | 5.00 | 5.00 | 5.00 | 5.00 | 5.00 | 5.00 | 5.00 | 4.46 | 4.46 | 4.46 | 4.46 | 4.46 | 4.46 | 4.46 | 4.46 | 4.46 | 4.46 | 4.46 | 4.46 | 4.46 | 4.46 | 4.46 | |
| Glass | 0.29 | 0.29 | 0.29 | 0.29 | 0.29 | 0.29 | 0.29 | 0.29 | 0.29 | 0.29 | 0.27 | 0.27 | 0.27 | 0.27 | 0.27 | 0.27 | 0.27 | 0.27 | 0.27 | 0.27 | 0.27 | 0.27 | 0.27 | 0.27 | 0.27 | |
| Mineral wool | 0.39 | 0.39 | 0.39 | 0.39 | 0.39 | 0.39 | 0.39 | 0.39 | 0.39 | 0.39 | 0.43 | 0.43 | 0.43 | 0.43 | 0.43 | 0.43 | 0.43 | 0.43 | 0.43 | 0.43 | 0.43 | 0.43 | 0.43 | 0.43 | 0.43 | |
| Polystyrene | 0.05 | 0.05 | 0.05 | 0.05 | 0.05 | 0.05 | 0.05 | 0.05 | 0.05 | 0.05 | 0.38 | 0.38 | 0.38 | 0.38 | 0.38 | 0.38 | 0.38 | 0.38 | 0.38 | 0.38 | 0.38 | 0.38 | 0.38 | 0.38 | 0.38 | |
| MAT_FLOW_OUTPUT | 19.56 | 18.79 | 18.03 | 17.27 | 16.50 | 15.74 | 17.97 | 20.19 | 22.41 | 24.64 | 23.69 | 22.09 | 24.10 | 26.36 | 31.66 | 35.43 | 37.64 | 44.29 | 41.12 | 40.53 | 39.94 | 39.36 | 38.77 | 38.18 | 38.18 | |
| Concrete | 4.59 | 4.26 | 3.92 | 3.58 | 3.25 | 2.91 | 3.53 | 4.15 | 4.77 | 5.39 | 5.42 | 5.05 | 5.51 | 6.27 | 7.17 | 8.07 | 7.66 | 12.18 | 11.55 | 11.65 | 11.75 | 11.84 | 11.94 | 12.04 | 12.04 | |
| Bricks | 10.15 | 9.86 | 9.57 | 9.28 | 9.00 | 8.71 | 9.79 | 10.88 | 11.97 | 13.06 | 12.39 | 11.55 | 12.60 | 13.62 | 16.61 | 18.56 | 20.35 | 21.75 | 20.03 | 19.57 | 19.10 | 18.63 | 18.17 | 17.70 | 17.70 | |
| Mortar and plaster | 3.94 | 3.83 | 3.72 | 3.61 | 3.50 | 3.39 | 3.82 | 4.24 | 4.66 | 5.08 | 4.82 | 4.49 | 4.90 | 5.29 | 6.46 | 7.22 | 7.92 | 8.43 | 7.76 | 7.58 | 7.39 | 7.21 | 7.02 | 6.84 | 6.84 | |
| Wood | 0.60 | 0.59 | 0.57 | 0.56 | 0.54 | 0.53 | 0.59 | 0.66 | 0.72 | 0.78 | 0.74 | 0.69 | 0.75 | 0.81 | 0.99 | 1.11 | 1.23 | 1.26 | 1.16 | 1.13 | 1.10 | 1.06 | 1.03 | 1.00 | 1.00 | |
| Iron/steel | 0.24 | 0.23 | 0.21 | 0.20 | 0.19 | 0.18 | 0.21 | 0.23 | 0.26 | 0.29 | 0.29 | 0.27 | 0.29 | 0.32 | 0.38 | 0.43 | 0.44 | 0.58 | 0.54 | 0.54 | 0.54 | 0.53 | 0.53 | 0.53 | 0.53 | |
| Glass | 0.02 | 0.02 | 0.02 | 0.02 | 0.02 | 0.01 | 0.02 | 0.02 | 0.02 | 0.02 | 0.02 | 0.02 | 0.02 | 0.02 | 0.03 | 0.03 | 0.03 | 0.04 | 0.04 | 0.04 | 0.04 | 0.04 | 0.04 | 0.04 | 0.04 | |
| Mineral wool | 0.01 | 0.01 | 0.01 | 0.01 | 0.01 | 0.01 | 0.01 | 0.01 | 0.01 | 0.01 | 0.01 | 0.01 | 0.01 | 0.02 | 0.02 | 0.02 | 0.02 | 0.03 | 0.03 | 0.03 | 0.03 | 0.03 | 0.03 | 0.03 | 0.03 | |
| Polystyrene | 0.00 | 0.00 | 0.00 | 0.00 | 0.00 | 0.00 | 0.00 | 0.00 | 0.00 | 0.00 | 0.00 | 0.00 | 0.00 | 0.00 | 0.00 | 0.00 | 0.00 | 0.01 | 0.00 | 0.00 | 0.00 | 0.01 | 0.01 | 0.01 | 0.01 | |
| MAT_STOCK | 13,931.35 | 14,134.25 | 14,337.92 | 14,542.35 | 14,747.54 | 14,953.49 | 15,160.21 | 15,364.70 | 15,566.97 | 15,767.01 | 15,964.83 | 16,086.31 | 16,209.40 | 16,330.47 | 16,449.28 | 16,562.79 | 16,672.53 | 16,780.06 | 16,880.94 | 16,984.99 | 17,089.63 | 17,194.86 | 17,300.68 | 17,407.08 | 17,514.07 | 17,621.06 |
| Concrete | 5036.17 | 5180.41 | 5325.00 | 5469.91 | 5615.17 | 5760.76 | 5906.69 | 6051.99 | 6196.68 | 6340.75 | 6484.19 | 6595.45 | 6707.07 | 6818.24 | 6928.64 | 7038.14 | 7146.75 | 7255.77 | 7360.26 | 7465.38 | 7570.41 | 7675.33 | 7780.16 | 7884.90 | 7989.54 | 8094.17 |
| Bricks | 5946.19 | 5986.38 | 6026.85 | 6067.61 | 6108.66 | 6150.00 | 6191.63 | 6232.17 | 6271.62 | 6309.98 | 6347.26 | 6355.01 | 6363.59 | 6371.12 | 6377.64 | 6381.17 | 6382.75 | 6382.54 | 6380.92 | 6381.03 | 6381.60 | 6382.64 | 6384.15 | 6386.12 | 6388.55 | 6390.99 |
| Mortar and plaster | 2403.14 | 2415.07 | 2427.12 | 2439.27 | 2451.54 | 2463.91 | 2476.40 | 2488.46 | 2500.11 | 2511.33 | 2522.13 | 2519.13 | 2516.46 | 2513.38 | 2509.91 | 2505.27 | 2499.87 | 2493.77 | 2487.16 | 2481.22 | 2475.46 | 2469.89 | 2464.50 | 2459.30 | 2,454.28 | 2449.26 |
| Wood | 321.45 | 322.53 | 323.62 | 324.73 | 325.85 | 326.99 | 328.14 | 329.23 | 330.26 | 331.22 | 332.12 | 332.39 | 332.70 | 332.95 | 333.15 | 333.16 | 333.06 | 332.83 | 332.57 | 332.42 | 332.29 | 332.20 | 332.14 | 332.10 | 332.11 | 332.11 |
| Iron/steel | 194.63 | 199.39 | 204.17 | 208.95 | 213.75 | 218.56 | 223.38 | 228.18 | 232.94 | 237.68 | 242.38 | 246.56 | 250.75 | 254.92 | 259.06 | 263.14 | 267.17 | 271.20 | 275.08 | 279.00 | 282.92 | 286.85 | 290.77 | 294.70 | 298.63 | 302.57 |
| Glass | 14.23 | 14.50 | 14.77 | 15.05 | 15.32 | 15.60 | 15.88 | 16.15 | 16.42 | 16.69 | 16.96 | 17.21 | 17.45 | 17.70 | 17.94 | 18.18 | 18.42 | 18.65 | 18.88 | 19.11 | 19.33 | 19.56 | 19.79 | 20.02 | 20.25 | 20.48 |
| Mineral wool | 12.59 | 12.97 | 13.34 | 13.72 | 14.10 | 14.48 | 14.87 | 15.25 | 15.62 | 16.00 | 16.38 | 16.79 | 17.21 | 17.62 | 18.03 | 18.44 | 18.85 | 19.26 | 19.66 | 20.06 | 20.46 | 20.85 | 21.25 | 21.65 | 22.05 | 22.44 |
| Polystyrene | 2.96 | 3.00 | 3.05 | 3.09 | 3.14 | 3.18 | 3.23 | 3.27 | 3.32 | 3.36 | 3.40 | 3.78 | 4.16 | 4.54 | 4.91 | 5.29 | 5.66 | 6.04 | 6.41 | 6.79 | 7.16 | 7.54 | 7.91 | 8.29 | 8.66 | 9.03 |
References
- Kennedy, C.; Cuddihy, J.; Engel-Yan, J. The Changing Metabolism of Cities. J. Ind. Ecol. 2007, 11, 43–59. [Google Scholar] [CrossRef]
- Kennedy, C.; Steinberger, J.; Gasson, B.; Hansen, Y.; Hillman, T.; Havránek, M.; Pataki, D.; Phdungsilp, A.; Ramaswami, A.; Mendez, G.V. Greenhouse Gas Emissions from Global Cities. Environ. Sci. Technol. 2009, 43, 7297–7302. [Google Scholar] [CrossRef]
- Bai, X. Industrial Ecology and the Global Impacts of Cities. J. Ind. Ecol. 2007, 11, 1–6. [Google Scholar] [CrossRef]
- Weisz, H.; Steinberger, J.K. Reducing energy and material flows in cities. Curr. Opin. Environ. Sustain. 2010, 2, 185–192. [Google Scholar] [CrossRef]
- Grimm, N.B.; Faeth, S.H.; Golubiewski, N.E.; Redman, C.L.; Wu, J.; Bai, X.; Briggs, J.M. Global Change and the Ecology of Cities. Science 2008, 319, 756–760. [Google Scholar] [CrossRef] [Green Version]
- Phdungsilp, A. Integrated energy and carbon modeling with a decision support system: Policy scenarios for low-carbon city development in Bangkok. Energy Policy 2010, 38, 4808–4817. [Google Scholar] [CrossRef]
- Umweltbundesamt. Klimaschutzbericht 2016 (Climate Protection Report 2016); Umweltbundesamt: Vienna, Austria, 2017. [Google Scholar]
- Vogel, B.; Ritter, H.; Heumesser, U.; Höfenstöck, A.; Grgic, K.; Watzak-Helmer, M.; Cerveny, M.; Schmidt, W.; Valuch, M.; Beck, L.; et al. Energy! Ahead. Energy Report of the City of Vienna; Data for 2016/Year of Reporting 2018, Municipal Department 20 City of Vienna; Municipal Department 20: Vienna, Austria, 2018. [Google Scholar]
- Umweltbundesamt. Bundesländer Luftschadstoff-Inventur 1990–2016 (Federal States Air Emission Inventory 1990–2016); Umweltbundesamt: Vienna, Austria, 2018. [Google Scholar]
- MA23. Vienna in Figures 2017; Municipal Department 23 (MA23), Vienna City Administration: Wien, Austria, 2017. [Google Scholar]
- Augiseau, V.; Barles, S. Studying construction materials flows and stock: A review. Resour. Conserv. Recycl. 2017, 123, 153–164. [Google Scholar] [CrossRef]
- Kleemann, F.; Lederer, J.; Aschenbrenner, P.; Rechberger, H.; Fellner, J. A method for determining buildings’ material composition prior to demolition. Build. Res. Inf. 2016, 44, 51–62. [Google Scholar] [CrossRef]
- Blengini, G.A. Life cycle of buildings, demolition and recycling potential: A case study in Turin, Italy. Build. Environ. 2009, 44, 319–330. [Google Scholar] [CrossRef]
- Miatto, A.; Schandl, H.; Forlin, L.; Ronzani, F.; Borin, P.; Giordano, A.; Tanikawa, H. A spatial analysis of material stock accumulation and demolition waste potential of buildings: A case study of Padua. Resour. Conserv. Recycl. 2019, 142, 245–256. [Google Scholar] [CrossRef]
- Kleemann, F.; Lederer, J.; Rechberger, H.; Fellner, J. GIS-based Analysis of Vienna’s Material Stock in Buildings. J. Ind. Ecol. 2017, 21, 368–380. [Google Scholar] [CrossRef]
- Tanikawa, H.; Hashimoto, S. Urban stock over time: Spatial material stock analysis using 4d-GIS. Build. Res. Inf. 2009, 37, 483–502. [Google Scholar] [CrossRef]
- Reyna, J.L.; Chester, M.V. The growth of urban building stock: Unintended lock-in and embedded environmental effects. J. Ind. Ecol. 2015, 19, 524–537. [Google Scholar] [CrossRef]
- Schebek, L.; Schnitzer, B.; Blesinger, D.; Köhn, A.; Miekley, B.; Linke, H.J.; Lohmann, A.; Motzko, C.; Seemann, A. Material stocks of the non-residential building sector: The case of the Rhine-Main area. Resour. Conserv. Recycl. 2017, 123, 24–36. [Google Scholar] [CrossRef]
- Ortlepp, R.; Gruhler, K.; Schiller, G. Material stocks in Germany’s non-domestic buildings: A new quantification method. Build. Res. Inf. 2016, 44, 840–862. [Google Scholar] [CrossRef]
- Huang, T.; Shi, F.; Tanikawa, H.; Fei, J.; Han, J. Materials demand and environmental impact of buildings construction and demolition in China based on dynamic material flow analysis. Resour. Conserv. Recycl. 2013, 72, 91–101. [Google Scholar] [CrossRef]
- Müller, D.B. Stock dynamics for forecasting material flows—Case study for housing in The Netherlands. Ecol. Econ. 2006, 59, 142–156. [Google Scholar] [CrossRef]
- Pauliuk, S.; Sjöstrand, K.; Müller, D.B. Transforming the Norwegian Dwelling Stock to Reach the 2 Degrees Celsius Climate Target. J. Ind. Ecol. 2013, 17, 542–554. [Google Scholar] [CrossRef] [Green Version]
- Bergsdal, H.; Brattebø, H.; Bohne, R.A.; Müller, D.B. Dynamic material flow analysis for Norway’s dwelling stock. Build. Res. Inf. 2007, 35, 557–570. [Google Scholar] [CrossRef]
- Wiedenhofer, D.; Steinberger, J.K.; Eisenmenger, N.; Haas, W. Maintenance and expansion: Modeling material stocks and flows for residential buildings and transportation networks in the EU25. J. Ind. Ecol. 2015, 19, 538–551. [Google Scholar] [CrossRef] [Green Version]
- Sandberg, N.H.; Sartori, I.; Heidrich, O.; Dawson, R.; Dascalaki, E.; Dimitriou, S.; Vimm-r, T.; Filippidou, F.; Stegnar, G.; Šijanec Zavrl, M.; et al. Dynamic building stock modelling: Application to 11 European countries to support the energy efficiency and retrofit ambitions of the EU. Energy Build. 2016, 132, 26–38. [Google Scholar] [CrossRef] [Green Version]
- Mastrucci, A.; Marvuglia, A.; Popovici, E.; Leopold, U.; Benetto, E. Geospatial characterization of building material stocks for the life cycle assessment of end-of-life scenarios at the urban scale. Resour. Conserv. Recycl. 2017, 123, 54–66. [Google Scholar] [CrossRef]
- Pauliuk, S.; Müller, D.B. The role of in-use stocks in the social metabolism and in climate change mitigation. Glob. Environ. Chang. 2014, 24, 132–142. [Google Scholar] [CrossRef] [Green Version]
- Hu, M.; Van Der Voet, E.; Huppes, G. Dynamic material flow analysis for strategic construction and demolition waste management in Beijing. J. Ind. Ecol. 2010, 14, 440–456. [Google Scholar] [CrossRef]
- Brunner, P.H.; Rechberger, H. Handbook of Material Flow Analysis: For Environmental, Resource, and Waste Engineers, 2nd ed.; CRC Press: Boca Raton, FL, USA, 2016. [Google Scholar]
- Heeren, N.; Fishman, T. A database seed for a community-driven material intensity research platform. Sci. Data 2019, 6, 23. [Google Scholar] [CrossRef]
- ASI. Ermittlung von Flächen und Rauminhalten von Bauwerken und Zugehörigen Außenanlagen (Determination of Area and Volume of Building and Adjenct Outside Facilities); Austrian Standards Institute (ASI): Vienna, Austria, 2013. [Google Scholar]
- Statistics Austria. Häuser-und Wohnungszählung: Hauptergebnisse Wien (Buildings and Appartment Census: Main Results Vienna); Statistics Austria: Vienna, Austria, 1993.
- Statistics Austria. Wohnsituation der Bevölkerung 2001: Ergebnisse der Volks-, Gebäude- und Wohnungszählung 2001 (Living Situation of the Population 2001: Results of the Population, Buildings and Appartments Census 2001); Statistics Austria: Vienna, Austria, 2006.
- Magistrat der Stadt Wien. Wien im Querschnitt der Zeit. Ergebnisse aus der Registerzählung 2011 Teil 1: Gebäude- und Wohnungszählung (Vienna in the Cross Section of Time. Results of the Census 2011 Part 1: Buildings and Appartment census); Magistrat der Stadt Wien: Wien, Austria, 2015. [Google Scholar]
- Statistics Austria. STATcube Online Data Base of Statistics Austria; Statistics Austria: Vienna, Austria, 2019.
- Kummer, C. Dachgeschossausbauten in Wiener Gründerzeithäusern und ihre Auswirkungen auf den Baulichen Bestand (Rooftop Extensions in Vienna’s Wilhelminian Buildings and Their Impacts on the Original Construction); Technische Universität: Wien, Vienna, 2015. [Google Scholar]
- Gruber, E.; Gutmann, R.; Huber, M.; Oberhuemer, L. Leistbaren Wohnraum Schaffen—Stadt weiter bauen. Potenziale der Nachverdichtung in Einer Wachsenden Stadt: Herausforderungen und Bausteine Einer Sozialverträglichen Umsetzung (Creating Affordable Houseing—City Extending. Potentials for a Densification in a Growing City. Challenges and Elements for a Social Acceptable Implementation); Arbeiterkammer: Vienna, Austria, 2018. [Google Scholar]
- Kleemann, F.; Lehner, H.; Szczypińska, A.; Lederer, J.; Fellner, J. Using change detection data to assess amount and composition of demolition waste from buildings in Vienna. Resour. Conserv. Recycl. 2017, 123, 37–46. [Google Scholar] [CrossRef]
- Burgholzer, A.; Mraz, M.; Schenk, C.; Sommergruber, J. Fortschrittsbericht über die Umsetzung des Klimaschutzprogramms (KliP) der Stadt Wien (Progress Report for the Implementation of the Climate Protection Program (KLIP) of the City of Vienna); City of Vienna: Vienna, Austria, 2016. [Google Scholar]
- Kranzl, L.; Bayr, M.; Müller, A.; Hummel, M. Effekte Einer Steigerung der Thermischen Sanierungsrate Öffentlicher Gebäude (Effect of the Increase of the Thermal Insulation of Public Buildings); Technische Universität Wien, Institut für Energiesysteme und elektrische Antriebe, Energy Economics Group: Wien, Austria, 2012. [Google Scholar]
- Maia de Souza, D.; Lafontaine, M.; Charron-Doucet, F.; Chappert, B.; Kicak, K.; Duarte, F.; Lima, L. Comparative life cycle assessment of ceramic brick, concrete brick and cast-in-place reinforced concrete exterior walls. J. Clean. Prod. 2016, 137, 70–82. [Google Scholar] [CrossRef]
- Hasanbeigi, A.; Price, L.; Lin, E. Emerging energy-efficiency and CO2 emission-reduction technologies for cement and concrete production: A technical review. Renew. Sustain. Energy Rev. 2012, 16, 6220–6238. [Google Scholar] [CrossRef] [Green Version]
- Tockner, L. Mieten in Österreich und Wien 2008 bis 2016 (Housing prices in Austria and Vienna 2008 to 2016); Arbeiterkammer: Vienna, Austria, 2017. [Google Scholar]
- Stadt Wien. Smart City Wien Rahmenstrategie (Smart City Wien Framework Strategy) 2019–2050; Magistrat der Stadt Wien Vienna: Vienna, Austria, 2019. [Google Scholar]


| Reference year | Census year | Unit | Datasets per Construction Period of Units and UFA | Total | |||||||
|---|---|---|---|---|---|---|---|---|---|---|---|
| <1919 | 1919–1945 | 1946–1960 | 1961–1980 | 1981–1990 | 1991–2000 | 2001–2015 | No Data | ||||
| 1990 | 1991 | units | 321,750 | 101,411 | 114,770 | 235,224 | 79,936 | - | - | - | 853,091 |
| 2000 | 2001 | 309,416 | 97,256 | 113,336 | 233,054 | 72,326 | 20,490 | - | 64,867 | 910,745 | |
| 2010 | 2011 | 317,803 | 99,561 | 114,911 | 233,016 | 72,037 | 71,565 | 74,947 | - | 983,840 | |
| 1990 | 1991 | UFA in m2/unit | 66 | 58 | 60 | 72 | 71 | 79 | 80 | 66 | |
| 2010 | 2011 | 70 | 60 | 60 | 72 | 82 | 79 | 80 | 71 | ||
| 1990 | 1991 | UFAt in 106 m2 | 21.260 | 5.855 | 6.829 | 16.980 | 5.698 | - | - | - | 56.622 |
| 2010 | 2011 | 22.275 | 5.973 | 6.889 | 16.818 | 5.910 | 5.647 | 6.030 | - | 69.541 | |
| j | Building Category | Description |
|---|---|---|
| 1 | Before 1919 | Built before 1919, no thermal insulation and rooftop extension |
| 2 | Before 1919 renovated | Built before 1919 with some thermal insulation (walls, ceilings, windows) |
| 3 | Before 1919 rooftop | Rooftop extension constructed after 1990 on buildings built before 1919 |
| 4 | 1919–1945 | Built 1919–1945, no thermal insulation (rooftop extension partly included in original design) |
| 5 | 1919–1945 renovated | Built 1919–1945 with some thermal insulation (walls, ceilings, windows; rooftop extension partly included in the original design) |
| 6 | 1919–1945 rooftop | Rooftop extension constructed after 1990 on buildings built 1919–1945 (only in buildings were not included in the original design) |
| 7 | 1946–1980 | Built 1946–1980, no thermal insulation (rooftop extension included in original design) |
| 8 | 1946–1980 renovated | Built 1946–1980 with thermal insulation (rooftop extension included in original design) |
| 9 | 1981–2000 | Built 1981–2000 (thermal insulation and rooftop extension included in the original design) |
| 10 | 2001–2015 | Built 2001–2015 (thermal insulation and rooftop extension included in the original design) |
| Building Period | Residential | Commercial | Industrial | Other Buildings | Total |
|---|---|---|---|---|---|
| Building stock in the end of 2013 | |||||
| 1800–1918 | 215,967,960 | 59,345,975 | 10,180,961 | 11,979,473 | 297,474,370 |
| 1919–1945 | 47,210,066 | 7,407,339 | 5,623,038 | 3,913,600 | 64,154,043 |
| 1945–1980 | 148,080,210 | 32,673,894 | 19,712,946 | 11,323,494 | 211,790,544 |
| 1981–2000 | 84,403,724 | 56,005,361 | 23,306,260 | 9,809,226 | 173,524,571 |
| 2001–2015 | 44,357,339 | 28,096,457 | 4,654,658 | 4,513,714 | 81,622,169 |
| total | 540,019,300 | 183,529,026 | 68,114,084 | 57,185,187 | 848,847,596 |
| Building stock demolished in 2014 | |||||
| 1800–1918 | 486,073 | 144,290 | 143,471 | 54,333 | 828,167 |
| 1919–1945 | 89,329 | 28,320 | 118,699 | 4856 | 241,193 |
| 1945–1980 | 158,951 | 291,442 | 314,555 | 13,788 | 778,737 |
| 1981–2000 | 33,374 | 500,245 | 72,719 | 23,287 | 629,625 |
| 2001–2015 | 5112 | 84,360 | 1219 | 1271 | 91,961 |
| Total | 797,471 | 1,075,265 | 685,844 | 204,636 | 2,763,216 |
| Section | Parameter | Assumption | Potential Uncertainties |
|---|---|---|---|
| 2.3 | Rooftop extension UFArooftop | 1. Rooftop extensions between 1990–2015 were only applied to buildings built before 1946. 2. Eighty percent of rooftop extensions were constructed on buildings of the building period category <1919, and the average size is 411 m2 UFA. 3. The number of rooftop extensions constructed per year are uniformly distributed for the time spans 1990–2000 and 2001–2015. | 1. Rooftop extensions on buildings built after 1946 2. Small sample size to determine average size of rooftop extensions and distribution between building period categories 3. Distribution of rooftop extensions |
| 2.3 | Demolishing UFAdemolished | 4. The number and UFA of buildings demolished follows the generation of debris in CDW. | 4. CDW generation data gaps and demolishing of concrete buildings |
| 2.3 | Renovation UFArenovated | 5. Distribution of renovation activities between different building period categories | 5. Different distribution than assumed based on authorities |
| 2.3 | Material intensity MI | 6. Material intensity of renovated buildings and rooftop extension | 6. Assumption incorrect, small sample size rooftop extensions |
| 2.4 | Gross volume non-residential buildings GV | 7. Demolishing of GV of non-residential buildings based on CDW debris data 8. Construction uniformly distributes, 1% renovation rate | 7. Non-consideration of concrete buildings 8. Distribution of construction |
| Material | 1990 | 2000 | 2010 | 2015 | 1990 | 2000 | 2010 | 2015 | 1990 | 2000 | 2010 | 2015 |
|---|---|---|---|---|---|---|---|---|---|---|---|---|
| kt | kt | kt | kt | t/cap | t/cap | t/cap | t/cap | % | % | % | % | |
| Concrete | 94,483 | 121,264 | 144,566 | 155,895 | 63 | 77 | 85 | 85 | 35 | 39 | 43 | 45 |
| Bricks | 120,381 | 127,029 | 127,146 | 127,258 | 80 | 81 | 75 | 69 | 44 | 41 | 38 | 37 |
| Mortar and plaster | 47,969 | 49,704 | 48,374 | 47,810 | 32 | 32 | 28 | 26 | 18 | 16 | 15 | 14 |
| Wood | 6481 | 6638 | 6631 | 6650 | 4.3 | 4.2 | 3.9 | 3.6 | 2.4 | 2.1 | 2.0 | 1.9 |
| Iron/steel | 3780 | 4635 | 5478 | 5893 | 2.5 | 2.9 | 3.2 | 3.2 | 1.4 | 1.5 | 1.6 | 1.7 |
| Glass | 275 | 358 | 442 | 479 | 0.18 | 0.23 | 0.26 | 0.26 | 0.10 | 0.12 | 0.13 | 0.14 |
| Mineral wool | 236 | 366 | 514 | 578 | 0.16 | 0.23 | 0.30 | 0.31 | 0.09 | 0.12 | 0.15 | 0.17 |
| Polystyrene | 56 | 135 | 298 | 365 | 0.04 | 0.09 | 0.17 | 0.20 | 0.02 | 0.04 | 0.09 | 0.11 |
| Total | 273,662 | 310,128 | 333,449 | 344,928 | 182 | 197 | 196 | 187 | 100 | 100 | 100 | 100 |
| Building Type | 1990 | 2000 | 2010 | 2015 | 1990 | 2000 | 2010 | 2015 |
|---|---|---|---|---|---|---|---|---|
| kt | kt | kt | kt | % | % | % | % | |
| Residential | 180,064 | 198,917 | 216,255 | 225,824 | 66 | 64 | 65 | 65 |
| Commercial | 58,909 | 72,265 | 77,743 | 79,745 | 22 | 23 | 23 | 23 |
| Industrial | 20,758 | 22,982 | 22,361 | 21,738 | 8 | 7 | 7 | 6 |
| Other buildings | 13,931 | 15,965 | 17,090 | 17,621 | 5 | 5 | 5 | 5 |
| Total | 273,662 | 310,128 | 333,449 | 344,928 | 100 | 100 | 100 | 100 |
© 2019 by the authors. Licensee MDPI, Basel, Switzerland. This article is an open access article distributed under the terms and conditions of the Creative Commons Attribution (CC BY) license (http://creativecommons.org/licenses/by/4.0/).
Share and Cite
Lederer, J.; Gassner, A.; Keringer, F.; Mollay, U.; Schremmer, C.; Fellner, J. Material Flows and Stocks in the Urban Building Sector: A Case Study from Vienna for the Years 1990–2015. Sustainability 2020, 12, 300. https://doi.org/10.3390/su12010300
Lederer J, Gassner A, Keringer F, Mollay U, Schremmer C, Fellner J. Material Flows and Stocks in the Urban Building Sector: A Case Study from Vienna for the Years 1990–2015. Sustainability. 2020; 12(1):300. https://doi.org/10.3390/su12010300
Chicago/Turabian StyleLederer, Jakob, Andreas Gassner, Florian Keringer, Ursula Mollay, Christoph Schremmer, and Johann Fellner. 2020. "Material Flows and Stocks in the Urban Building Sector: A Case Study from Vienna for the Years 1990–2015" Sustainability 12, no. 1: 300. https://doi.org/10.3390/su12010300
APA StyleLederer, J., Gassner, A., Keringer, F., Mollay, U., Schremmer, C., & Fellner, J. (2020). Material Flows and Stocks in the Urban Building Sector: A Case Study from Vienna for the Years 1990–2015. Sustainability, 12(1), 300. https://doi.org/10.3390/su12010300