Operationalizing Business Model Innovation through Big Data Analytics for Sustainable Organizations

 ,
,  , , ,
, , ,  and
and
Abstract
:1. Introduction
2. Theoretical Background
2.1. Business Models and Sustainability
2.2. Business Model Innovation: The Need for a Systematic Process
2.3. Big Data
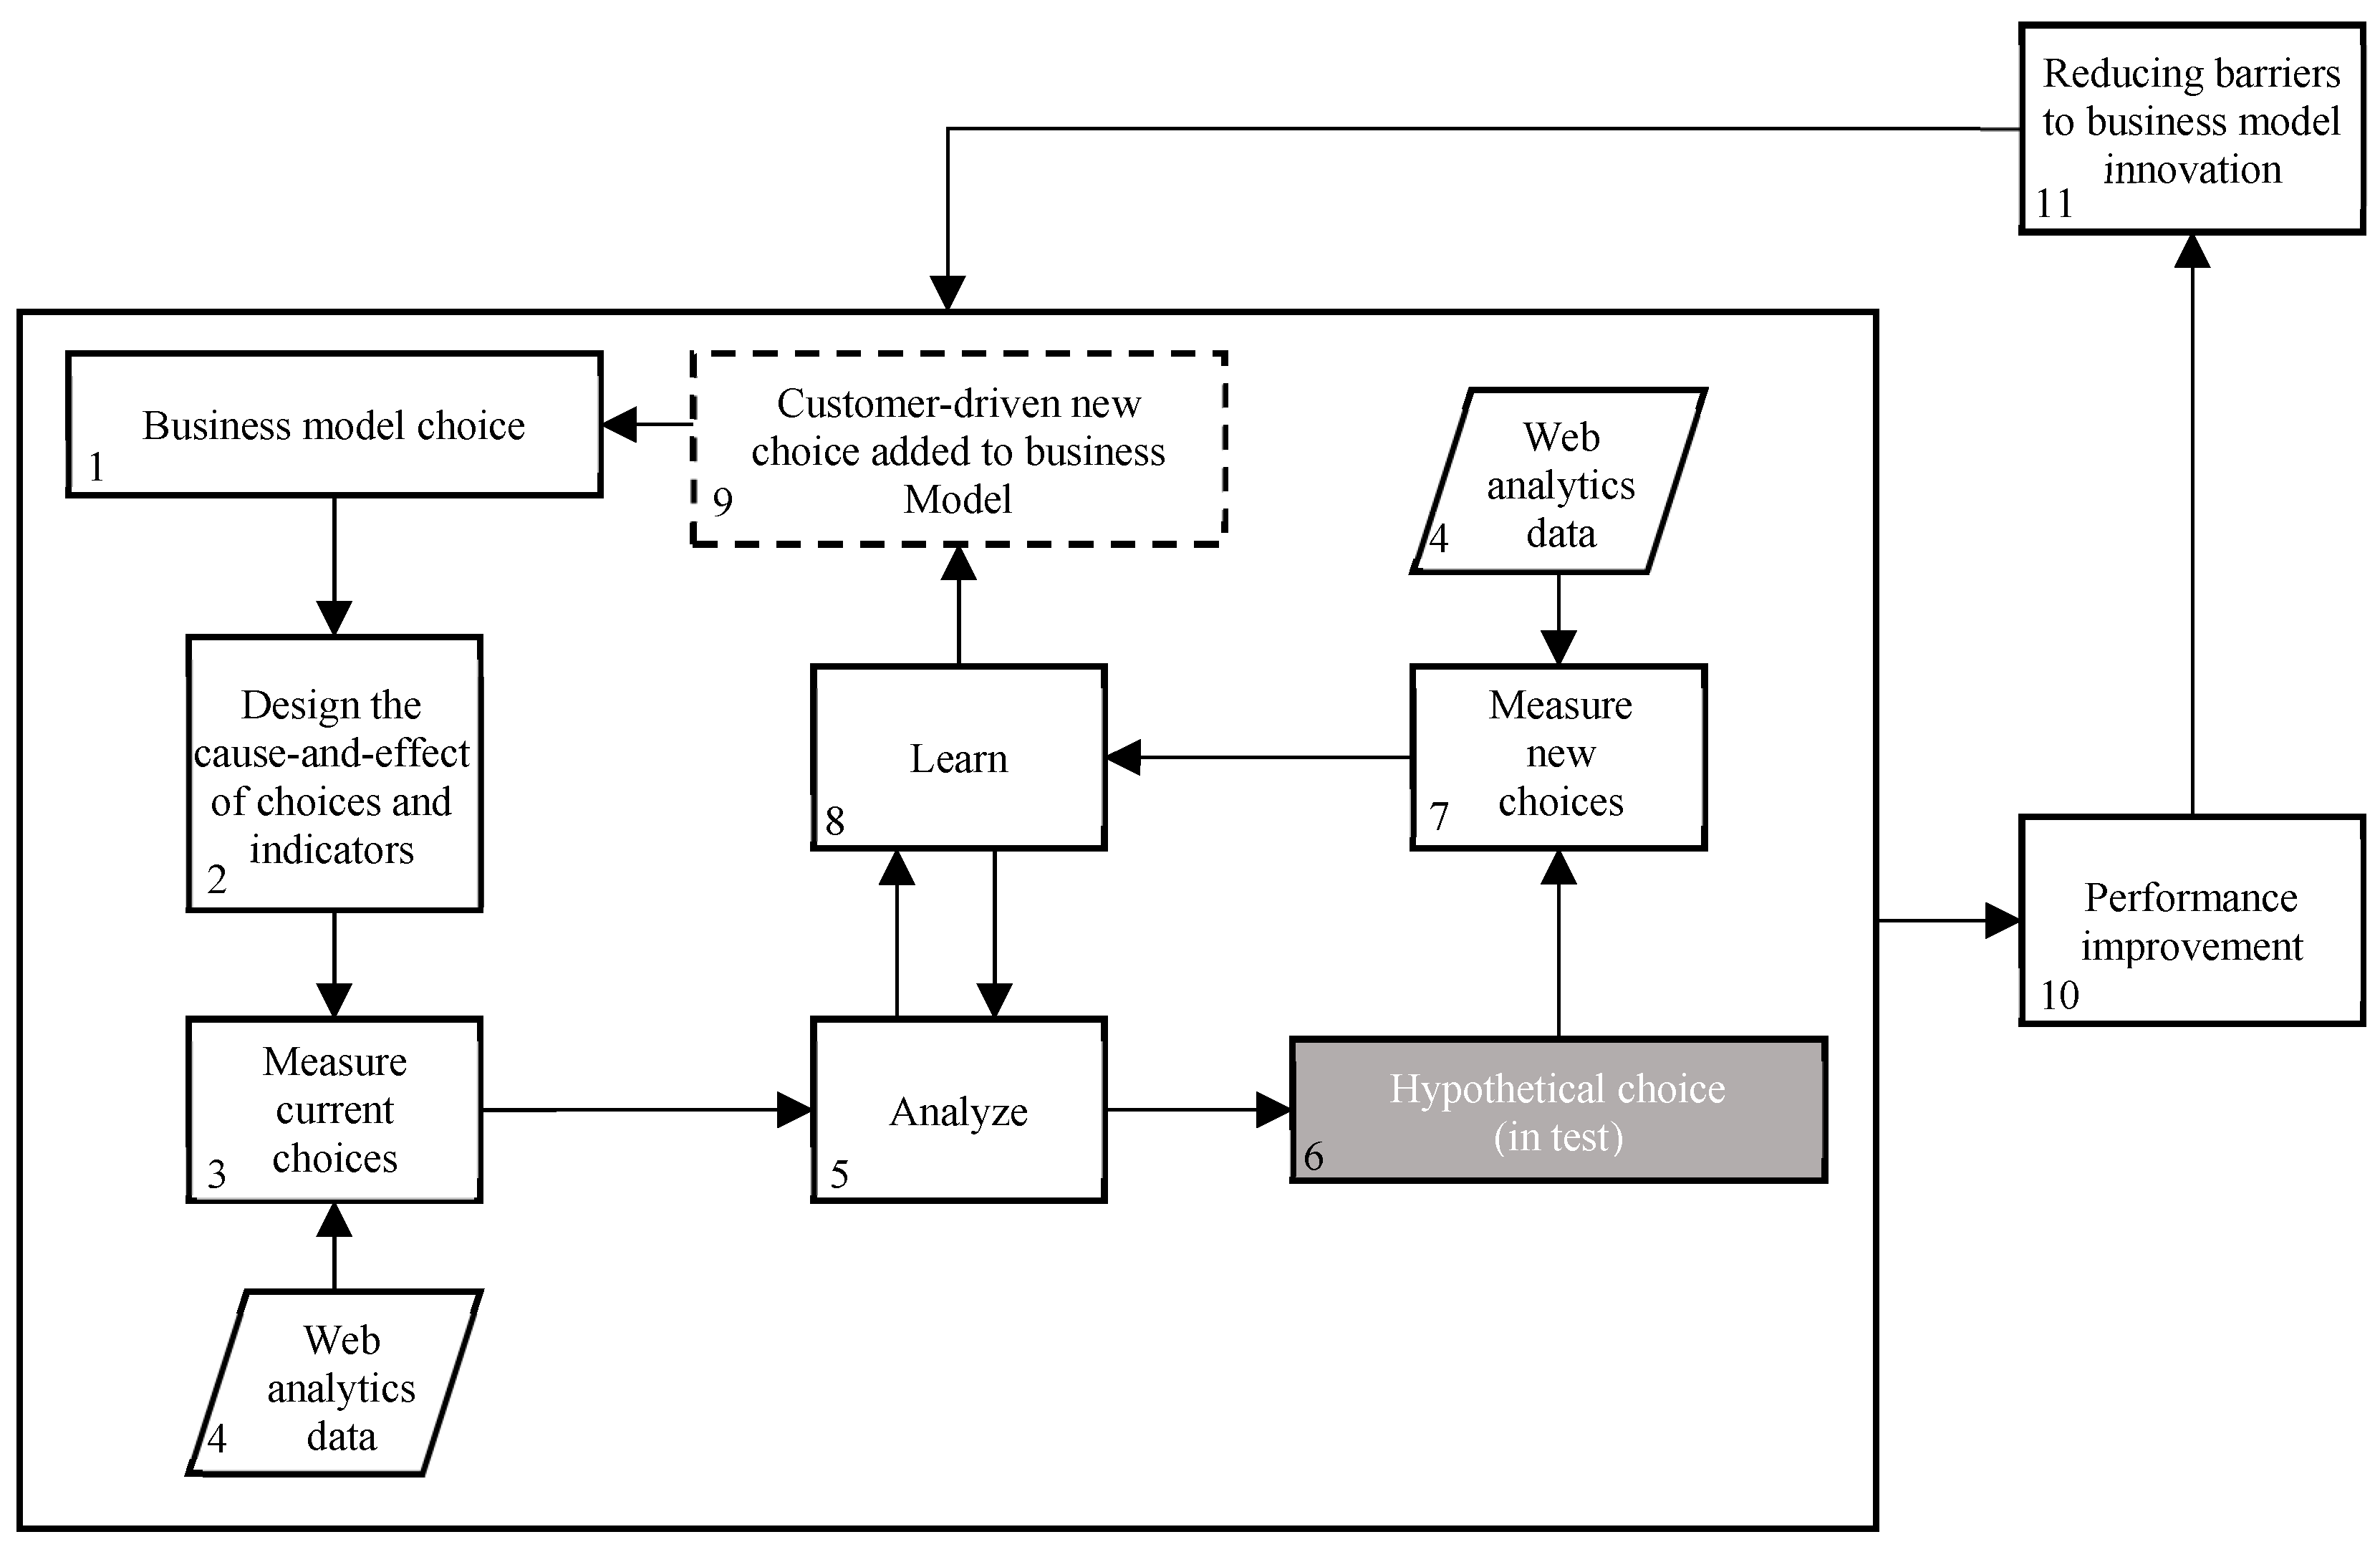
3. Method
3.1. Research Methodology
3.2. Class of Problems
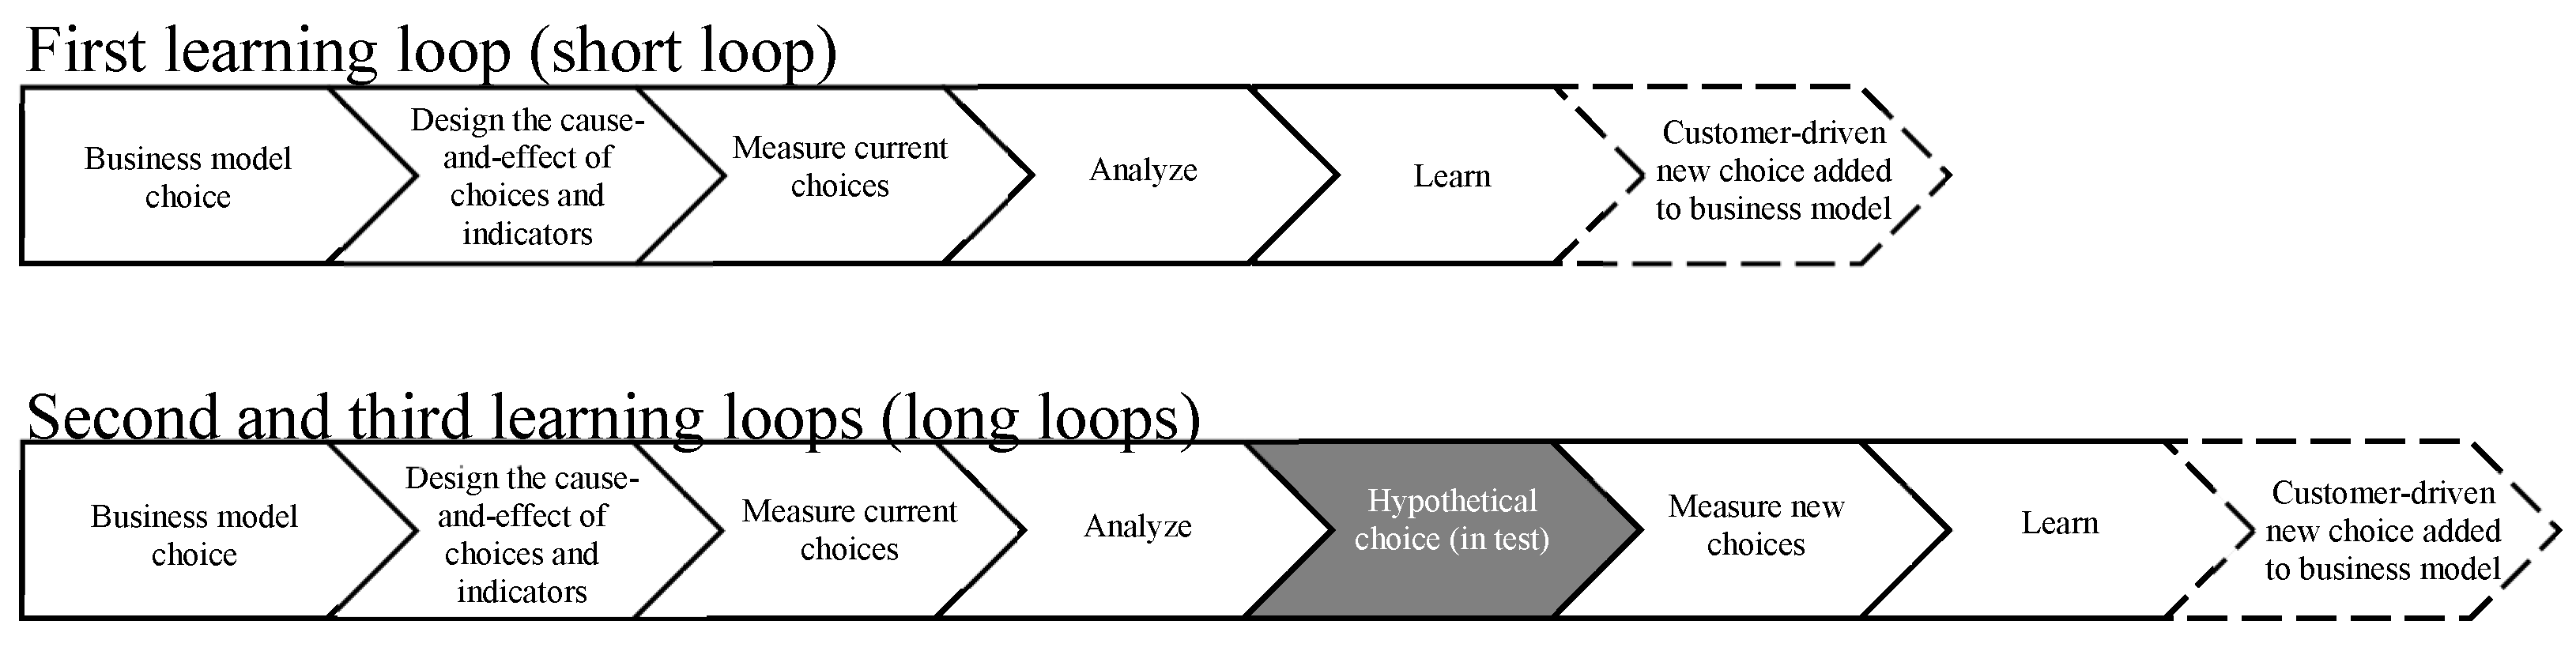
3.3. The Method for Data-Driven Business Modeling
3.4. Evaluation: Case Study—Data Collection and Analysis
3.4.1. Case Selection
3.4.2. The Selected Company
3.4.3. Data Collection and Analysis
4. Results of Case Study
4.1. First Learning Loop
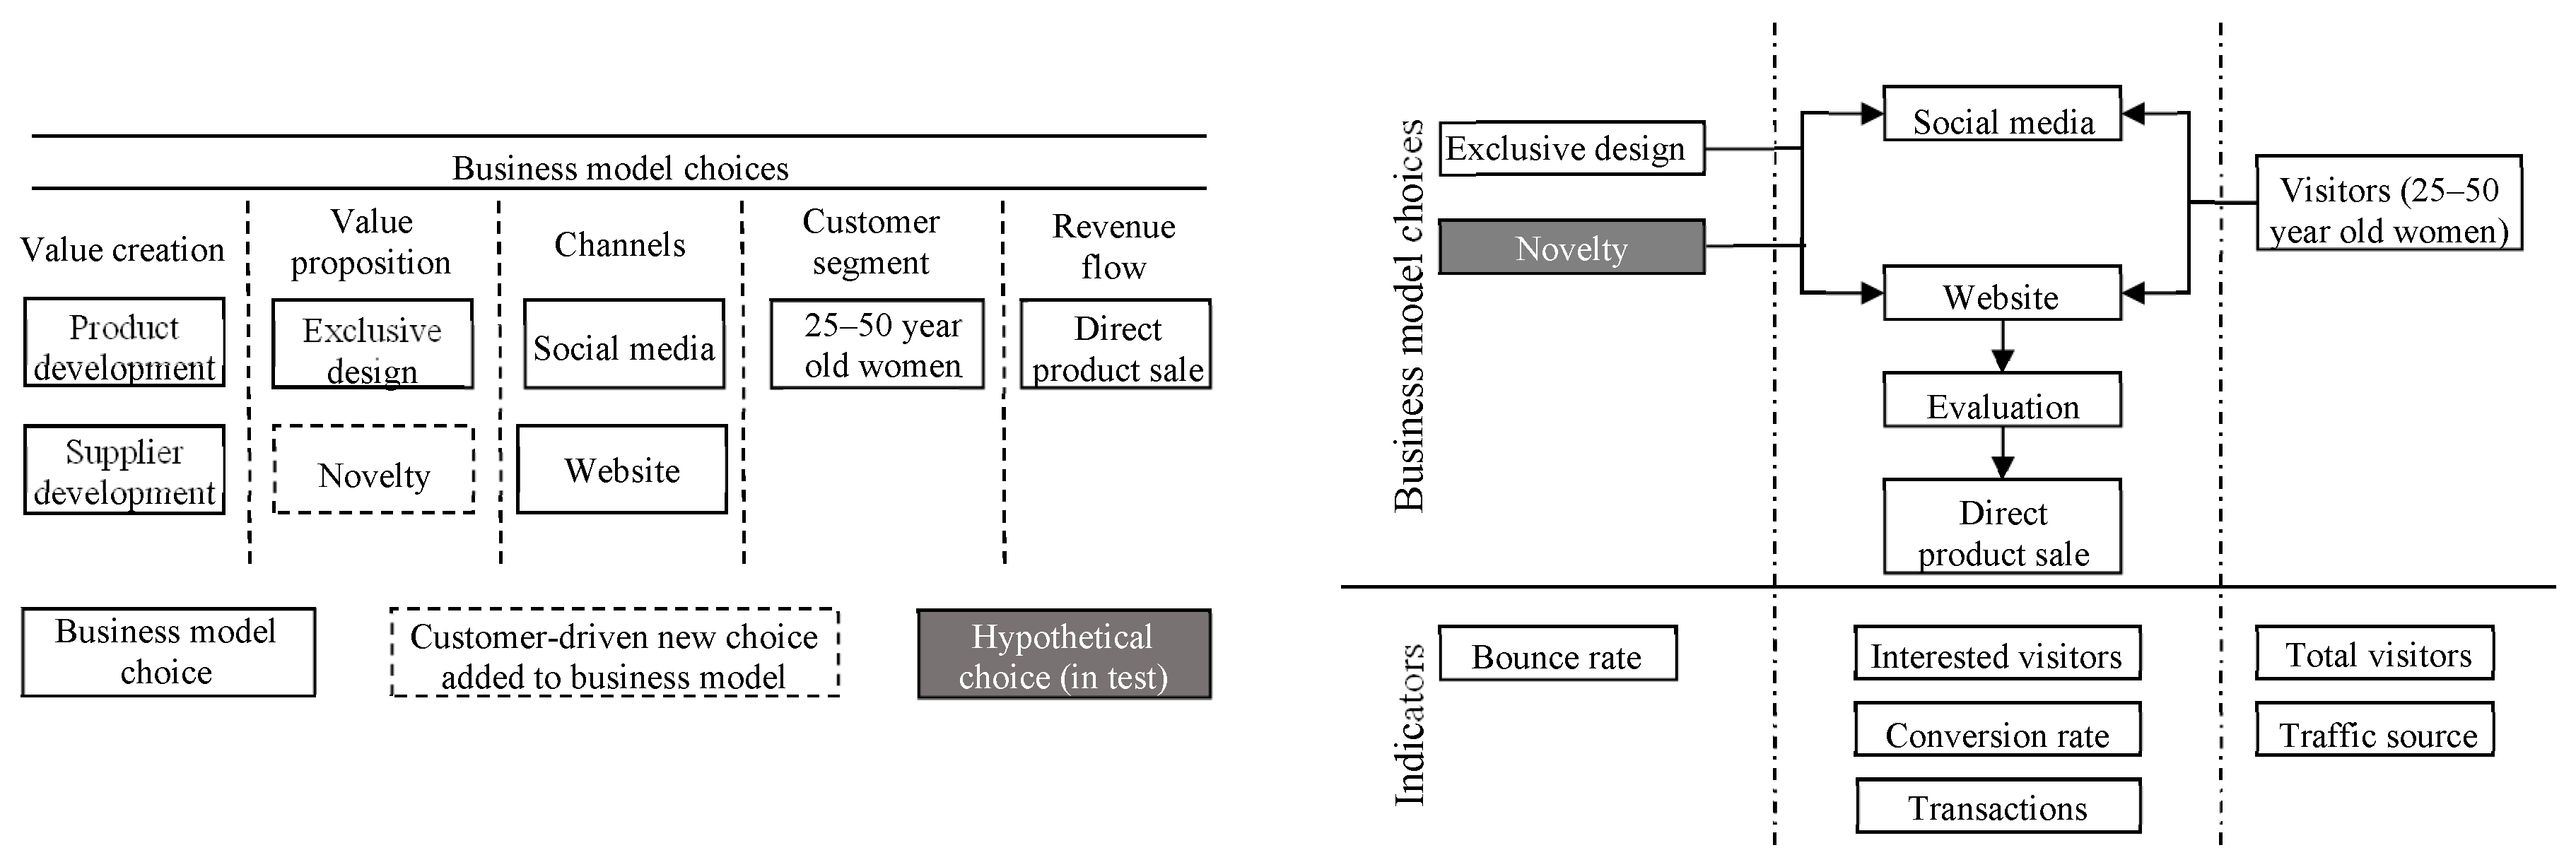
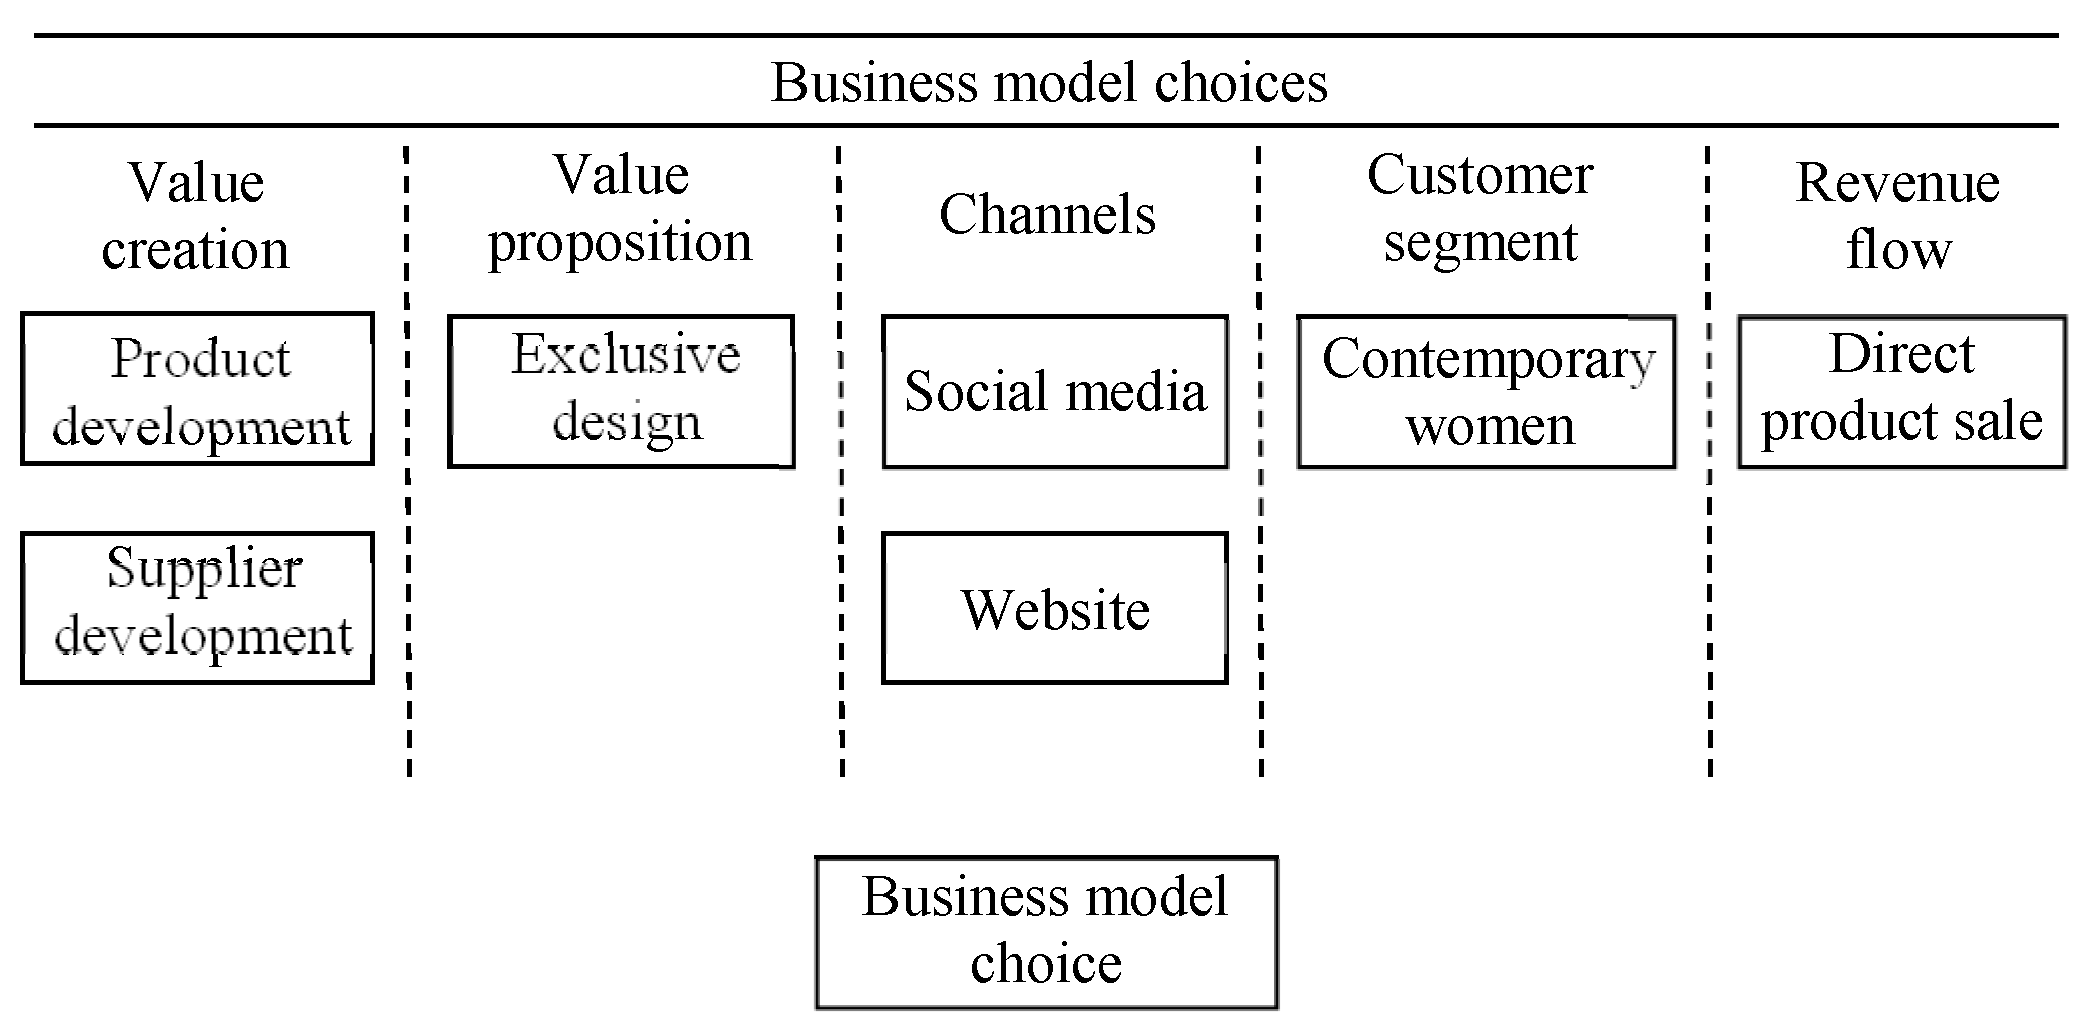
4.1.1. Business Model Choices
- Value Creation: The main value creation activities were related to product development. This is mainly because the company has its own brand, and exclusive design is an important element of its value proposition. Moreover, as the business does not produce its own materials, a key activity is the development of the appropriate suppliers (partners) to manufacture the goods.
- Value Proposition: An internal team develops the design of clothing and accessories. It has trained professionals from the fashion industry, which pursue activities ranging from the search for trends in design for each product. This choice was identified as the value proposition because, in the perception of the manager, this is what the company’s customers valued the most.
- Channels: The manager chose social media as the main channel for knowledge and disclosure of the company’s brand and products. The most used tool in this respect was its Facebook fan-page. As the purchasing channel and service, the company selected its own website.
- Customer Segment: The company focuses particularly on women aged 25 to 50 who are located throughout Brazil as the customer segment.
- Revenue Flow: The revenue stream is from directly selling products, which is traditionally how an e-commerce business operates.
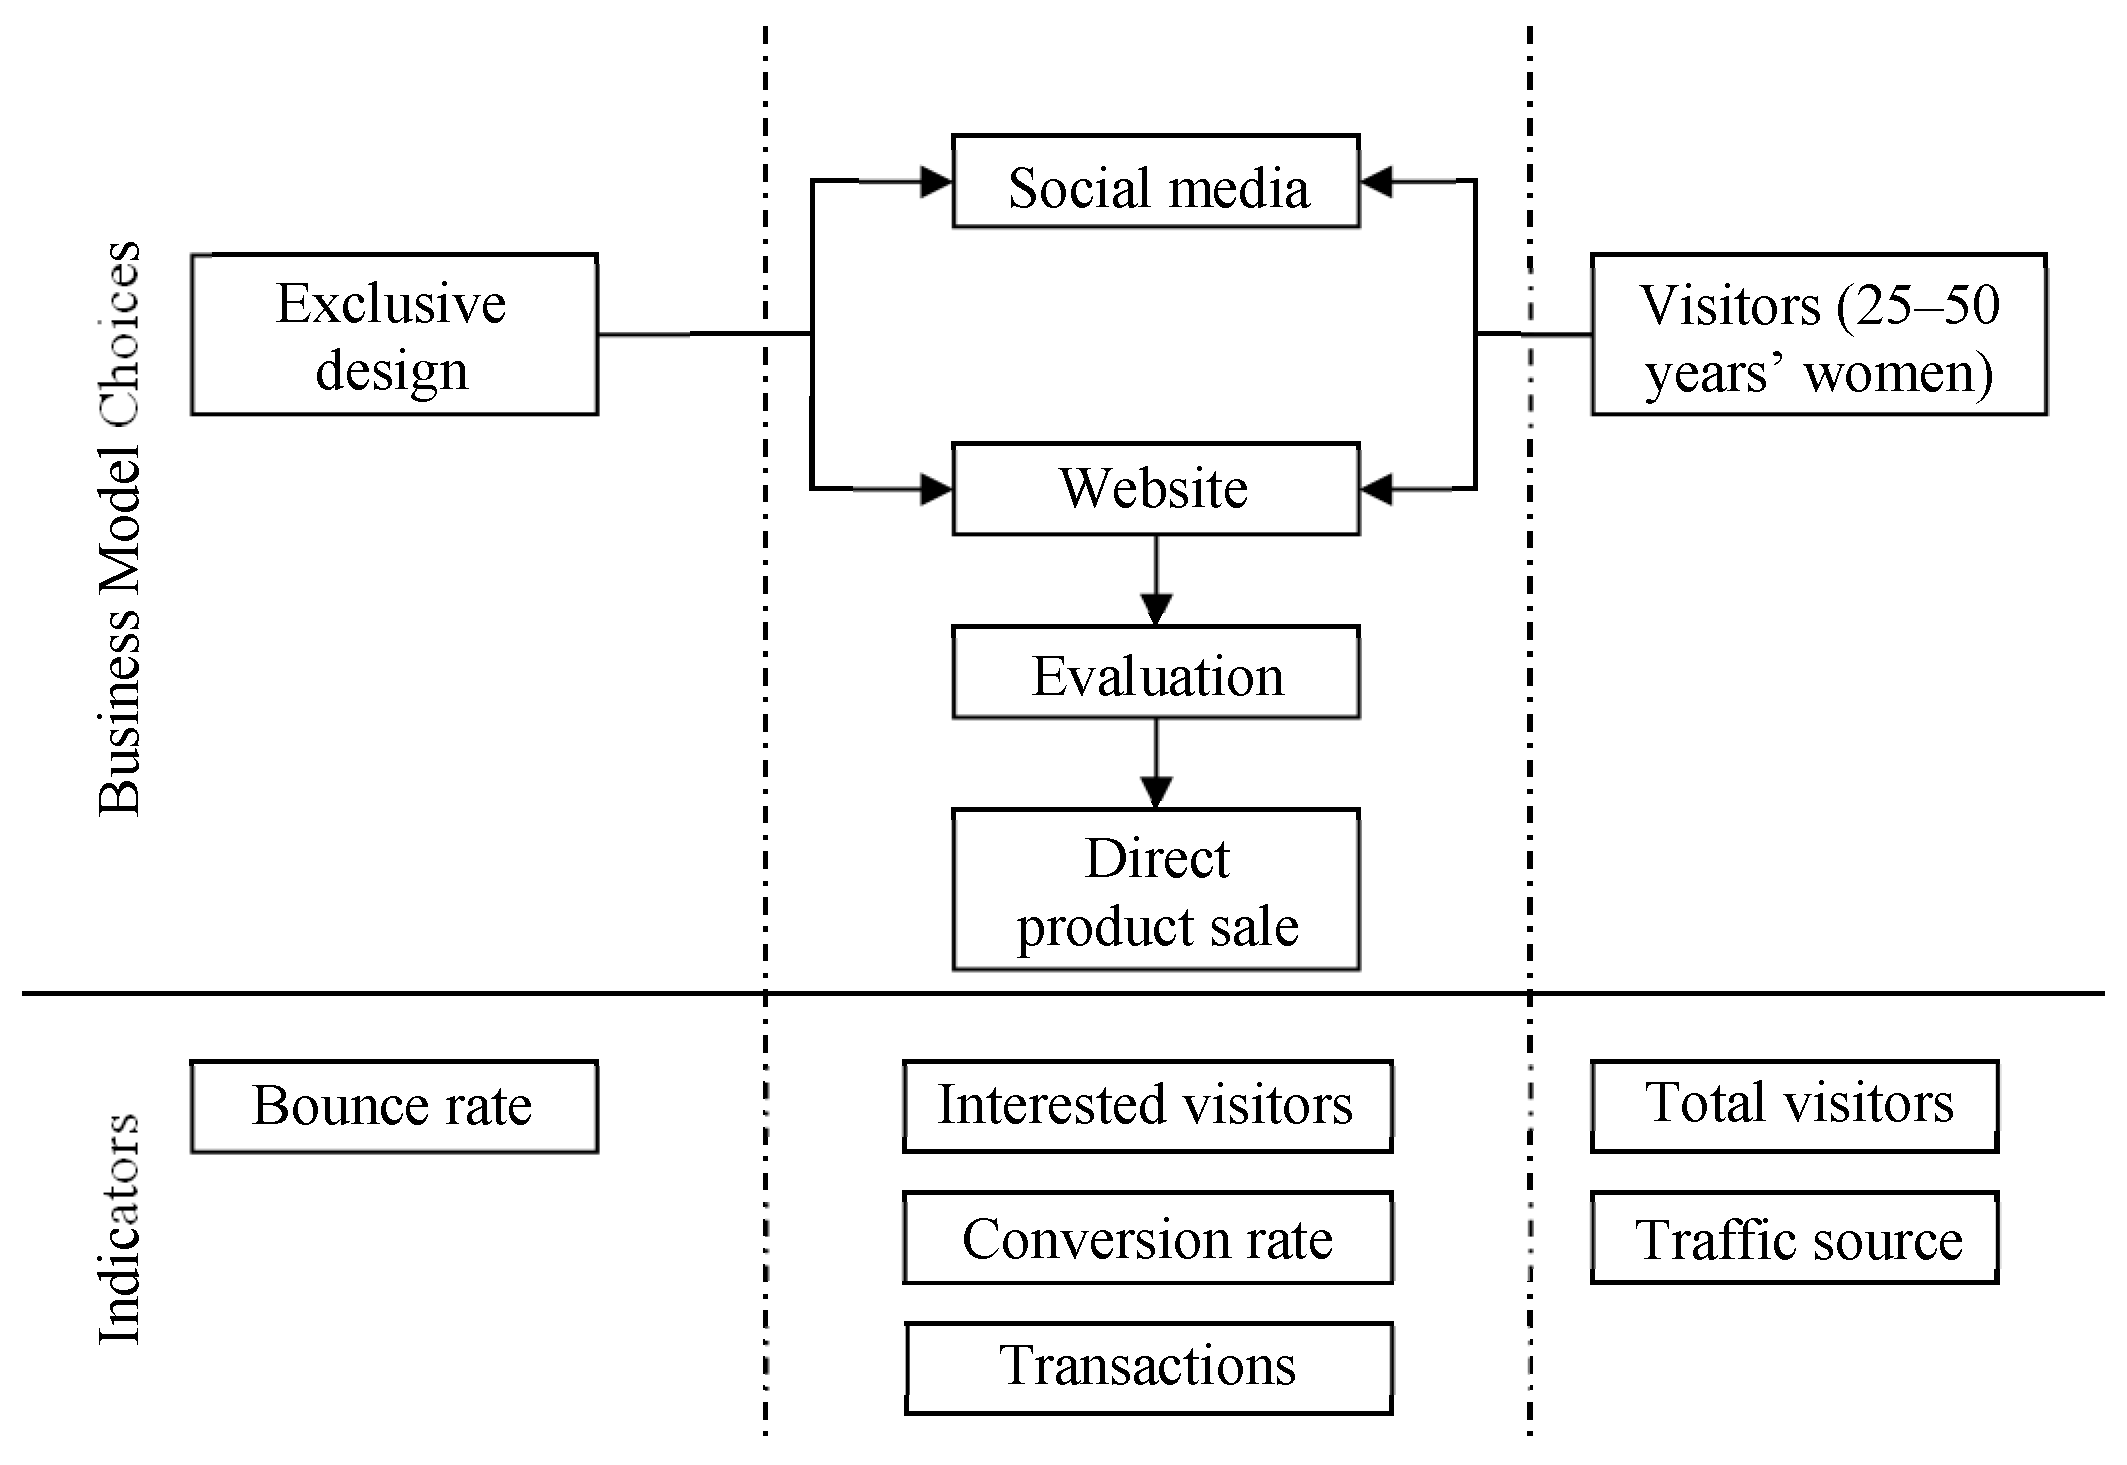
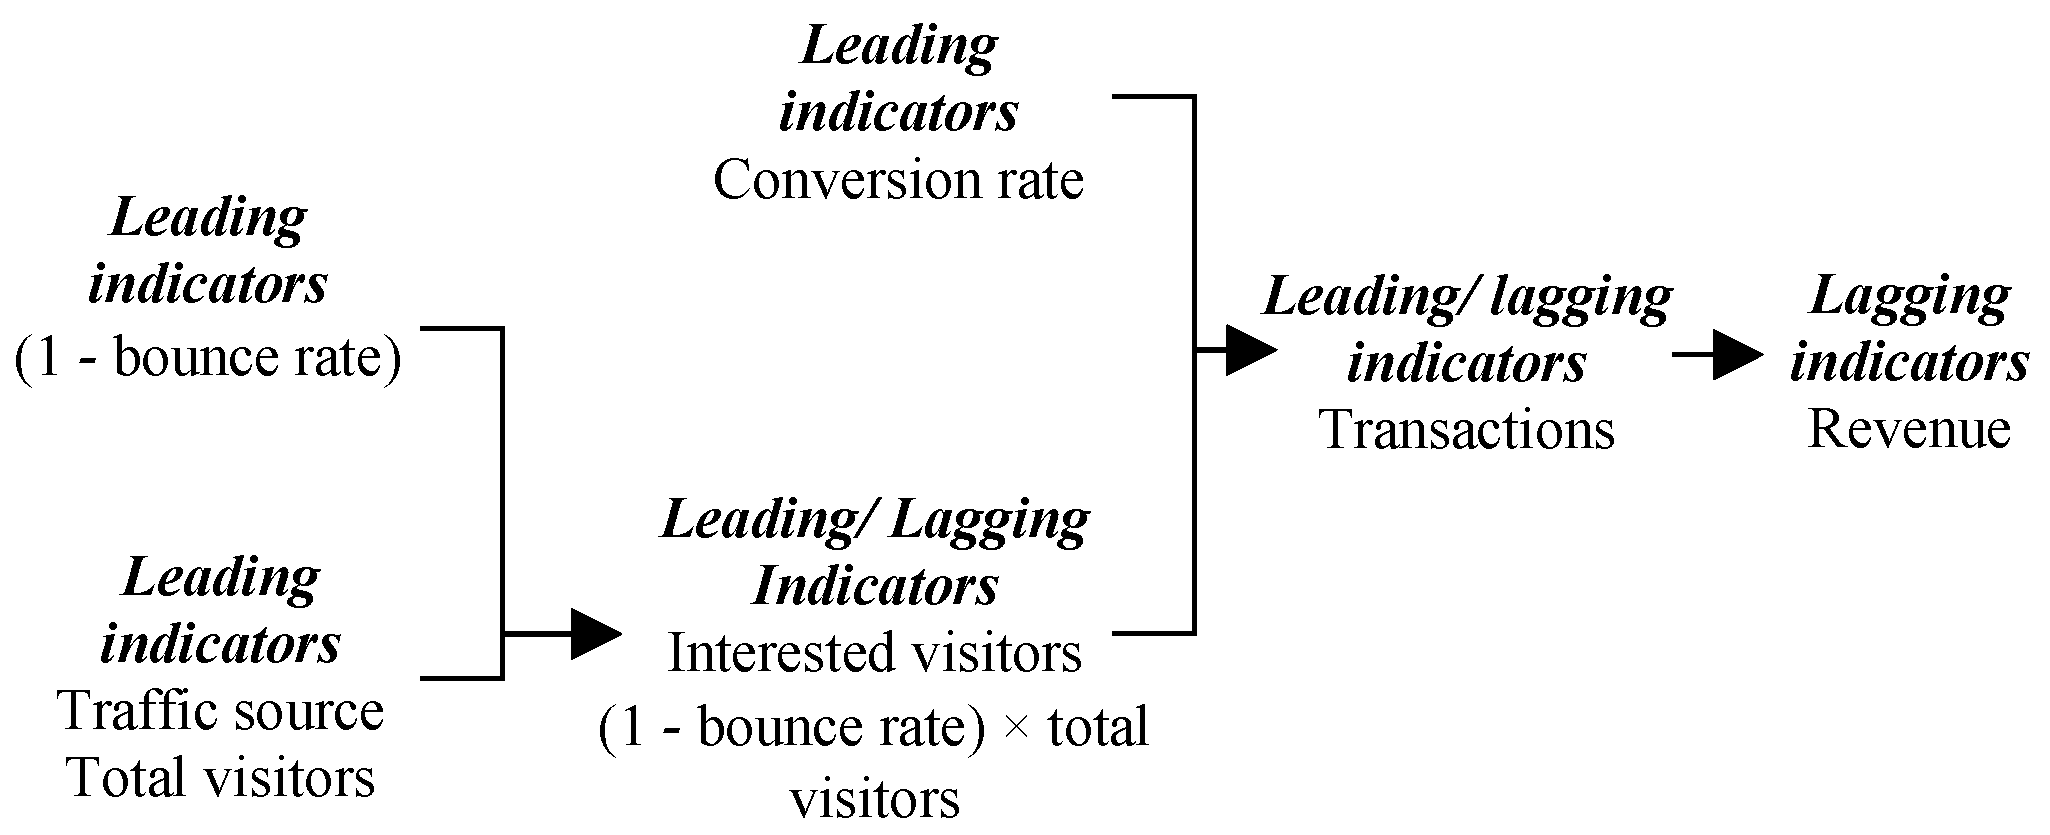
4.1.2. Design of the Cause-and-Effect of Choices and Indicators
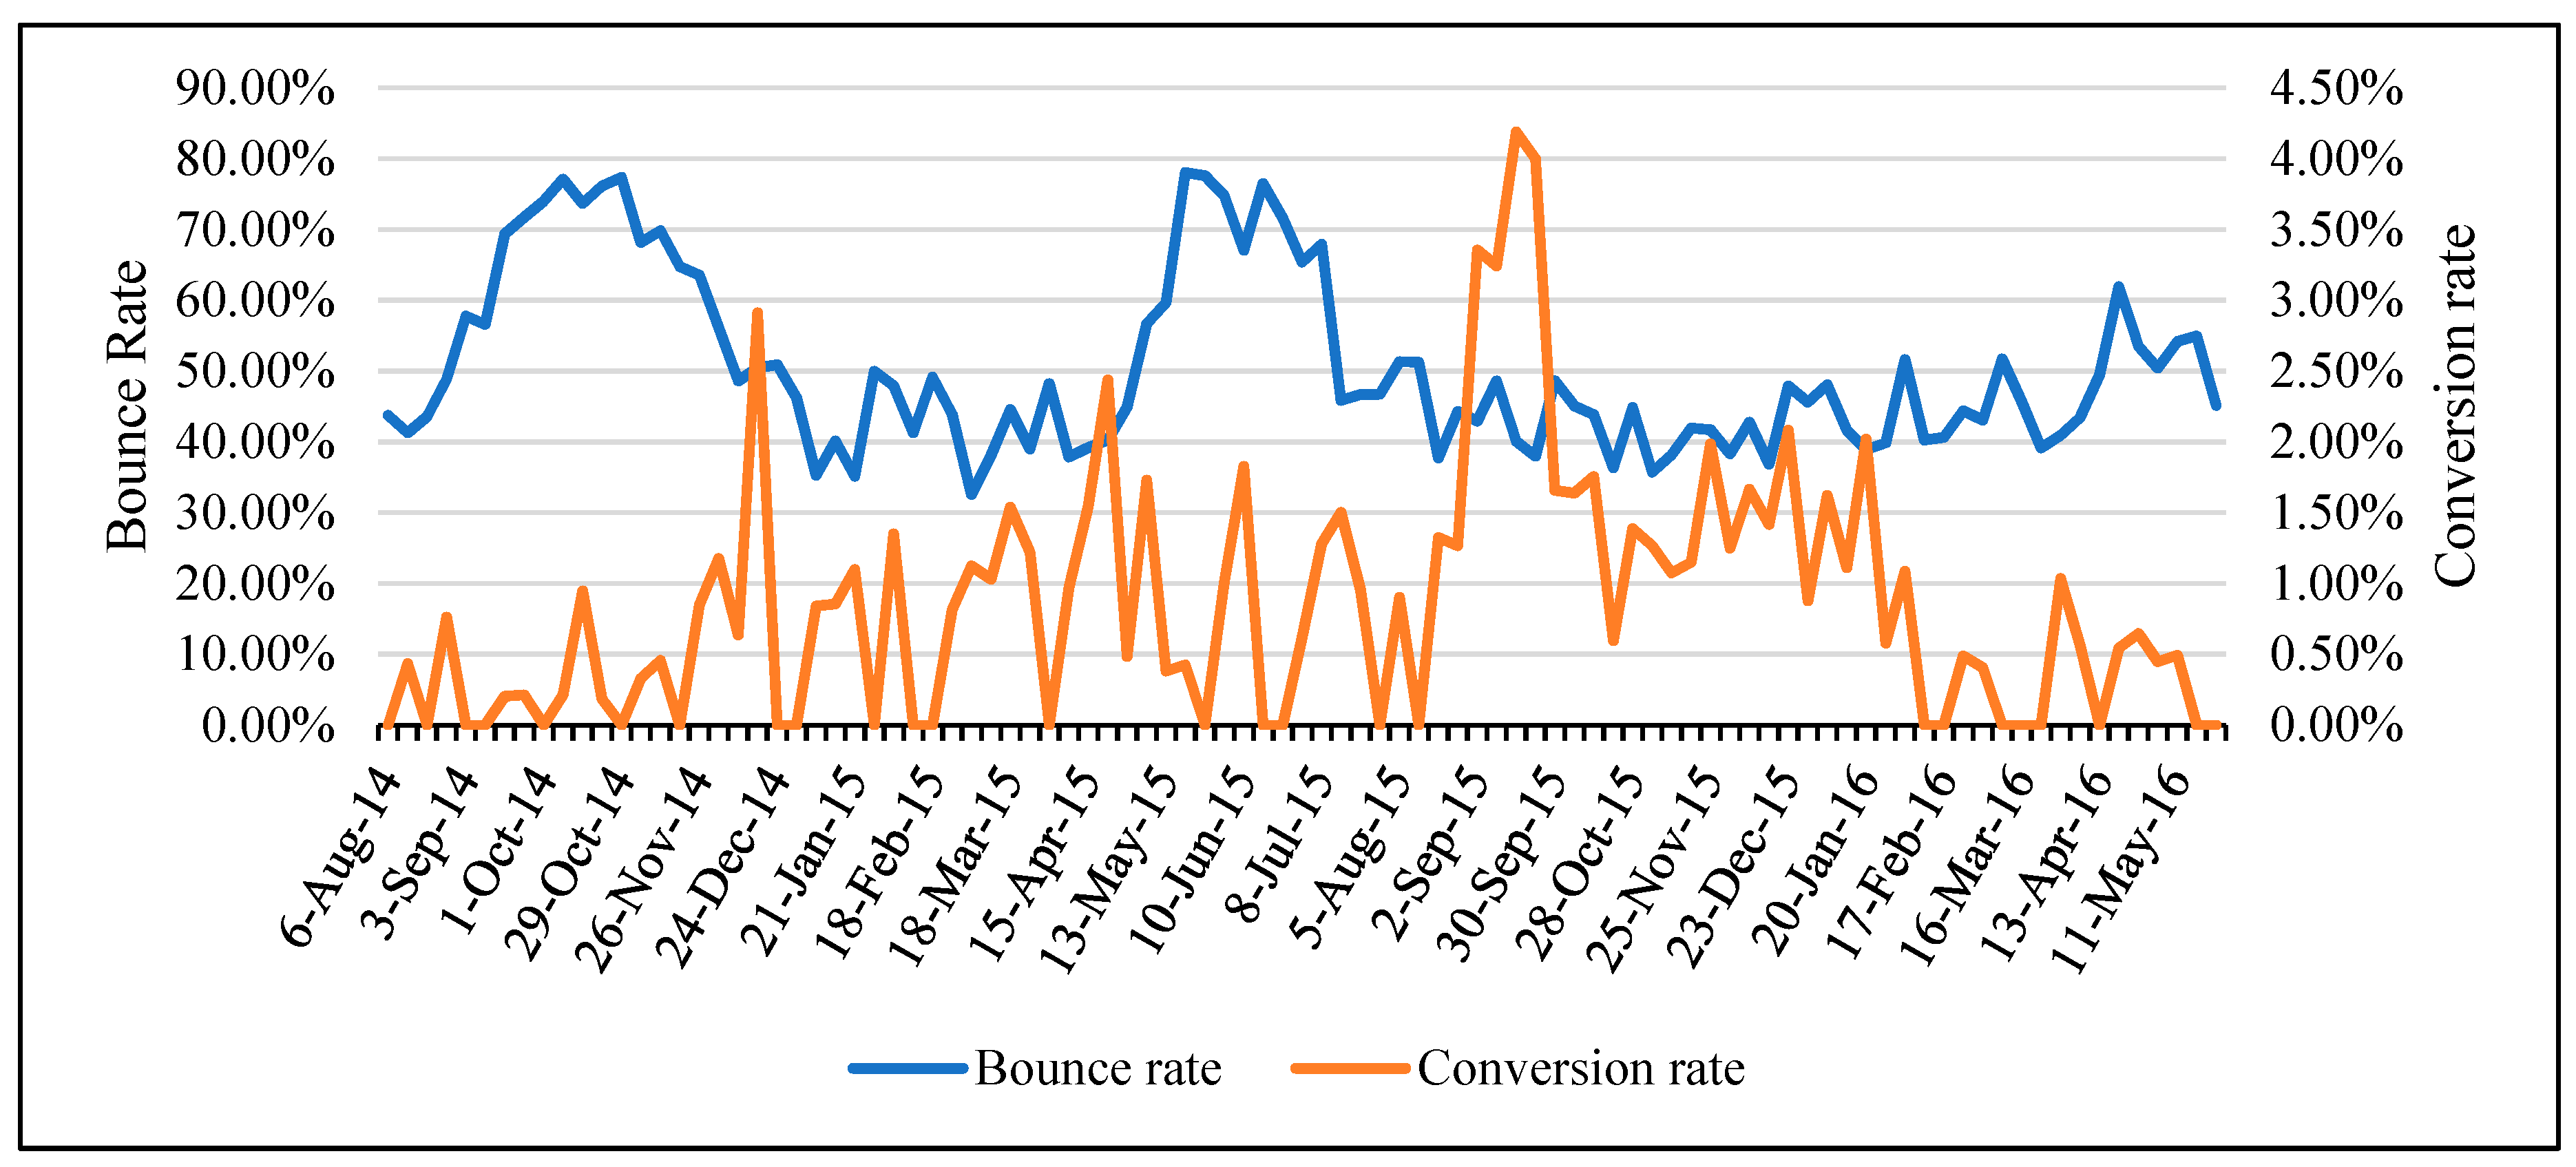
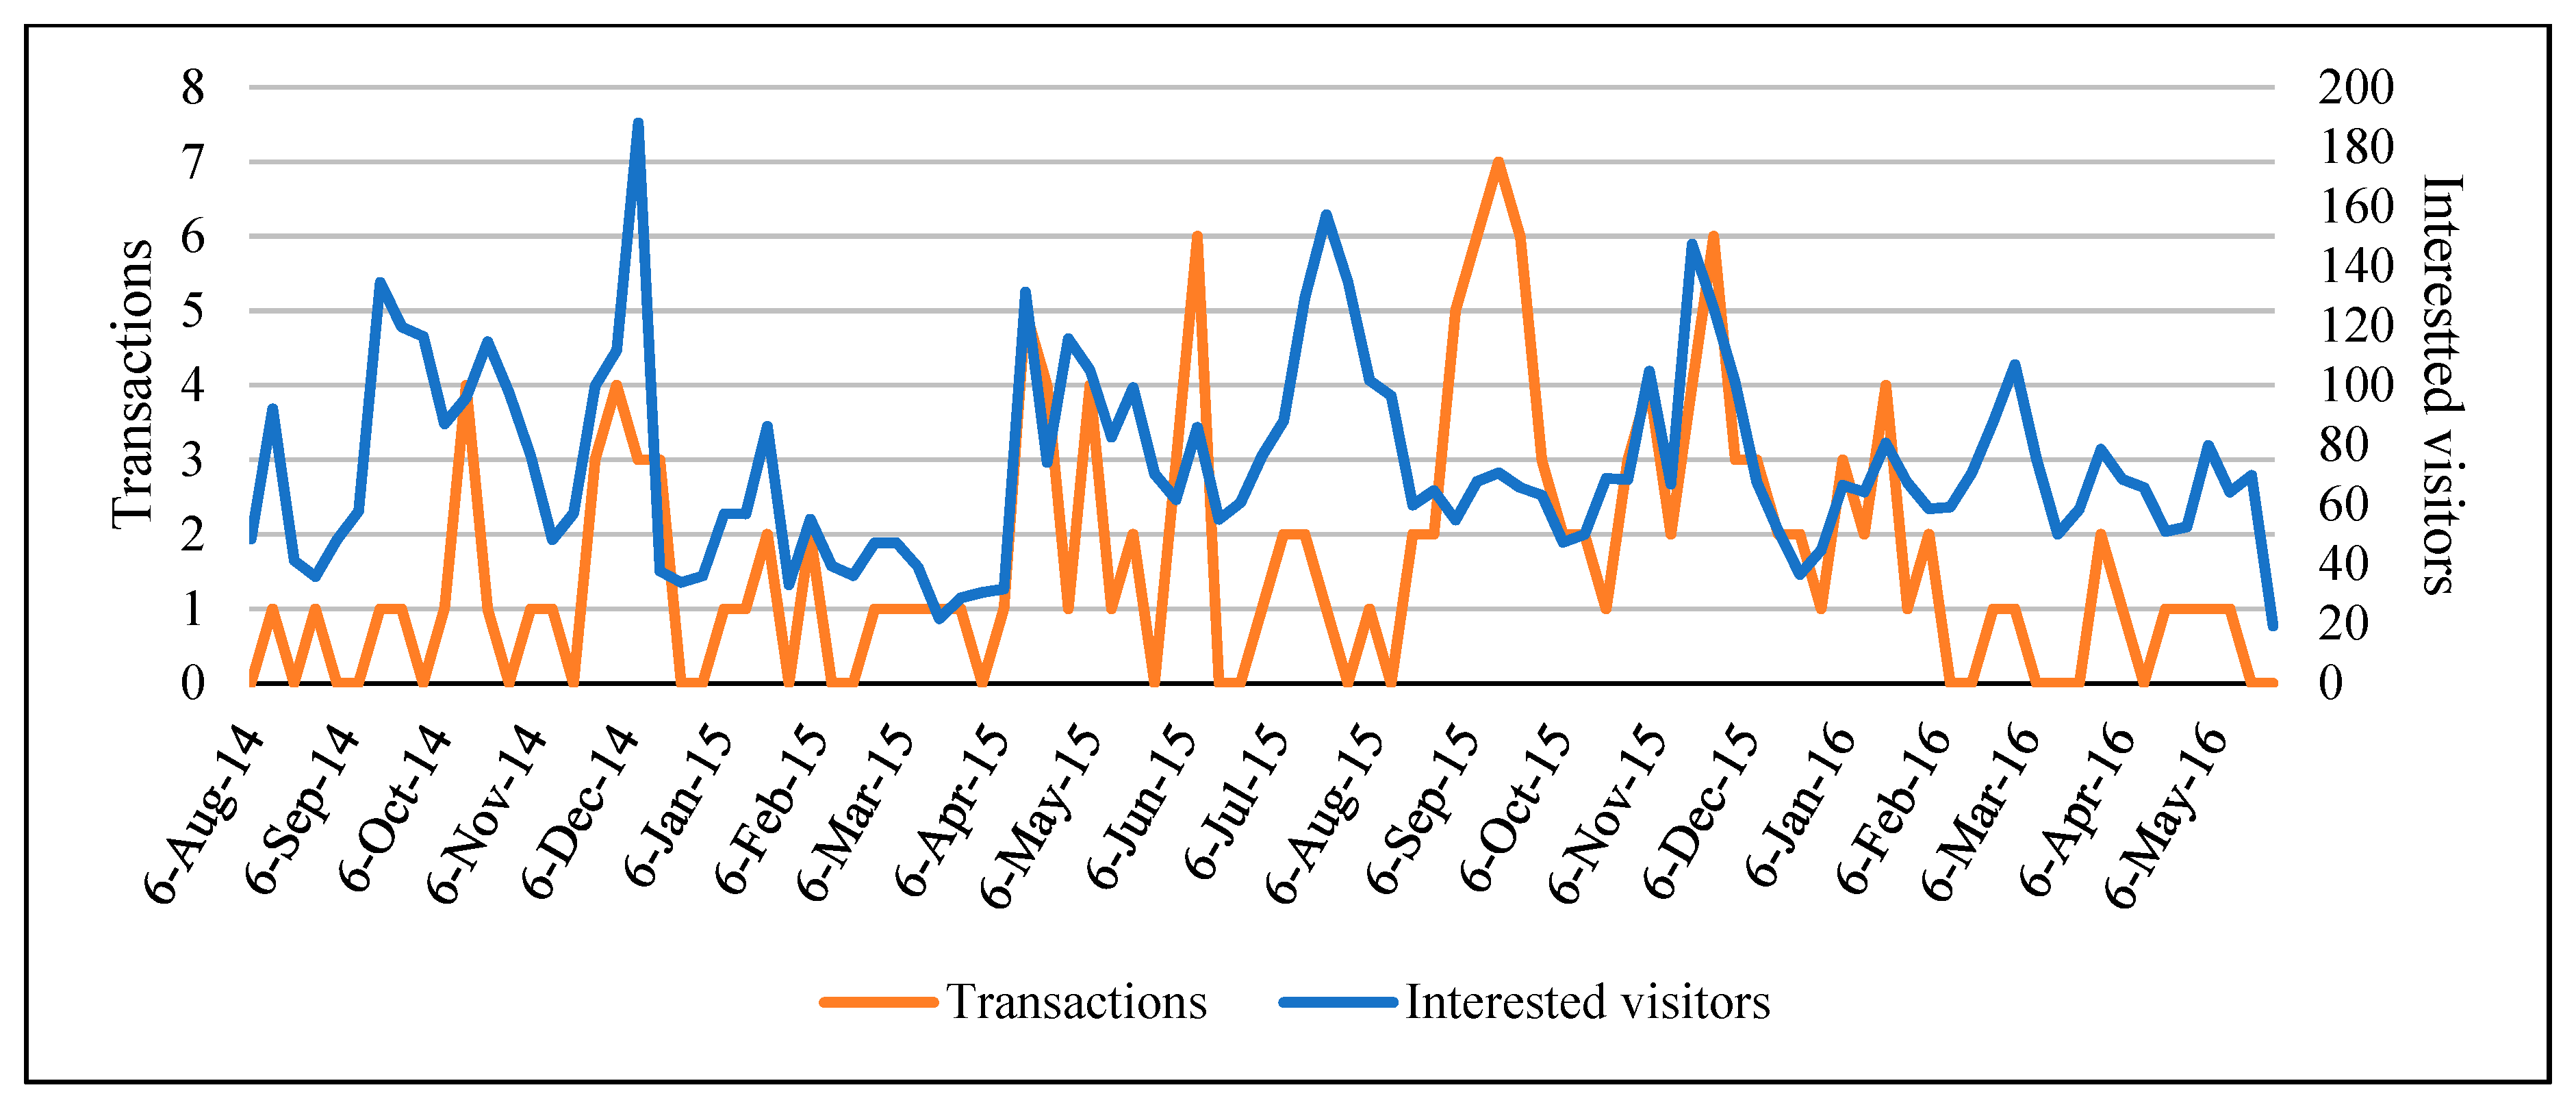
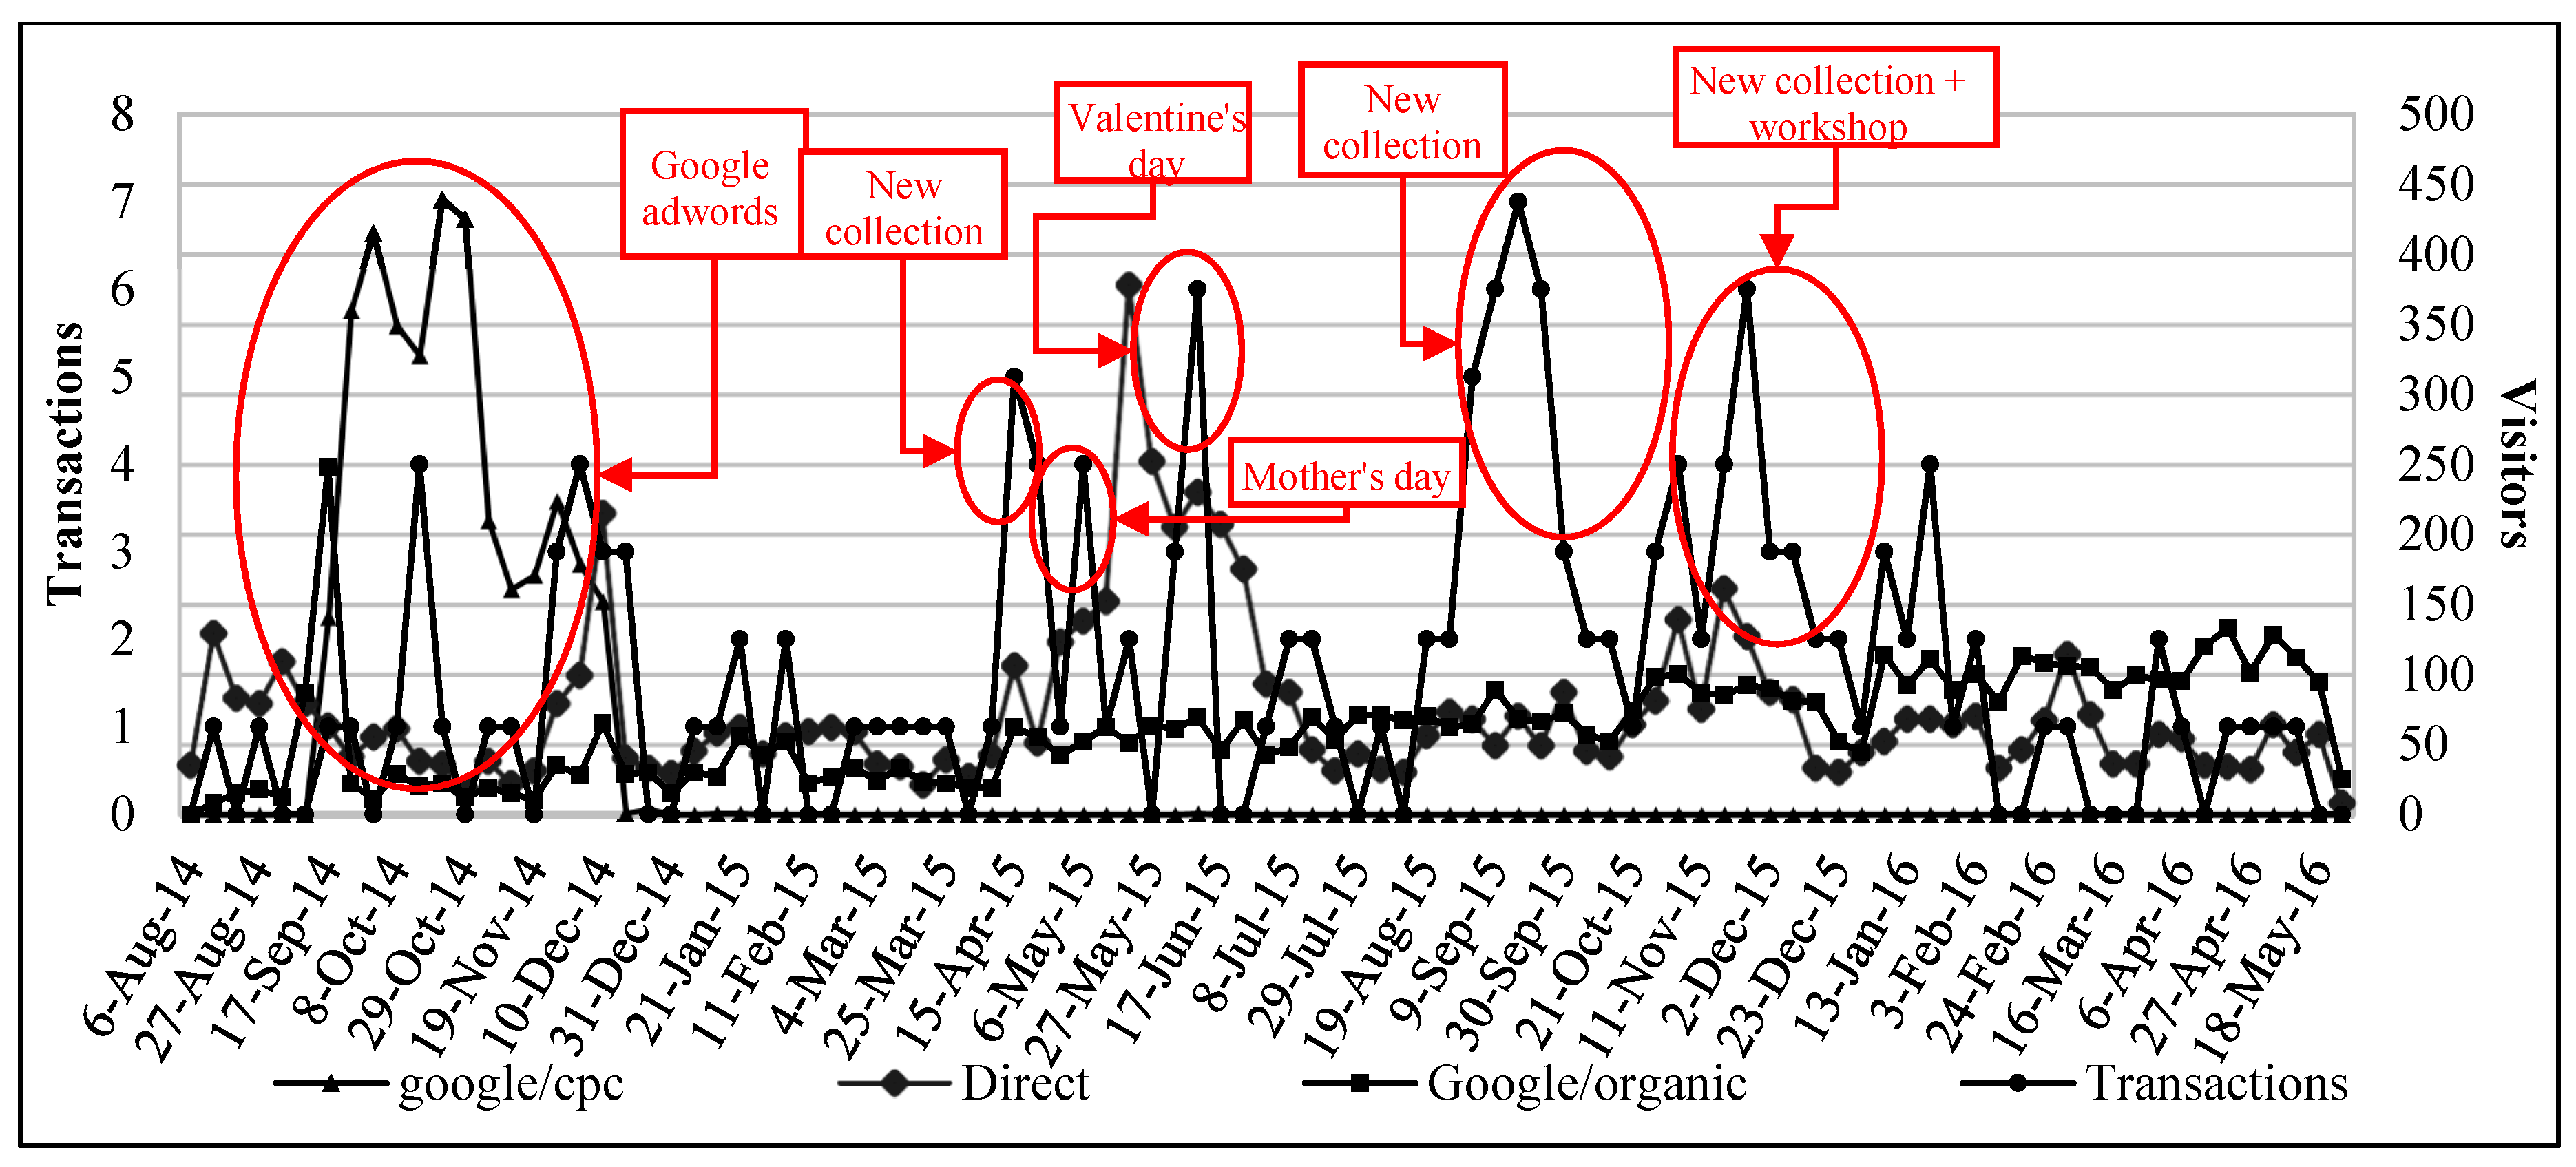
4.1.3. Measure and Analysis
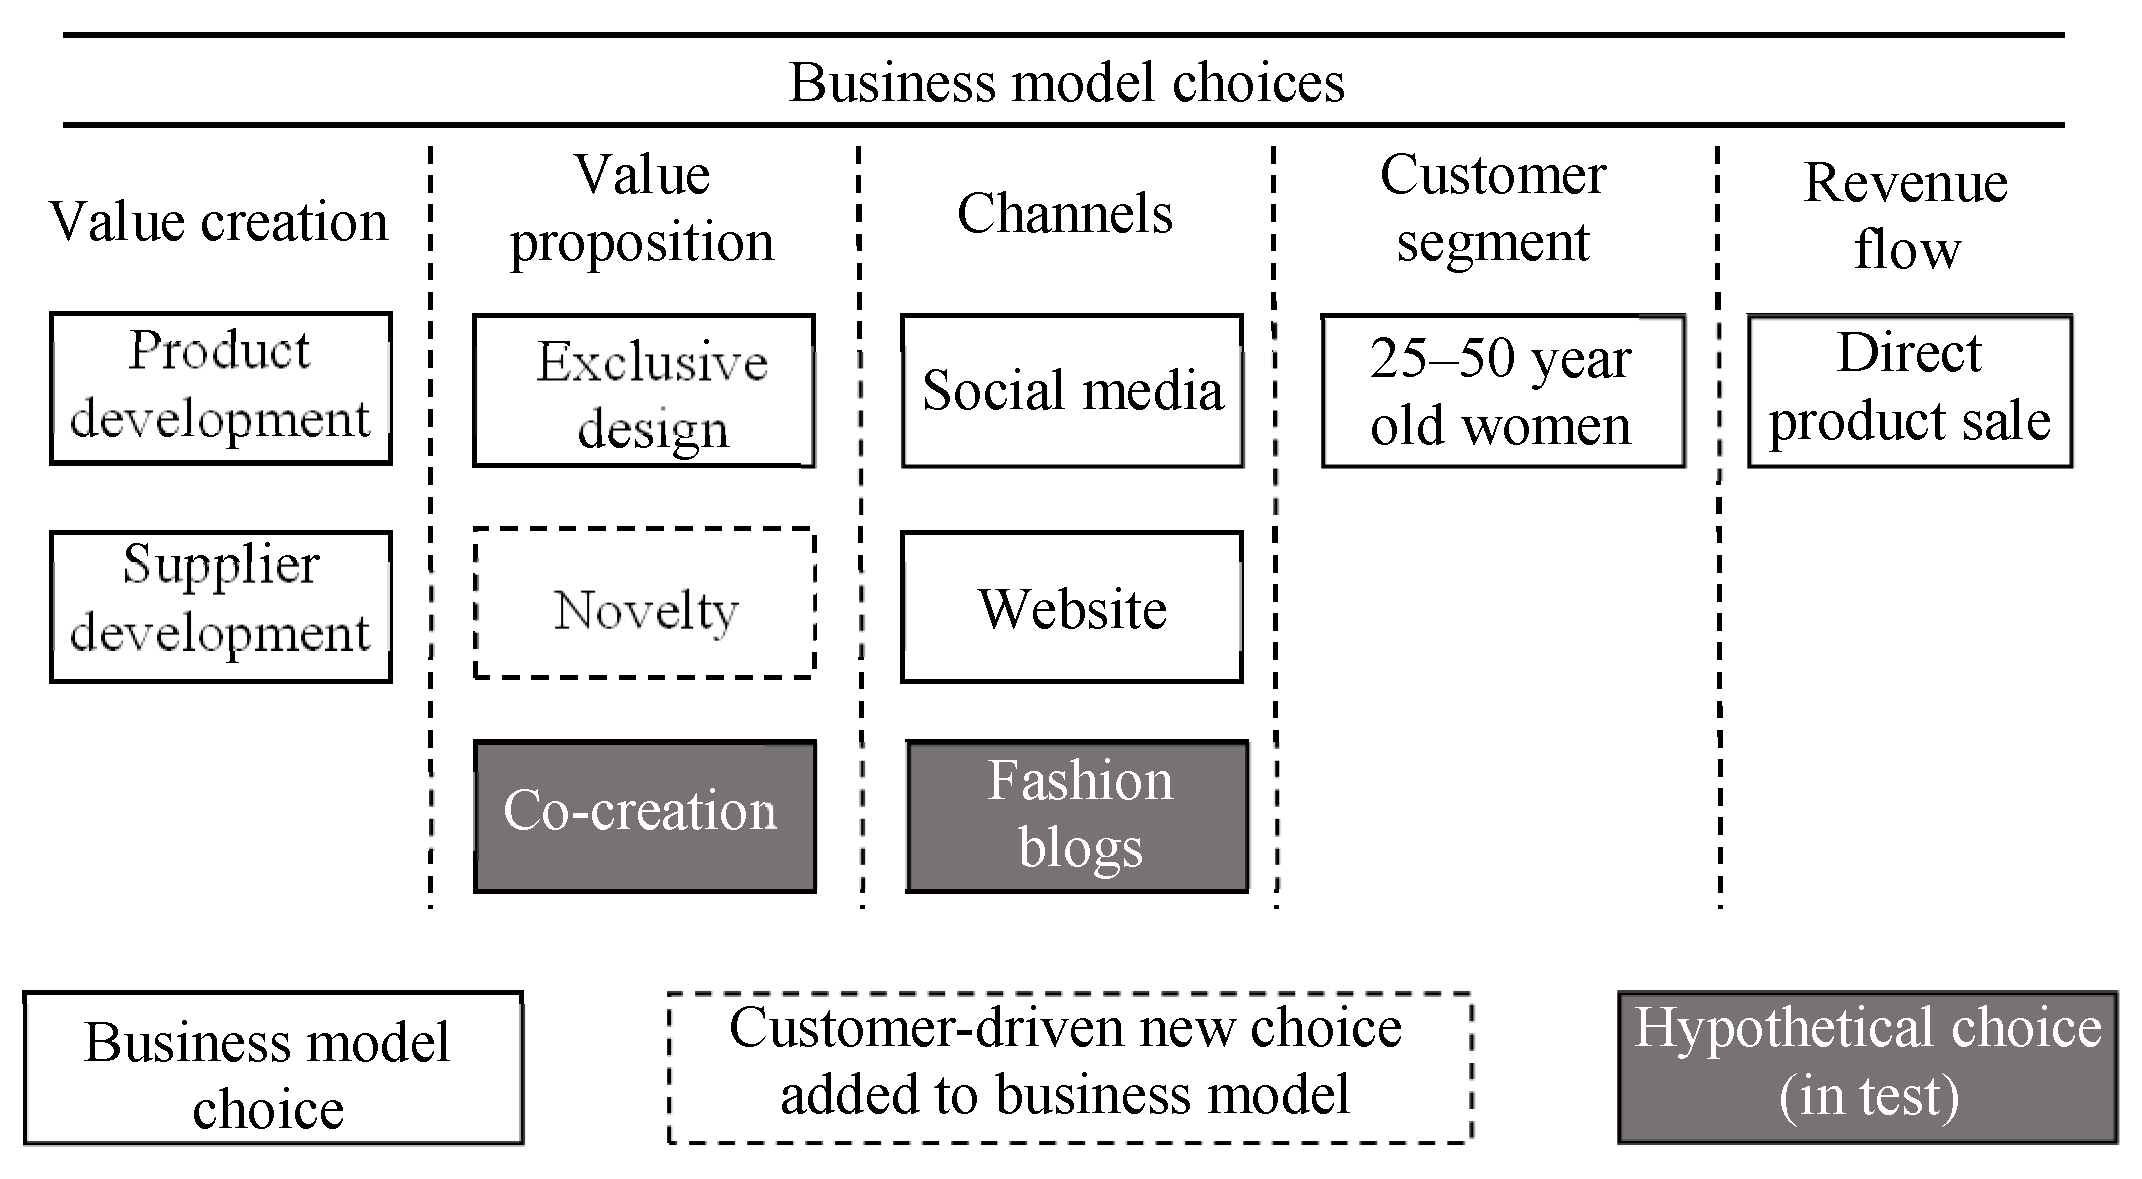
4.1.4. Learn and Customer-Driven New Choices
- Based on the data, the duration of the sales of a new collection was around two to three months; thus, the first initiative was to launch a new collection every two to three months. A few weeks before the new collection is launched, there is a decrease in sales (after the transactions peak). Therefore, in order to keep sales active between new collections and reduce stock, a sale should also be instituted;
- Moreover, from the analysis of the same data, the manager decided that the new collections would have a predetermined number of items, as the value proposition is based on the company’s differentiation and exclusive design.
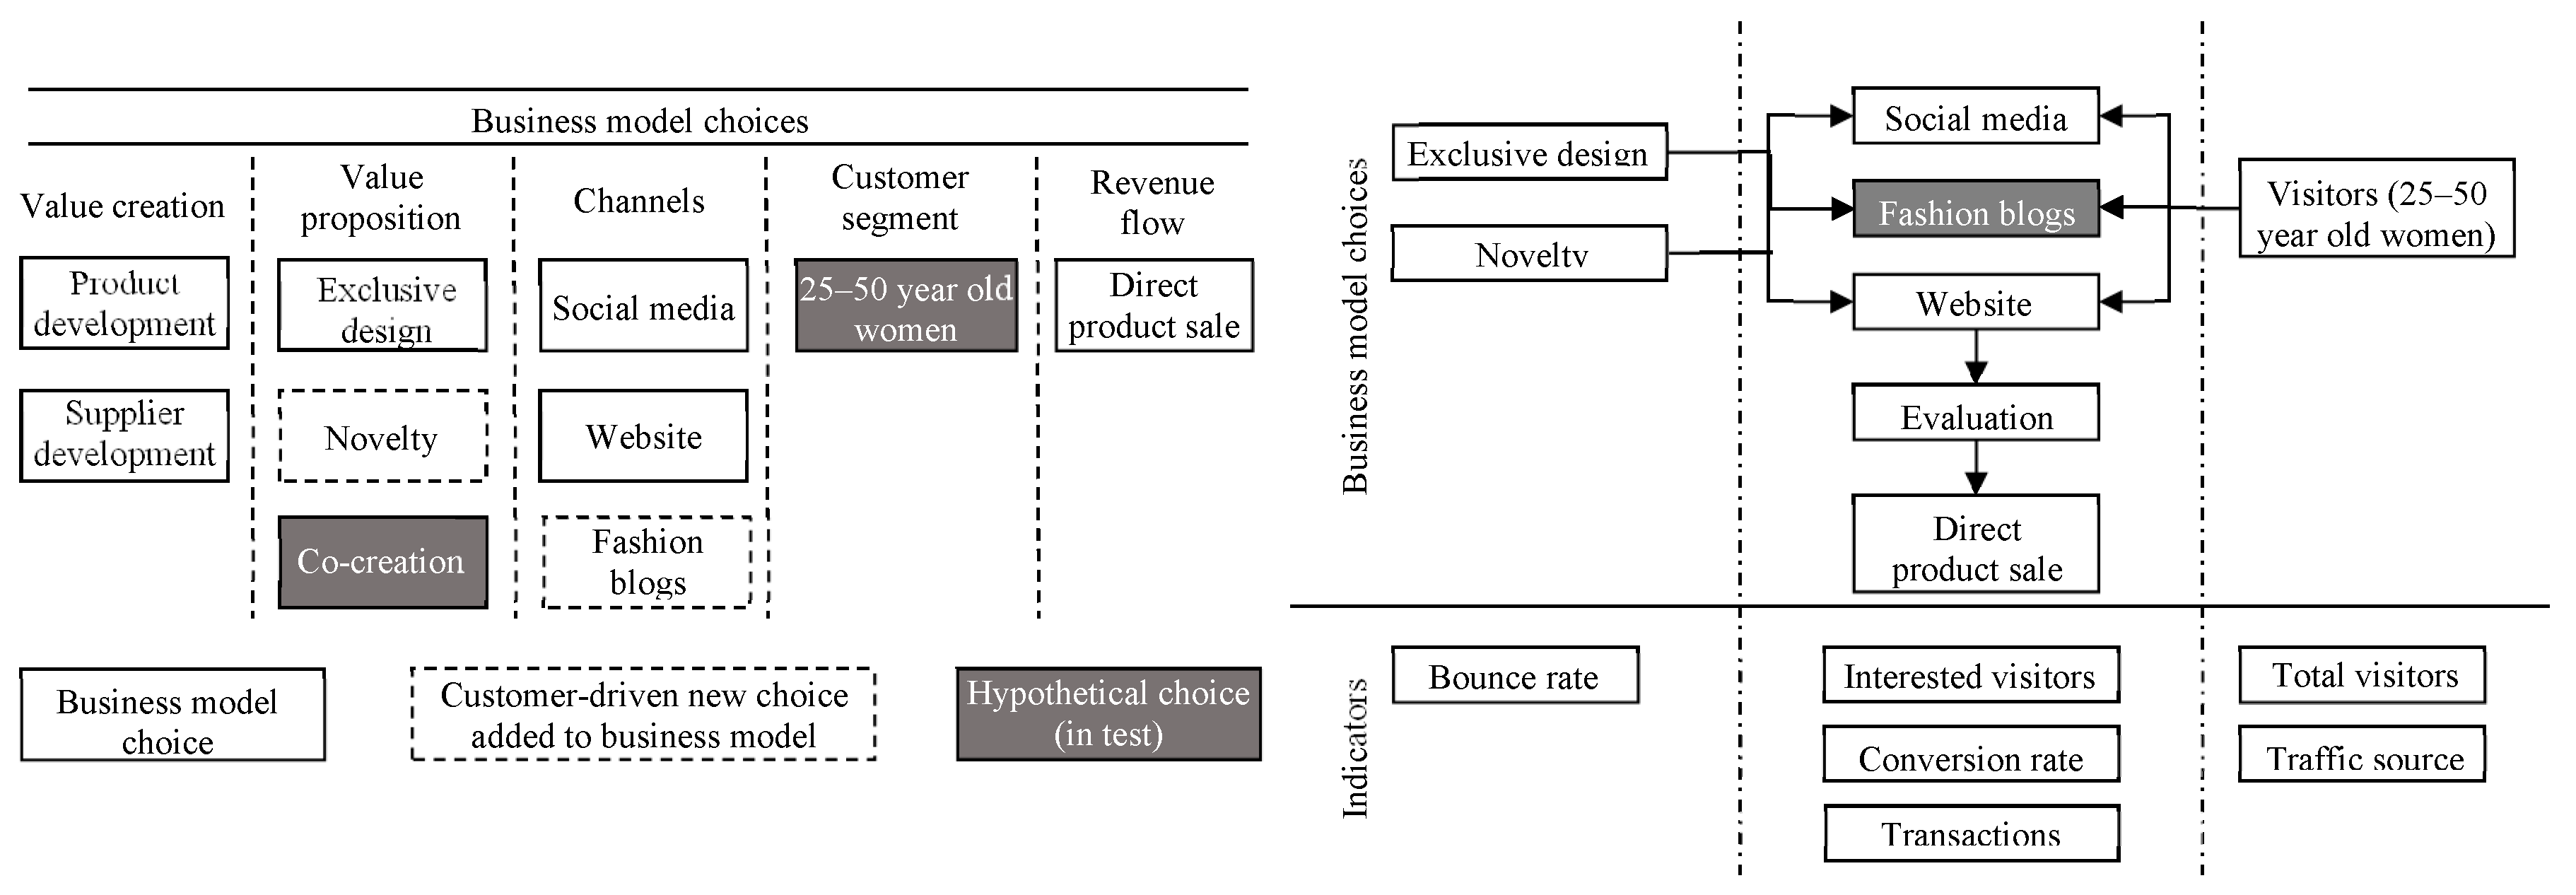
4.2. Second Learning Loop
4.2.1. Business Model Choice Representation and the Cause-and-Effect Diagram
4.2.2. Measure and Analysis
- A co-creation competition for a new collection would be launched. The people in the brand’s Facebook network of fans and friends would be invited to participate in a competition where they could be the brand’s designers and draw a set of products; from this, the winners would be announced as the new collection creators. The winners would also receive a prize, yet to be decided. This initiative had two objectives: The first was to engage the users of the brand in interactions and, consequently, to increase their connection with the brand. The consequence was also to enhance word of mouth which could provide free marketing and will increase the number of visitors. The second objective was to evaluate what the visitors really like, what they expect the brand to offer and, in this way, better understand the visitors’ needs and improve the value proposition. The two objectives combined had the goal to increase both the value proposition and number of visitors, which would also increase the number of interested visitors and, therefore, the transactions;
- The traffic source data showed that some visitors came from another fashion website and from fashion blogger posts. Based on this, the manager decided to establish partnerships with these fashion channels and observe if they were valuable and could become possible key elements in the business model.
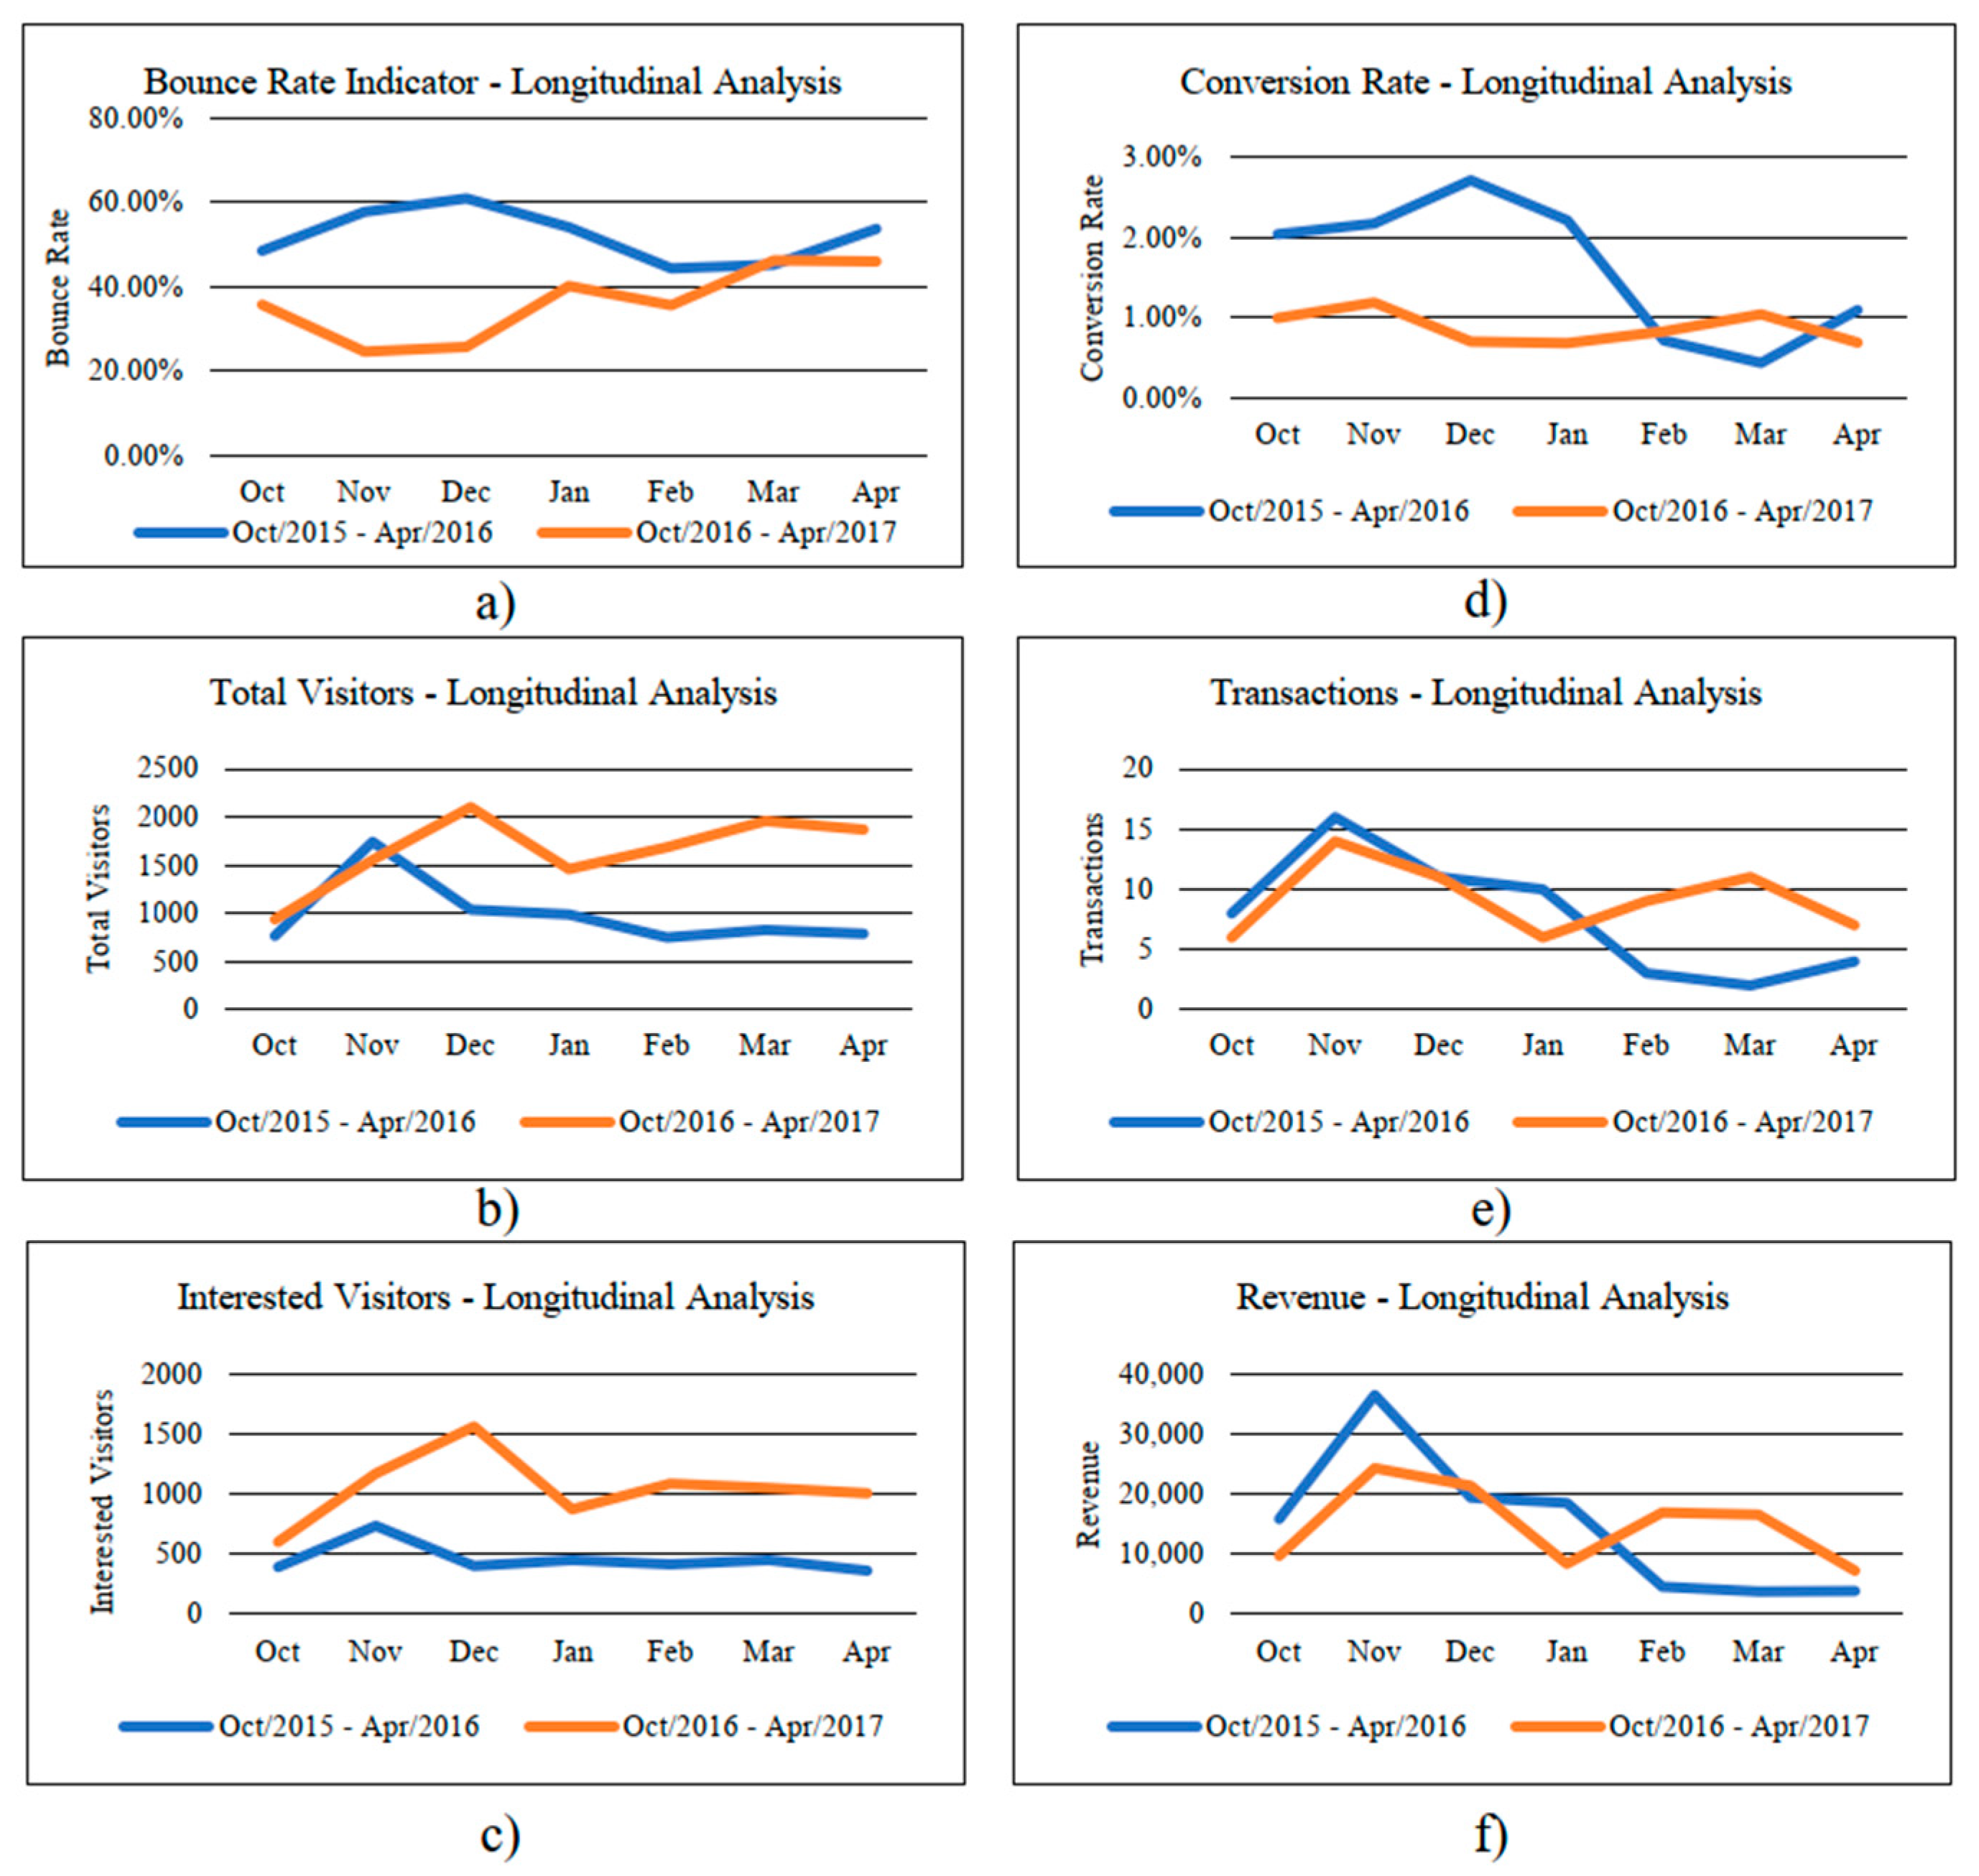
4.2.3. Longitudinal Analysis (Measure and Learn)
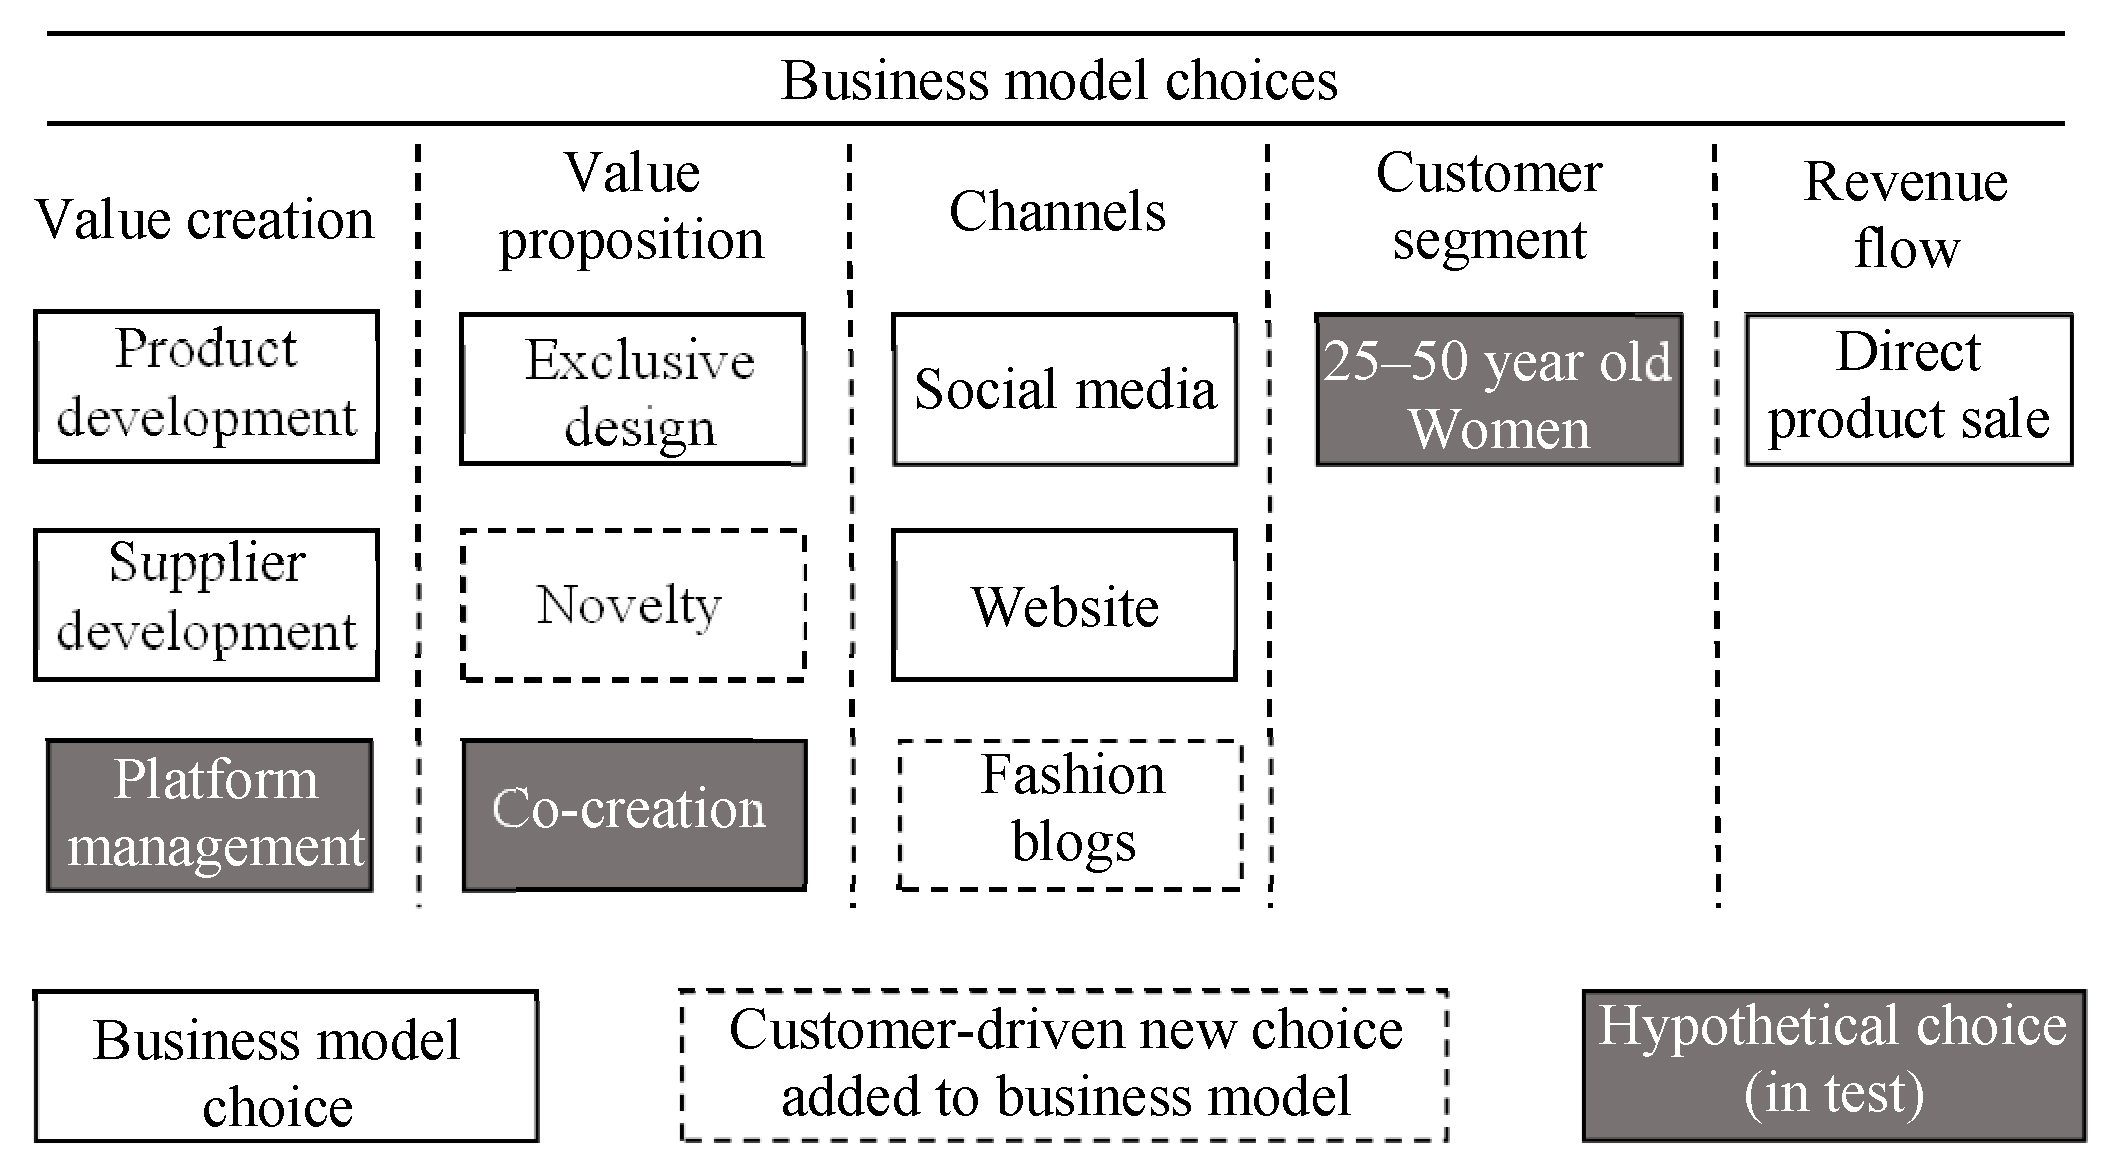
4.3. Third Learning Loop
4.3.1. Hypothetical Choice
4.3.2. Measure and Analysis
4.3.3. Learn and Customer-Driven New Choice
- Conduct a study to identify the customer segment. In order to accomplish this, the e-commerce manager would carry out a study on age group, interests, and average income of the brand’s customers. To this end, the manager would initially conduct a data analysis of Google Analytics in regard to the age range and interests of those who already purchased products. These data would serve as the basis for the formulation of a survey of the e-commerce clients, seeking to identify congruence among the data;
- Conduct a study about blog performance as well as the target audience of each blog in order to correlate the results of each blog with its respective target audience. The goal of this would be to triangulate with Google Analytics and survey data to define the business customer segment;
- Create various segments to boost the marketing in social networks to increase the number of brand users and verify which segments bring more revenue;
- Implement a sales funnel to generate data about customer flow within the site in order to identify how many visitors abandon their shopping carts with products and how many visitors reach the checkout stage. In sequence, identify how many visitors finish the checkout process and how many visitors abandon their purchases. According to an analysis of big company records, the manager pointed out that for fashion e-commerce in Brazil, the average abandon rate of a cart is 50%. This initiative sought to verify current state data to generate new platform improvement initiatives (creation of a new key activity);
- Analyze the feasibility of implementing responsiveness to the mobile device to improve navigation, improve the user experience and, hence, the conversion rate.
5. Conclusions and Future Research
Author Contributions
Funding
Conflicts of Interest
References
- Bouncken, R.B.; Fredrich, V. Business model innovation in alliances: Successful configurations. J. Bus. Res. 2016, 69, 3584–3590. [Google Scholar] [CrossRef]
- Euchner, J.; Ganguly, A. Business Model Innovation in Practive. Res. Manag. 2014, 57, 33–39. [Google Scholar]
- Sosna, M.; Trevinyo-Rodríguez, R.N.; Velamuri, S.R. Business model innovation through trial-and-error learning: The naturhouse case. Long Range Plan. 2010, 43, 383–407. [Google Scholar] [CrossRef]
- Spieth, P.; Schneider, S. Business model innovativeness: Designing a formative measure for business model innovation. J. Bus. Econ. 2016, 86, 671–696. [Google Scholar] [CrossRef]
- Zott, C.; Amit, R.; Massa, L. The business model: Recent developments and future research. J. Manag. 2011, 37, 1019–1042. [Google Scholar]
- Burmeister, C.; Lüttgens, D.; Piller, F.T. Business model innovation for Industrie 4.0: Why the “Industrial Internet” mandates a new perspective on innovation. Die Unternehm. 2016, 70, 124–152. [Google Scholar] [CrossRef]
- Kijl, B.; Boersma, D. Developing a business model engineering & experimentation tool—The quest for scalable ‘lollapalooza confluence patterns’. In Proceedings of the AMCIS 2010, Lima, Peru, 12–15 August 2010. [Google Scholar]
- CBInsights. Top 20 Reasons Why Startups Fail; CBInsights: New York, NY, USA, 2018. [Google Scholar]
- Weissbrod, I.; Bocken, N.M.P. Developing sustainable business experimentation capability—A case study. J. Clean. Prod. 2017, 142, 2663–2676. [Google Scholar] [CrossRef] [Green Version]
- Lindgardt, Z.; Reeves, M.; Stalk, G.; Deimler, M.S. Business Model Innovation: When the game gets tough, change the game. In Own the Future; John Wiley and Sons: Malden, MA, USA, 2012; pp. 291–298. [Google Scholar]
- Schoemaker, P.J.H.; Heaton, S.; Teece, D. Innovation, dynamic capabilities, and leadership. Calif. Manag. Rev. 2018, 61, 15–42. [Google Scholar] [CrossRef] [Green Version]
- Velu, C.; Stiles, P. Managing Decision-Making and Cannibalization for Parallel Business Models. Long Range Plan. 2013, 46, 443–458. [Google Scholar] [CrossRef]
- Velu, C. Business model innovation and third-party alliance on the survival of new firm. Technovation 2015, 35, 1–11. [Google Scholar] [CrossRef] [Green Version]
- Christensen, C.M.; Bartman, T.; Van Bever, D. The Hard Truth about Business Model Innovation. MIT Sloan Manag. Rev. 2016, 58, 31–40. [Google Scholar]
- Laudien, S.M.; Daxböck, B. Antecedents and Outcomes of Collaborative Business Model Innovation. In Proceedings of the XXVI ISPIM Innovation Conference, Budapest, Hungary, 14–17 June 2015. [Google Scholar]
- Bititci, U.S. Managing Business Performance: The Science and the Art; Bititci, U.S., Ed.; John Wiley & Sons, Inc.: Hoboken, NJ, USA, 2015; ISBN 9781119166542. [Google Scholar]
- Kaplan, R.S.; Norton, D.P. The Balanced Scorecard: Translating Strategy into Action; Press, H.B., Ed.; Harvard Business Press: Boston, MA, USA, 1996; ISBN 0875846513. [Google Scholar]
- Busi, M.; Bititci, U.S. Collaborative performance management: Present gaps and future research. Int. J. Product. Perform. Manag. 2006, 55, 7–25. [Google Scholar] [CrossRef]
- Davenport, T.H. How strategists use “big data” to support internal business decisions, discovery and production. Strategy Leadersh. 2016, 42, 45–50. [Google Scholar] [CrossRef]
- Chen, H.; Chiang, R.H.L.; Storey, V.C. Business intelligence and analytics: From big data to big impact. MIS Q. 2012, 36, 1165–1188. [Google Scholar] [CrossRef]
- Erevelles, S.; Fukawa, N.; Swayne, L. Big Data consumer analytics and the transformation of marketing. J. Bus. Res. 2016, 69, 897–904. [Google Scholar] [CrossRef]
- Rodríguez-Mazahua, L.; Rodríguez-Enríquez, C.-A.; Sánchez-Cervantes, J.L.; Cervantes, J.; García-Alcaraz, J.L.; Alor-Hernández, G. A general perspective of Big Data: Applications, tools, challenges and trends. J. Supercomput. 2016, 72, 3073–3113. [Google Scholar] [CrossRef]
- Tiwari, S.; Wee, H.M.; Daryanto, Y. Big data analytics in supply chain management between 2010 and 2016: Insights to industries. Comput. Ind. Eng. 2018, 115, 319–330. [Google Scholar] [CrossRef]
- Xu, Z.; Frankwick, G.L.; Ramirez, E. Effects of big data analytics and traditional marketing analytics on new product success: A knowledge fusion perspective. J. Bus. Res. 2016, 69, 1562–1566. [Google Scholar] [CrossRef]
- Mahajan, V.; Venkatesh, R. Marketing modeling for e-business. Int. J. Res. Mark. 2000, 17, 215–225. [Google Scholar] [CrossRef]
- Rowley, J.E. Reflections on customer knowledge management in e-business. Qual. Mark. Res. Int. J. 2002, 5, 268–280. [Google Scholar] [CrossRef]
- Shen, Y.; Xing, L.; Peng, Y. Study and Application of Web-based Data Mining in E-Business. In Proceedings of the Eighth ACIS International Conference on Software Engineering, Artificial Intelligence, Networking, and Parallel/Distributed Computing (SNPD 2007), Qingdao, China, 30 July–1 August 2007; IEEE: Piscataway, NJ, USA, 2007; Volume 2, pp. 812–816. [Google Scholar]
- Magretta, J. Why Business Models Matter; Harvard Business School: Boston, MA, USA, 2002; pp. 3–8. [Google Scholar]
- Fjeldstad, O.D.; Snow, C.C. Business models and organization design. Long Range Plan. 2018, 51, 32–39. [Google Scholar] [CrossRef]
- Teece, D.J. Business models, business strategy and innovation. Long Range Plan. 2010, 43, 172–194. [Google Scholar] [CrossRef]
- Girotra, K.; Netessine, S. OM forum: Business model innovation for sustainability. Manuf. Serv. Oper. Manag. 2013, 15, 537–544. [Google Scholar] [CrossRef]
- Evans, S.; Vladimirova, D.; Holgado, M.; Van Fossen, K.; Yang, M.; Silva, E.A.; Barlow, C.Y. Business Model Innovation for Sustainability: Towards a Unified Perspective for Creation of Sustainable Business Models. Bus. Strategy Environ. 2017, 26, 597–608. [Google Scholar] [CrossRef]
- Melo, S.; Macedo, J.; Baptista, P. Capacity-sharing in logistics solutions: A new pathway towards sustainability. Transp. Policy 2019, 73, 143–151. [Google Scholar] [CrossRef]
- George, C.; Julsrud, T.E. Cars and the sharing economy: The emergence and impacts of shared automobility in the urban environment. In Advances in Transport Policy and Planning; Elsevier Inc.: Amsterdam, The Netherlands, 2019; pp. 1–32. [Google Scholar]
- Dilger, M.G.; Jovanović, T.; Voigt, K.-I. Upcrowding energy co-operatives—Evaluating the potential of crowdfunding for business model innovation of energy co-operatives. J. Environ. Manag. 2017, 198, 50–62. [Google Scholar] [CrossRef]
- Zhang, C.; Campana, P.E.; Yang, J.; Yan, J. Economic performance of photovoltaic water pumping systems with business model innovation in China. Energy Convers. Manag. 2017, 133, 498–510. [Google Scholar] [CrossRef]
- Chesbrough, H. Business Model Innovation: Opportunities and Barriers. Long Range Plan. 2010, 43, 354–363. [Google Scholar] [CrossRef]
- Geissdoerfer, M.; Bocken, N.M.P.; Hultink, E.J. Design thinking to enhance the sustainable business modelling process—A workshop based on a value mapping process. J. Clean. Prod. 2016, 135, 1218–1232. [Google Scholar] [CrossRef] [Green Version]
- Gorissen, L.; Vrancken, K.; Manshoven, S. Transition thinking and business model innovation-towards a transformative business model and new role for the reuse centers of Limburg, Belgium. Sustainability 2016, 8, 112. [Google Scholar] [CrossRef] [Green Version]
- Teece, D.J. Profiting from innovation in the digital economy: Enabling technologies, standards, and licensing models in the wireless world. Res. Policy 2018, 47, 1367–1387. [Google Scholar] [CrossRef]
- Teece, D.J. Business models and dynamic capabilities. Long Range Plan. 2018, 51, 40–49. [Google Scholar] [CrossRef]
- Gassmann, O.; Frankenberger, K.; Csik, M. Revolutionizing Business Model. In Management of the Fuzzy Front End of Innovation; Gassmann, O., Schweitzer, F., Eds.; Springer International Publishing: Cham, Switzerland, 2014; p. 339. [Google Scholar]
- Chesbrough, H.; Rosenbloom, R.S. The role of the business model in capturing value from innovation: Evidence from Xerox Corporation’s technology spin-off companies. Ind. Corp. Chang. 2002, 11, 529–555. [Google Scholar] [CrossRef] [Green Version]
- Eppler, M.J.; Hoffmann, F. Challenges and Visual Solutions for Strategic Business Model Innovation. In Strategies and Communications for Innovations; Hülsmann, M., Pfeffermann, N., Eds.; Springer: Berlin/Heidelberg, Germany, 2011; pp. 25–36. ISBN 9783642172229. [Google Scholar]
- Martins, L.L.; Rindova, V.P.; Greenbaum, B.E. Unlocking the Hidden Value of Concepts: A Cognitive Approach to Business Model Innovation. Strateg. Entrep. J. 2015, 9, 97–117. [Google Scholar] [CrossRef]
- Täuscher, K.; Abdelkafi, N. Visual tools for business model innovation: Recommendations from a cognitive perspective. Creat. Innov. Manag. 2017, 26, 160–174. [Google Scholar] [CrossRef] [Green Version]
- Zott, C.; Amit, R. Business Model Innovation. In The Oxford Handbook of Creativity, Innovation, and Entrepreneurship; Shalley, C.E., Hitt, M.A., Zhou, J., Eds.; Oxford University Press: New York, NY, USA, 2015. [Google Scholar]
- Gebauer, H.; Haldimann, M.; Saul, C.J. Business model innovations for overcoming barriers in the base-of-the-pyramid market. Ind. Innov. 2017, 24, 543–568. [Google Scholar] [CrossRef]
- Rayna, T.; Striukova, L. From rapid prototyping to home fabrication: How 3D printing is changing business model innovation. Technol. Forecast. Soc. Chang. 2016, 102, 214–224. [Google Scholar] [CrossRef] [Green Version]
- Ehrenhard, M.; Wijnhoven, F.; Van den Broek, T.; Zinck Stagno, M. Unlocking how start-ups create business value with mobile applications: Development of an App-enabled Business Innovation Cycle. Technol. Forecast. Soc. Chang. 2017, 115, 26–36. [Google Scholar] [CrossRef]
- Batocchio, A.; Minatogawa, V.L.F.; Anholon, R. Proposal for a Method for Business Model Performance Assessment: Toward an Experimentation Tool for Business Model Innovation. J. Technol. Manag. Innov. 2017, 12, 61–70. [Google Scholar] [CrossRef] [Green Version]
- Bititci, U.S.; Garengo, P.; Nudurupati, S.S. Performance Measurement: Challenges for Tomorrow. Int. J. Manag. Rev. 2012, 14, 305–327. [Google Scholar] [CrossRef] [Green Version]
- Davenport, T.H.; Harris, J.G. Competing on Analytics: The New Science of Winning; Harvard Business Press: Brighton, MA, USA, 2007. [Google Scholar]
- Davenport, T.H.; Harris, J.G.; Morison, R. Analytics at Work: Smarter Decisions, Better Results; Harvard Business Press: Brighton, MA, USA, 2010. [Google Scholar]
- Morioka, S.N.; Evans, S.; De Carvalho, M.M. Sustainable Business Model Innovation: Exploring Evidences in Sustainability Reporting. Procedia CIRP 2016, 40, 659–667. [Google Scholar] [CrossRef] [Green Version]
- Hu, H.; Huang, T.; Cheng, Y.; Lu, H. The evolution of sustainable business model innovation: Evidence from a sharing economy platform in China. Sustainability 2019, 11, 4207. [Google Scholar] [CrossRef] [Green Version]
- Schein, E.H. Organizational Culture and Leadership, 4th ed.; John Wiley & Sons: San Francisco, CA, USA, 2010; ISBN 9780470185865. [Google Scholar]
- Minatogawa, V.L.F.; Franco, M.M.V.; Batocchio, A. Business model innovation influencing factors: An integrative literature review. Braz. J. Oper. Prod. Manag. 2018, 15, 610–617. [Google Scholar] [CrossRef]
- Picciano, A.G. The Evolution of Big Data and Learning Analytics in American Higher Education. J. Asynchronous Learn. Netw. 2012, 16, 9–20. [Google Scholar] [CrossRef] [Green Version]
- Provost, F.; Fawcett, T. Data Science and its Relationship to Big Data and Data-Driven Decision Making. Big Data 2013, 1, 51–59. [Google Scholar] [CrossRef]
- McAfee, A.; Brynjolfsson, E. Big data: The management revolution. Harv. Bus. Rev. 2012, 90, 61–68. [Google Scholar]
- Malomo, F.; Sena, V. Data Intelligence for Local Government? Assessing the Benefits and Barriers to Use of Big Data in the Public Sector. Policy Internet 2017, 9, 7–27. [Google Scholar] [CrossRef]
- Vidgen, R.; Shaw, S.; Grant, D.B. Management challenges in creating value from business analytics. Eur. J. Oper. Res. 2017, 261, 626–639. [Google Scholar] [CrossRef]
- Najafabadi, M.M.; Villanustre, F.; Khoshgoftaar, T.M.; Seliya, N.; Wald, R.; Muharemagic, E. Deep learning applications and challenges in big data analytics. J. Big Data 2015, 2, 1–21. [Google Scholar] [CrossRef] [Green Version]
- Sharma, K. Quality Issues with Big data Analytics. In Proceedings of the 2016 3rd International Conference on Computing for Sustainable Global Development (INDIACom), New Delhi, India, 16–18 March 2016; pp. 3589–3591. [Google Scholar]
- Singh, D.; Reddy, C.K. A survey on platforms for big data analytics. J. Big Data 2014, 1, 1–20. [Google Scholar] [CrossRef] [Green Version]
- Dong, X.L.; Srivastava, D. Big data integration. In Proceedings of the IEEE 29th International Conference on Data Engineering (ICDE), Brisbane, Australia, 8–12 April 2013; IEEE: Piscataway, NJ, USA, 2013; pp. 1245–1248. [Google Scholar]
- Wang, G.; Gunasekaran, A.; Ngai, E.W.T.; Papadopoulos, T. Big data analytics in logistics and supply chain management: Certain investigations for research and applications. Int. J. Prod. Econ. 2016, 176, 98–110. [Google Scholar] [CrossRef]
- Pinzón, D.F.D.B.; De Souza, F.T. A data based model as a metropolitan management tool: The Bogotá-Sabana region case study in Colombia. Land Use Policy 2016, 54, 253–263. [Google Scholar] [CrossRef]
- Plaza, B. Google Analytics for measuring website performance. Tour. Manag. 2011, 32, 477–481. [Google Scholar] [CrossRef]
- Pakkala, H.; Presser, K.; Christensen, T. Using Google Analytics to measure visitor statistics: The case of food composition websites. Int. J. Inf. Manag. 2012, 32, 504–512. [Google Scholar] [CrossRef]
- Fahmideh, M.; Beydoun, G. Big data analytics architecture design—An application in manufacturing systems. Comput. Ind. Eng. 2019, 128, 948–963. [Google Scholar] [CrossRef]
- Buhl, H.U.; Röglinger, M.; Moser, F.; Heidemann, J. Big data: A fashionable topic with(out) sustainable relevance for research and practice? Bus. Inf. Syst. Eng. 2013, 5, 65–69. [Google Scholar] [CrossRef] [Green Version]
- Loebbecke, C.; Picot, A. Reflections on societal and business model transformation arising from digitization and big data analytics: A research agenda. J. Strateg. Inf. Syst. 2015, 24, 149–157. [Google Scholar] [CrossRef]
- Sorescu, A. Data-Driven Business Model Innovation. J. Prod. Innov. Manag. 2017, 34, 691–696. [Google Scholar] [CrossRef]
- Wang, Y.; Kung, L.; Anthony, T. Big data analytics: Understanding its capabilities and potential benefits for healthcare organizations. Technol. Forecast. Soc. Chang. 2018, 126, 3–13. [Google Scholar] [CrossRef]
- Brownlow, J.; Zaki, M.; Neely, A. Data-Driven Business Models: A Blueprint for Innovation; University of Cambridge: Cambridge, UK, 2015. [Google Scholar]
- Hartmann, P.M.; Zaki, M.; Feldmann, N.; Neely, A. Big Data for Big Business? A Taxonomy of Data-Driven Business Models Used by Start-Up Firms. Available online: https://cambridgeservicealliance.eng.cam.ac.uk/resources/Downloads/Monthly%20Papers/2014_March_DataDrivenBusinessModels.pdf (accessed on 25 December 2019).
- Schoormann, T.; Behrens, D.; Knackstedt, R. Design Principles for Leveraging Sustainability Business Modelling Tools. In Proceedings of the Twenty-Sixth European Conference on Information Systems (ECIS2018), Portsmouth, UK, 23–28 June 2018. [Google Scholar]
- Morabito, V. Big Data Driven Business Models. In Big Data and Analytics; Springer International Publishing: Cham, Switzerland, 2015; pp. 65–80. [Google Scholar]
- Nagle, T.; Sammon, D. Big Data: A Framework for Research. In DSS 2.0—Supporting Decision Making with New Technologies; Phillips-Wren, G.E., Carlsson, S., Respício, A., Brezillon, P., Eds.; IOS Press: Amsterdam, The Netherlands, 2014; pp. 395–400. [Google Scholar]
- Foss, N.J.; Saebi, T. Fifteen Years of Research on Business Model Innovation: How Far Have We Come, and Where Should We Go? J. Manag. 2016, 43, 200–227. [Google Scholar] [CrossRef] [Green Version]
- Foss, N.J.; Saebi, T. Business models and business model innovation: Between wicked and paradigmatic problems. Long Range Plan. 2018, 51, 1–13. [Google Scholar] [CrossRef]
- Hevner, A.R.; March, S.T.; Park, J.; Ram, S.; Ram, S. Research Essay Design Science in Information. MIS Q. 2004, 28, 75–105. [Google Scholar] [CrossRef] [Green Version]
- Van Aken, J.E. Management Research Based on the Paradigm of the Design Sciences: The Quest for Field-Tested and Grounded Technological Rules. J. Manag. Stud. 2004, 41, 219–246. [Google Scholar] [CrossRef]
- Dresch, A.; Lacerda, D.P.; Antunes, J.A.V., Jr. Design Science Research: A Method for Science and Technology Advancement; Springer: Cham, Switzerland; Berlin/Heidelberg, Germany; New York, NY, USA; Dordrecht, The Netherlands; London, UK, 2015; ISBN 978-3-319-07373-6. [Google Scholar]
- Holmström, J.; Ketokivi, M.; Hameri, A.-P. Bridging Practice and Theory: A Design Science Approach. Decis. Sci. 2009, 40, 65–87. [Google Scholar] [CrossRef]
- Cole, R.; Purao, S.; Rossi, M.; Sein, M.K. Being proactive: Where action research meets design research. In Proceedings of the ICIS 2005, Las Vegas, NV, USA, 11–14 December 2005; Volume 27, pp. 325–336. [Google Scholar]
- Baldassarre, B.; Calabretta, G.; Bocken, N.M.P.; Jaskiewicz, T. Bridging sustainable business model innovation and user-driven innovation: A process for sustainable value proposition design. J. Clean. Prod. 2017, 147, 175–186. [Google Scholar] [CrossRef] [Green Version]
- Osterwalder, A.; Pigneur, Y. Business Model Generation: A Handbook for Visionaries, Game Changers, and Challengers; John Wiley & Sons: Hoboken, NJ, USA, 2010. [Google Scholar]
- Raffoni, A.; Visani, F.; Bartolini, M.; Silvi, R. Business Performance Analytics: Exploring the potential for Performance Management Systems. Prod. Plan. Control 2017, 29, 51–67. [Google Scholar] [CrossRef]
- Nudurupati, S.S.; Bititci, U.S.; Kumar, V.; Chan, F.T.S. State of the art literature review on performance measurement. Comput. Ind. Eng. 2011, 60, 279–290. [Google Scholar] [CrossRef] [Green Version]
- Casadesus-Masanell, R.; Ricart, J.E. From strategy to business models and onto tactics. Long Range Plan. 2010, 43, 195–215. [Google Scholar] [CrossRef]
- Toro-Jarrín, M.A.; Ponce-Jaramillo, I.E.; Güemes-Castorena, D. Methodology for the of building process integration of Business Model Canvas and Technological Roadmap. Technol. Forecast. Soc. Chang. 2016, 110, 213–225. [Google Scholar] [CrossRef]
- Futterer, F.; Schmidt, J.; Heidenreich, S. Effectuation or causation as the key to corporate venture success? Investigating effects of entrepreneurial behaviors on business model innovation and venture performance. Long Range Plan. 2018, 51, 64–81. [Google Scholar] [CrossRef]
- Alberts, B. Comparing business modeling methods: Creating and applying a comparison framework for meta-business models. In Proceedings of the 14th Twente Student Conference on IT (TSConIT), Enschede, The Netherlands, 21 January 2011; pp. 153–162. [Google Scholar]
- Bertels, H.M.; Koen, P.A.; Elsum, I. Business Models Outside the Core: Lessons Learned from Success and Failure. Res. Manag. 2015, 58, 20–29. [Google Scholar]
- Plaza, M.; Zębala, W.; Matras, A. Decision system supporting optimization of machining strategy. Comput. Ind. Eng. 2019, 127, 21–38. [Google Scholar] [CrossRef]
- Eisenhardt, K.M.; Gräbner, M.E. Theory building from cases: Opportunities and challenges. Acad. Manag. J. 2007, 50, 25–32. [Google Scholar] [CrossRef]
- Yin, R.K. Case Study Research: Design and Methods, 5th ed.; SAGE Publications, Inc.: Thousand Oaks, CA, USA, 2014. [Google Scholar]
- Berends, H.; Smits, A.; Reymen, I.; Podoynitsyna, K. Learning while (re)configuring: Business model innovation processes in established firms. Strateg. Organ. 2016, 14, 181–219. [Google Scholar] [CrossRef] [PubMed] [Green Version]
- Pucihar, A.; Lenart, G.; Borštnar, M.K.; Vidmar, D.; Marolt, M. Drivers and outcomes of business model innovation-micro, small and medium-sized enterprises perspective. Sustainability 2019, 11, 344. [Google Scholar] [CrossRef] [Green Version]
- Bohnsack, R.; Pinkse, J.; Kolk, A. Business models for sustainable technologies: Exploring business model evolution in the case of electric vehicles. Res. Policy 2014, 43, 284–300. [Google Scholar] [CrossRef] [Green Version]
- Chai, B.C.; Van der Voort, J.R.; Grofelnik, K.; Eliasdottir, H.G.; Klöss, I.; Perez-Cueto, F.J.A. Which diet has the least environmental impact on our planet? A systematic review of vegan, vegetarian and omnivorous diets. Sustainability 2019, 11, 4110. [Google Scholar] [CrossRef] [Green Version]
- Mao, H.; Liu, S.; Zhang, J.; Deng, Z. Information technology resource, knowledge management capability, and competitive advantage: The moderating role of resource commitment. Int. J. Inf. Manag. 2016, 36, 1062–1074. [Google Scholar] [CrossRef]
- Eisenhardt, K.M. Building Theories from Case Study Research. Acad. Manag. Rev. 1989, 14, 532–550. [Google Scholar] [CrossRef]
- Wei, Y.; Miraglia, S. Organizational culture and knowledge transfer in project-based organizations: Theoretical insights from a Chinese construction firm. Int. J. Proj. Manag. 2017, 35, 571–585. [Google Scholar] [CrossRef]
- Müller, J.M.; Däschle, S. Business model innovation of industry 4.0 solution providers towards customer process innovation. Processes 2018, 6, 260. [Google Scholar] [CrossRef] [Green Version]


| Device | Total Visitors (Number) | Bounce Rate (%) | Interested Visitors (Number) | Conversion Rate (%) | Transactions (Number) | Revenue (Monetary Units) |
|---|---|---|---|---|---|---|
| Desktop | 4550 | 55.87% | 2008 | 1.01% | 46 | 90,163.56 |
| Mobile | 2173 | 49.10% | 1106 | 0.32% | 7 | 11,262.12 |
| Tablet | 186 | 43.01% | 106 | 0.54% | 1 | 1155.24 |
| Totals | 6909 | 53.39% | 3220 | 0.78% | 54 | 102,580.92 |
| Device | Total Visitors (Number) | Bounce Rate (%) | Interested Visitors (Number) | Conversion Rate (%) | Transactions (Number) | Revenue (Monetary Units) |
|---|---|---|---|---|---|---|
| Mobile | 5807 | 35.46% | 3748 | 0.26% | 15 | 24,679.08 |
| Desktop | 5475 | 36.99% | 3450 | 0.86% | 47 | 75,704.28 |
| Tablet | 293 | 47.10% | 155 | 0.68% | 2 | 4332.84 |
| Totals | 11,575 | 36.48% | 7353 | 0.55% | 64 | 104,716.20 |
© 2019 by the authors. Licensee MDPI, Basel, Switzerland. This article is an open access article distributed under the terms and conditions of the Creative Commons Attribution (CC BY) license (http://creativecommons.org/licenses/by/4.0/).
Share and Cite
Minatogawa, V.L.F.; Franco, M.M.V.; Rampasso, I.S.; Anholon, R.; Quadros, R.; Durán, O.; Batocchio, A. Operationalizing Business Model Innovation through Big Data Analytics for Sustainable Organizations. Sustainability 2020, 12, 277. https://doi.org/10.3390/su12010277
Minatogawa VLF, Franco MMV, Rampasso IS, Anholon R, Quadros R, Durán O, Batocchio A. Operationalizing Business Model Innovation through Big Data Analytics for Sustainable Organizations. Sustainability. 2020; 12(1):277. https://doi.org/10.3390/su12010277
Chicago/Turabian StyleMinatogawa, Vinicius Luiz Ferraz, Matheus Munhoz Vieira Franco, Izabela Simon Rampasso, Rosley Anholon, Ruy Quadros, Orlando Durán, and Antonio Batocchio. 2020. "Operationalizing Business Model Innovation through Big Data Analytics for Sustainable Organizations" Sustainability 12, no. 1: 277. https://doi.org/10.3390/su12010277
APA StyleMinatogawa, V. L. F., Franco, M. M. V., Rampasso, I. S., Anholon, R., Quadros, R., Durán, O., & Batocchio, A. (2020). Operationalizing Business Model Innovation through Big Data Analytics for Sustainable Organizations. Sustainability, 12(1), 277. https://doi.org/10.3390/su12010277