Article

Life Cycle Cost, Energy and Carbon Assessments of Beijing-Shanghai High-Speed Railway

by
Sakdirat Kaewunruen
*,
Jessada Sresakoolchai
and
Junying Peng
School of Engineering, University of Birmingham, Birmingham B15 2TT, UK
*
Author to whom correspondence should be addressed.
Sustainability 2020, 12(1), 206; https://doi.org/10.3390/su12010206
Submission received: 24 November 2019 / Revised: 22 December 2019 / Accepted: 22 December 2019 / Published: 25 December 2019
(This article belongs to the Section Sustainable Urban and Rural Development)

Abstract

:
The Beijing-Shanghai High-Speed Railway (HSR) is one of the most important railways in China, but it also has impacts on the economy and the environment while creating social benefits. This paper uses a life cycle assessment (LCA) method and a life cycle cost (LCC) analysis method to summarize the energy consumption, carbon emissions and costs of the Beijing-Shanghai HSR from the perspective of life cycle, and proposes some corresponding suggestions based on the results. The research objective of this paper is to analyse the carbon emissions, energy consumption, and costs of the rail system which includes the structure of the track and earthwork of the Beijing-Shanghai HSR during four stages: conception stage, construction stage, operation and maintenance stage, and disposal stage. It is concluded that the majority of the carbon emissions and energy consumption of the entire rail system are from the construction stage, accounting for 64.86% and 54.31% respectively. It is followed by the operation and maintenance stage with 31.60% and 35.32% respectively. In contrast, the amount of carbon emissions and energy consumption from the conception stage is too small to be considered. Furthermore, cement is the major contributor to the carbon emissions and energy consumption during the construction stage. As for the cost, the construction stage spends the largest amount of money (US$4614.00 million), followed by the operation and maintenance stage (US$910.61 million). Improving production technologies and choosing construction machinery are proposed to reduce the cost and protect the environment.

1. Introduction

The Beijing-Shanghai High-Speed Railway (HSR) is located in the north and east of China, starting from the capital Beijing, and then finally ending in Shanghai which is the largest city in China (see Figure 1). The construction of this huge project started on April 2008 and was opened to traffic on June 2011 with a design speed of 350 km/h. The Beijing-Shanghai HSR is 1318 km long and there are 21 stations across the whole line. It is one of the most important transport routes in China [1].
However, the construction cost of the Beijing-Shanghai HSR was relatively high compared to other traditional railways when the cost of a double-track railway was US$3.50 million per km [2] but the cost of a high speed rail with a maximum speed of 350 km/h was US$17–21 million per km [3]. Also, it will have a certain impact on the surrounding environment and energy sources during its whole life cycle. To ensure smooth development of the life cycle of the HSR project, energy consumption may be increased because the HSR consumed more energy than the traditional system to achieve the design speed of rolling stocks. Therefore, it is necessary to understand the impact on the environment and costs of each stage during the whole life cycle of the HSR. As an environmental management tool, life cycle assessment (LCA) does not just effectively quantify current environmental conflicts, it also evaluates the environmental issues involved in the whole process of the HSR [4]. At the same time, life cycle cost (LCC) analysis could provide the basis for the structural optimization design of the ballastless track and better operation and maintenance strategies [5]. This paper adopts the method of LCA and LCC to evaluate environmental impacts and costs of the entire rail system (including the structure of track and earthwork) of the Beijing-Shanghai HSR in four stages of the life cycle to overcome gaps of previous studies. Therefore, this study has been carried out by doing a rigorous literature review. Further information is presented in the next section.

2. Literature Review

There have been a lot of researches to analyse different high-speed railways using the LCA method in different countries. In the United States, Chester and Horvath [7] conducted a study to test environmental impacts on different transportation modes by using the LCA method. In addition to the vehicle operation phase, the vehicle, infrastructure, fuel, and supply chain components had been considered in this study and it has been noted that the non-operational vehicle phases made a greater contribution to the increase of energy consumption and emissions than the operational ones [7]. Chester and Horvath [7] then compared the greenhouse gas emissions and energy consumption of the California High-Speed Railway (CAHSR) with other modes of transportation at different occupancies. They came to the conclusion that the CAHSR emitted less greenhouse gases and consumed less energy at a higher occupancy [8]. Chang and Kendall [9] applied the LCA method to further research on the CAHSR based on the study of Chester and Horvath [8]. They found that tunnelling and aerial structures which accounted for only 15% of the total length of the route emitted around 60% of the carbon emissions, and only a small amount of carbon emissions came from the maintenance phase. The production of materials contributed the highest share of the greenhouse gas (GHG) emissions during the infrastructure construction process (80%). This was an important factor to affect carbon emissions compared to the 16% of emissions from the transportation of construction materials [9].
In Europe, Rozycki et al. carried out a study of the German High-Speed Rail System using LCA and discovered that energy consumption from infrastructure construction dominated all energy used during the entire life cycle. They also made a comparison between new ballastless slab tracks and tracks with traditional gravel bed. For ballasted track, the loads from wheels are applied to the rail, then distributed to the baseplate, sleeper, and the ballast respectively. From the increasing area, the stresses are increased so the stress applying to the subgrade should be low. Advantages of ballasted tracks are relatively low construction costs, better drainage properties, higher elasticity, better noise absorption properties, and simpler maintenance. However, disadvantages of a ballasted track are a shorter lifetime, high maintenance requirement, relatively high maintenance cost, heavier structure, higher structural height, lower lateral and longitudinal resistance. For a ballastless track, ballast is replaced by concrete elements. Advantages of ballastless tracks are longer lifetime, less maintenance, more availability, higher longitudinal and lateral stability, more accessibility in case of emergency, and lower structural height and weight. However, disadvantages of ballastless tracks are higher construction costs, higher substructure requirements, more expensive and complex maintenance, and worse noise absorption properties [10]. In conclusion, the ballastless slab tracks were more favourable [11] in terms of maintenance and life cycle costs because the maintenance cost is cheaper in the long term when compared with the ballasted track. Then Åkerman [12] used the LCA method to analyse Europabanan, which was the HSR in Sweden, and found that GHG emissions from the HSR track were much lower than those from other modes of transport, which was conductive to mitigating climate change. However, the infrastructure construction and maintenance processes of the railway could release more GHG to weaken this effect [12]. Jones et al. [13] applied LCA to assess the environmental impacts on the Portugal HSR from Lisbon to Porto by analysing main processes of trains as well as the track. They believed that the train operation process generated the largest amount of environmental emissions.
Since the 1990s, there have also been several researches in China to introduce the basic methodology, the application situation, and future prospects of LCA. Early application of LCA in China mainly concentrated on cement, steel, plastic, and other materials [14]. In 2013, Yang et al. [4] used the LCA method to analyse and calculate the environmental impacts on the whole life cycle of railway transportation based on Chinese railway statistic data in 2010. He came to the conclusion that impacts of railway infrastructure construction and raw materials production on the environment were significant, accounting for between 9.45–73.55% [4]. Yue et al. [15] used scenario analysis to determine several key factors of life cycle environmental impacts of the Chinese HSR system and made some proposals to improve the effect of the environment according to the results, such as reducing the number of bridges, tunnels, and subgrades as much as possible.
In addition to the studies of energy consumption and environmental emissions of the HSR from a life-cycle perspective, scholars from different countries also focus on a life cycle cost (LCC) assessment of the HSR. Zoeteman and Esveld [16] analysed the LCC of various rails in the Netherlands. The results showed that the ballasted track of the HSR had the highest cost, and the costs of several non-ballasted systems were lower [16]. Zoeteman and Esveld [16] used the LCC analysis to evaluate the track structure and analysed the Madrid Metro and Embedded Rail structure in the Netherlands. Following this study, Zoeteman [17] then studied the life cycle management principle for design and operation as well as maintenance phases in the rail area and used LCC analysis as a tool to build a model of a decision support system. Moreover, the High-Speed Line track system and its maintenance phase’s strategies have been used as an example to analyse and propose several suggestions for the rail infrastructure sector such as altering the data collection system or organizational factors.
In China, there are also similar researches in recent years. Chen and Huang [18] analysed the costs of different high-speed railways in Taiwan, they concluded that the non-ballasted track system was better than the conventional ballasted track from the point view of the LCC. Although the construction cost of the non-ballasted track was 1.3–1.75 times that of the ballasted track, the decline of maintenance cost led to a much lower life cycle cost of the non-ballasted track [18]. Wu [19] combined with the construction of passengers dedicated lines in China to analyse the economy of a China railways track structure (CRTS) II slab ballastless track through life cycle assessment. His study reached the same conclusion as Chen’s [18]. This implied that the most economical solution was to lay the ballastless track for the whole rail line [19].
In 2018, Lin et al. [20] studied the carbon footprint of the HSR in China, the Beijing-Shanghai Line. They analysed subsystems of the HSR project which consisted of bridges, tunnels, subgrades, rails, stations, and electric and electric multiple unit trains (EMUs) in different stages of the project in the following detail: materials and energy conception during the construction stage, the energy consumption by EMUs and stations during the operation stage, and the materials and energy consumption during the maintenance stage. It can be seen that this study conducted different components at different stages of the project. However, there was no comprehensive study to cover all aspect of the HSR project. For example, the life cycle cost of the Beijing-Shanghai Line has never been studied or analysed, as well as the carbon emissions during the conception stage and disposal stage. Moreover, carbon emissions and energy consumption had not been conducted comprehensively in the mentioned study because the materials used were not included in the analysis. In addition, the mentioned study estimated the materials used and energy consumption by a prediction model of the construction standards and the HSR construction [21]. However, this study will collect data from the official documents of the project. The accuracy and precision of the data are supposed to be more realistic than other previous studies. At the same time, this is resulting in novel insights critical for the decision making of policy makers. Therefore, this study will present additional views of the life cycle assessment and life cycle cost of the HSR project, the Beijing-Shanghai Line, which have never been conducted. From the above literature it can be seen that although there are many studies which have focused on the environmental impact assessment and costs of the HSR in China, they are still at the beginning stage and not enough to keep pace with the rapid development of the HSR compared to similar studies of other countries because both studies mentioned in the previous paragraph were conducted in 2003 and 2010 respectively. The technology and characteristics of the HSR in China have totally changed and the mentioned studies may not be able to be applied to current conditions. Therefore, it is necessary to have further studies on the environmental impacts and costs of the HSR system in China.

3. Methodology

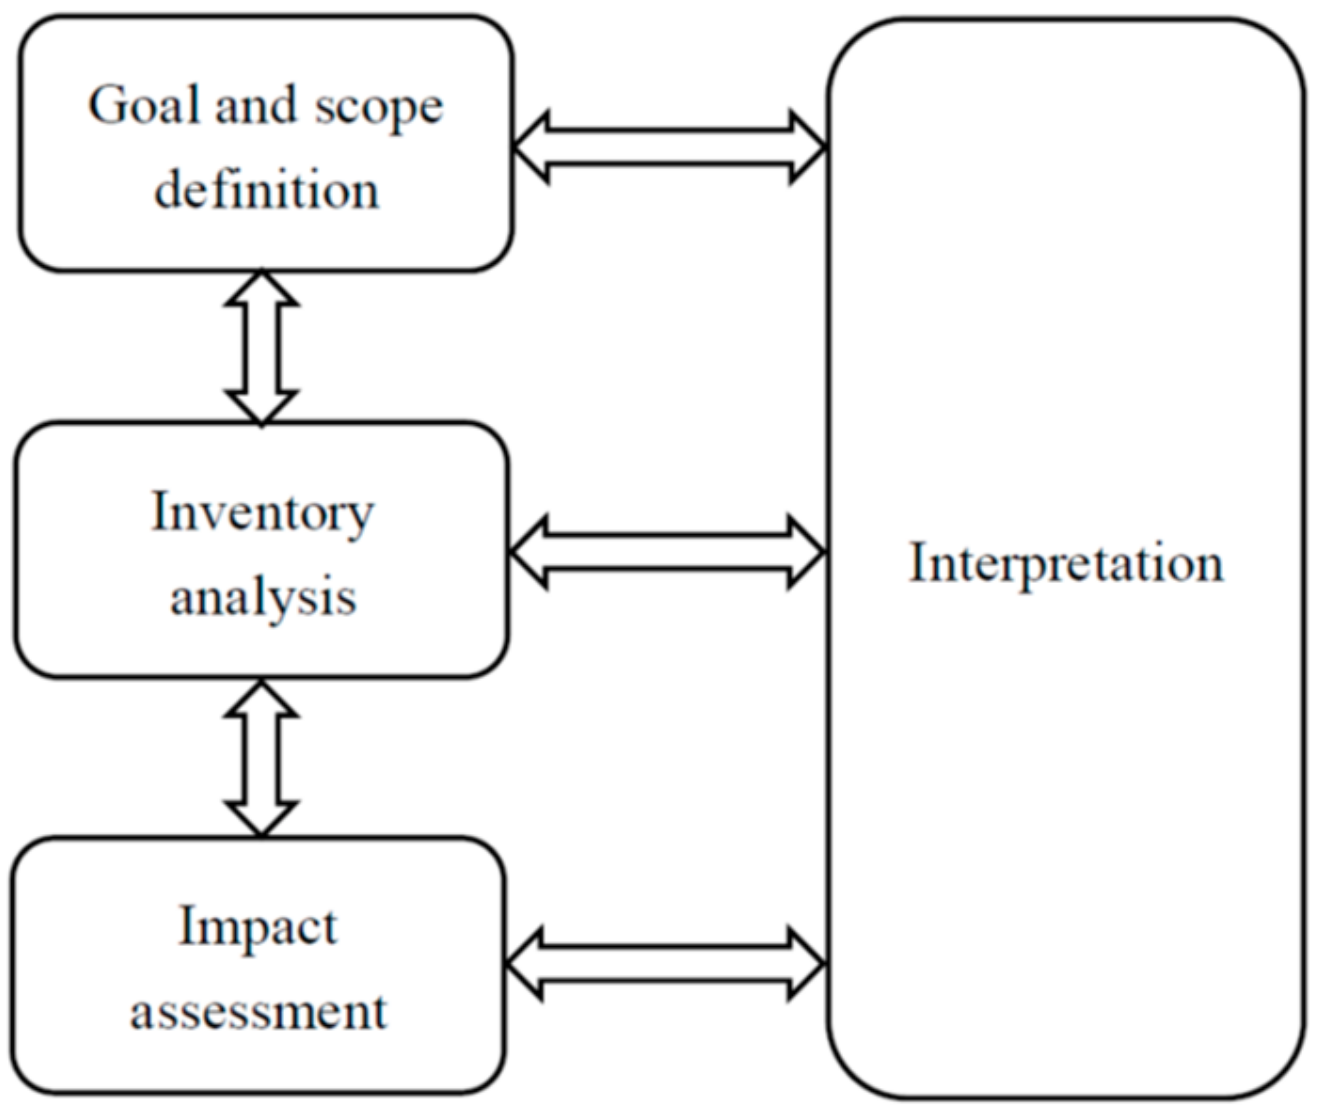
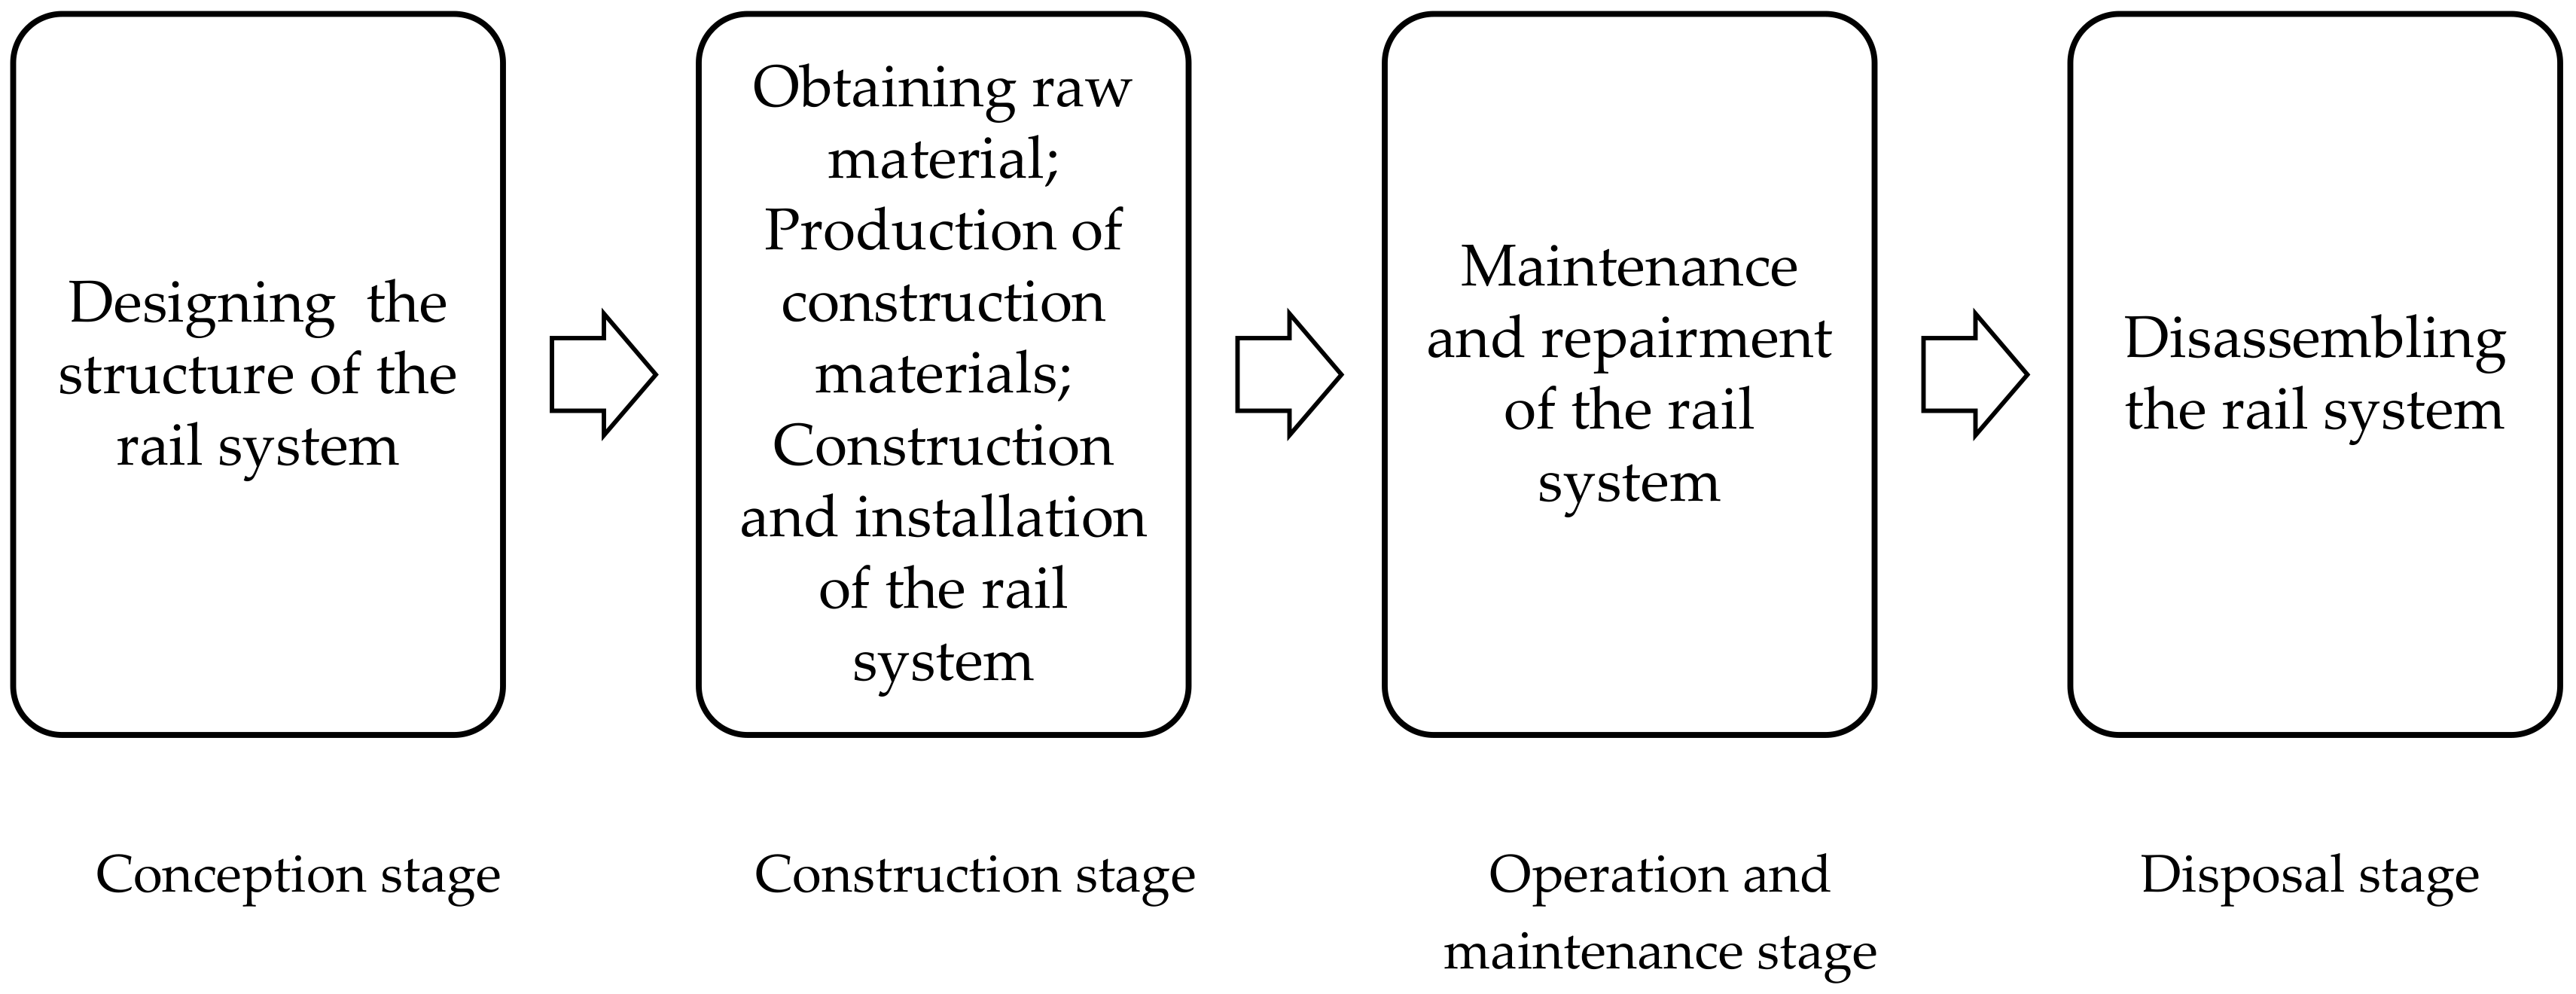
3.1. Life Cycle Assessment

Life cycle assessment is an environmental impact assessment of the product system from the time when it is established to the time it reaches the end of its lifecycle [22]. This means that it has been used to comprehensively evaluate the potential influences of a product on the environment in the whole process of raw materials acquisition, utilization of materials and disposal, aiming to identify the most important factors which affect the environment and find better solutions to protect the environment. The LCA is generally divided into four parts: goal and scope definition; life cycle inventory; life cycle impact assessment and interpretation [23], and they have been shown in Figure 2. The first element to be determined in the LCA is the research objects and corresponding system boundaries because they are the footholds and starting points for the follow-up life cycle inventory analysis, impact assessment and interpretation, which directly influence the final results of the LCA. Life cycle inventory analysis is the process of collecting all required data for the specific purpose of research. On the other hand, the life cycle impact assessment is a comprehensive evaluation of the environmental impacts on the products based on the various emissions and energy consumption data obtained from inventories or calculations. Interpretation is the final step to combine results from former three stages to identify the possibility of reducing hazards to the environment.
The research objective of this paper is to analyse and compare the carbon emissions and energy consumption of the rail system, which only includes the structure of the track and the earthwork of the Beijing-Shanghai HSR. In this paper it is assumed that the structures of the track and earthwork are single in the whole rail line, which means that only a CRTS II ballastless track and at-grade foundation are applied to the whole rail system. The system boundary includes four stages which have been shown in Figure 3: conception stage, construction stage, operation and maintenance stage, and disposal stage. According to the China Railway Design Specification, it is assumed that the service life of the ballastless track structure is 50 years, and the earthwork has a service life of 100 years. Therefore, the life span of this rail system is 100 years which is the longer service life between the track and earthwork. This implies that the structure of the track needs to be rebuilt during the operation and maintenance stage.
As for the inventory, the conception stage of the Beijing-Shanghai HSR includes all official work before the start of construction. The main source of carbon emissions and energy consumption is electrical consumption. It is assumed that there are 50 workers required to design this HSR project for one year, and the electrical consumption per person a year is 1000 kWh [24] which is minimum demand of electricity per person. During the construction stage, carbon emissions and energy consumption are mainly from the production of construction materials and the use of large construction machineries [25,26,27,28]. Data inventory in the construction stage are shown in Table 1 and Table 2.
When analysing the operation and maintenance of the rail system, the vehicle operation is not considered because this study focuses on the structure of track and the earthwork only. For the structure of the track, carbon emissions and energy consumption at this stage are from the maintenance work of non-ballasted track, mainly including the replacement of the rail after a certain number of repairs and the reestablishment of the whole track structure at the end of its life cycle. Based on the experience of non-ballasted railways in Germany and Japan [29], the replacement period of the rail is 25 years. In addition, the main maintenance of the earthwork is to strengthen the protection structure of the slop every 50 years according to the Chinese Design Specification for the HSR. Therefore, the data in this stage could be referred to the inventory of the construction stage. Regarding the disposal stage, the disassembly process is equivalent to the inverse process of the construction stage, but it does not involve the use of building materials. Hence, energy consumption and carbon emissions in this phase could be calculated according to the engineering quantities of the construction stage when carbon emission and energy consumption of building materials are excluded [30].
The carbon emissions and energy consumption of the whole life cycle can be calculated based on the engineering quantities of each stage which have been mentioned above. From Table 1 and Table 2, it can be seen that 13 kinds of materials have been used in the construction of the track and there are seven kinds of construction equipment used which include six diesel-driven equipment and one drive equipment (CNC grinding machine). The energy consumption of the track could be calculated through (1):
E r = i = 1 13 e r R i r + e d η d j = 1 6 P r j T r j + e c P r k T r k
where E r indicates the total energy consumption of the track (J); e r is the energy consumption factor of various building materials (MJ/kg); R i r is the amount of building materials used to the construction of the track (kg); e d is the energy consumption coefficient of diesel (MJ/kg); η d   is the diesel engines efficiencies; P r j is the rated power of various diesel-driven construction equipment of the track (kW); T r j is the operating time of each diesel-driven construction equipment (h); e c is the energy consumption factor of the electric power (MJ/kWh); P r k is the rated power of electrically-driven construction equipment of the track (kW); and T r k is the operating time of electrically-driven construction equipment of the track (h).
Formula (2) shows how to calculate the carbon emissions of the track:
C r = i = 1 13 g i R i r + g d η d j = 1 6 P r j T r j + g c P r k T r k
where C r indicates the total carbon emissions of the whole track (kgCO2eq); g i is the carbon emission factor of different building materials (kgCO2eq/kg); g d is the carbon emission coefficient of diesel (kgCO2eq/kg); and g c is the carbon emission factor of the electric power (kgCO2eq/kWh).
As for the earthwork, it can also be seen from Table 1 and Table 2 that the construction of the earthwork used six kinds of building materials and five kinds of construction equipment, which are all diesel-driven equipment. Formulations of calculating the energy consumption and carbon emission for the earthwork are (3) and (4):
E e = i = 1 6 e i R i e + e d η d j = 1 5 P e j T e j
where E e means the total energy consumption of the earthwork (MJ); R i e is the amount of building materials used to the construction of the earthwork (kg); P e j is the rated power of different diesel-driven construction equipment applied to the construction of the earthwork (kW); and T e j is the operating time of these diesel-driven construction equipment (h).
C e = i = 1 6 g i R i e + g d η d j = 1 5 P e j T e j
where C e means the total carbon emissions of the earthwork (kgCO2eq). These four formulations could be applied to calculate carbon emissions and energy consumption of each stage. Carbon emission coefficient and energy consumption factor can be referred to the study of Ke et al. [31], Chappat and Bilal [32], Feng [33], World Steel Association [34], Yan and Crookes [35], and Liu et al. [36]. The final results are shown in Table 3.

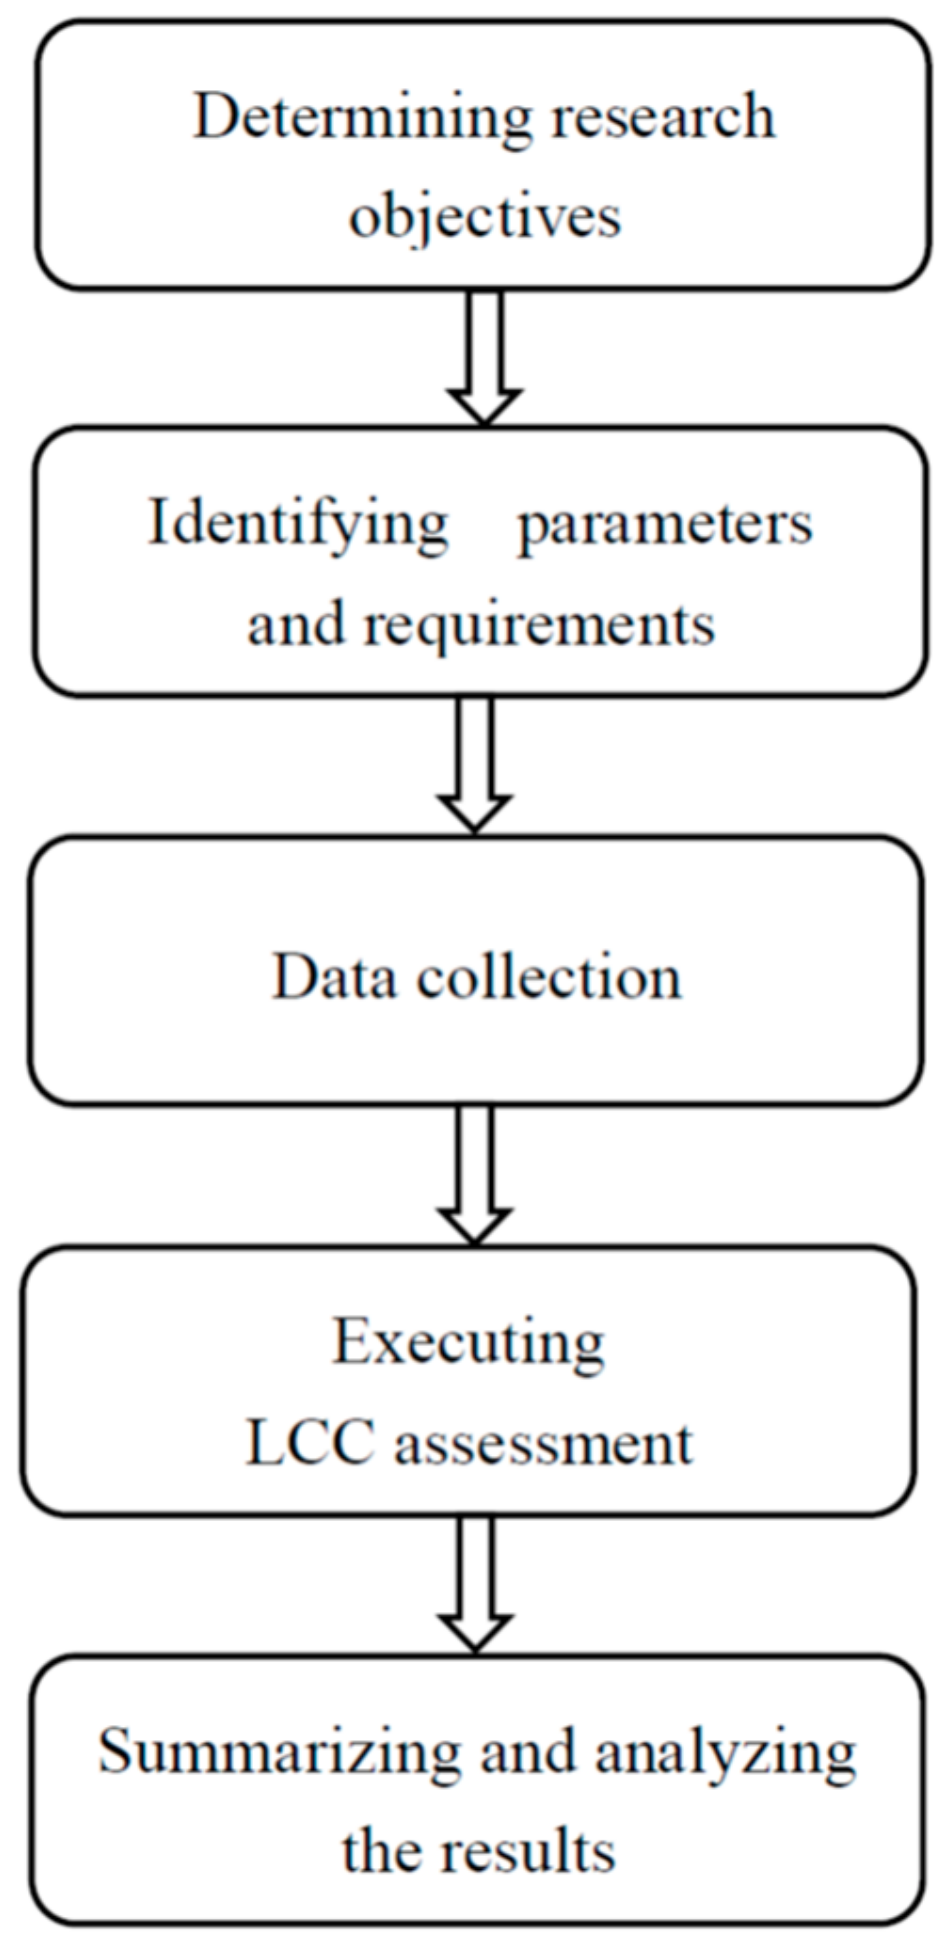
3.2. Life Cycle Cost

Life cycle cost (LCC) refers to the sum of all related costs and benefits of an asset (building, equipment engineering) or its components during the entire life cycle or a specific period of time. Analysing the LCC of a project involves evaluating the cost composition of the whole life span instead of calculating an overall result. This evaluation helps various stakeholders to have a clearer understanding of the cost composition of the research objects to achieve optimal decisions. The full life cycle cost analysis is generally divided into six steps which are shown in Figure 4 [37].
Another objective of this project is to analyse costs of the ballastless track and the earthwork of the Beijing-Shanghai HSR in 100 years. The cost could be divided into design cost, construction cost, operation and maintenance cost, and disposal cost according to its development stages. The design cost is the expense paid by design institutes during the conception stage. The construction cost mainly includes the money used to purchase building materials and the utilisation of construction equipment. According to previous analysis of construction costs of the track and the earthwork [25,37,38,39], construction costs of the track and the earthwork are US$844.16 million and US$3769.88 million respectively. During the operation and maintenance stage, the cost is mainly used to repair and rebuild the ballastless track and the earthwork to ensure their performances meet specifications. Since there are too many uncertain factors in the labor cost during this stage, such as different wages in the provinces through which the Beijing-Shanghai HSR passes, the labor cost is estimated by using the total cost. According to the European Commission, the labour cost is about 20% in addition to the total cost [40]. Therefore, the labor cost is estimated by this concept. The research by Ma [29] pointed out that the construction cost of the Japanese Shinkansen slab ballastless track in 1990 was about 1,417,580.12 US$/km, and the maintenance cost was 7170.21 US$/km. The construction cost of the French high-speed railway ballastless track was about 775,453.03 US$/km in 1997, and the cost of rail grinding was about 4985.06 US$/km. Based on these related data and ratios it is assumed that the maintenance cost of the track and the earthwork is US$13.54 million and US$3.75 million for each year respectively [5,41]. At the end of life span, the money spent on the disassembling of whole rail system is the disposal cost. According to the previous assumption which was mentioned above, the disposal cost is the construction cost excluding the material cost. When collecting data, it is also necessary to select appropriate financial parameters such as the discount rate. The discount rate in this paper is assumed to be 4%.
When calculating the cost items in the LCC analysis, all costs need to be converted to a specific time point because costs may occur at different time points or time periods. Hence, the net present value (NPV) method is applied to the cost calculation. NPV is the difference between the present value of cash inflows and cash outflows over a period of time, and the calculation formula is (5) [42]:
N P V = t = 0 n C I C O t 1 + i c t
where C I C O t is net inflow-outflows during a single period t; i c is the discount rate; and t is the number denoting period. However, when analyzing the life cycle cost of the rail system of the Beijing-Shanghai HSR, there are only cash outflows, and no cash inflows need to be calculated. Normally, outflows are considered as negative while inflows are considered as positive. In this paper, it is assumed that outflows are positive to be easier to understand, and the discount factor is 4%. Calculation results are shown in Table 4.

4. Results

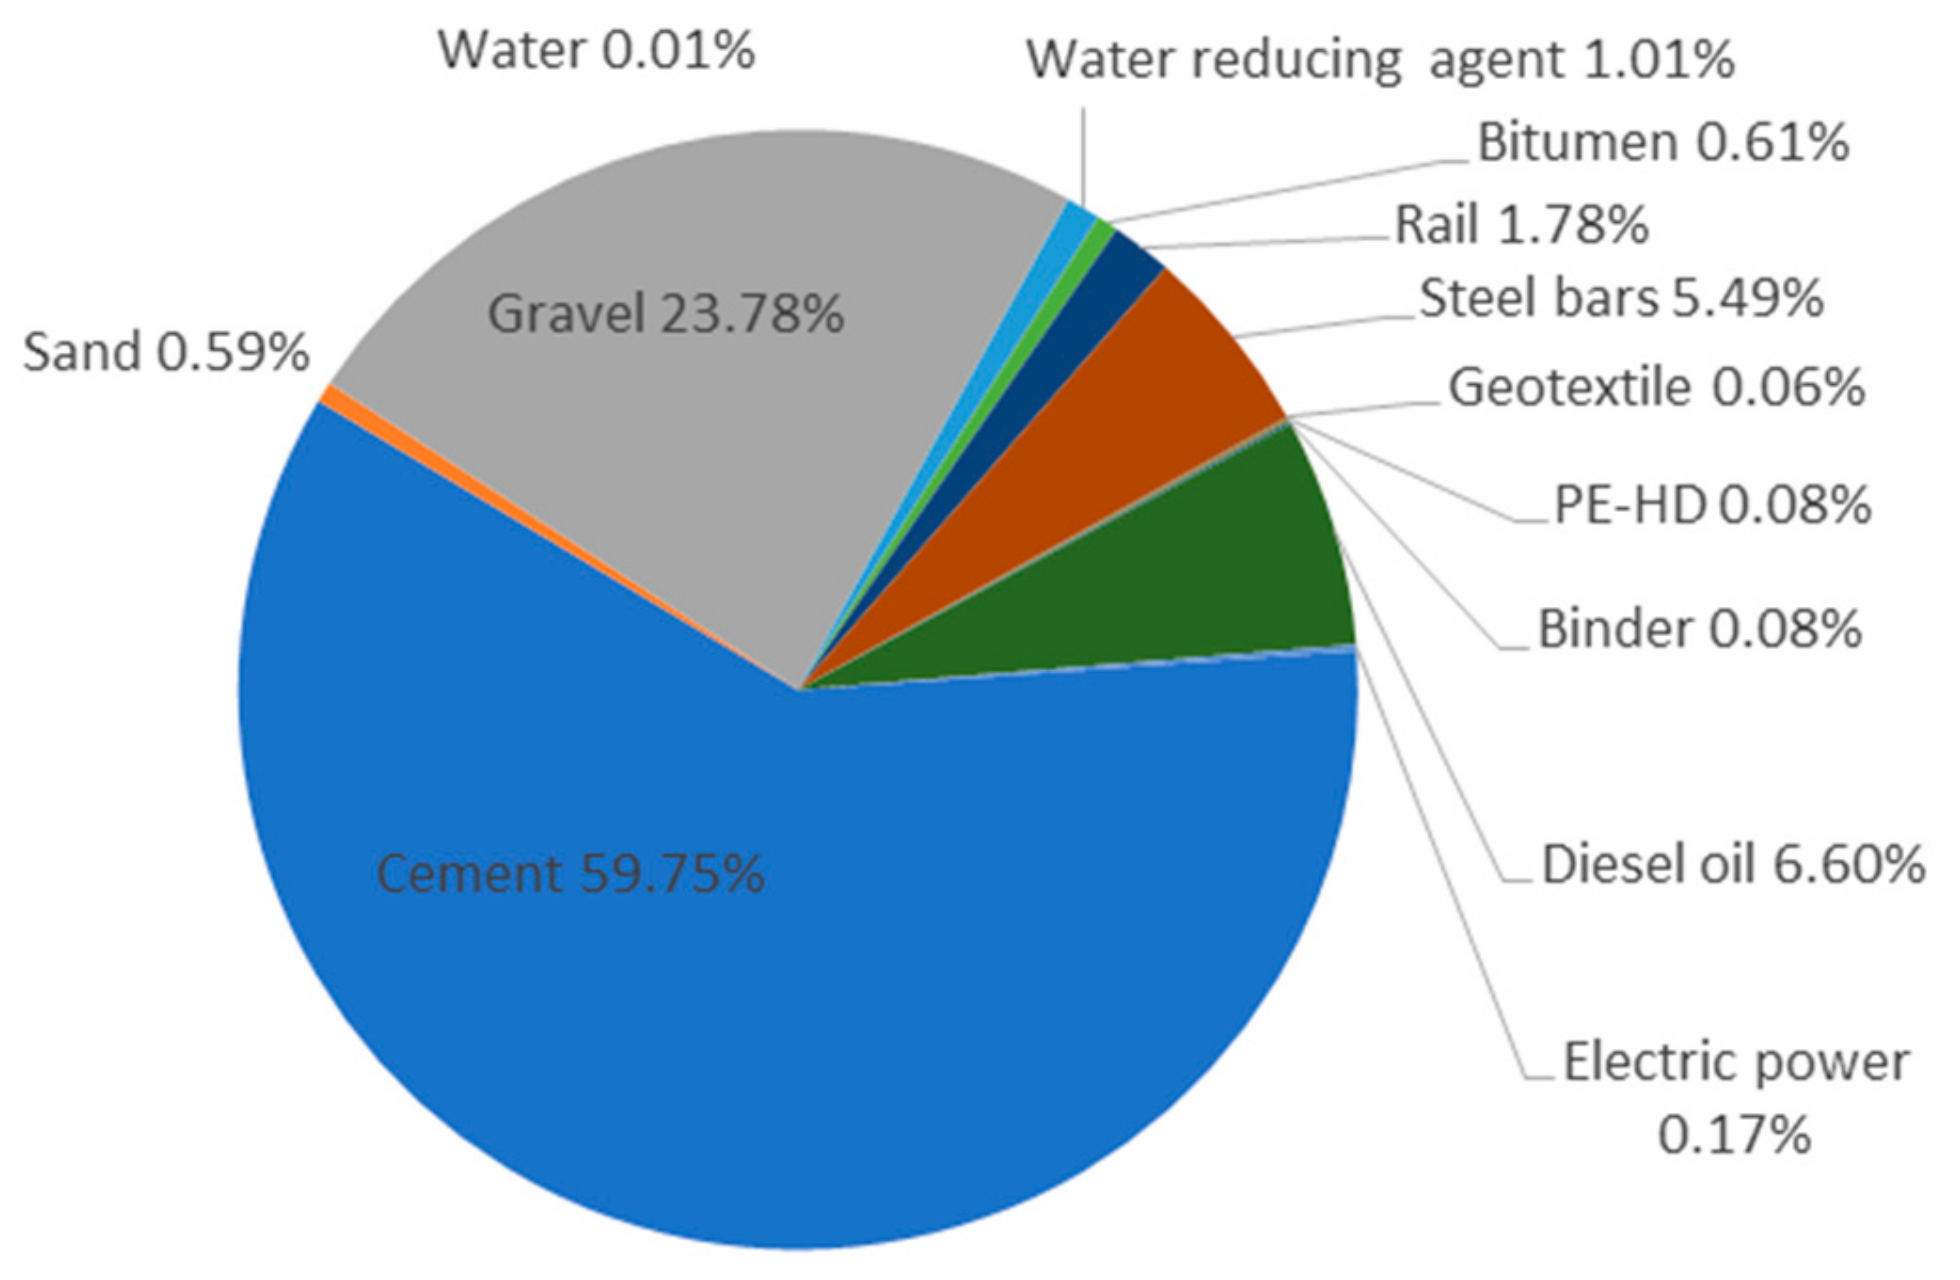
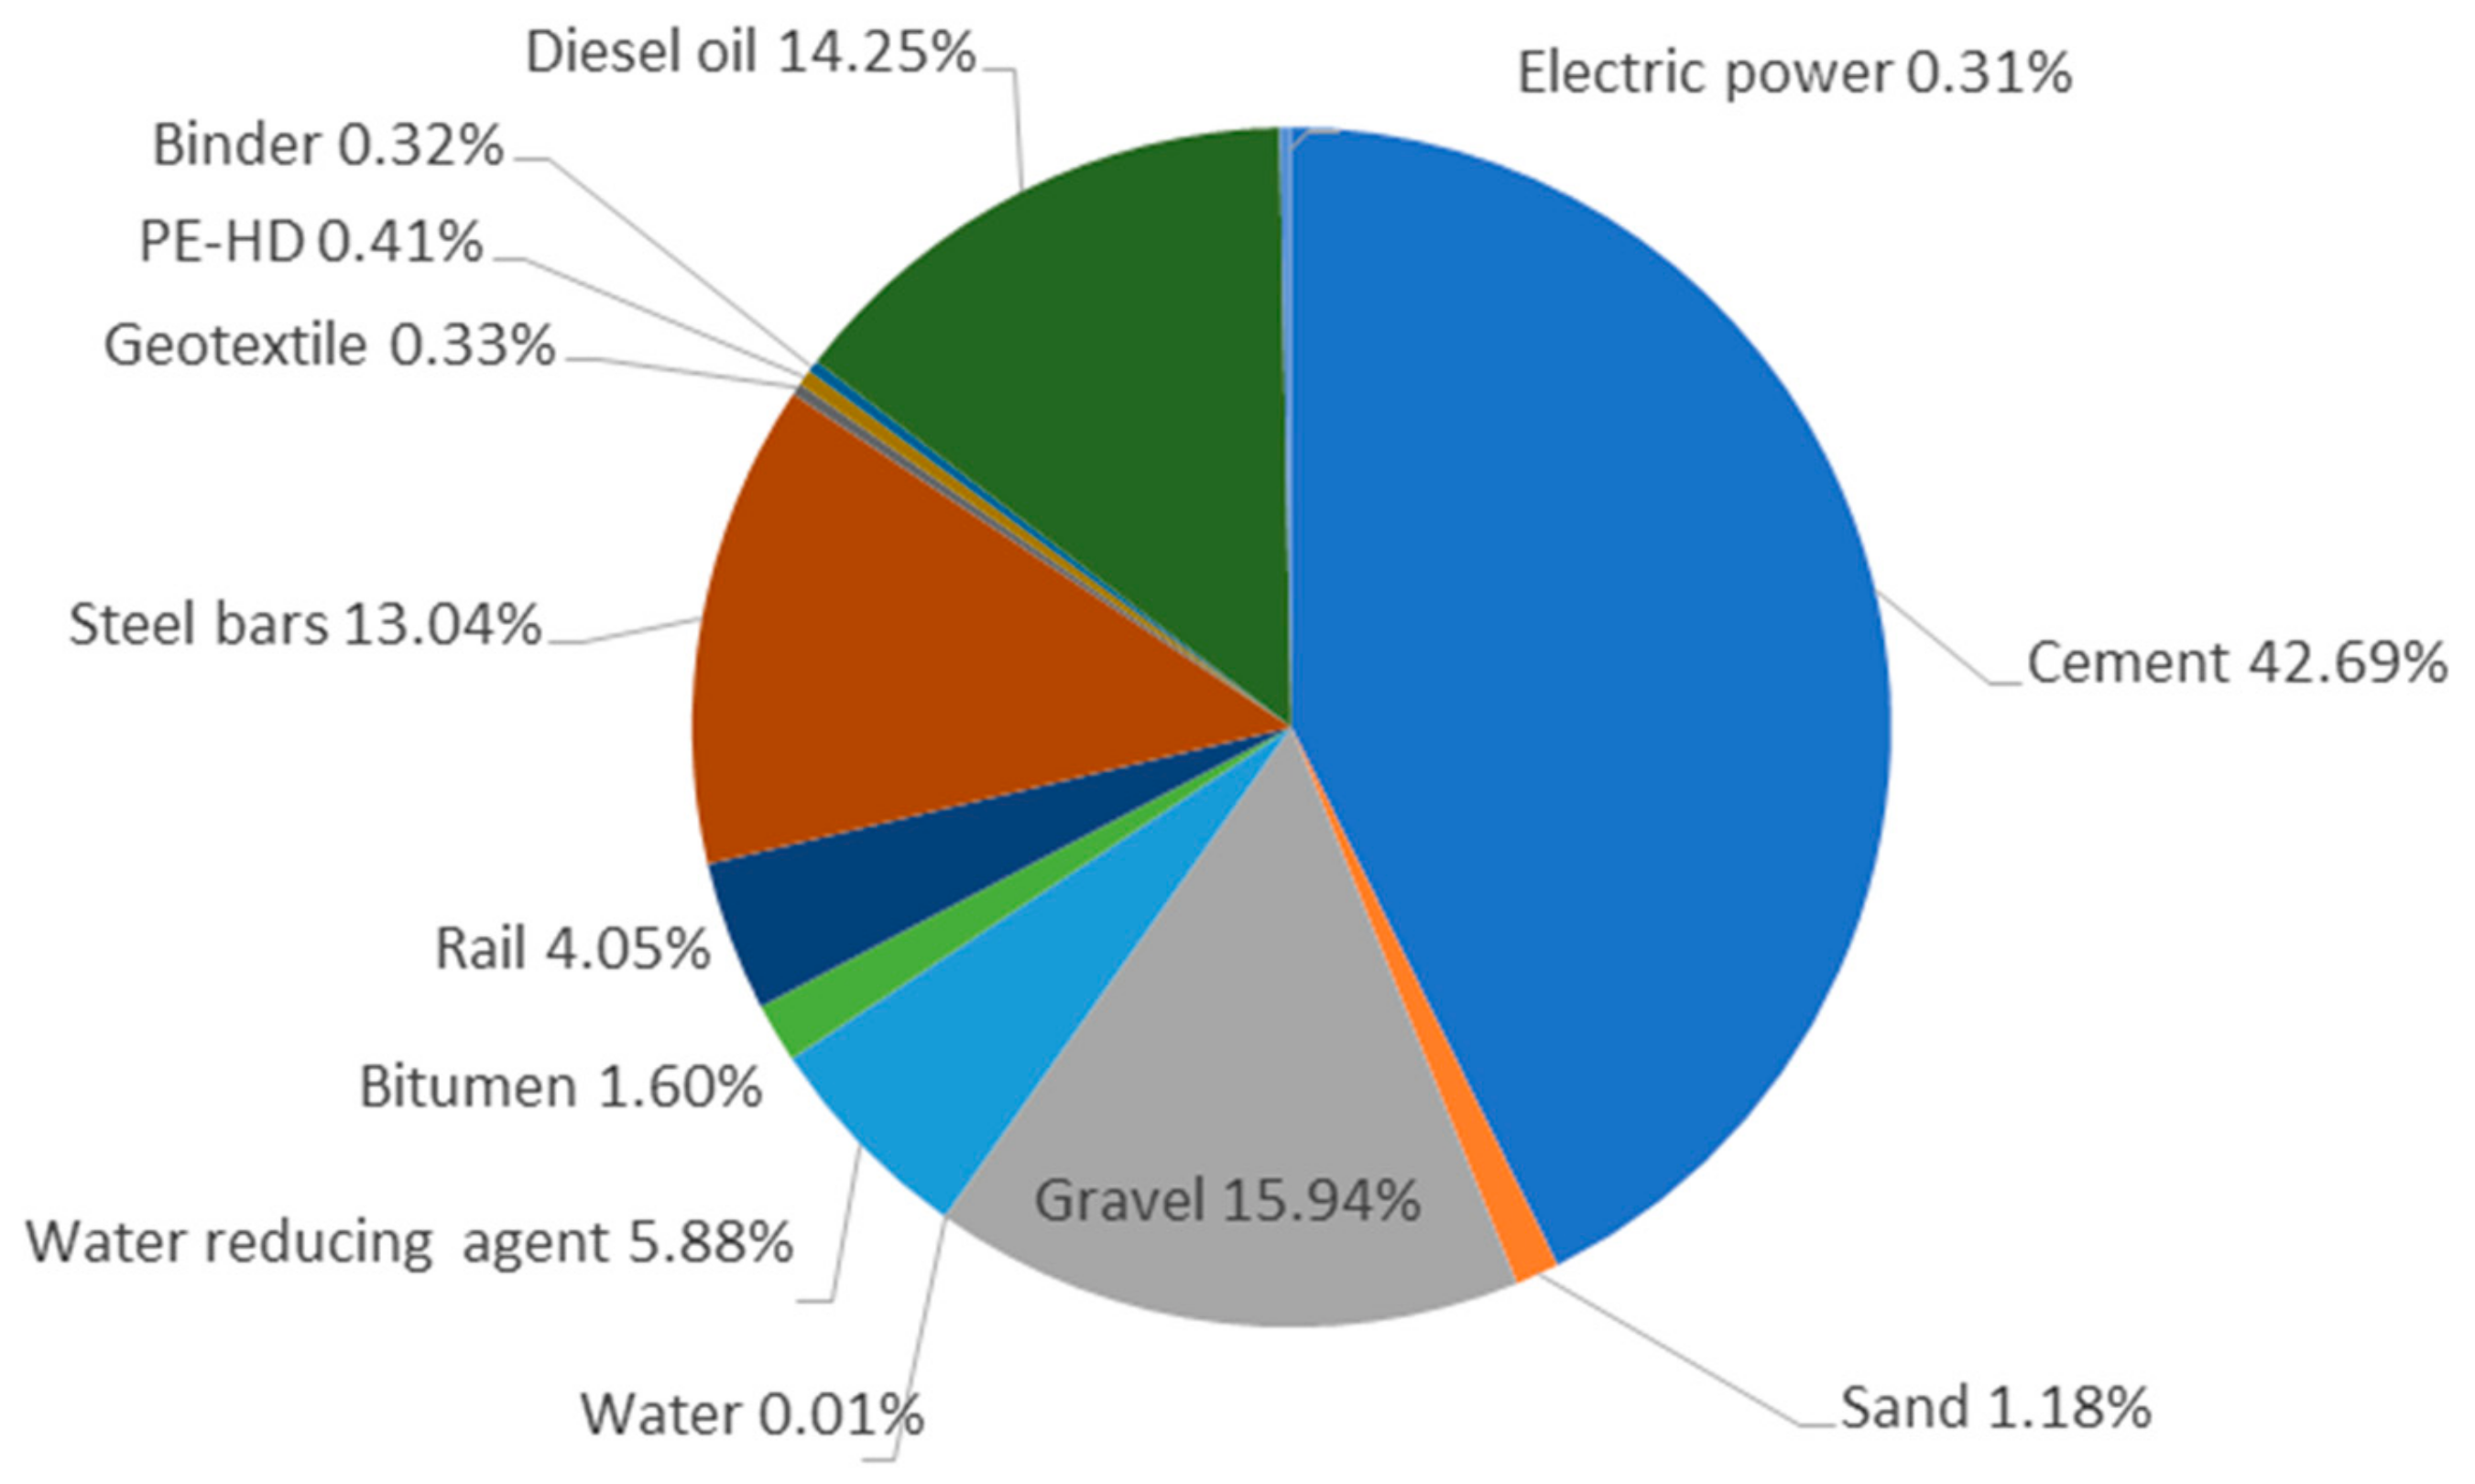
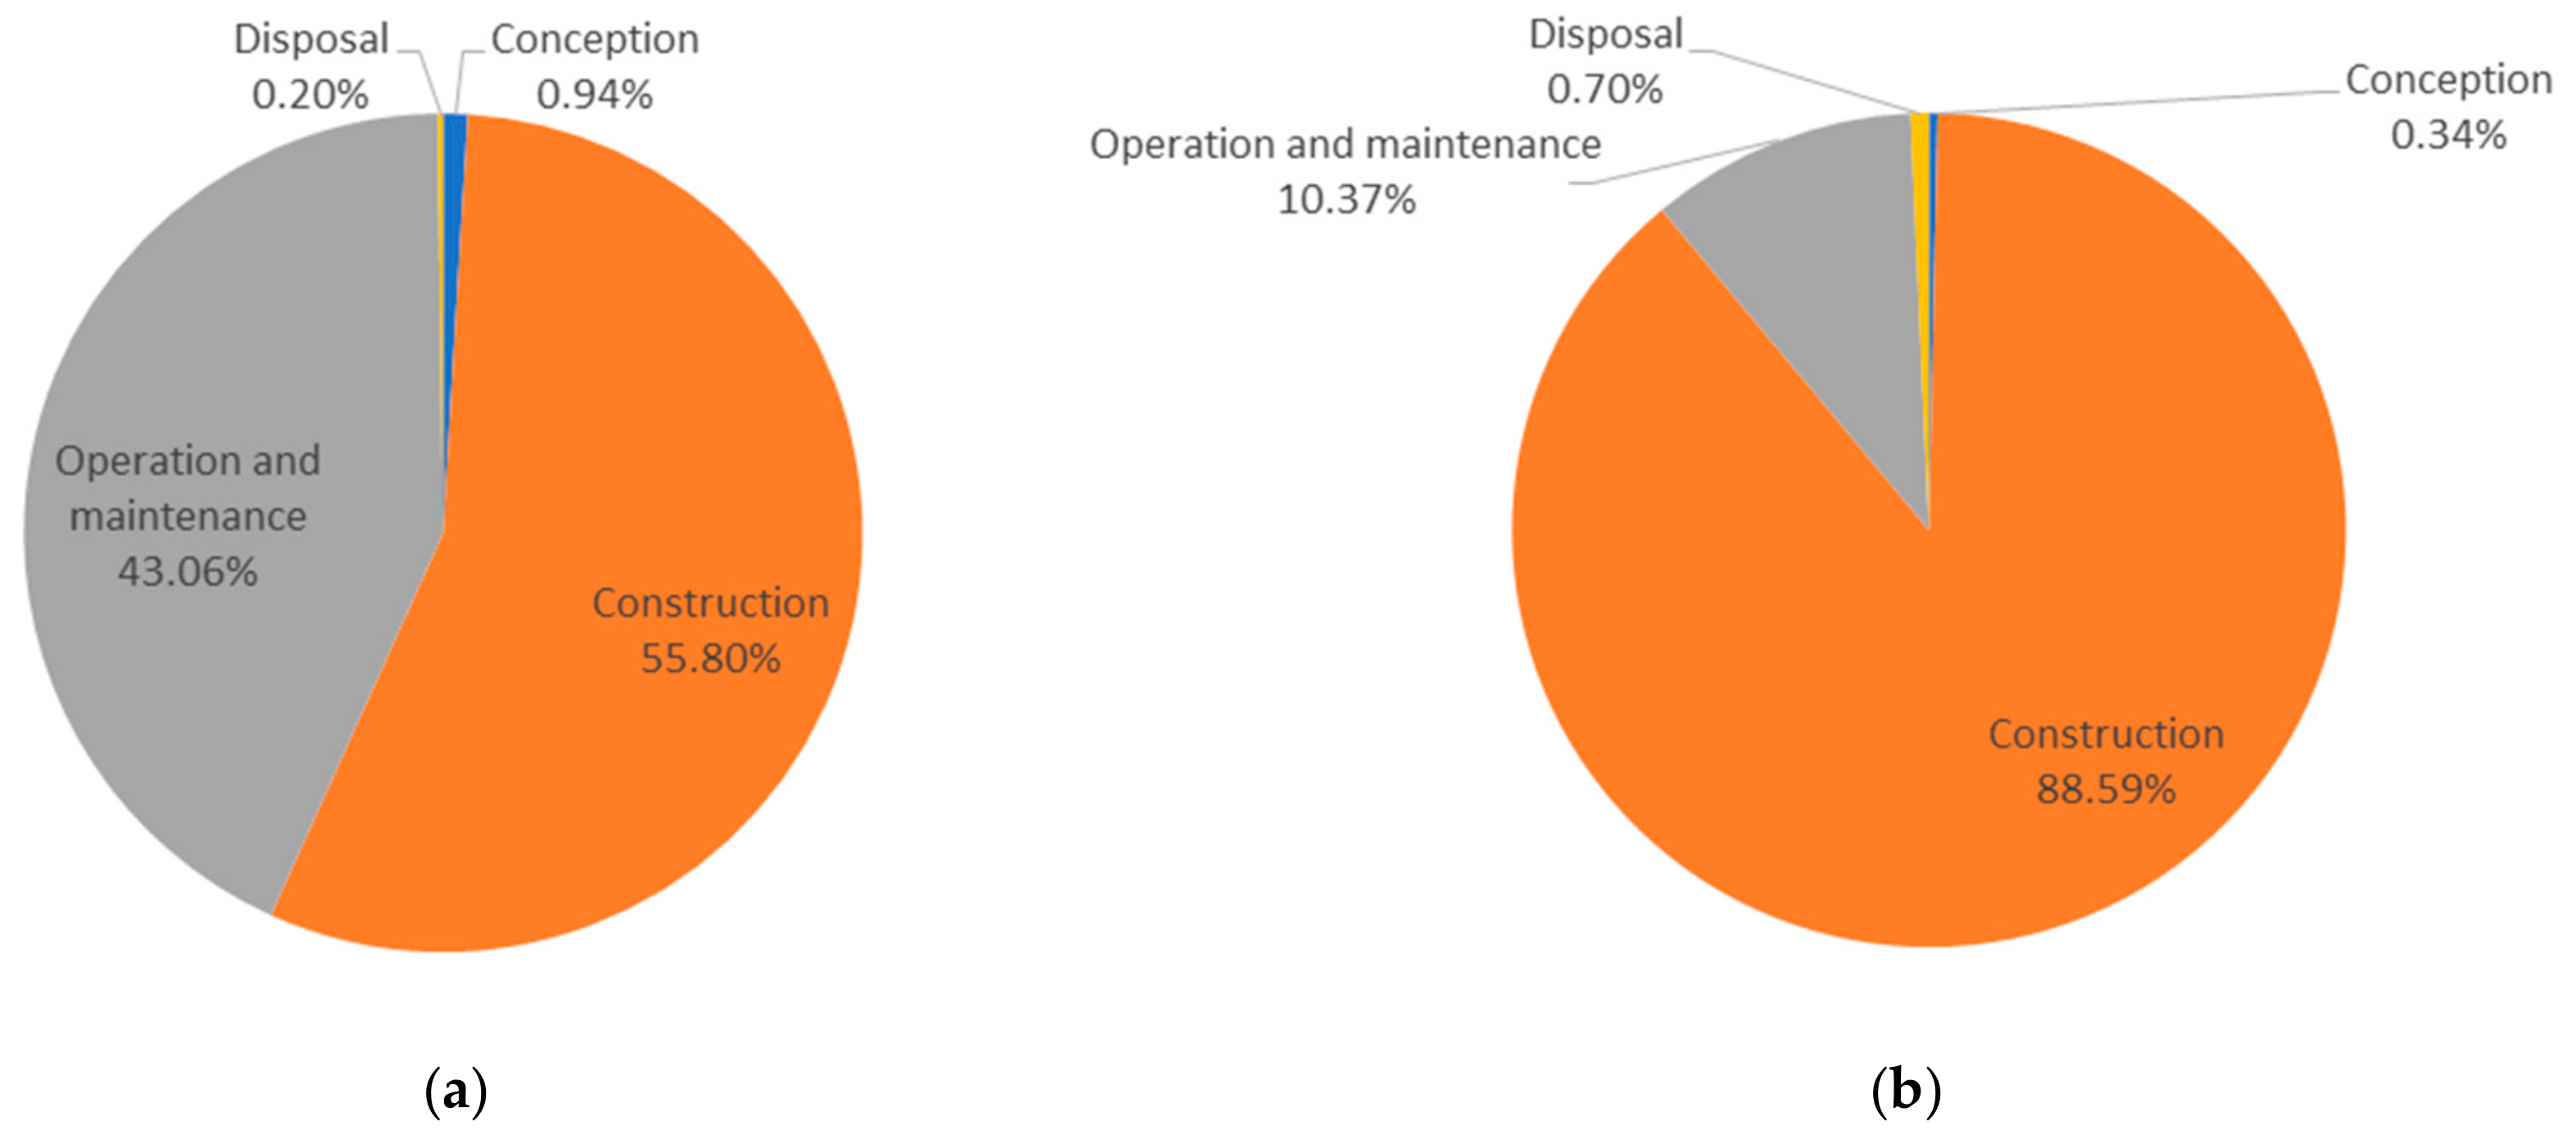
4.1. Results of Life Cycle Assessment

Table 3 and Figure 5 show the carbon emission and percentages during four stages of the track, earthwork, and the entire rail system respectively. For the structure of the track, the operation and maintenance stage contributes to 53.88% of the carbon emissions, while the construction stage contributes to 44.60%. However, the construction stage has the largest proportion of carbon emissions for the earthwork and the entire rail system, with 71.28% and 64.86% respectively. This stage is followed by the operation and maintenance stage, accounting for 24.55% and 31.60% respectively. The conception stage has the lowest proportion of carbon emissions for the track, the earthwork, and the whole rail system, which are less than 1%. The proportions of the carbon emissions during the disposal stage of the track, earthwork and the whole rail system are 0.56%, 3.87% and 3.07% respectively. From Figure 5, the operation and maintenance stage mainly contributes to carbon emission for the track structure while the construction stage is the main stage producing carbon for the earthwork and the entire project. This finding is conformed to the study by Seo et al. who said the construction stage generated most carbon during the project life cycle [43]. Because of a big proportion of carbon emissions from the construction of earthwork, the construction stage plays the main role in the carbon emission of the entire rail system. From Table 1, it is clear that the earthwork requires a lot of material compared to the track structure. This is the main source of carbon emission in the HSR project.
Figure 6 shows the carbon emissions of various materials during the construction stage. It should be noticed that carbon emissions of diesel oil and electric power equal to the amount of carbon emitted from construction machineries. The rest of carbon emissions are from building materials. As shown in the Figure 6, the proportion of the carbon emitted from construction machineries is only 6.77% (the sum of 6.60% and 0.17%) because diesel and electricity are sources of carbon for machineries, which means that the amount of carbon emitted from building materials accounts for the highest proportion in the construction stage. However, the construction needs a high amount of building material and these material produce a big amount of carbon during the productions. Among all building materials, carbon emissions from cement account for nearly 60% of the total carbon emissions, followed by gravel (23.78%), steel bar (5.49%), rail (1.78%) and a water reducing agent (1.01%). The proportions of rest building materials are less than 1%. Therefore, it can be seen that the amount of building material is relatively high when compared with fuels which consist of diesel and electricity. Therefore, building material play a more important role in carbon emissions than machineries.
Figure 7 show the energy consumption percentages during four stages of the track, earthwork as well as the entire rail system, and the situation is much similar to that of the carbon emissions. This means that the construction stage has the largest proportions of energy consumption on the earthwork (60.60%) and the entire rail system (54.31%), while the amount of energy consumed by the track during the operation and maintenance stage (55.71%) is little higher than that during the construction stage (42.29%). The proportions of the energy consumption during the disposal stage of the track, earthwork and the whole rail system are 0.98%, 14.21% and 9.67% respectively. The conception stage still consumes less than 1% of the total energy. The same concept as the carbon emission is applied to the energy consumption. During the construction of earthwork, a lot of material is required to complete the earthwork and these material consume a lot of energy during the production process. At the same time, during the operation and maintenance stage of earthwork, the required material is less than the construction stage and the machineries also less required than the construction stage so the construction consumes more energy than the operation and maintenance stage and the entire rail system also has the same trend. However, for the track structure, the material required in the construction stage is not as high as earthwork but the maintenance is done regularly during the operation and maintenance stage. Therefore, the operation and maintenance stage of the track structure play the most important role in energy consumption which different from earthwork and the entire rail system.
Figure 8 shows the energy consumption of different materials during the construction stage. In the same manner as the carbon emissions, the energy consumption of construction machineries is the sum of energy consumed by diesel oil and electric power (14.56%). From the figure it is clear that the percentage of energy consumption from building materials is the highest compared to that of construction machineries. The amount of energy consumed by cement is highest, accounting for 42.69% of the total energy. Gravel and steel bar have the similar proportions of the energy consumption, which are 15.94% and 13.04% respectively. This demonstrates that the building material production play more important role than energy used during the construction stage in term of the energy consumption. This is consistent with the results of the study done by Seo et al. who found that concrete during the material production was the main source of carbon emission rather than during the construction stage. However, earthwork was the main source of the carbon emission during the construction stage and higher than other sources. Carbon emission from other materials were also consistent with this study [43].

4.2. Results of Life Cycle Cost

Table 4 and Figure 9 show the cost and proportions of the costs of the track, earthwork and the whole rail system in four stages after discount calculation respectively. From these figures, it can be seen that the construction stage contributes 55.80%; 88.59%; and 79.99% of the total costs of the track, earthwork and the entire rail system respectively, followed by the operation and maintenance cost at 43.06%; 10.37%; and 18.94% respectively. The conception cost and the disposal cost account for nearly 1% or less than 1% of the total costs. This is because during the construction stage, the major resources of the project are required such as labor, machine, and material while the operation and maintenance stage requires less resources. Therefore, most of the cost in the project takes place in the construction stage.

5. Discussion

5.1. Results Analysis and Recommendation

According to the life cycle assessment it can be seen that for the entire rail system, carbon emissions mainly come from the construction stage. However, for the track structure the carbon emissions from the operation and maintenance stage are slightly higher than that from the construction stage. At the same time, the construction stage also leads to the highest amount of energy consumption for the whole rail system. During the construction stage, carbon emissions and energy consumption from building materials are more than those of construction machineries. With regards to the cost, the construction cost is highest compared to costs from other three stages through LCC assessment.
It can be noted from the above analysis that the construction stage and the operation and maintenance stage have significant impacts on the environment and costs. Hence, there are some suggestions and improvement measures proposed for the construction and maintenance of the HSR. The first suggestion is to improve production technologies, which includes materials production technologies and construction technologies. From the analysis in Section 4 it has been shown that cement, gravel, and steel are important building materials which significantly affect the energy consumption and carbon emissions of HSR. From Section 4, these three main materials contribute almost 90% to carbon emissions during the construction stage or almost 60% (carbon emissions during the construction stage is 64.86% of the whole project as in Section 4) of the life cycle of the project. At the same time, these three main materials contribute to more than 70% of the energy consumption during the construction stage or about 56% of the life cycle of the project. Therefore, improving the material production process to reduce energy consumption as well as carbon emissions is a direct means to control harmful effects on the environment. For example, ground granulated blast furnace slag (GGBS) could be used to replace conventional Portland cement which could not only reduce carbon emissions and energy consumption but also improve the durability of the concrete [44] because cement is the main component creating carbon emissions and energy consumption. At the same time, minimizing the use of high-emission materials and conserving the use of building materials are effective ways to reduce construction costs and carbon emissions. Recycled materials and construction waste management are also alternatives to reduce the carbon emissions from building materials from material use optimization. Another suggestion is to choose construction machinery rationally. In the HSR construction process, some large-scale machineries such as bulldozers and excavators are used frequently due to a large amount of construction work quantities. Therefore, some machineries with relatively low energy consumption should be used as much as possible to reduce the fuel consumption and electric power consumption. At the same time, for the operation and maintenance stage, carbon emission and energy consumption also mainly take place in this phase. The main contributor for the carbon emission and energy consumption is machinery used in the operation and maintenance phase. The better performance and energy-saving machine can be used to minimize carbon emission and energy consumption. However, diesel or other fossil fuel are still the main fuel for these machinery because diesel also accounts for carbon emission and energy consumption. From the study, diesel generates 6.6% of carbon emission during the construction stage or 3.6% during the project life cycle. At the same time, diesel generated energy consumption of 14.2% during the construction stage or 11.4% during the project life cycle. Therefore, the development of a new machine with clean energy is the better option to minimize the negative effect to the environment. For example, the development of a hydrogen machine or fuel cell vehicle including the integration of renewable energy and construction machine. From these solutions, carbon emissions can be decreased.

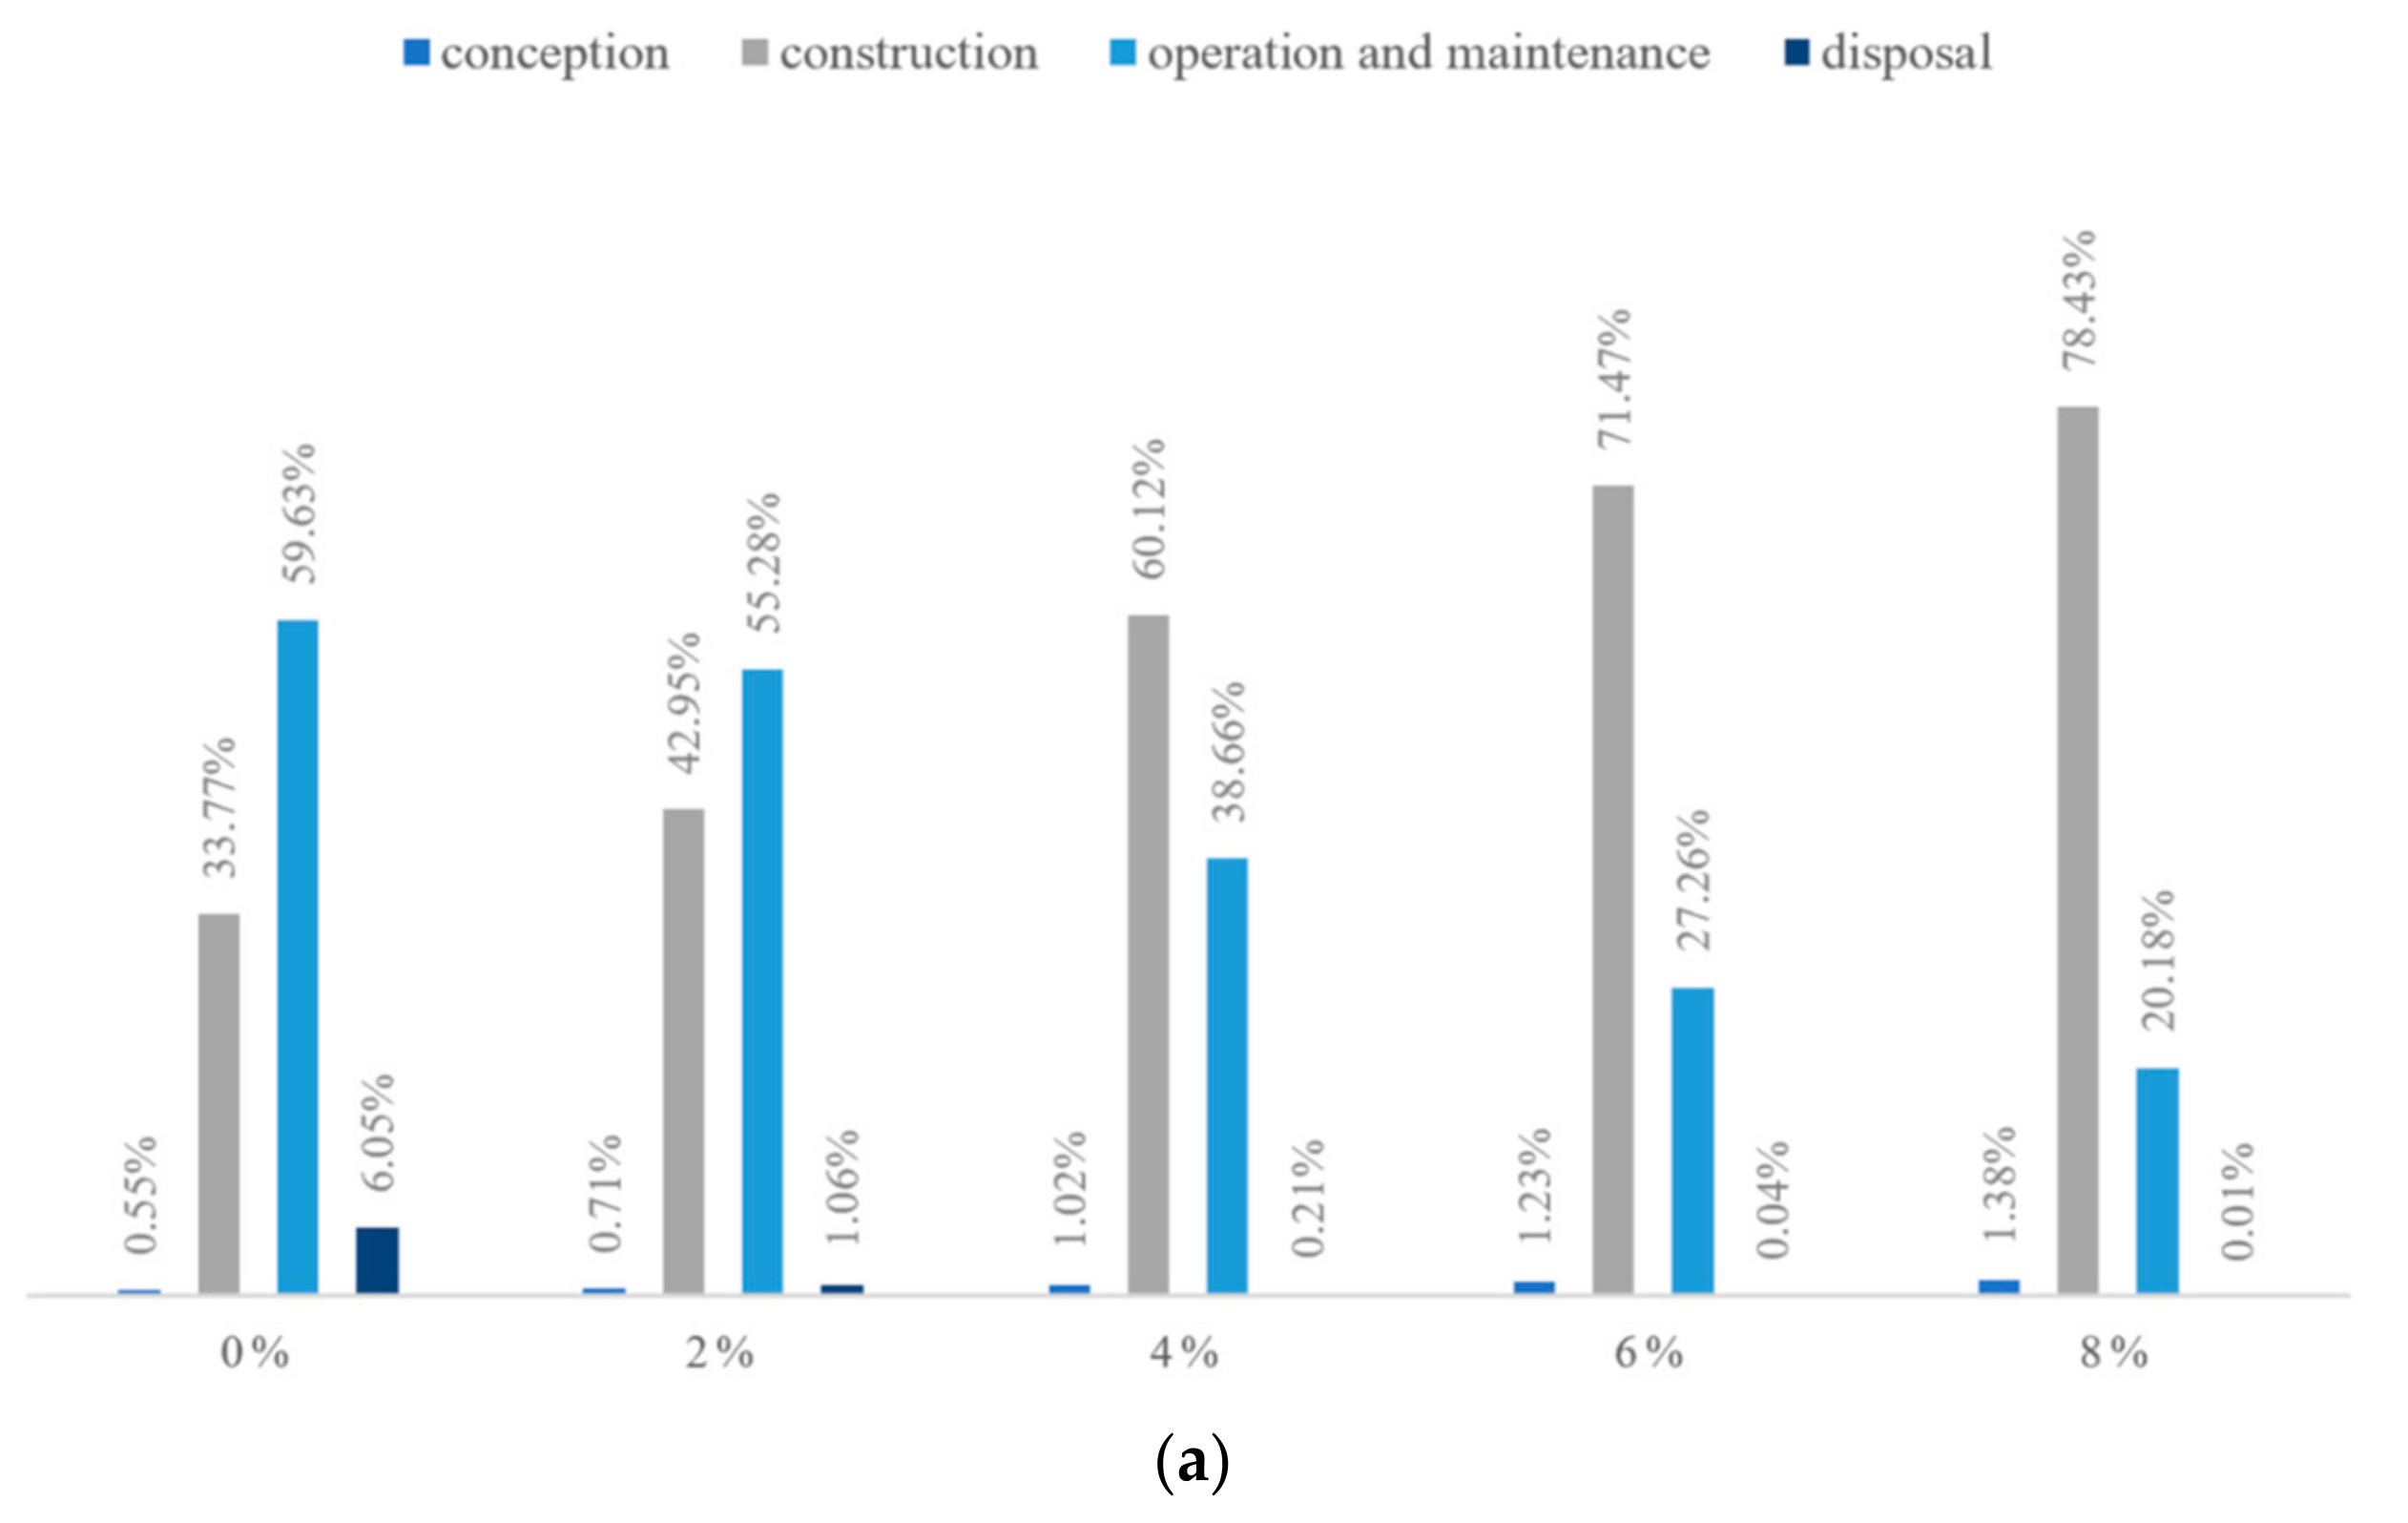
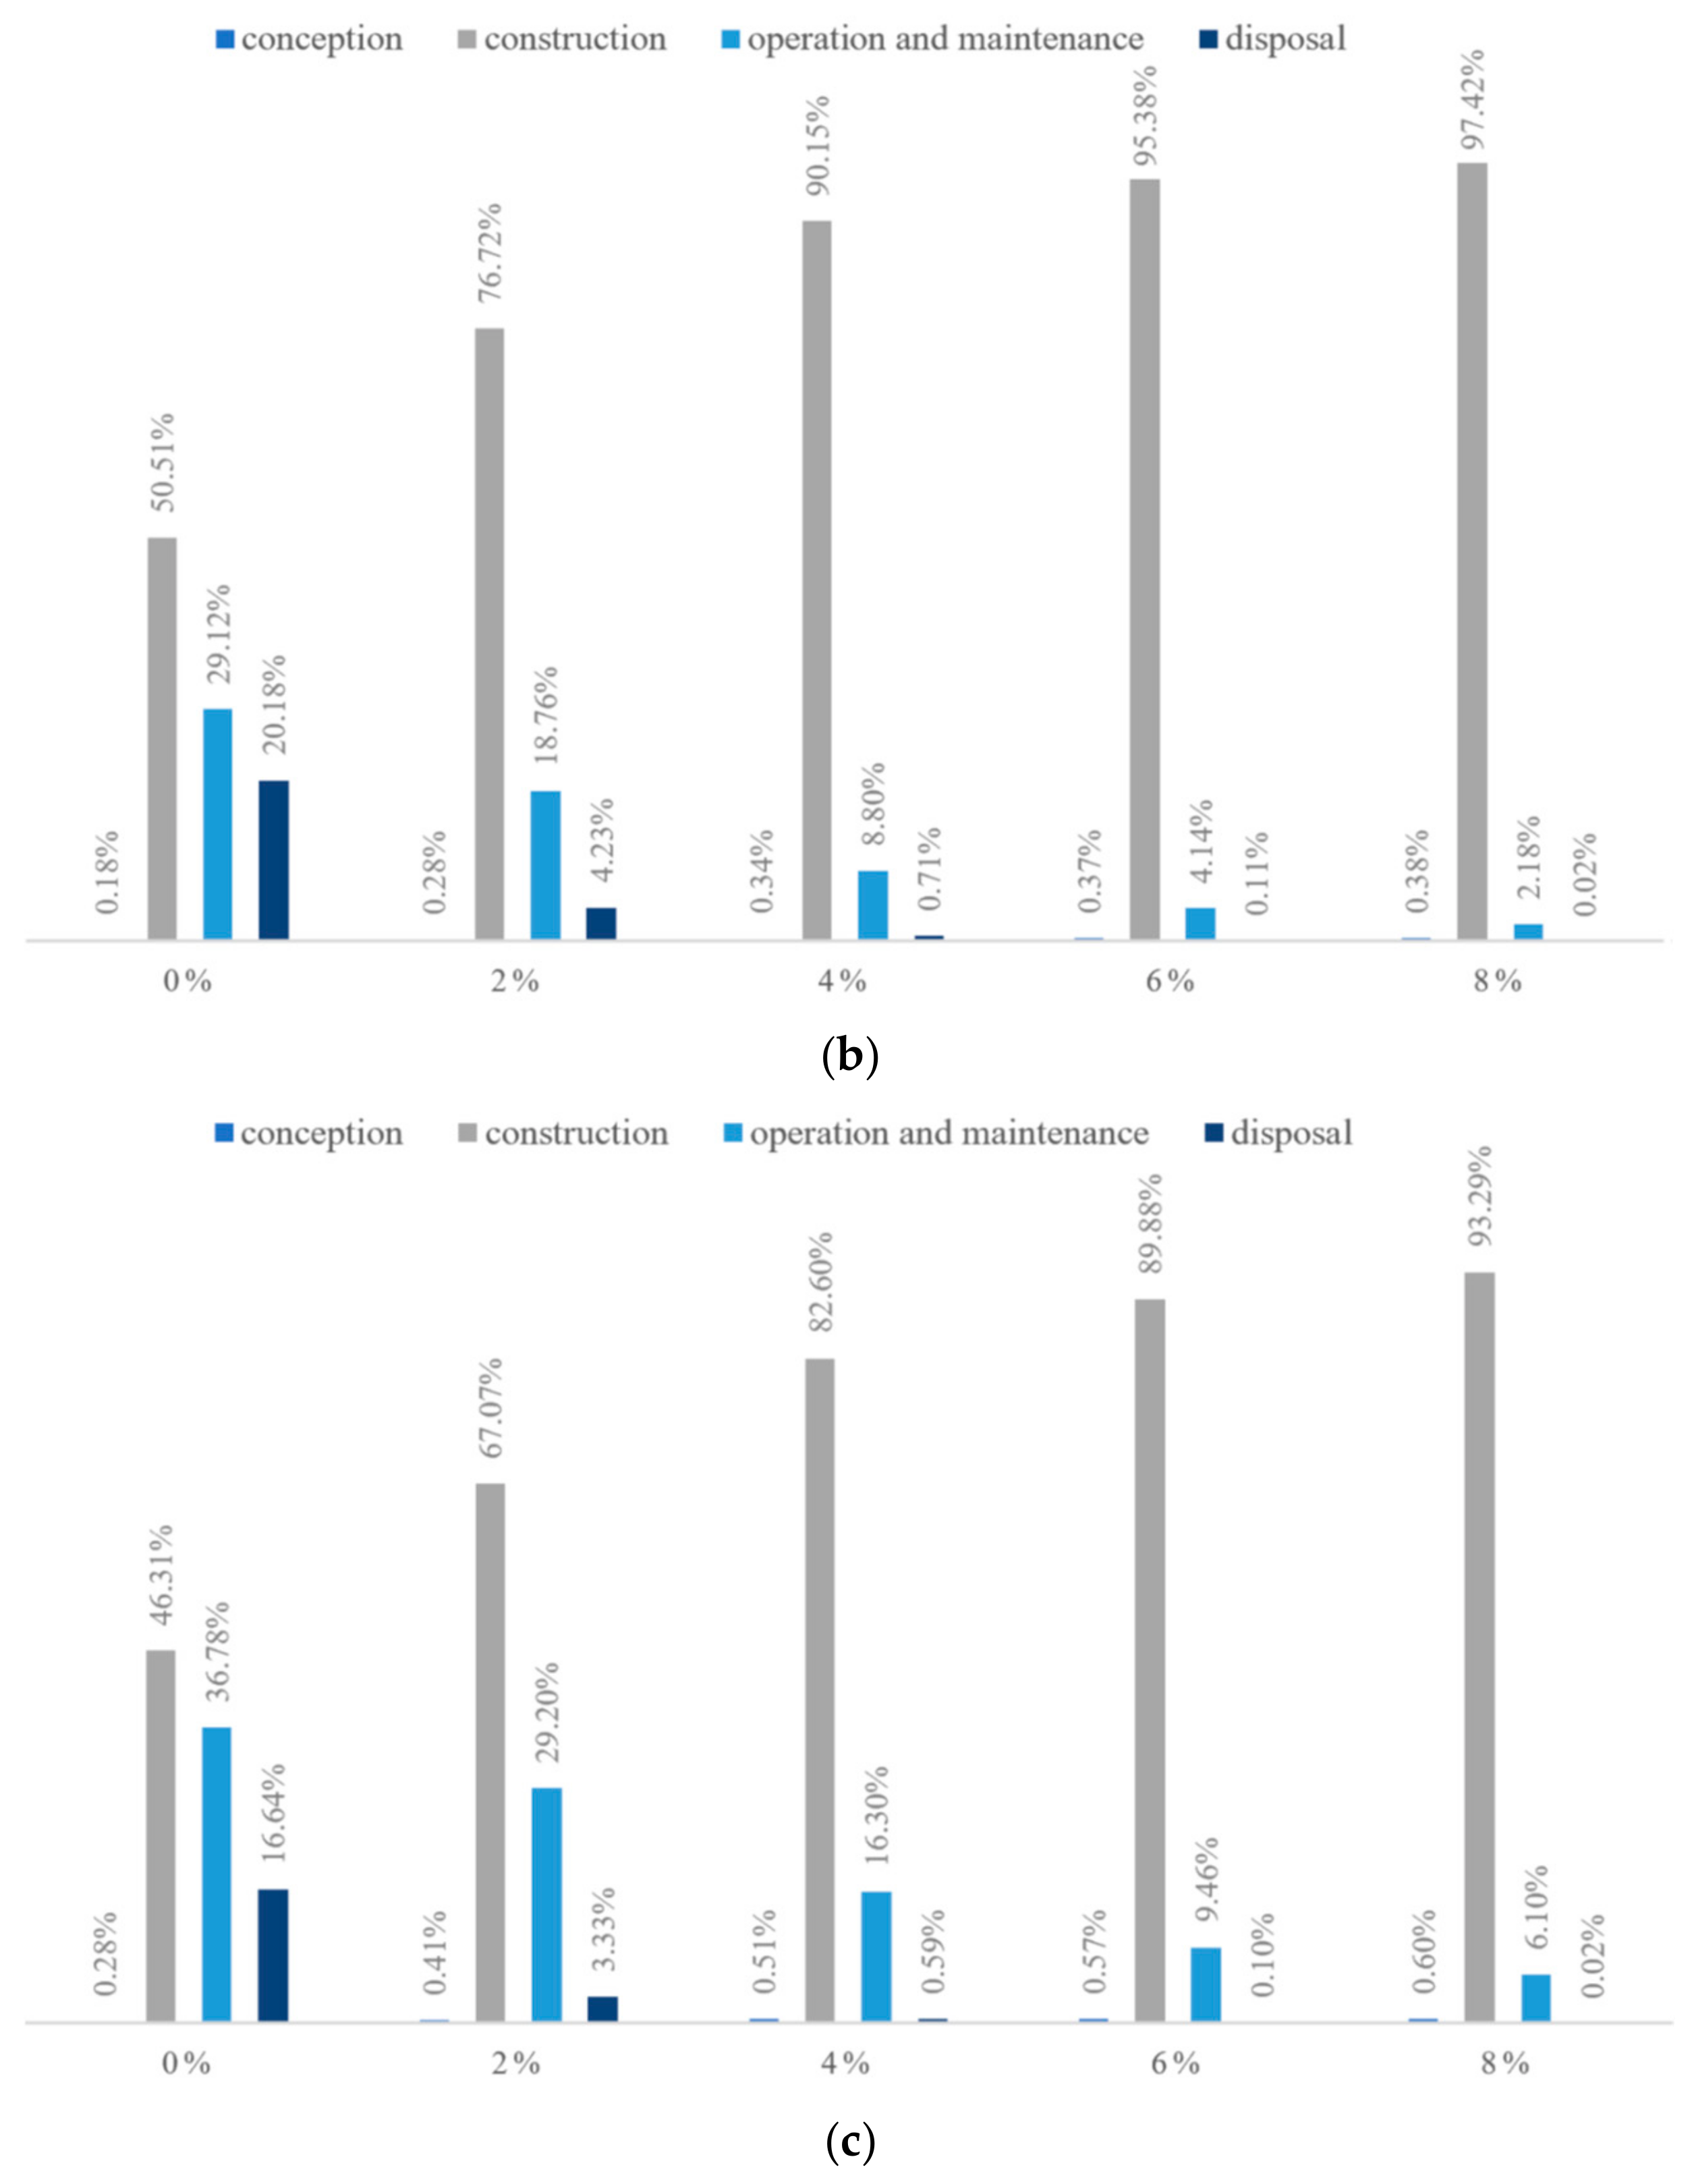
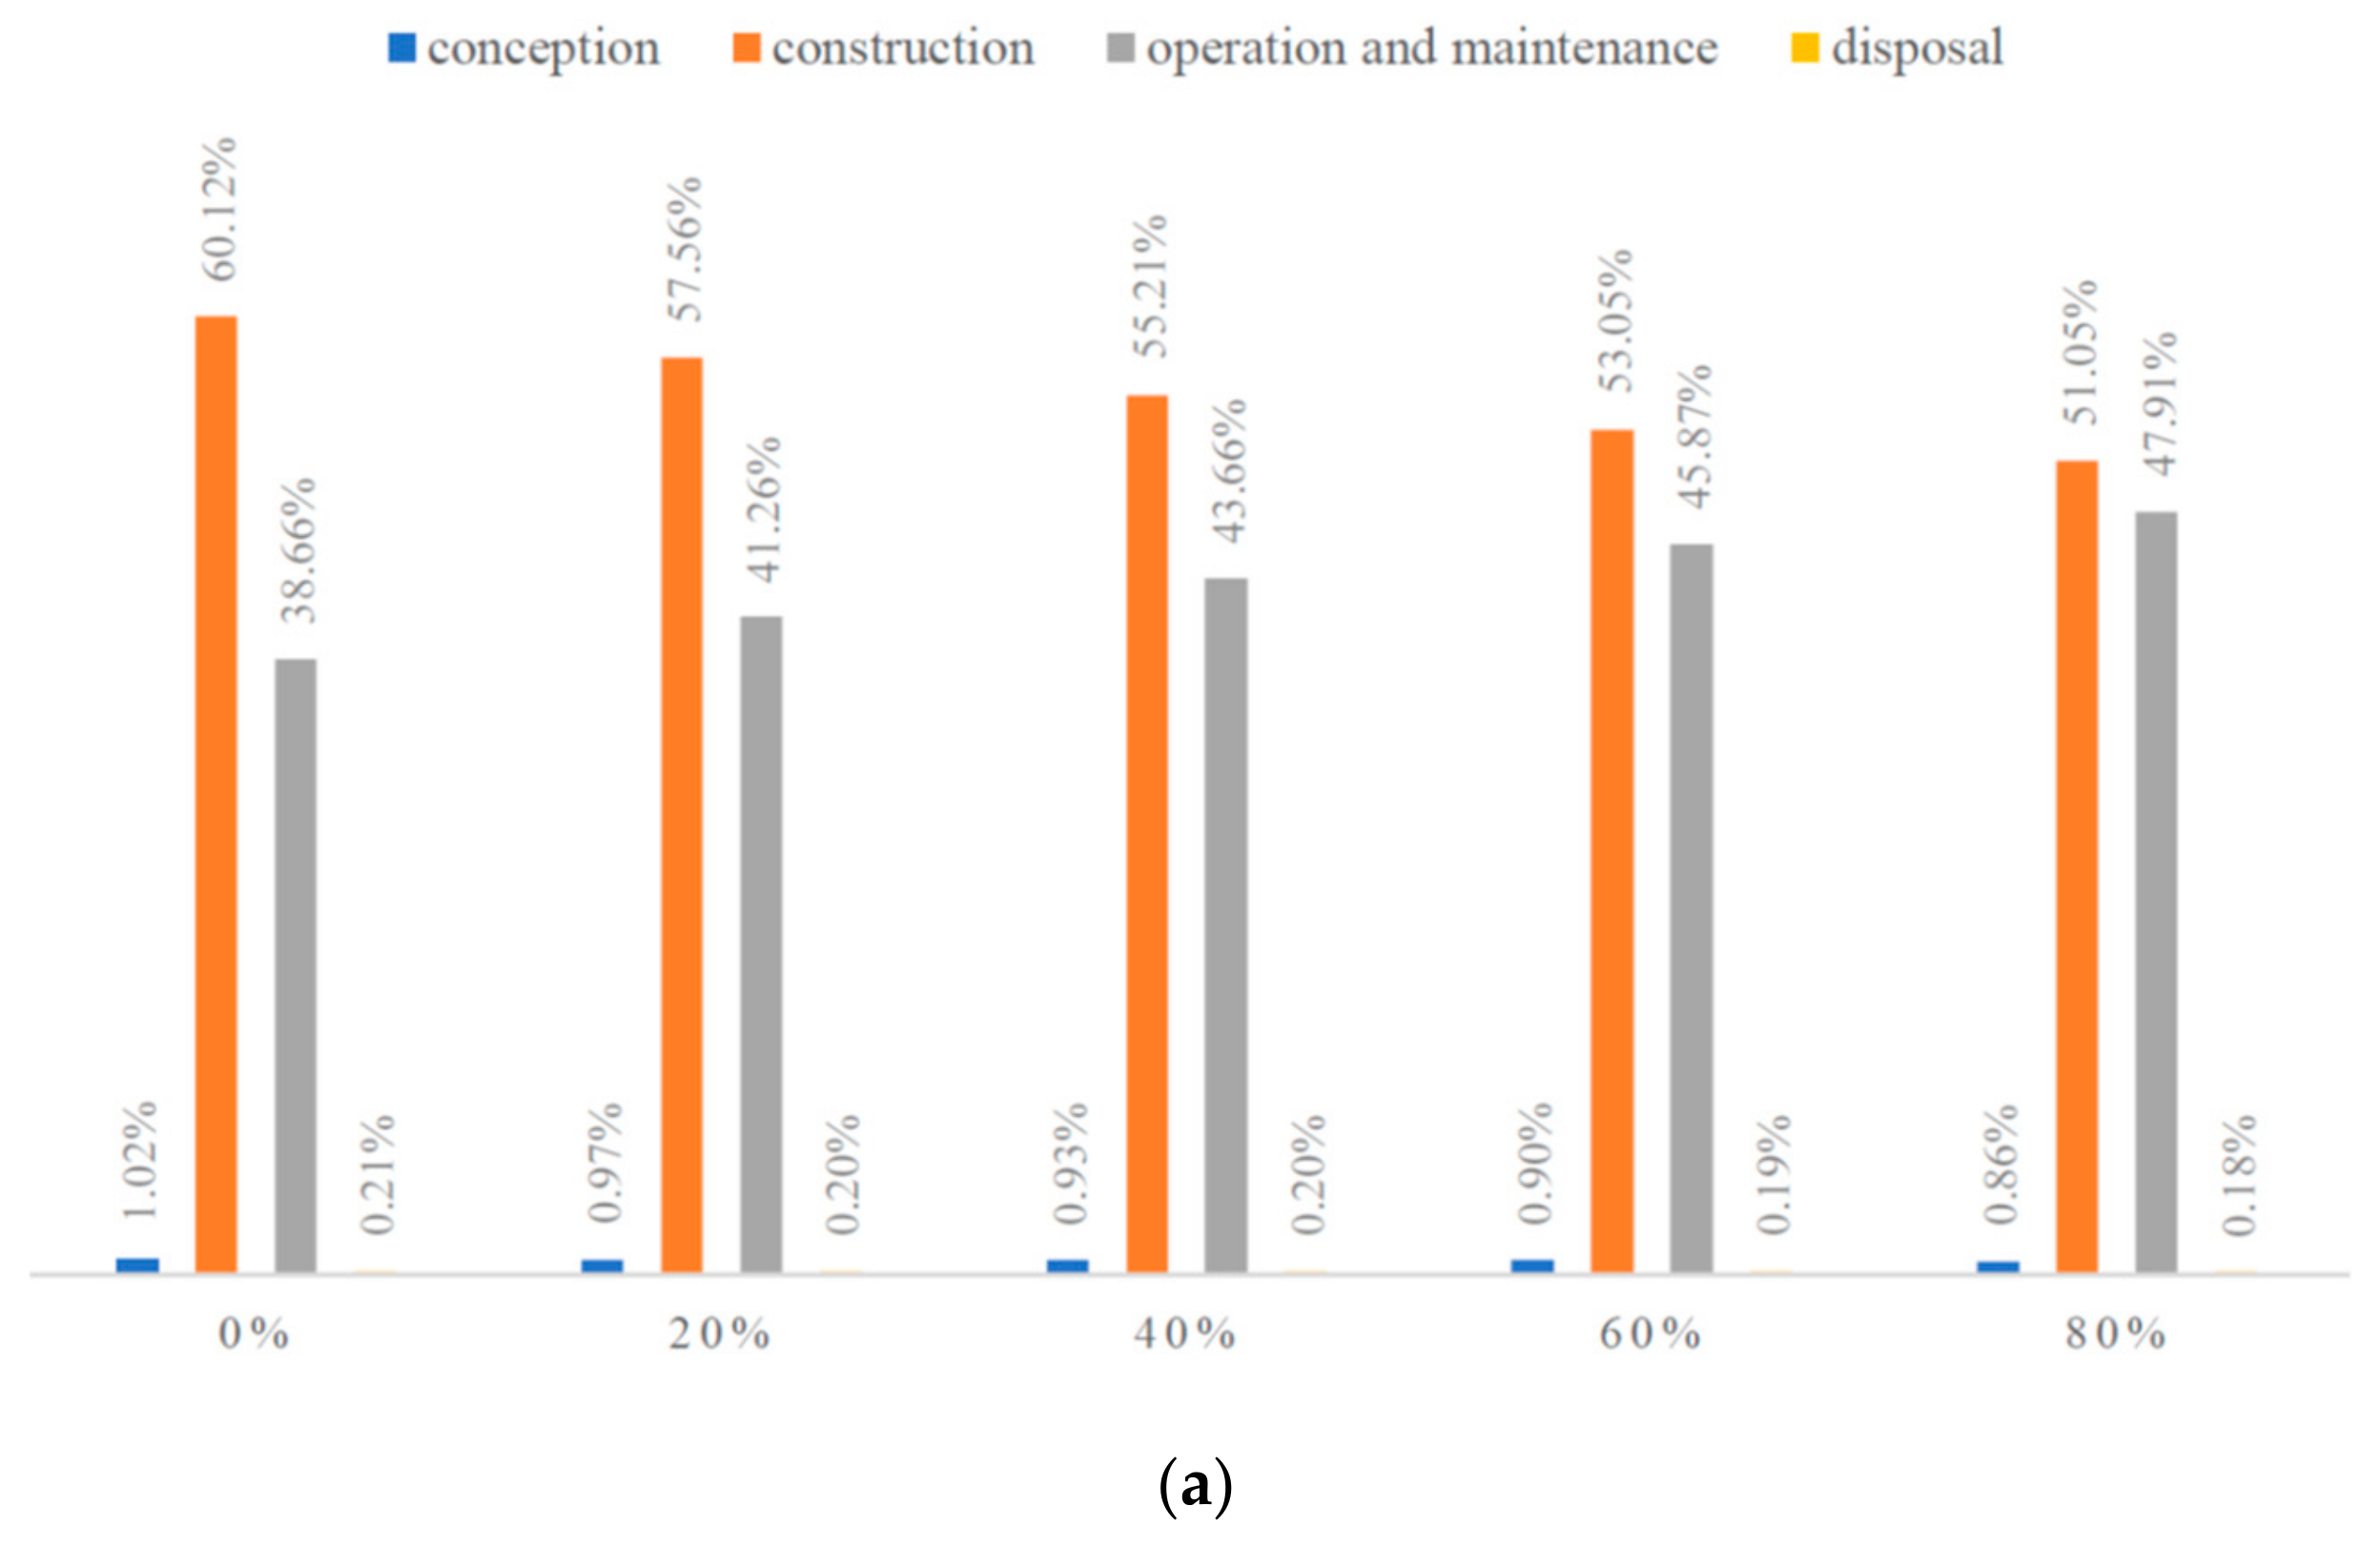
5.2. Sensitive Analysis

Many basic data used in LCC analysis are derived from estimates which are unlikely to be fully consistent with the actual situation in the future, making the final conclusion uncertain or even wrong. Therefore, sensitive analysis is needed to determine the impact of changes in various external conditions on the final economic outcomes. According to previous literature [5], the social discount rate of transportation projects is about 2% to 8%, while the LCC analysis conclusion is based on a discount rate of 4%. Hence, a sensitive analysis of the discount rate is necessary. Figure 10 show cost percentages of the track, earthwork and the entire rail system at different discount rates during four stages. It can be seen from Figure 10a that when the discount rate is 2%, the cost of the track during the operation and maintenance phase is higher than that of the construction phase, while in other cases, the construction cost is still higher than the operation and maintenance cost. With the increase in the discount rate, the difference between the construction cost and the operation and maintenance cost is higher.
As for the operation and maintenance cost, it is estimated according to the ballastless track maintenance costs of various countries, and several uncertain factors may lead to a great fluctuation of the maintenance and operation cost. Therefore, it is also necessary to conduct sensitivity analysis on the operation and maintenance cost. The range of sensitivity analysis for the maintenance cost is set from +20% to +80%, and results are shows in Figure 11. It can be clearly seen from these figures that even if maintenance costs increase, they do not exceed construction costs when the discount rate is 4%.

6. Conclusions

By using the LCA method and LCC analysis method, this research compares the costs and environmental impacts of the entire rail system (including the track and the earthwork) of the Beijing-Shanghai High-Speed Railway in four stages. It is found that carbon emissions are mainly from the construction stage and operation and maintenance stage for the entire rail system, and the carbon emission from the construction stage (9964.83 kt) is more than twice that from operation and maintenance stage (4854.66 kt). The situation of the entire rail system energy consumption is similar to that of carbon emissions. This means that the energy is consumed hugely in the construction stage which accounts for 54.31% of the whole energy consumption of the rail system, followed by the operation and maintenance stage at 35.32%. The energy consumption and carbon emissions from the conception stage are negligible, so they could not be considered. Although the carbon emission from the disposal stage are small when compared to those from the construction stage and operation and maintenance stage, the energy consumption from the disposal stage accounts for nearly 10% of the total rail system energy consumption. Hence, the impact of the disposal stage on the environment could not be ignored. When analysing the construction stage specifically, it is discovered that carbon emissions and energy consumption are mainly from building materials, especially from cement. With regards to the life cycle cost, expenses spent on the construction stage contribute significantly to the total costs of the entire rail system with 82.60%. However, the conception cost and the disposal cost account for nearly 1% or less than 1% of the total costs. Although this research has great limitations due to the lack of accurate full life cycle data, it can help people have a clearer understanding of carbon emissions and energy consumption as well as total costs of HSR during the whole lifetime. It also plays a pioneering role to support studies of the life cycle impact of Chinese high-speed rail systems and similar transportation methods.

Author Contributions

Conceptualization, S.K., J.S., and J.P.; methodology, S.K., J.S., and J.P.; software, S.K., J.P.; validation, S.K., J.S., and J.P.; formal analysis, J.S. and J.P.; investigation, S.K., J.P.; resources, S.K.; data curation, J.P.; writing—original draft preparation, J.S. and J.P.; writing—review and editing, S.K.; visualization, J.S. and J.P.; supervision, S.K.; project administration, S.K.; funding acquisition, S.K. All authors have read and agreed to the published version of the manuscript.

Funding

This research was funded by the European Commission for the financial sponsorship of the H2020-MSCA-RISE Project No. 691135 “RISEN: Rail Infrastructure Systems Engineering Network”, which enables a global research network that tackles grand challenges in railway infrastructure resilience and advanced sensing. The APC is sponsored by the University of Birmingham Library’s Open Access Fund.

Acknowledgments

The first author is grateful to the Australian Academy of Science (AAS) and the Japan Society for the Promotion of Science (JSPS) for his JSPS Invitation Fellowship for Research (Long-term), Grant No. JSPS-L15701, at the Railway Technical Research Institute (RTRI) and the University of Tokyo, Japan. The second author gratefully appreciates the Royal Thai Government for his PhD scholarship. The authors are sincerely grateful to the European Commission for the financial sponsorship of the H2020-MSCA-RISE Project No. 691135 “RISEN: Rail Infrastructure Systems Engineering Network”, which enables a global research network that tackles grand challenges in railway infrastructure resilience and advanced sensing [45].

Conflicts of Interest

The authors declare no conflicts of interest.

References

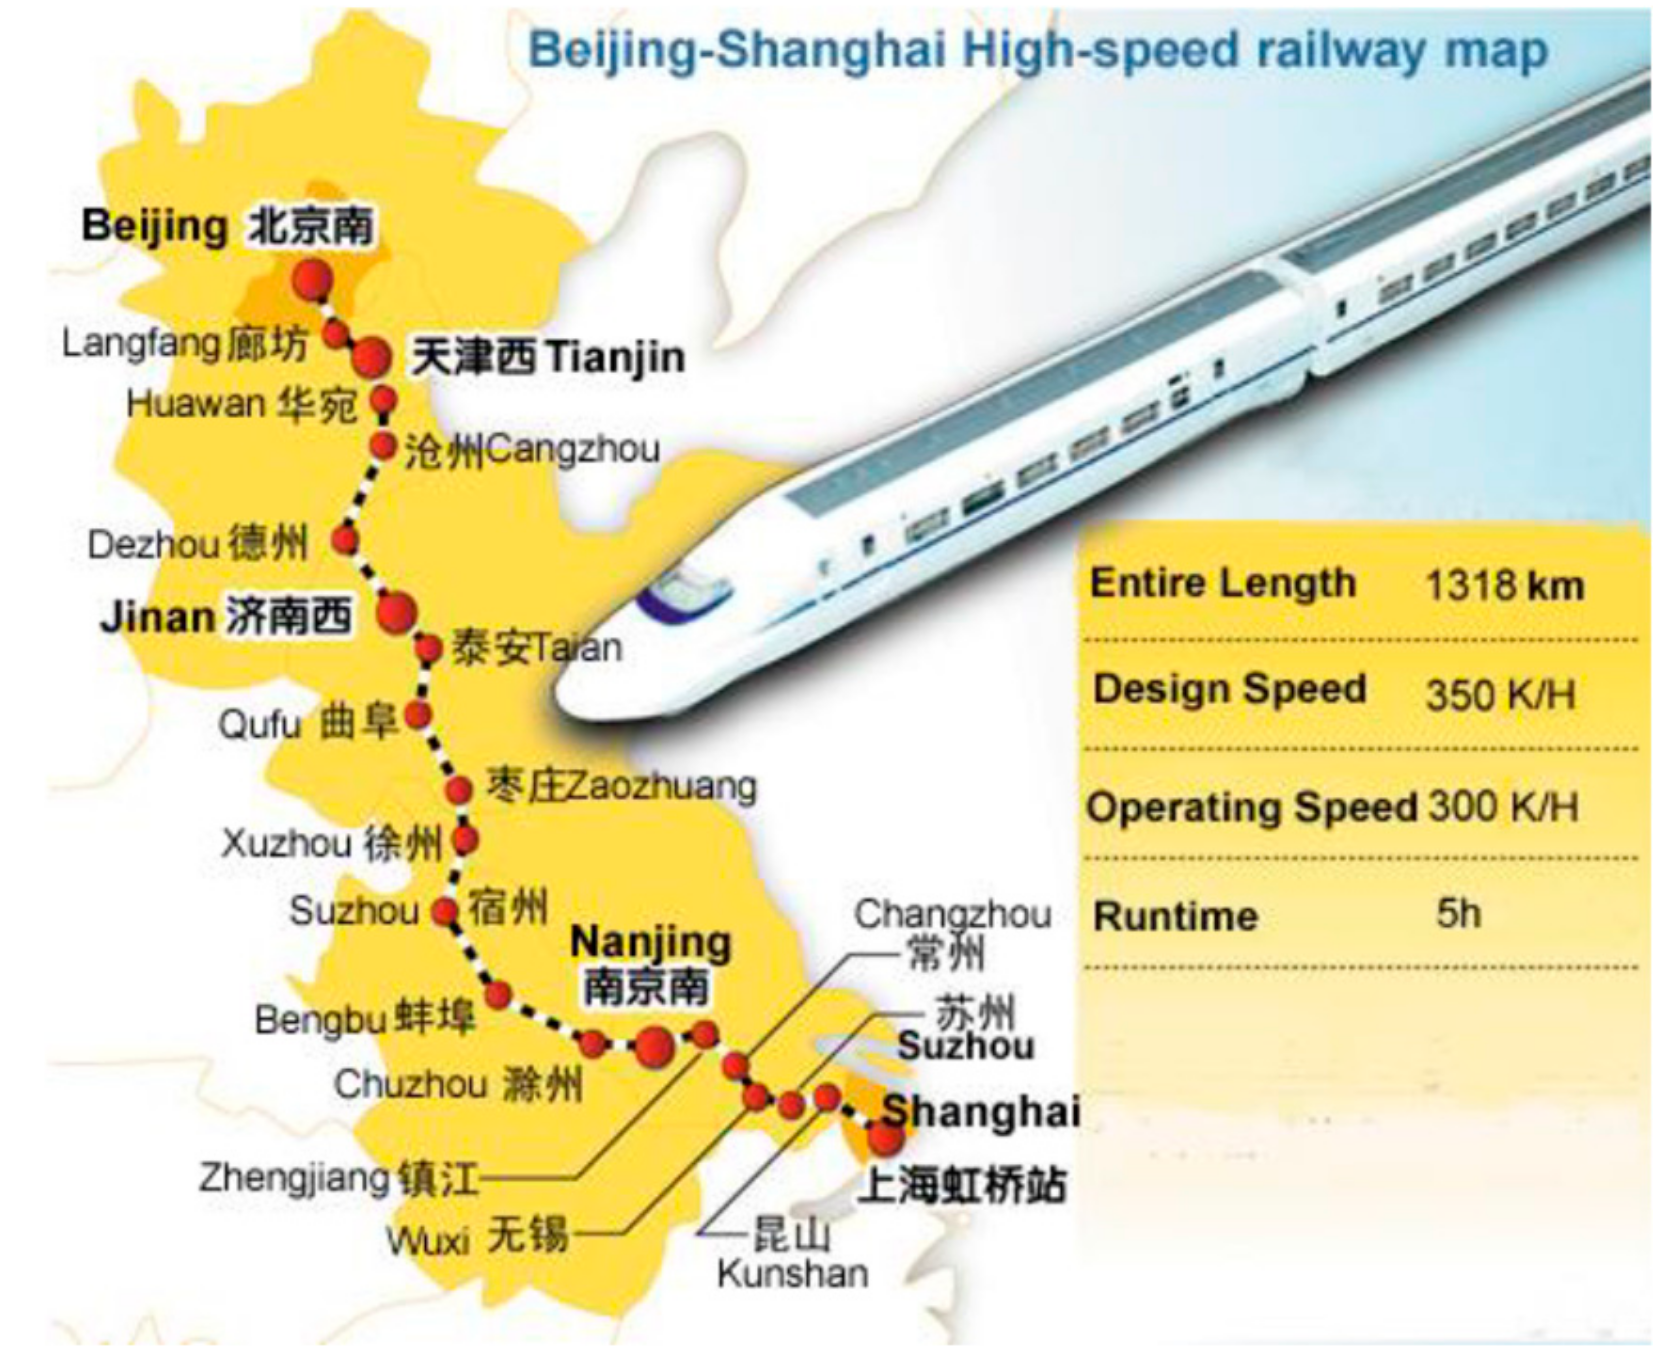
  1. Chinese Railways. Overview of Beijing-Shanghai High-speed Railway Construction. 2008. Available online: http://www.cnki.net (accessed on 10 July 2019).
  2. Brautigam, D. The Real Cost of Chinese Railway Construction in Nigeria; Johns Hopkins University: Baltimore, MD, USA, 2010. [Google Scholar]
  3. The World Bank. Cost of High Speed Rail in China One Third Lower than in Other Countries. 2014. Available online: https://www.worldbank.org/en/news/press-release/2014/07/10/cost-of-high-speed-rail-in-china-one-third-lower-than-in-other-countries (accessed on 29 November 2019).
  4. Yang, J.; Wang, H.; Zhou, J. Life cycle assessment of Chinese railway transportation. Res. Environ. Sci. 2013, 26, 1029–1034. [Google Scholar]
  5. Ma, X.; Shi, F.; Liu, P.; Bai, J.; Li, Q. Introduction and Using Analysis of Life Cycle Cost Management. Henan Electr. Power 2006, 4, 18–21. [Google Scholar]
  6. ChinaTouristMaps. Detailed Map of Beijing-Shanghai High-Speed Railway. 2019. Available online: http://www.chinatouristmaps.com/current/beijing-shanghai-high-speed-railway/beijing-shanghai-high-speed-railway-map.html. (accessed on 25 December 2019).
  7. Chester, M.V.; Horvath, A. Environmental assessment of passenger transportation should include infrastructure and supply chains. Environ. Res. Lett. 2009, 4, 024008. [Google Scholar] [CrossRef]
  8. Chester, M.; Horvath, A. Life-cycle assessment of high-speed rail: The case of California. Environ. Res. Lett. 2010, 5, 014003. [Google Scholar] [CrossRef]
  9. Chang, B.; Kendall, A. Life cycle greenhouse gas assessment of infrastructure construction for California’s high-speed rail system. Transp. Res. Part D Transp. Environ. 2011, 16, 429–434. [Google Scholar] [CrossRef]
  10. Sárik, V. Decision-Making Model for Track System of High-Speed Rail Lines: Ballasted Track, Ballastless Track or Both? KTH Royal Institute of Technology: Stockholm, Sweden, 2018. [Google Scholar]
  11. Von Rozycki, C.; Koeser, H.; Schwarz, H. Ecology profile of the German high-speed rail passenger transport system, ICE. The Int. J. Life Cycle Assess. 2003, 8, 83–91. [Google Scholar] [CrossRef]
  12. Åkerman, J. The role of high-speed rail in mitigating climate change–The Swedish case Europabanan from a life cycle perspective. Transp. Res. Part D Transp. Environ. 2011, 16, 208–217. [Google Scholar] [CrossRef]
  13. Jones, H.; Moura, F.; Domingos, T. Life cycle assessment of high-speed rail: A case study in Portugal. Int. J. Life Cycle Assess. 2017, 22, 410–422. [Google Scholar] [CrossRef]
  14. Wang, L. Re-discussion on reduction of CO2 emission in China′s cement industry. China Cem. 2008, 2, 36–39. [Google Scholar]
  15. Yue, Y.; Wang, T.; Liang, S.; Yang, J.; Hou, P.; Qu, S.; Zhou, J.; Jia, X.; Wang, H.; Xu, M. Life cycle assessment of high speed rail in China. Transp. Res. Part D Transp. Environ. 2015, 41, 367–376. [Google Scholar] [CrossRef]
  16. Zoeteman, A.; Esveld, C. Evaluating Track Structures: Life Cycle Cost Analysis as a Structured Approach; World Congress on Railway Research: Tokyo, Japan, 1999. [Google Scholar]
  17. Zoeteman, A. Life cycle cost analysis for managing rail infrastructure. Eur. J. Transp. Infrastruct. Res. 2001, 1, 4. [Google Scholar]
  18. Chen, J.; Huang, R. Evaluation of Advantages and Comparative Efficiency of TRA Ballastless Track; National Taiwan Ocean University: Keelung, Taiwan, 2003. [Google Scholar]
  19. Wu, Y. Economy analysis of ballastless track of passenger dedicated line based on life cycle cost. Sichuan Archit. 2010, 30, 270–272. [Google Scholar]
  20. Lin, J.; Li, H.; Huang, W.; Xu, W.; Cheng, X. A Carbon Footprint of High-Speed Railways in China: A Case Study of the Beijing-Shanghai Line. J. Ind. Ecol. 2018, 23, 869–878. [Google Scholar] [CrossRef]
  21. National Railway Administration. Code for Design of High Speed Railway TB10620-2014; National Railway Administration of People’s Republic of China (NRA): Beijng, China, 2014.
  22. Sftool.gov. Life Cycle Assessment (LCA) Overview, GSA Sustainable Facilites Tool. 2019. Available online: https://sftool.gov/plan/400/life-cycle-assessment-lca-overview (accessed on 17 July 2019).
  23. Environmental Management: Life Cycle Assessment; Principles and Framework; International Organization for Standardization: London, UK, 2006.
  24. Infield, D.; Freris, L. Renewable Energy in Power Systems, 2nd ed.; John Wiley & Sons: Hoboken, NJ, USA, 2020. [Google Scholar]
  25. Zou, T. Analysis on Technical and Economic Indicators of Beijing-Shanghai High Railway Base and Bridge Engineering. Railw. Surv. Des. 2008, 8, 77–79. [Google Scholar]
  26. Cheng, Z. The Application of CRTS-II Slab Ballastless Track in Passenger Oriented Track. Railw. Constr. Technol. 2011, 7, 120–123. [Google Scholar]
  27. Zhao, Y. The key equipment of laying CRST II ballastless tracks. Constr. Tech. 2011, 8, 45–48. [Google Scholar]
  28. Huang, J. Application of CFG pile in Wenfu Railway. Railw. Constr. Technol. 2006, 8, 71–73. [Google Scholar]
  29. Ma, D. Research on Economy of Ballastless Track of High-Speed Railway in China; Southwest Jiaotong University: Chengdu, China, 2009. [Google Scholar]
  30. Fu, B. Study on Energy Consumption and Carbon Emission Life Cycle of High Speed Rill; Shijjazhuang Tiedao University: Shaoxing, China, 2017. [Google Scholar]
  31. Ke, J.; Zheng, N.; Fridley, D.; Price, L.; Zhou, N. Potential energy savings and CO2 emissions reduction of China′s cement industry. Energy Policy 2012, 45, 739–751. [Google Scholar] [CrossRef] [Green Version]
  32. Chappat, M.; Bilal, A.J. Sustainable Development—The Environmental Road of the Future: Life Cycle Analysis. 2003. Available online: https://www.colas.com/sites/default/files/publications/route-future-english_1.pdf (accessed on 10 July 2019).
  33. Feng, X. Modeling Life Cycle Energy Consumption and Greenhouse Gas Emissions for High-Speed Railways; Beijing Jiaotong University: Beijing, China, 2014. [Google Scholar]
  34. World Steel in Figures; World Steel Association: Brussels, Belgium, 2011.
  35. Yan, X.; Crookes, R.J. Life cycle analysis of energy use and greenhouse gas emissions for road transportation fuels in China. Renew. Sustain. Energy Rev. 2009, 13, 2505–2514. [Google Scholar] [CrossRef]
  36. Liu, H.; Zhou, S.; Peng, T.; Ou, X. Life Cycle Energy Consumption and Greenhouse Gas Emissions Analysis of Natural Gas-Based Distributed Generation Projects in China. Energies 2017, 10, 1515. [Google Scholar]
  37. Li, H. Economic Appraisal Research on Ballastless Track of High-Speed Railway Based on Life Cycle Cost; Southwest Jiaotong University: Chendu, China, 2014. [Google Scholar]
  38. Qi, G. Construction Organization and Costs Analysis of CRTS II Type Plate Ballastless Track. Railway. Railw. Eng. Cost Manag. 2013, 28, 11–14. [Google Scholar]
  39. You, L. Economic Analysis of Life Cycle of Ballastless Track Structure of High Speed Railway. Sichuan Cem. 2016, 8, 42–43. [Google Scholar]
  40. European Commission. Assessment of Unit Costs (Standard Prices) of Rail Projects (CAPital EXpenditure); Directorate-General for Regional and Urban Policy: Brussels, Belgium, 2018. [Google Scholar]
  41. Wang, Y. Discussion on economy evaluation of ballastless track in China by LCC analysis. Acad. Trends 2007, 1, 10–14. [Google Scholar]
  42. Net Present Value (NPV); Investopedia: New York, NY, USA, 2019.
  43. Seo, M.-S.; Kim, T.; Hong, G.; Kim, H. On-site measurements of CO2 emissions during the construction phase of a building complex. Energies 2016, 9, 599. [Google Scholar] [CrossRef]
  44. World Cement. GGBS: How We Can Produce Sustainable Concrete. 2009. Available online: https://www.worldcement.com/europecis/01102009/ggbs_the_worlds_most_sustainable_building_material/ (accessed on 15 August 2019).
  45. Kaewunruen, S.; Sussman, J.M.; Matsumoto, A. Grand challenges in transportation and transit systems. Front. Built Environ. 2016, 2, 4. [Google Scholar] [CrossRef] [Green Version]
Figure 1. Beijing-Shanghai HSR map [6].
Sustainability 12 00206 g001
Figure 2. Flow diagram of the process of the LCA.
Sustainability 12 00206 g002
Figure 3. Flow diagram of four stages during the life cycle.
Sustainability 12 00206 g003
Figure 4. Flow diagram of the process of LCC analysis.
Sustainability 12 00206 g004
Figure 5. Carbon emission percentages of: (a) the structure of track; (b) the structure of earthwork; (c) the entire rail system.
Sustainability 12 00206 g005
Figure 6. Carbon emission percentages of materials in construction stage of the entire rail system.
Sustainability 12 00206 g006
Figure 7. Energy consumption percentages of: (a) the structure of track; (b) the structure of earthwork; (c) the entire rail system.
Sustainability 12 00206 g007
Figure 8. Energy consumption percentages of materials in construction stage of the entire rail system.
Sustainability 12 00206 g008
Figure 9. Cost percentages of: (a) the structure of track; (b) the structure of earthwork; (c) the entire rail system.
Sustainability 12 00206 g009aSustainability 12 00206 g009b
Figure 10. Cost percentages in four stages at different discount rates of: (a) the track; (b) the earthwork; (c) the entire rail system.
Sustainability 12 00206 g010aSustainability 12 00206 g010b
Figure 11. Cost percentages with different operation and maintenance costs in four stages of: (a) the track; (b) the earthwork; (c) the entire rail system.
Sustainability 12 00206 g011aSustainability 12 00206 g011b
Table 1. Construction materials requirement for the track and the earthwork.
MaterialsQuantity of Work (ton/km)Amount for the Track (t)Amount for the Earthwork (t)
TrackEarthwork
Sand1841.8215,879.402,427,515.9720,929,049.20
Gravel1505.31178,256.501,983,995.31234,942,067.00
Water317.603147.90418,590.214,148,932.20
Bitumen 207.32-273,241.17 -
Rail120.00-158,160.00-
Steel bar409.00-539,062.00 -
Geotextile1.47-1941.41 -
PE-HD2.34-3089.39 -
Binder1.60-2102.21 -
Electric power11.86-15,638.07 -
Table 2. Construction equipment use for the track and the earthwork.
Construction EquipmentTrackEarthwork
Working Time (h)Rated Power (kW)Energy (MJ)Working Time (h)Rated Power (kW)Energy (MJ)
Concrete distributor 45.622.03612
Concrete mixing plant 45.6160.026,266219.9160.0126,662
CNC grinding machine 45.6260.042,682
Gantry crane 113.086.535,188
Two-way transporter 34.5110.013,662
CA mortar truck 27.790.08975
Track laying machine 6.0396.08554
Spiral drilling machine 311.290.0100,829
Excavator 5889.0125.02,650,050
Loading machine 2944.5162.01,717,232
Concrete pump 439.8115.0182,077
Table 3. Carbon emissions and energy consumption of the track, the earthwork and the entire rail system in four stages.
Stages TrackEarthworkEntire Rail System
CO2 (kt)Energy (TJ)CO2 (kt)Energy (TJ)CO2 (kt)Energy (TJ)
Conception35.59382.2235.59382.2271.18764.44
Construction1647.5015,908.268317.3343,546.729964.8359,454.98
Operation and Maintenance1990.1820,956.202864.4817,713.924854.6638,670.12
Disposal20.75369.04451.2910,214.50472.0410,583.54
Sum3694.0237,615.7211,668.6871,857.3615,362.70109,473.08
Table 4. Costs of the track, the earthwork and the entire rail system in four stages.
StagesTrack (million US$)Earthwork (million US$)Entire Rail System (million US$)
Conception 14.2714.2714.27
Construction 844.153769.864614.01
Operation and maintenance651.37441.36910.61
Disposal 2.9929.7732.75
Sum1512.784255.265585.92

