Spatiotemporal Patterns and Driving Forces of Urban Expansion in Coastal Areas: A Study on Urban Agglomeration in the Pearl River Delta, China


Abstract
1. Introduction
2. Study Area and Data
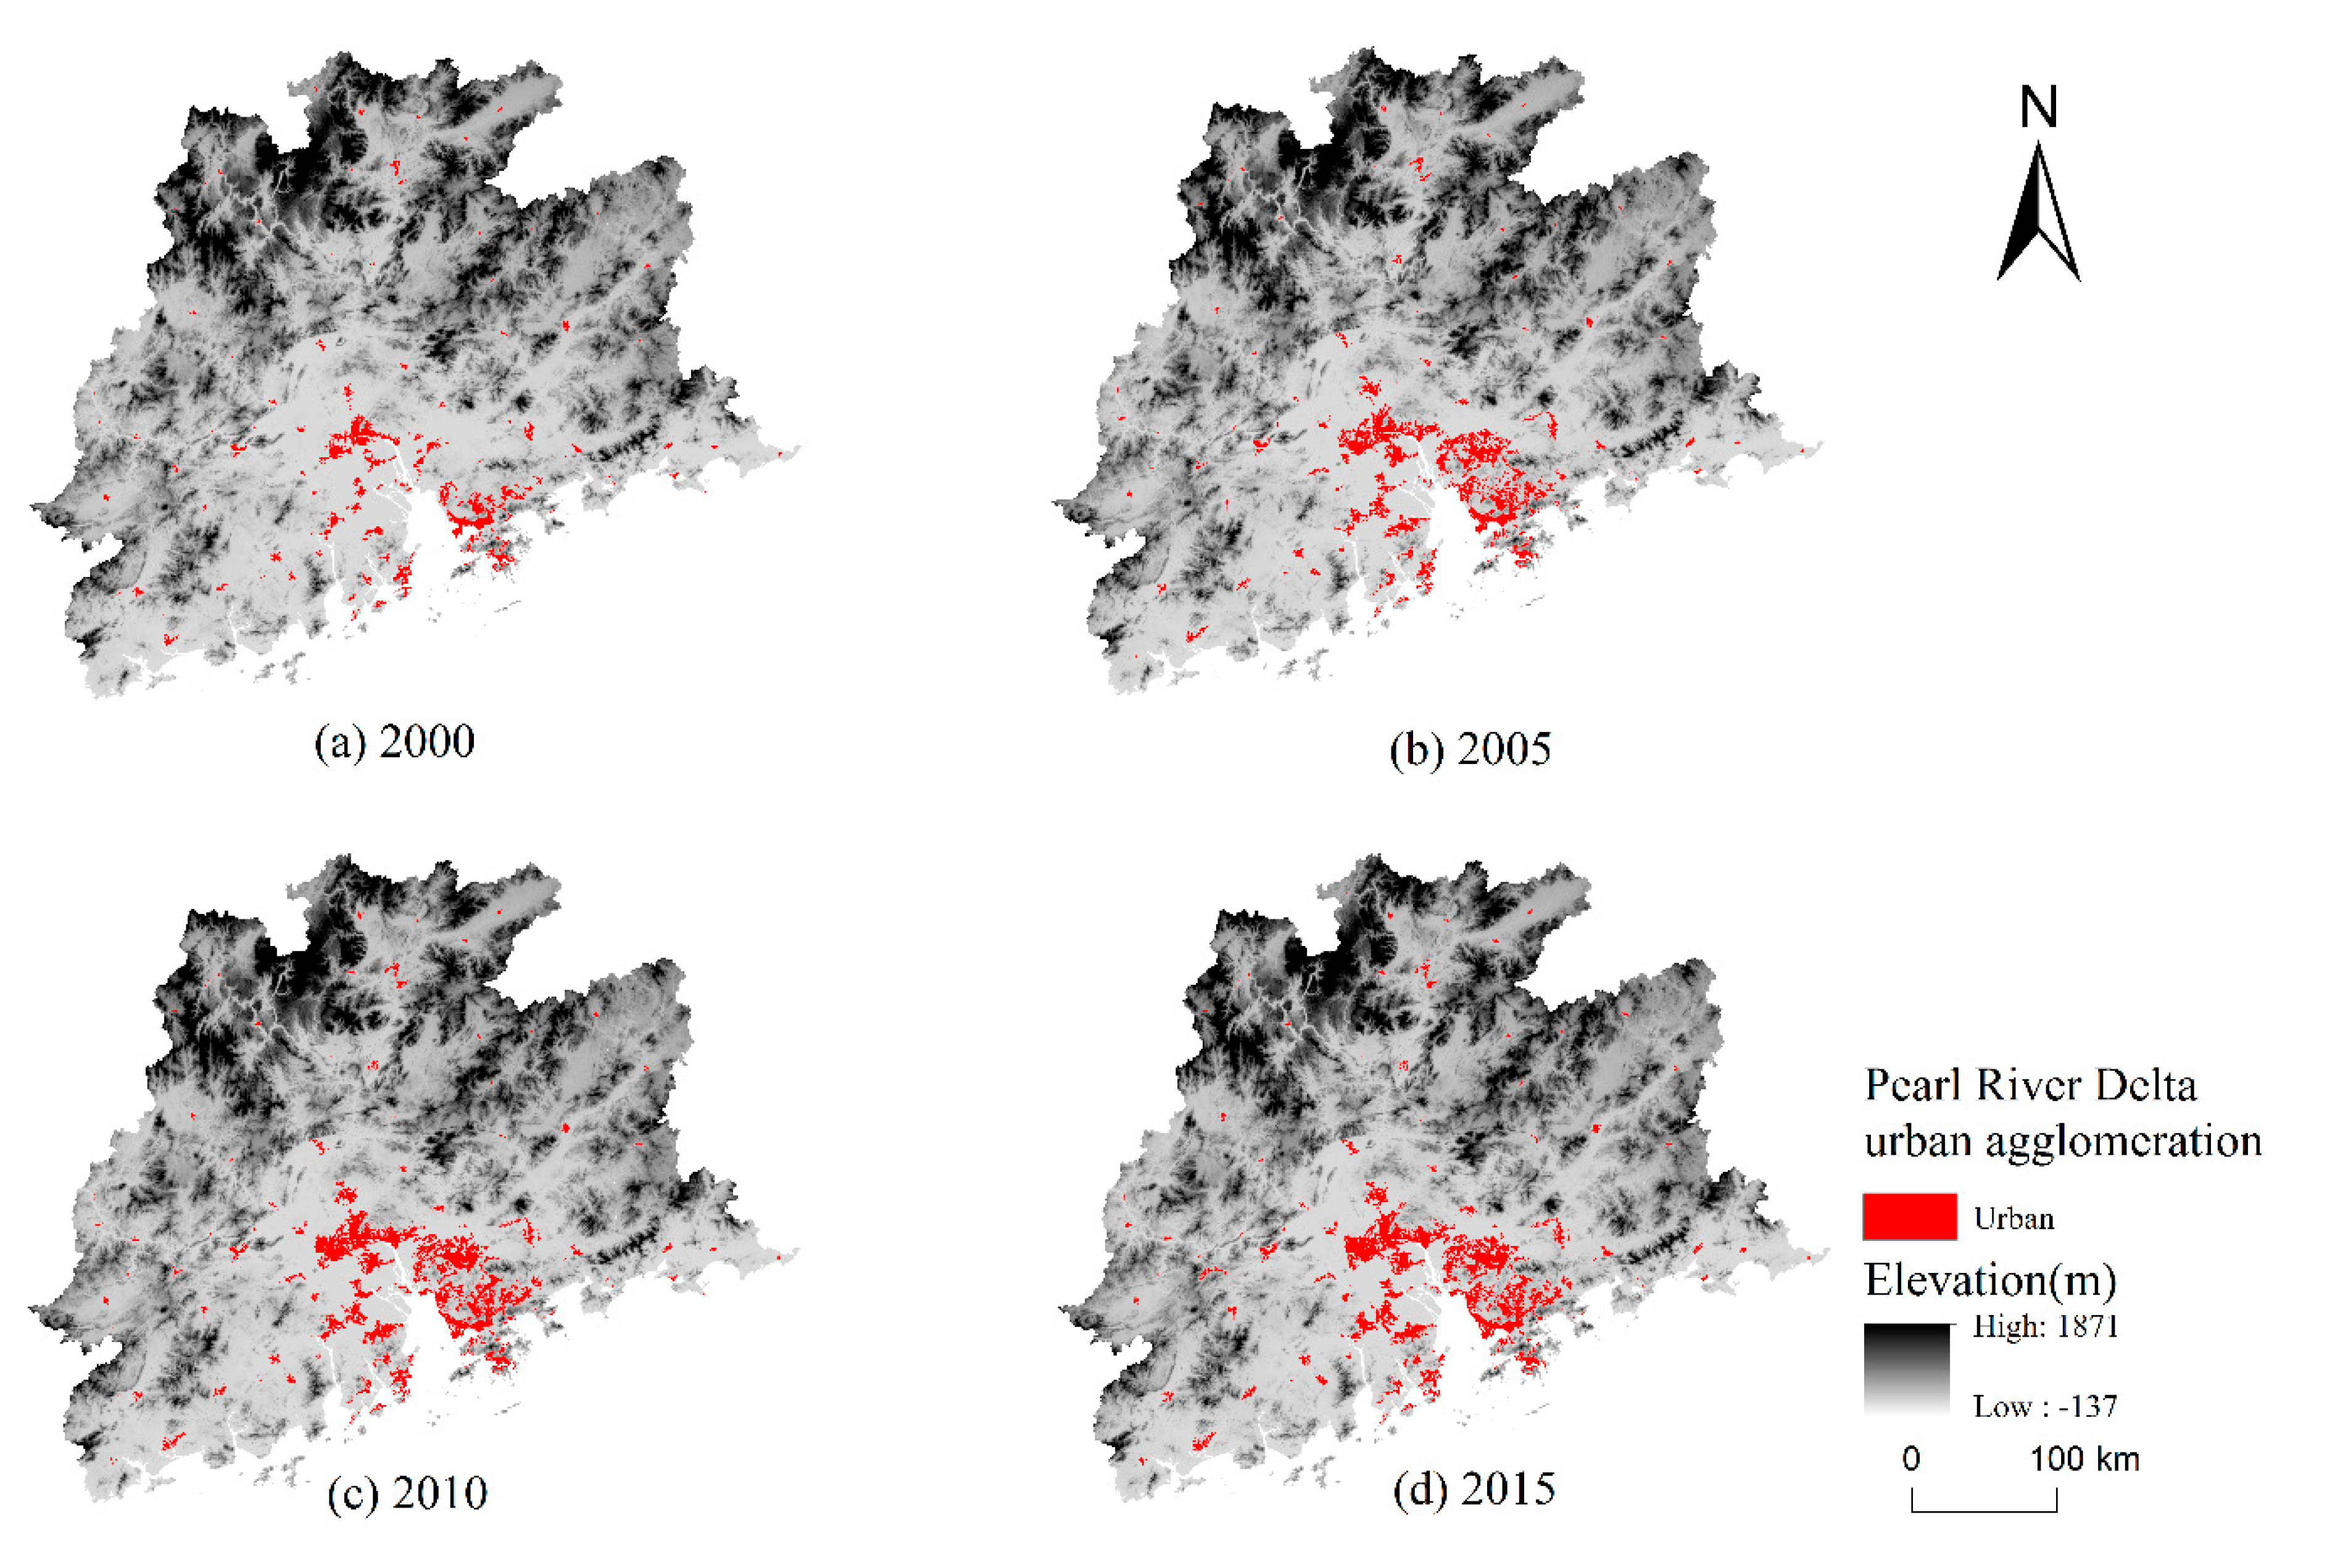
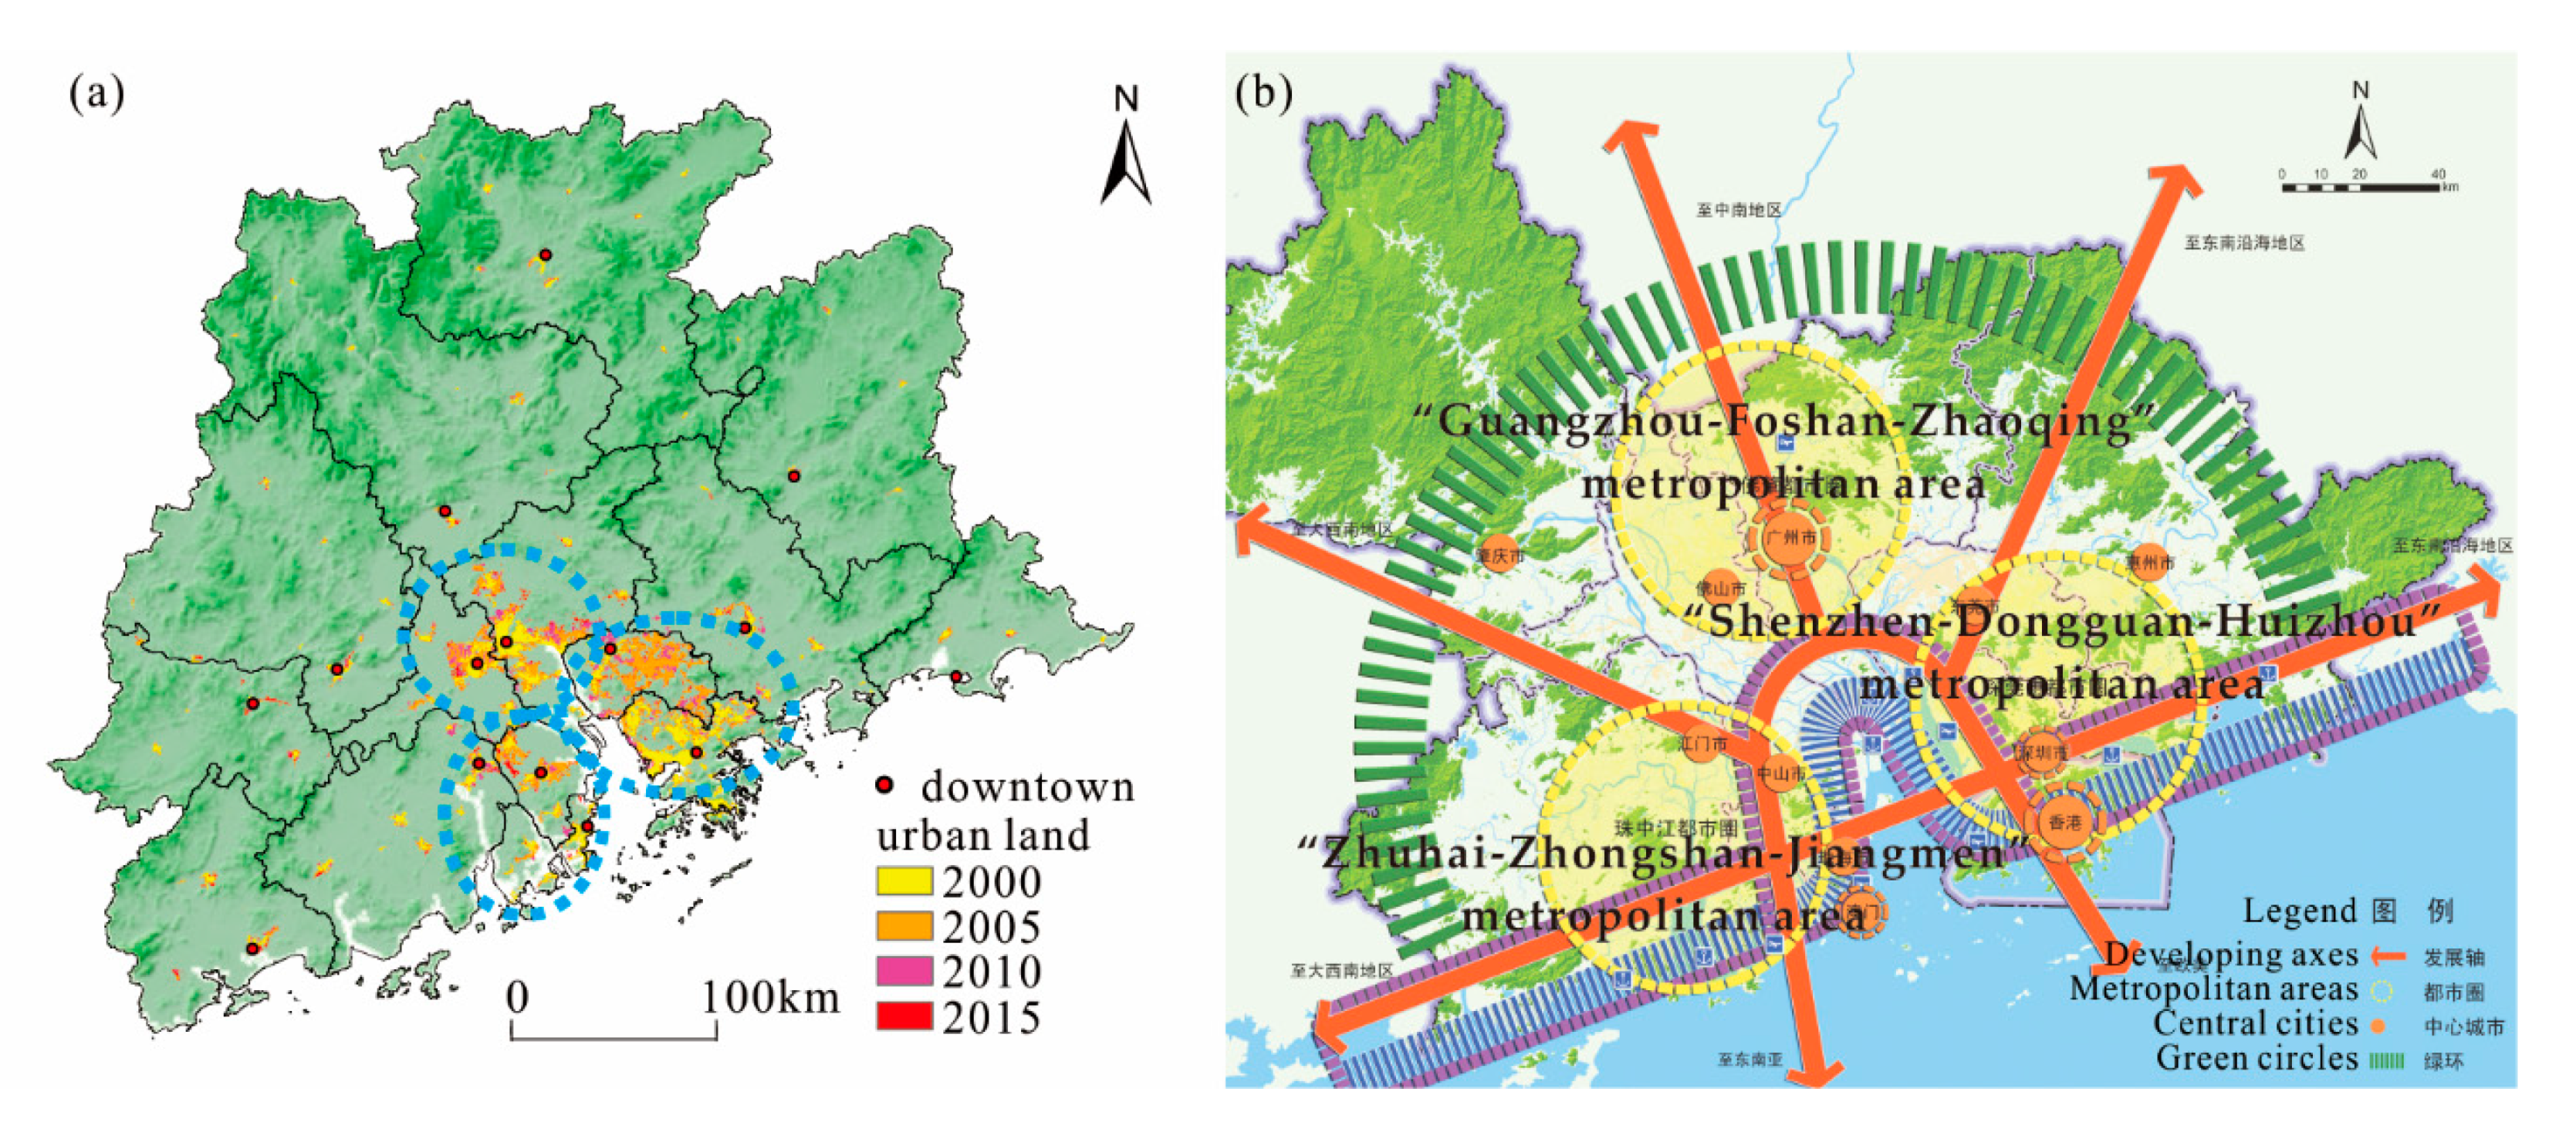
2.1. Study Area
2.2. Data Source
3. Methods
3.1. Spatial Pattern Indicators
3.1.1. Urban-Land Expansion Intensity Index
3.1.2. Urban-Land Expansion Difference Index
3.1.3. Fractal Dimension
3.2. Driving Force Analysis—Geographical Detector
| Nonlinear-weaken: p(M∩N) < Min(p(M), p(N)) Uni-enhance/weaken: Min(p(M), p(N)) < p(M∩N) < Max(p(M), p(N)) Bi-enhance: Max(p(M), p(N)) < p(M∩N) < (p(M) + p(N)) Independent: p(M∩N) = p(M) + p(N) Nonlinear-enhance: p(M∩N) > (p(M) + p(N)) |
3.3. Driving Factors Selection
4. Results
4.1. Spatial Pattern of Urban Land Expansion
4.2. Results of Driving-Forces Analysis
4.2.1. Factor and Risk Detector
4.2.2. Interaction Detector
5. Discussion: Implications of Political Effects
6. Conclusions
Author Contributions
Funding
Conflicts of Interest
References
- Scialabba, N. Integrated Coastal Area Management and Agriculture, Forestry and Fisheries; Food and Agriculture Org.: Rome, Italy, 1998. [Google Scholar]
- Seto, K.C. Exploring the dynamics of migration to mega-delta cities in Asia and Africa: Contemporary drivers and future scenarios. Glob. Environ. Chang. 2011, 21, S94–S107. [Google Scholar] [CrossRef]
- Brown, S.; Nicholls, R.J.; Woodroffe, C.D.; Hanson, S.; Hinkel, J.; Kebede, A.S.; Neumann, B.; Vafeidis, A.T. Sea-Level Rise Impacts and Responses: A Global Perspective; Finkl, C.W., Ed.; Coastal Hazards; Springer: Dordrecht, The Netherlands, 2013; pp. 117–149. [Google Scholar]
- Seto, K.C.; Fragkias, M.; Güneralp, B.; Reilly, M.K. A Meta-Analysis of Global Urban Land Expansion. PLoS ONE 2011, 6, e23777. [Google Scholar] [CrossRef] [PubMed]
- Li, H.; Peng, J.; Liu, Y.; Hu, Y. Urbanization impact on landscape patterns in Beijing City, China: A spatial heterogeneity perspective. Ecol. Indic. 2017, 82, 50–60. [Google Scholar] [CrossRef]
- Guetté, A.; Gaüzère, P.; Devictor, V.; Jiguet, F.; Godet, L. Measuring the synanthropy of species and communities to monitor the effects of urbanization on biodiversity. Ecol. Indic. 2017, 79, 139–154. [Google Scholar] [CrossRef]
- Kaushal, S.S.; McDowell, W.H.; Wollheim, W.M. Tracking evolution of urban biogeochemical cycles: Past, present, and future. Biogeochemistry 2014, 121, 1–21. [Google Scholar] [CrossRef]
- Kennedy, C.A.; Stewart, I.; Facchini, A.; Cersosimo, I.; Mele, R.; Chen, B.; Uda, M.; Kansal, A.; Chiu, A.; Kim, K.-G.; et al. Energy and material flows of megacities. Proc. Natl. Acad. Sci. USA 2015, 112, 5985–5990. [Google Scholar] [CrossRef]
- McGranahan, G.; Balk, D.; Anderson, B. The rising tide: Assessing the risks of climate change and human settlements in low elevation coastal zones. Environ. Urban 2007, 19, 17–37. [Google Scholar] [CrossRef]
- He, C.; Liu, Z.; Tian, J.; Ma, Q. Urban expansion dynamics and natural habitat loss in China: A multiscale landscape perspective. Glob. Chang. Biol. 2014, 20, 2886–2902. [Google Scholar] [CrossRef]
- Wu, W.; Zhao, S.; Zhu, C.; Jiang, J. A comparative study of urban expansion in Beijing, Tianjin and Shijiazhuang over the past three decades. Landsc. Urban Plan. 2015, 134, 93–106. [Google Scholar] [CrossRef]
- Blaschke, T.; Hay, G.J.; Weng, Q.; Resch, B. Collective Sensing: Integrating Geospatial Technologies to Understand Urban Systems—An Overview. Remote Sens. 2011, 3, 1743–1776. [Google Scholar] [CrossRef]
- He, C.; Tian, J.; Shi, P.; Hu, D. Simulation of the spatial stress due to urban expansion on the wetlands in Beijing, China using a GIS-based assessment model. Landsc. Urban Plan. 2011, 101, 269–277. [Google Scholar] [CrossRef]
- Herold, M.; Scepan, J.; Clarke, K.C. The Use of Remote Sensing and Landscape Metrics to Describe Structures and Changes in Urban Land Uses. Environ. Plan. A Econ. Space 2002, 34, 1443–1458. [Google Scholar] [CrossRef]
- Haas, J.; Ban, Y. Urban growth and environmental impacts in Jing-Jin-Ji, the Yangtze, River Delta and the Pearl River Delta. Int. J. Appl. Earth Obs. Geoinf. 2014, 30, 42–55. [Google Scholar] [CrossRef]
- Ye, L. Urban transformation and institutional policies: Case study of mega-region development in China’s Pearl River Delta. J. Urban Plan. Dev. 2013, 139, 292–300. [Google Scholar] [CrossRef]
- Fang, C. Important progress and future direction of studies on China’s urban agglomerations. J. Geogr. Sci. 2015, 25, 1003–1024. [Google Scholar] [CrossRef]
- Shao, J.-A.; Wei, C.-F.; Xie, D.-T. An insight on drivers of land use change at regional scale. Chin. Geogr. Sci. 2006, 16, 176–182. [Google Scholar] [CrossRef]
- Fang, S.; Gertner, G.Z.; Sun, Z.; Anderson, A.A. The impact of interactions in spatial simulation of the dynamics of urban sprawl. Landsc. Urban Plan. 2005, 73, 294–306. [Google Scholar] [CrossRef]
- Ju, H.; Zhang, Z.; Zuo, L.; Wang, J.; Zhang, S.; Wang, X.; Zhao, X. Driving forces and their interactions of built-up land expansion based on the geographical detector—A case study of Beijing, China. Int. J. Geogr. Inf. Sci. 2016, 30, 1–20. [Google Scholar] [CrossRef]
- National Bureau of Statistics of the People’s Republic of China. China City Statistical Yearbook; China Statistics Press: Beijing, China, 2001. (In Chinese) [Google Scholar]
- National Bureau of Statistics of the People’s Republic of China. China City Statistical Yearbook; China Statistics Press: Beijing, China, 2016. (In Chinese) [Google Scholar]
- Zhang, Z.; Wang, X.; Zhao, X.; Liu, B.; Yi, L.; Zuo, L.; Wen, Q.; Liu, F.; Xu, J.; Hu, S. A 2010 update of National Land Use/Cover Database of China at 1:100,000 scale using medium spatial resolution satellite images. Remote Sens. Environ. 2014, 149, 142–154. [Google Scholar] [CrossRef]
- National Bureau of Statistics of the People’s Republic of China. China City Statistical Yearbook; China Statistics Press: Beijing, China, 2006. (In Chinese) [Google Scholar]
- National Bureau of Statistics of the People’s Republic of China. China City Statistical Yearbook; China Statistics Press: Beijing, China, 2011. (In Chinese) [Google Scholar]
- Chen, Y.; Wang, J.; Feng, J. Understanding the Fractal Dimensions of Urban Forms through Spatial Entropy. Entropy 2017, 19, 600. [Google Scholar] [CrossRef]
- Wang, H.; Zhang, B.; Liu, Y.L.; Liu, Y.F.; Xu, S.; Deng, Y.; Zhao, Y.; Chen, Y.; Hong, S. Multi-dimensional analysis of urban expansion patterns and their driving forces based on the center of gravity-GTWR model: A case study of the Beijing-Tianjin-Hebei urban agglomeration. Acta Geogr. Sin. 2018, 73, 1076–1092. (In Chinese) [Google Scholar]
- Wang, J.; Xu, C. Geodetector: Principle and prospective. Acta Geogr. Sin. 2017, 72, 116–134. [Google Scholar]
- Wang, J.; Li, X.; Christakos, G.; Liao, Y.; Zhang, T.; Gu, X.; Zheng, X. Geographical Detectors-Based Health Risk Assessment and its Application in the Neural Tube Defects Study of the Heshun Region, China. Int. J. Geogr. Inf. Sci. 2010, 24, 107–127. [Google Scholar] [CrossRef]
- Shu, B.; Zhang, H.; Li, Y.; Qu, Y.; Chen, L. Spatiotemporal variation analysis of driving forces of urban land spatial expansion using logistic regression: A case study of port towns in Taicang City, China. Habitat Int. 2014, 43, 181–190. [Google Scholar] [CrossRef]
- Braimoh, A.K.; Onishi, T. Spatial determinants of urban land use change in Lagos, Nigeria. Land Use Policy 2007, 24, 502–515. [Google Scholar] [CrossRef]
- Ma, Y.; Xu, R. Remote sensing monitoring and driving force analysis of urban expansion in Guangzhou City, China. Habitat Int. 2010, 34, 228–235. [Google Scholar] [CrossRef]
- Li, X.; Zhou, W.; Ouyang, Z. Forty years of urban expansion in Beijing: What is the relative importance of physical, socioeconomic, and neighborhood factors? Appl. Geogr. 2013, 38, 1–10. [Google Scholar] [CrossRef]
- Wu, K.Y.; Zhang, H. Land use dynamics, built-up land expansion patterns, and driving forces analysis of the fast-growing Hangzhou metropolitan area, eastern China (1978–2008). Appl. Geogr. 2012, 34, 137–145. [Google Scholar] [CrossRef]
- Wang, J.F.; Liu, X.; Christakos, G.; Liao, Y.L.; Gu, X.; Zheng, X.Y. Assessing local determinants of neural tube defects in the Heshun Region, Shanxi Province, China. BMC Public Health 2010, 10, 52. [Google Scholar] [CrossRef]
- Liu, J.; Zhang, Z.; Xu, X.; Kuang, W.; Zhou, W.; Zhang, S.; Li, R.; Yan, C.; Yu, N.; Wu, S.; et al. Spatial patterns and driving forces of land use change in China during the early 21st century. J. Geogr. Sci. 2010, 20, 483–494. [Google Scholar] [CrossRef]


| Category | Variable | Abbreviation | Unit |
|---|---|---|---|
| Physical factors | Elevation | ELE | m |
| slope | SLP | ° | |
| Distance to rivers | D_RV | km | |
| Distance to coastline | D_CL | km | |
| Socioeconomic factors | Permanent population | P_POP | thousand persons |
| Gross domestic product | GDP | billion RMB | |
| Proportion of secondary and tertiary industries in GDP | ST_GDP | % | |
| Total investment in fixed assets | T_FAI | billion RMB | |
| Distance to main roads | D_RD | km | |
| Distance to Guangzhou and Shenzhen | D_GS | km |
| City | 2000–2005 | 2005–2010 | 2010–2015 | 2000–2015 |
|---|---|---|---|---|
| Guangzhou | 0.141 | 0.036 | 0.019 | 0.080 |
| Shenzhen | 0.040 | 0.026 | 0.015 | 0.030 |
| Foshan | 0.057 | 0.015 | 0.001 | 0.026 |
| Dongguan | 0.037 | 0.015 | 0.011 | 0.023 |
| Zhuhai | 0.187 | 0.046 | 0.014 | 0.103 |
| Zhongshan | 0.031 | 0.048 | 0.028 | 0.042 |
| Zhaoqing | 0.023 | 0.022 | 0.045 | 0.034 |
| Yunfu | 0.086 | 0.075 | 0.023 | 0.079 |
| Yangjiang | 0.039 | 0.010 | 0.021 | 0.026 |
| Shaoguan | 0.065 | 0.018 | 0.016 | 0.037 |
| Shanwei | 0.068 | 0.022 | 0.075 | 0.069 |
| Qingyuan | 0.155 | 0.011 | 0.038 | 0.081 |
| Huizhou | 1.304 | 0.044 | 0.008 | 0.571 |
| Heyuan | 0.415 | 0.025 | 0.026 | 0.193 |
| Jiangmen | 0.087 | 0.027 | 0.142 | 0.119 |
| PRDUA | 0.153 | 0.032 | 0.016 | 0.081 |
| City | 2000 | 2005 | 2010 | 2015 | Changes |
|---|---|---|---|---|---|
| Guangzhou | 1.1687 | 1.2002 | 1.2057 | 1.2070 | 0.0383 |
| Shenzhen | 1.1926 | 1.2282 | 1.2328 | 1.2464 | 0.0538 |
| Foshan | 1.2005 | 1.2068 | 1.1837 | 1.1862 | −0.0143 |
| Dongguan | 1.2131 | 1.2444 | 1.2392 | 1.2417 | 0.0286 |
| Zhuhai | 1.1643 | 1.1672 | 1.1701 | 1.1660 | 0.0017 |
| Zhongshan | 1.1518 | 1.2209 | 1.2098 | 1.2056 | 0.0538 |
| Zhaoqing | 1.1436 | 1.1485 | 1.1525 | 1.1595 | 0.0159 |
| Yunfu | 1.1491 | 1.1561 | 1.1539 | 1.1762 | 0.0271 |
| Yangjiang | 1.1879 | 1.2042 | 1.2062 | 1.2060 | 0.0181 |
| Shaoguan | 1.1204 | 1.1366 | 1.1471 | 1.1480 | 0.0276 |
| Shanwei | 1.1029 | 1.1330 | 1.1392 | 1.1387 | 0.0358 |
| Qingyuan | 1.1118 | 1.1404 | 1.1421 | 1.1433 | 0.0315 |
| Huizhou | 1.1369 | 1.1890 | 1.1757 | 1.1830 | 0.0461 |
| Heyuan | 1.1766 | 1.2118 | 1.2133 | 1.2159 | 0.0393 |
| Jiangmen | 1.1878 | 1.1980 | 1.2058 | 1.2042 | 0.0164 |
| Driving Factor | 2000–2005 | 2005–2010 | 2010–2015 |
|---|---|---|---|
| P_POP | 44.83% | 10.58% | 2.39% |
| T_FAI | 32.55% | 8.51% | 2.63% |
| GDP | 29.94% | 27.42% | 5.40% |
| D_GS | 22.14% | 25.18% | 6.93% |
| D_CL | 9.04% | 3.57% | 3.31% |
| ST_GDP | 6.16% | 19.52% | 5.67% |
| ELE | 5.21% | 15.28% | 5.26% |
| SLP | 4.83% | 16.95% | 4.75% |
| D_RV | 3.96% | 7.47% | 3.95% |
| D_RD | 2.96% | 4.98% | 2.25% |
| Factors | P_POP | GDP | ST_GDP | T_FAI | D_GS | D_RD | ELE | SLP | D_RV | D_CL |
|---|---|---|---|---|---|---|---|---|---|---|
| P_POP | 0.4483 | |||||||||
| GDP | 0.4988 | 0.2994 | ||||||||
| ST_GDP | 0.4983 | 0.4910 * | 0.0616 | |||||||
| T_FAI | 0.5022 | 0.3332 | 0.5076 * | 0.3255 | ||||||
| D_GS | 0.5201 | 0.3348 | 0.2869 * | 0.3424 | 0.2214 | |||||
| D_RD | 0.4551 | 0.3054 | 0.0952 * | 0.3401 | 0.2338 | 0.0296 | ||||
| ELE | 0.4660 | 0.3169 | 0.1091 | 0.3489 | 0.2351 | 0.0823 | 0.0521 | |||
| SLP | 0.4707 | 0.3229 | 0.0990 | 0.3733 | 0.2489 | 0.0754 | 0.0672 | 0.0483 | ||
| D_RV | 0.4646 | 0.3144 | 0.1219 * | 0.3830 * | 0.2540 | 0.0699 | 0.0968 * | 0.0974 * | 0.0396 | |
| D_CL | 0.4970 | 0.4508 | 0.1243 | 0.4023 | 0.2842 | 0.1689 * | 0.1139 | 0.1230 | 0.2308 * | 0.0904 |
| Factors | P_POP | GDP | ST_GDP | T_FAI | D_GS | D_RD | ELE | SLP | D_RV | D_CL |
|---|---|---|---|---|---|---|---|---|---|---|
| P_POP | 0.1058 | |||||||||
| GDP | 0.3150 | 0.2742 | ||||||||
| ST_GDP | 0.3270 * | 0.3104 | 0.1952 | |||||||
| T_FAI | 0.1469 | 0.2965 | 0.3244 * | 0.0851 | ||||||
| D_GS | 0.4042 * | 0.3326 | 0.3468 | 0.2645 | 0.2518 | |||||
| D_RD | 0.1475 | 0.2873 | 0.2262 | 0.1273 | 0.2755 | 0.0498 | ||||
| ELE | 0.2163 | 0.3438 | 0.2535 | 0.2156 | 0.3086 | 0.1829 | 0.1528 | |||
| SLP | 0.2321 | 0.3699 | 0.2880 | 0.2327 | 0.3522 | 0.1929 | 0.2020 | 0.1695 | ||
| D_RV | 0.1841 * | 0.3684 * | 0.3549 * | 0.2068 * | 0.3602 * | 0.1267 * | 0.2138 | 0.2369 | 0.0747 | |
| D_CL | 0.1216 | 0.2912 | 0.2123 | 0.1531 * | 0.2777 | 0.1065 * | 0.1703 | 0.1962 | 0.1984 * | 0.0358 |
| Factor | P_POP | GDP | ST_GDP | T_FAI | D_GS | D_RD | ELE | SLP | D_RV | D_CL |
|---|---|---|---|---|---|---|---|---|---|---|
| P_POP | 0.0239 | |||||||||
| GDP | 0.0887 * | 0.0540 | ||||||||
| ST_GDP | 0.0753 | 0.1004 | 0.0567 | |||||||
| T_FAI | 0.0415 | 0.0854 * | 0.0680 | 0.0263 | ||||||
| D_GS | 0.1078 * | 0.0838 | 0.0988 | 0.1095 * | 0.0693 | |||||
| D_RD | 0.0438 | 0.0710 | 0.0746 | 0.0495 | 0.0859 | 0.0225 | ||||
| ELE | 0.0686 | 0.0815 | 0.0870 | 0.0746 | 0.0922 | 0.0722 | 0.0526 | |||
| SLP | 0.0770 * | 0.0839 | 0.0946 | 0.0675 | 0.0996 | 0.0645 | 0.0688 | 0.0475 | ||
| D_RV | 0.0776 * | 0.1066 * | 0.0993 * | 0.0797 * | 0.1125 * | 0.0639 * | 0.0894 | 0.0894 * | 0.0395 | |
| D_CL | 0.0702 * | 0.0777 | 0.0833 | 0.0669 * | 0.0954 | 0.0760 * | 0.0615 | 0.0676 | 0.0967 * | 0.0331 |
© 2019 by the authors. Licensee MDPI, Basel, Switzerland. This article is an open access article distributed under the terms and conditions of the Creative Commons Attribution (CC BY) license (http://creativecommons.org/licenses/by/4.0/).
Share and Cite
Yan, Y.; Ju, H.; Zhang, S.; Jiang, W. Spatiotemporal Patterns and Driving Forces of Urban Expansion in Coastal Areas: A Study on Urban Agglomeration in the Pearl River Delta, China. Sustainability 2020, 12, 191. https://doi.org/10.3390/su12010191
Yan Y, Ju H, Zhang S, Jiang W. Spatiotemporal Patterns and Driving Forces of Urban Expansion in Coastal Areas: A Study on Urban Agglomeration in the Pearl River Delta, China. Sustainability. 2020; 12(1):191. https://doi.org/10.3390/su12010191
Chicago/Turabian StyleYan, Yichen, Hongrun Ju, Shengrui Zhang, and Wei Jiang. 2020. "Spatiotemporal Patterns and Driving Forces of Urban Expansion in Coastal Areas: A Study on Urban Agglomeration in the Pearl River Delta, China" Sustainability 12, no. 1: 191. https://doi.org/10.3390/su12010191
APA StyleYan, Y., Ju, H., Zhang, S., & Jiang, W. (2020). Spatiotemporal Patterns and Driving Forces of Urban Expansion in Coastal Areas: A Study on Urban Agglomeration in the Pearl River Delta, China. Sustainability, 12(1), 191. https://doi.org/10.3390/su12010191