Dynamic Monitoring and Analysis of Ecological Quality of Pingtan Comprehensive Experimental Zone, a New Type of Sea Island City, Based on RSEI


Abstract
1. Introduction
2. Materials and Methods
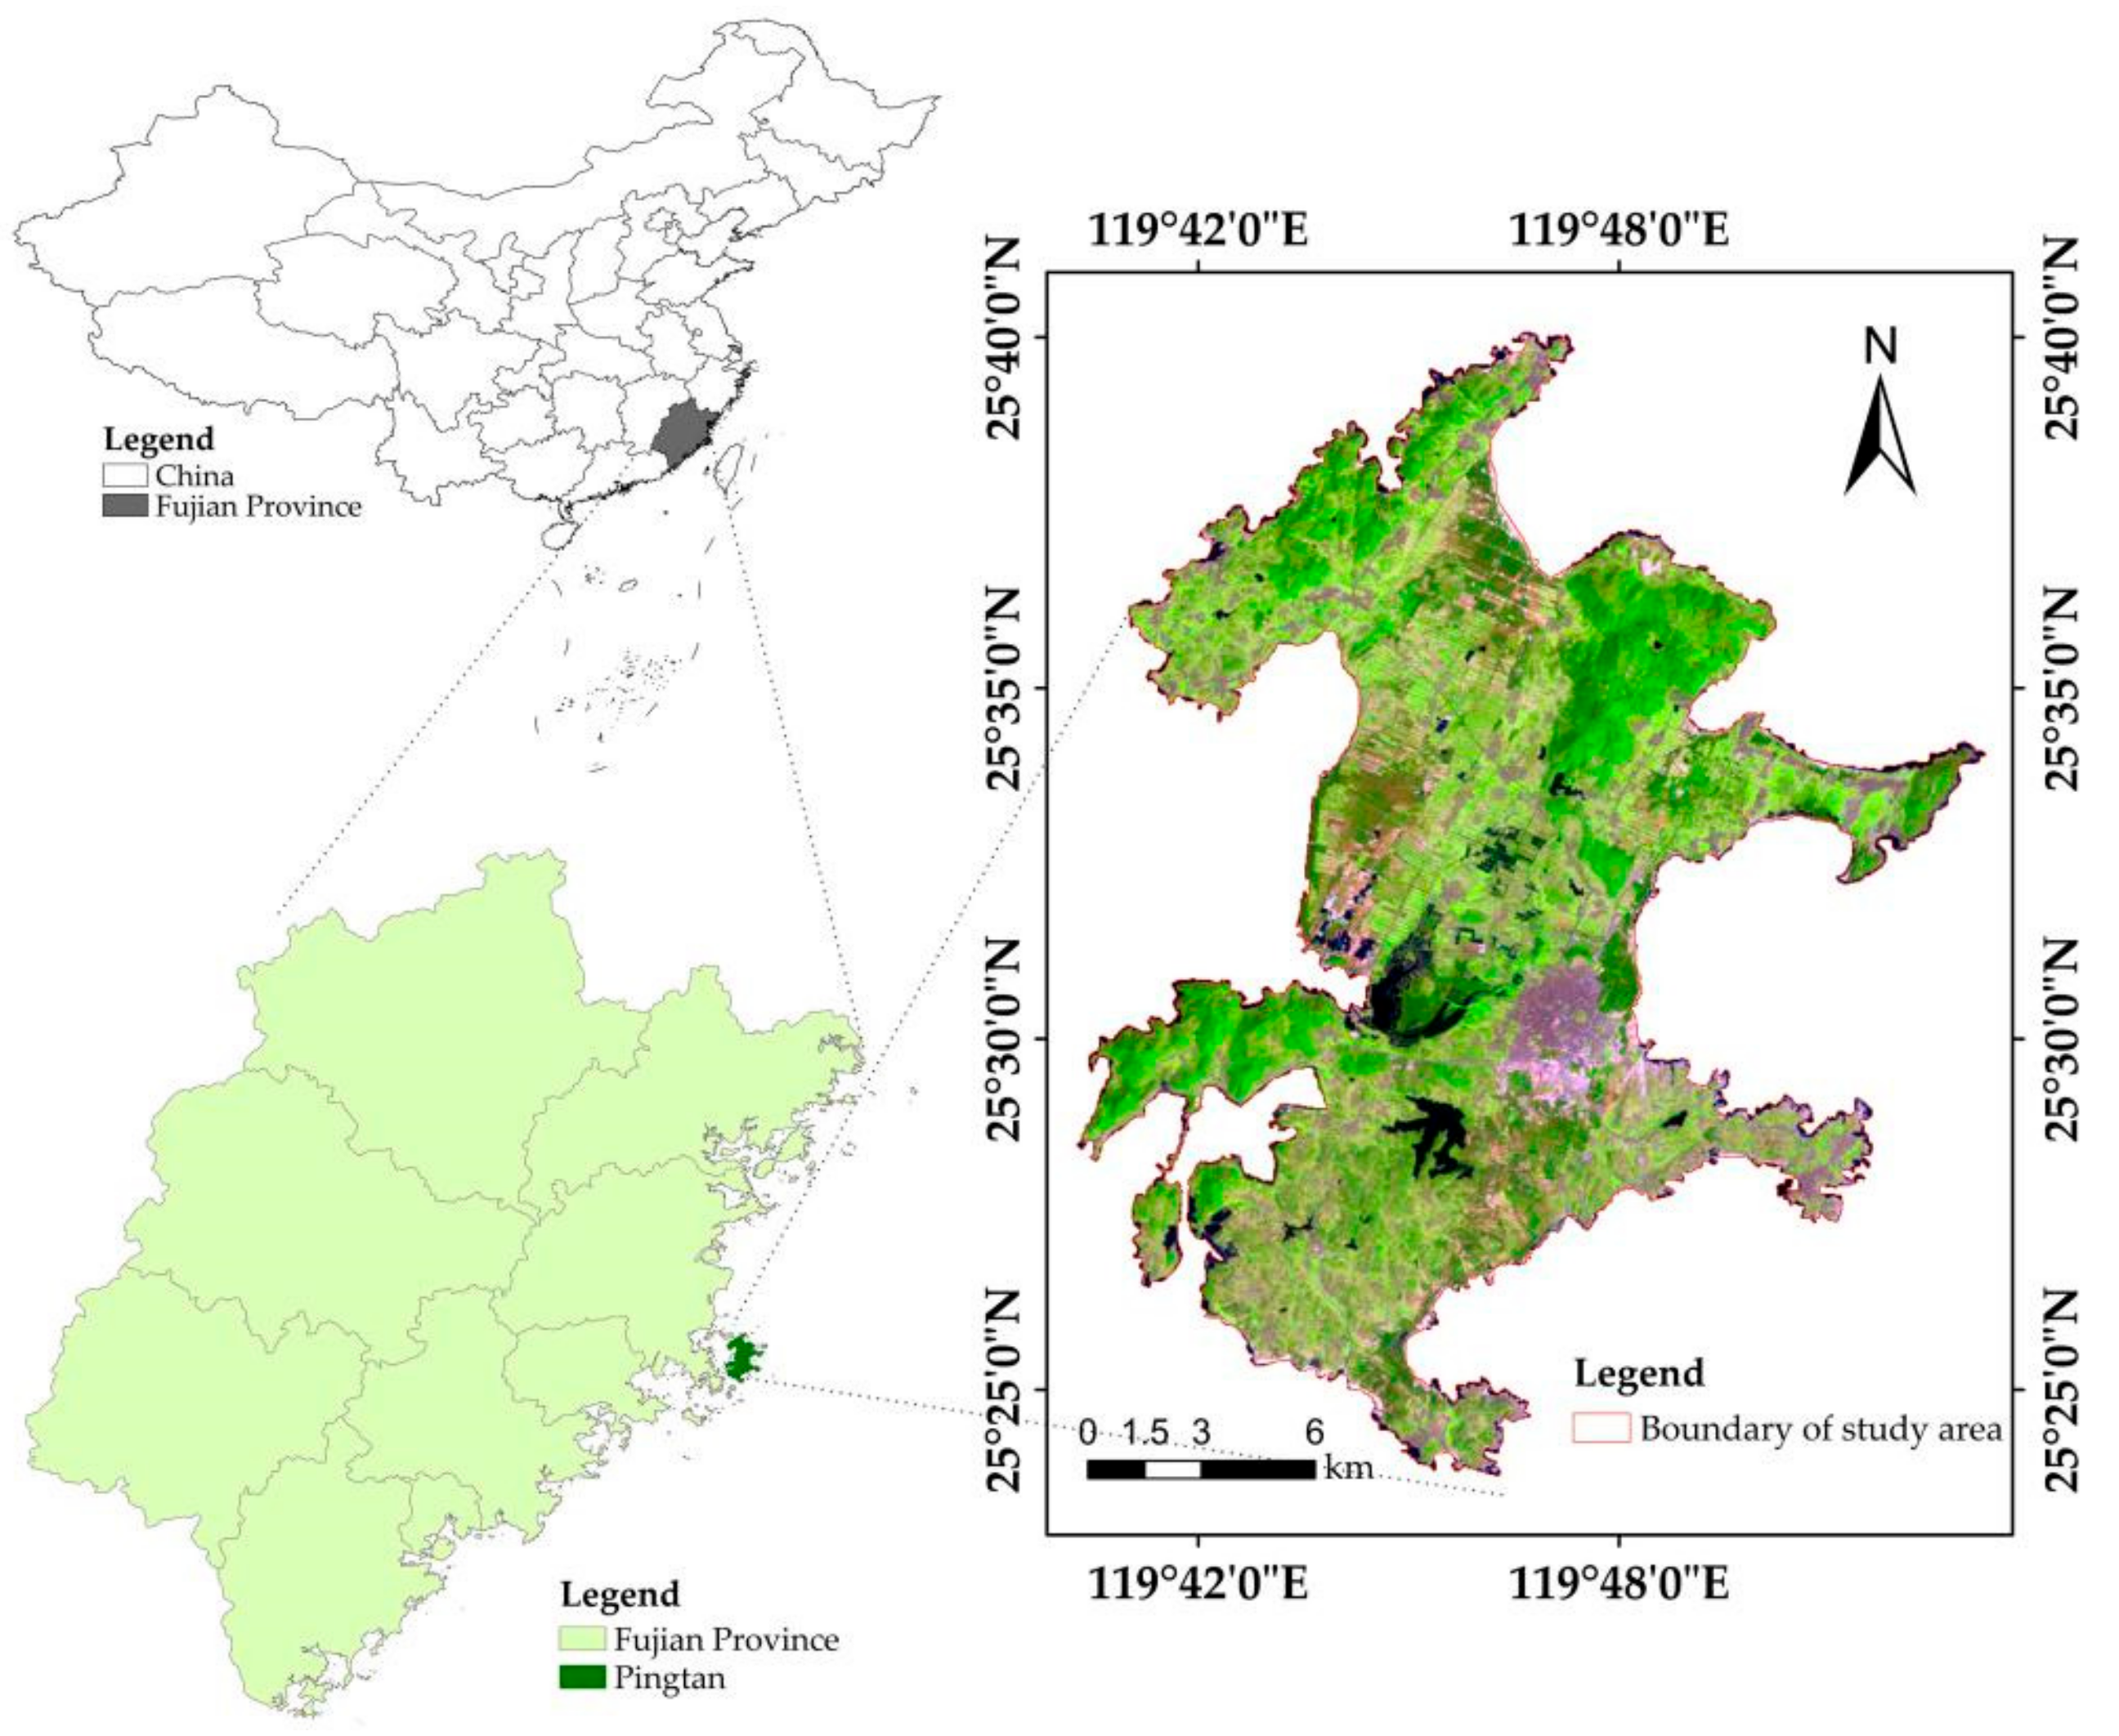
2.1. Study Area
2.2. Data Resources and Image Pre-Processing
2.3. Methodology
2.3.1. The Greenness Index
2.3.2. The Wetness Index
2.3.3. The Dryness Index
2.3.4. The Heat Index
2.3.5. Construction of Remote Sensing-Based Ecological Index (RSEI)
2.3.6. Calculation of RSEI
3. Results
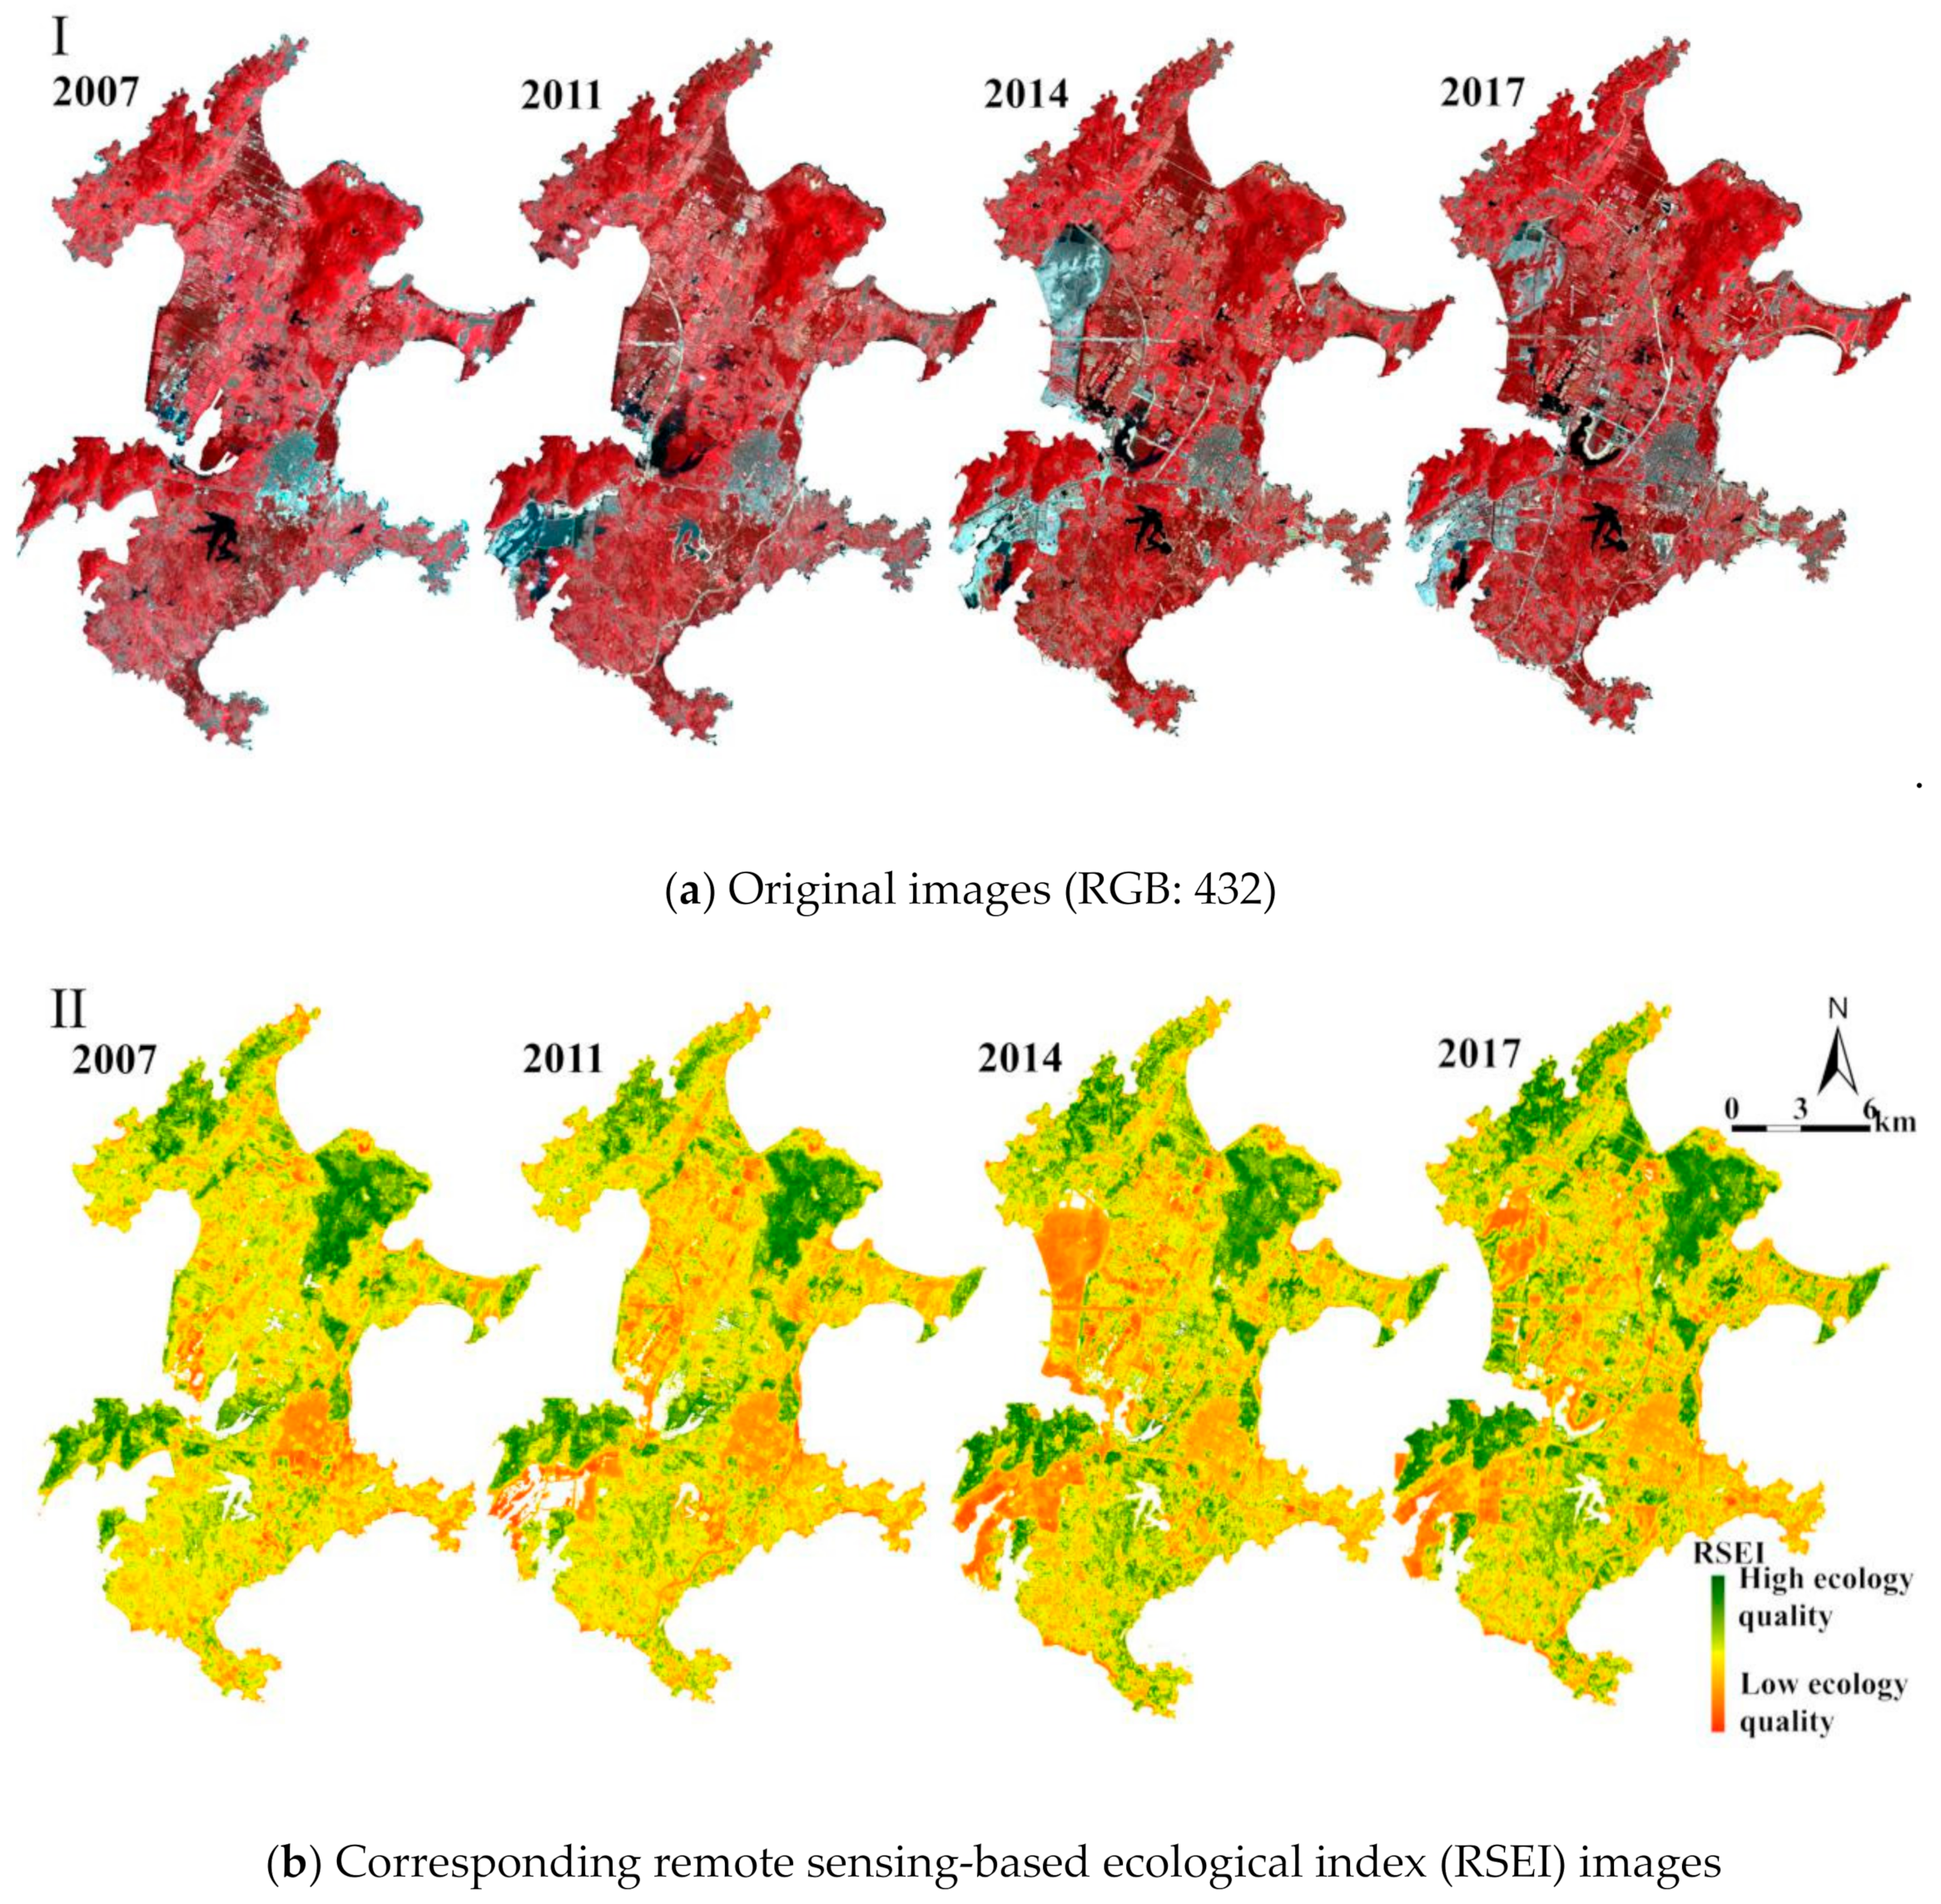
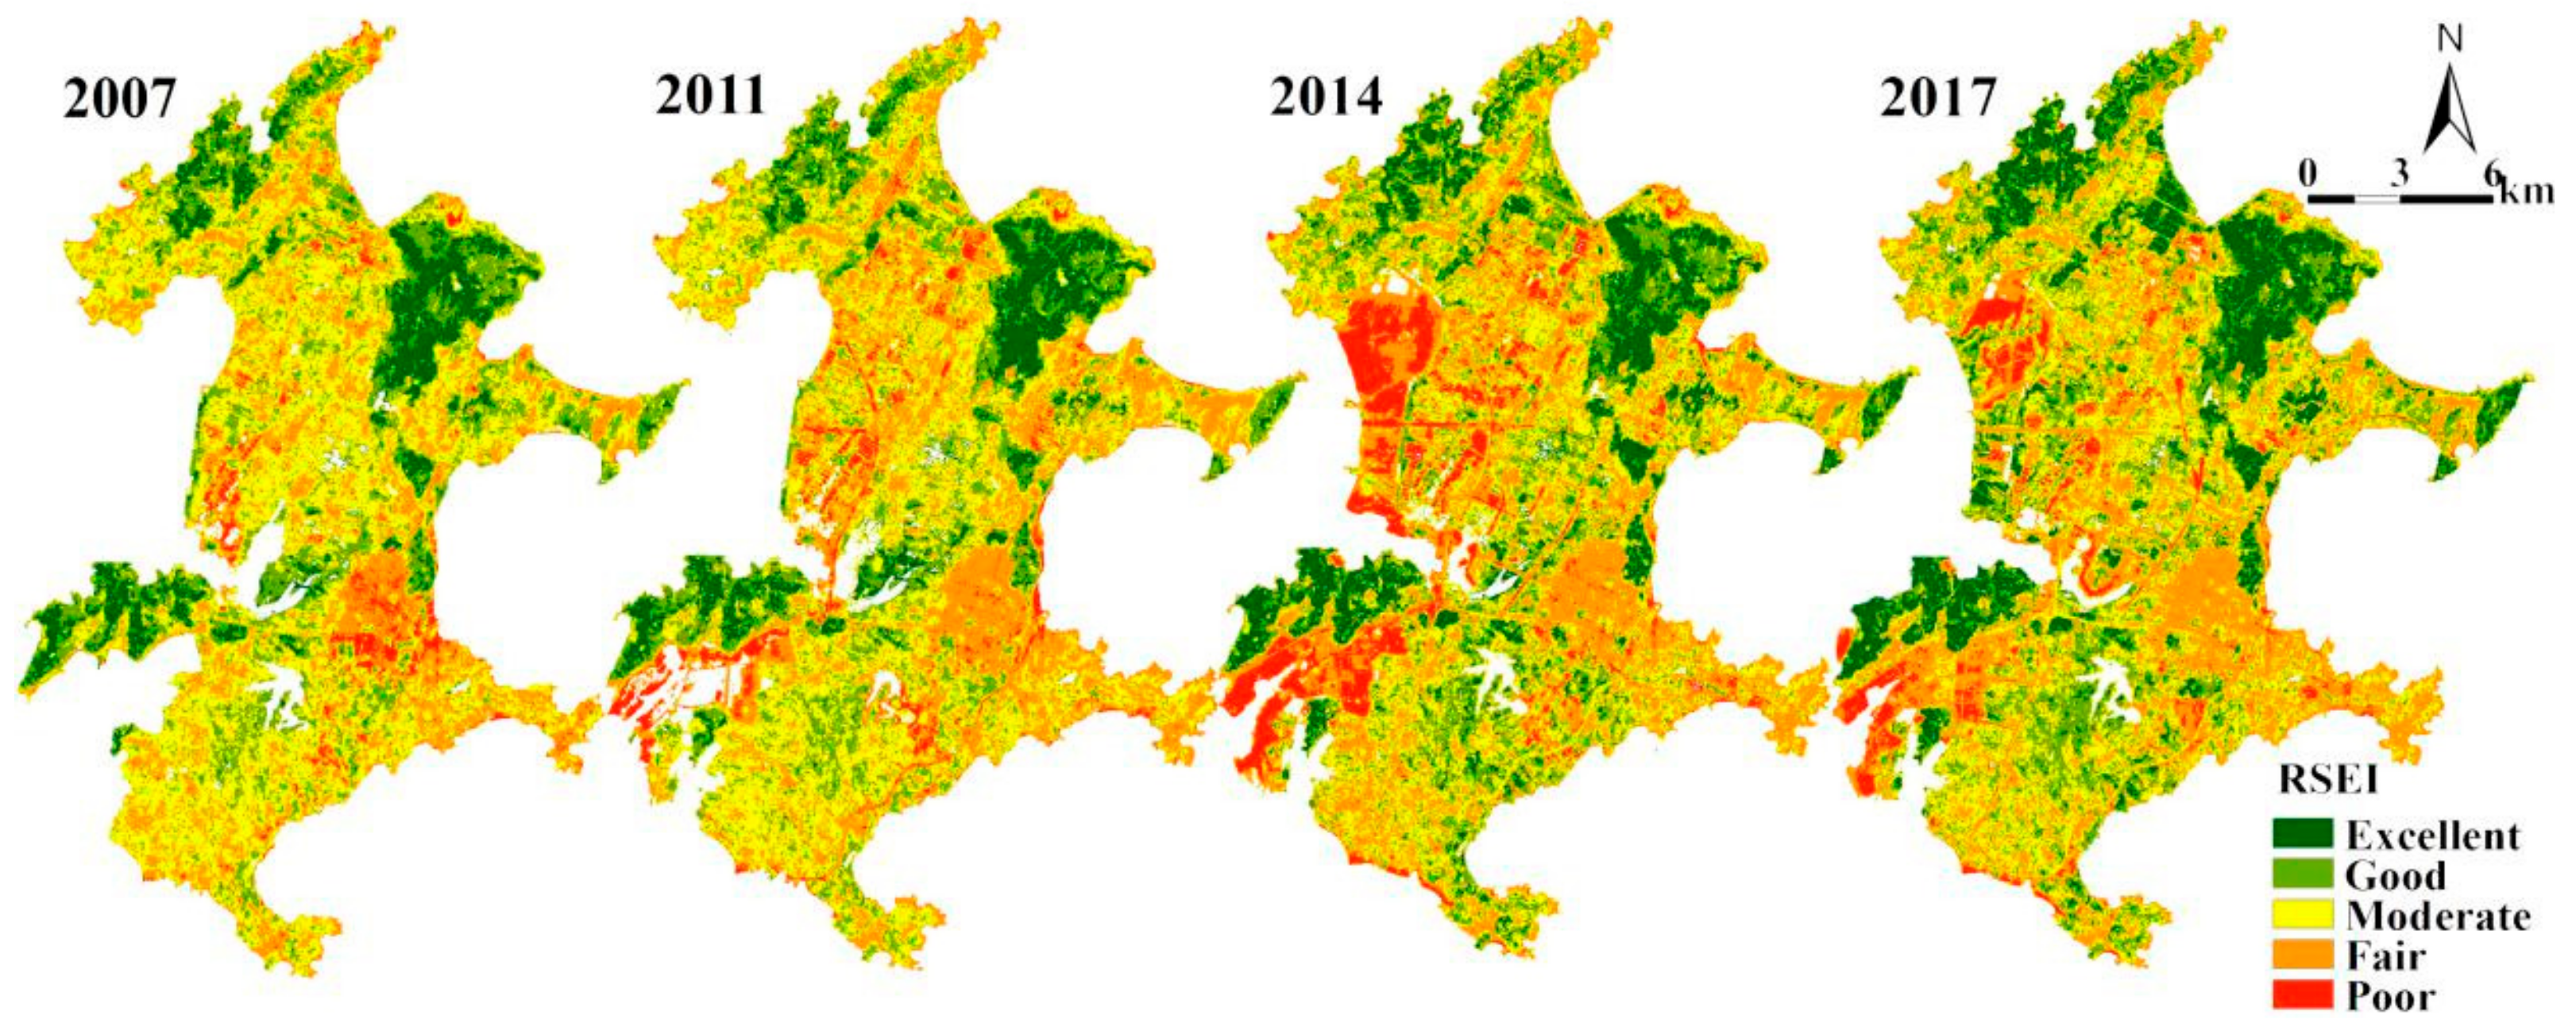
3.1. Pingtan Island Ecological Status
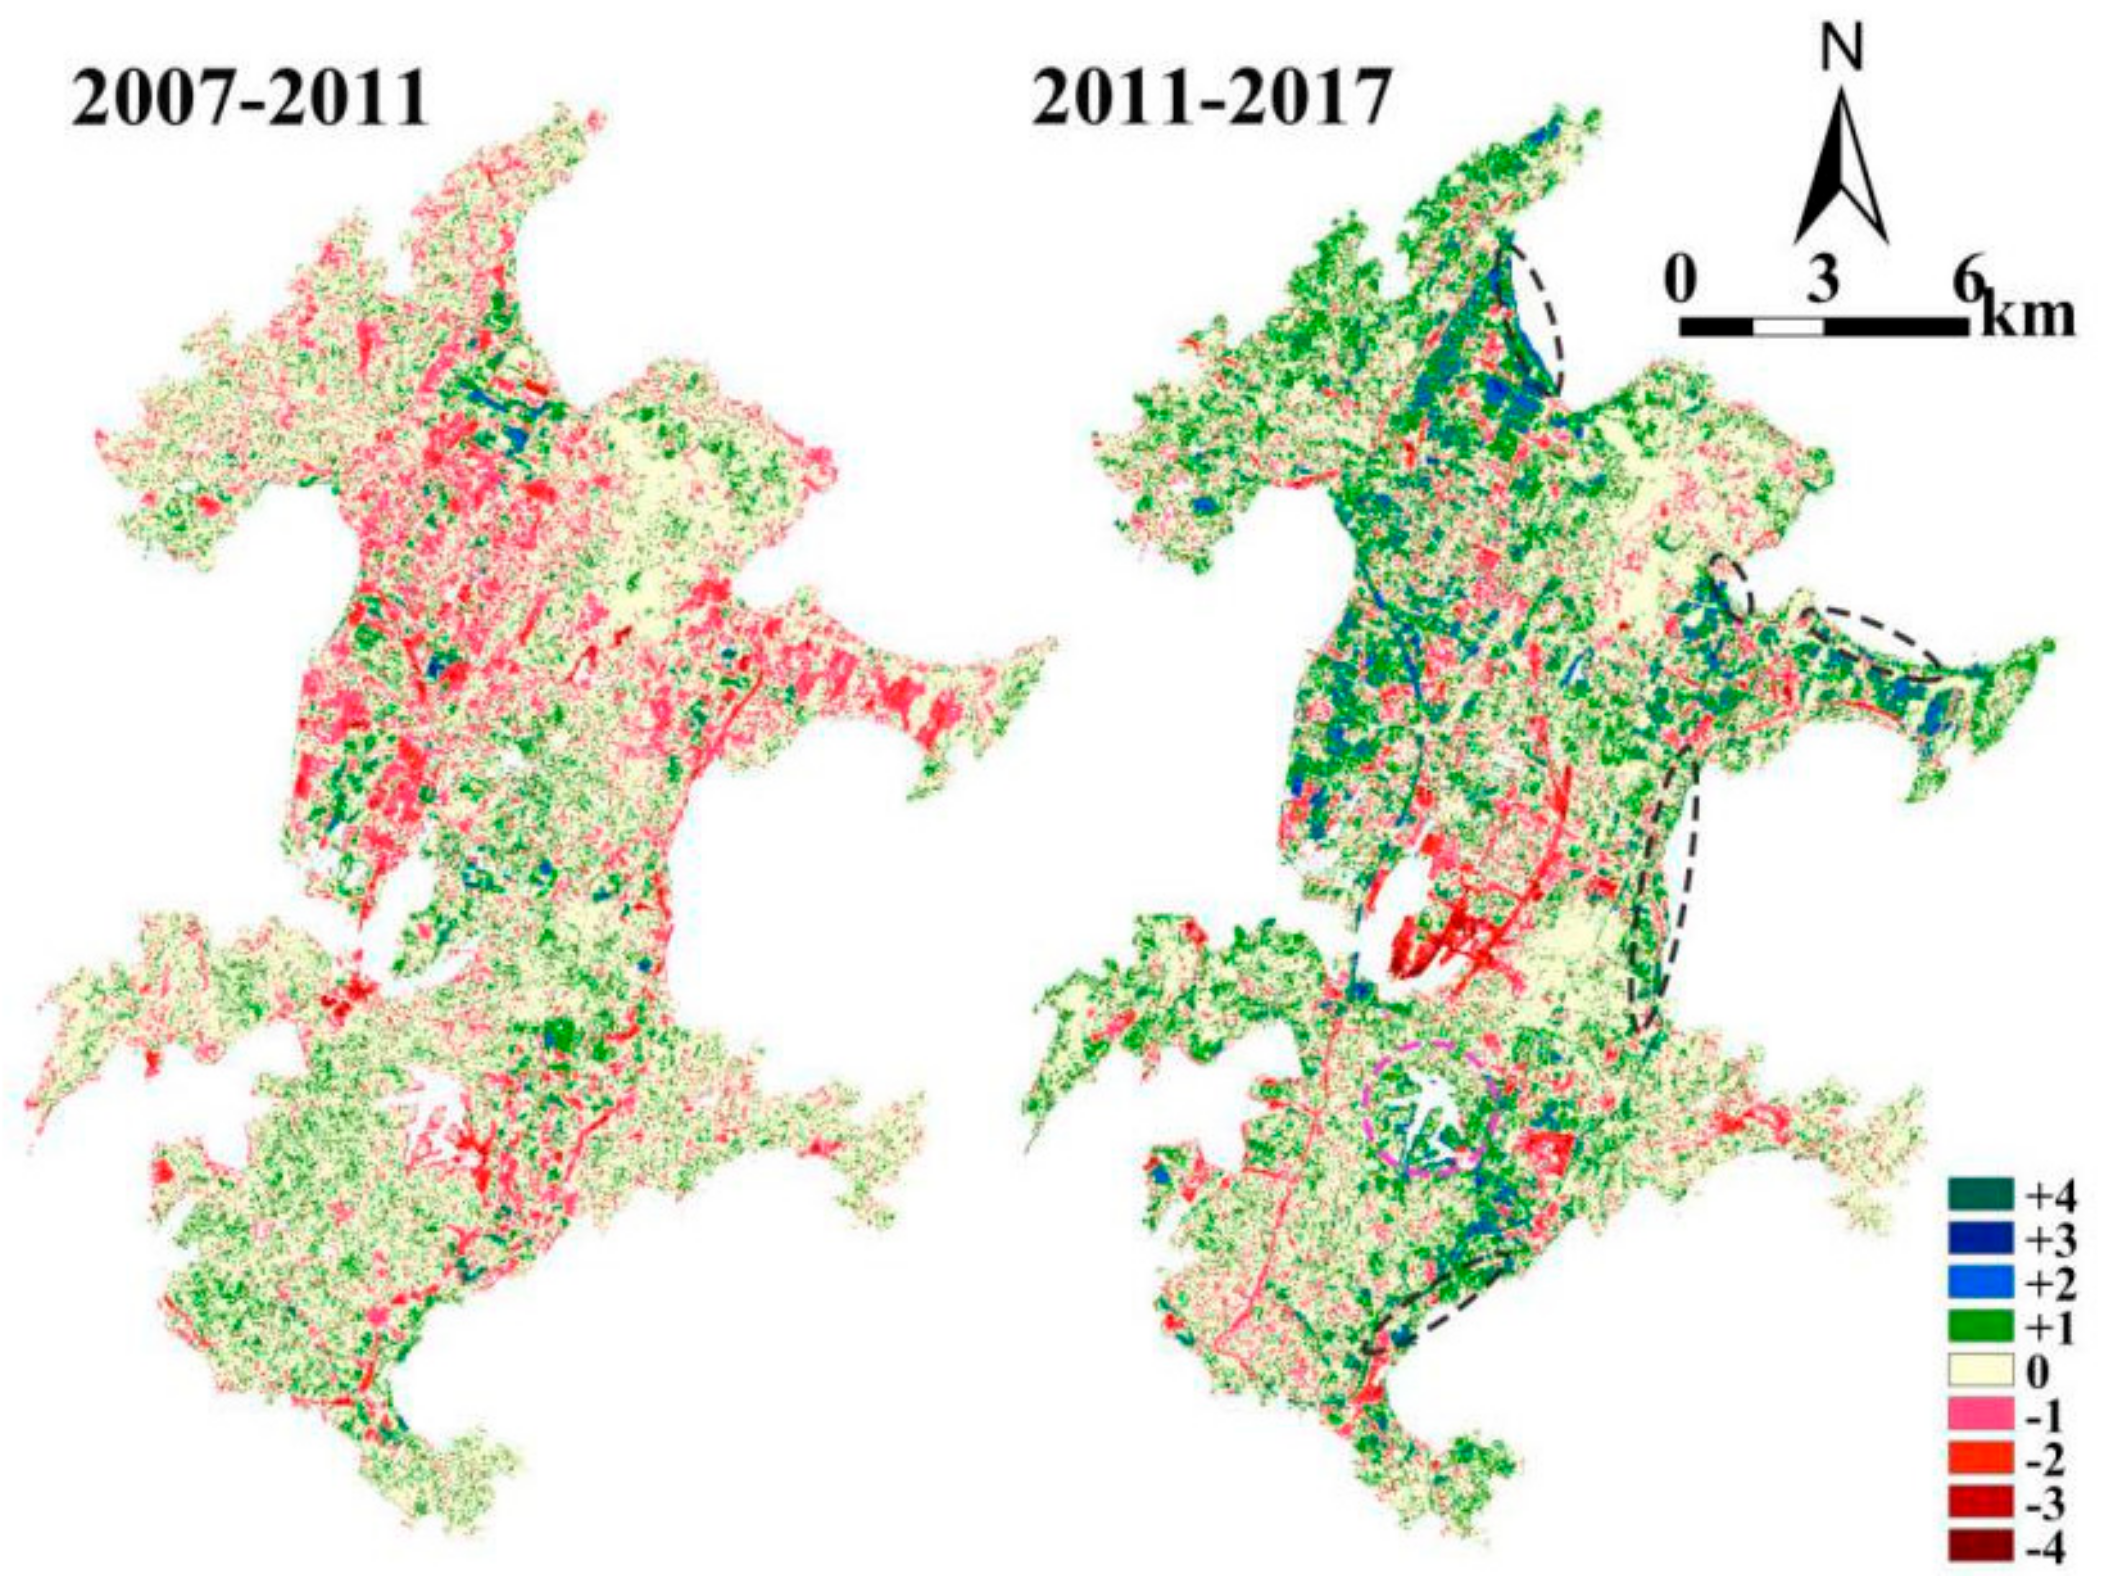
3.2. Dynamic Changes in the Ecological Status of Pingtan Island
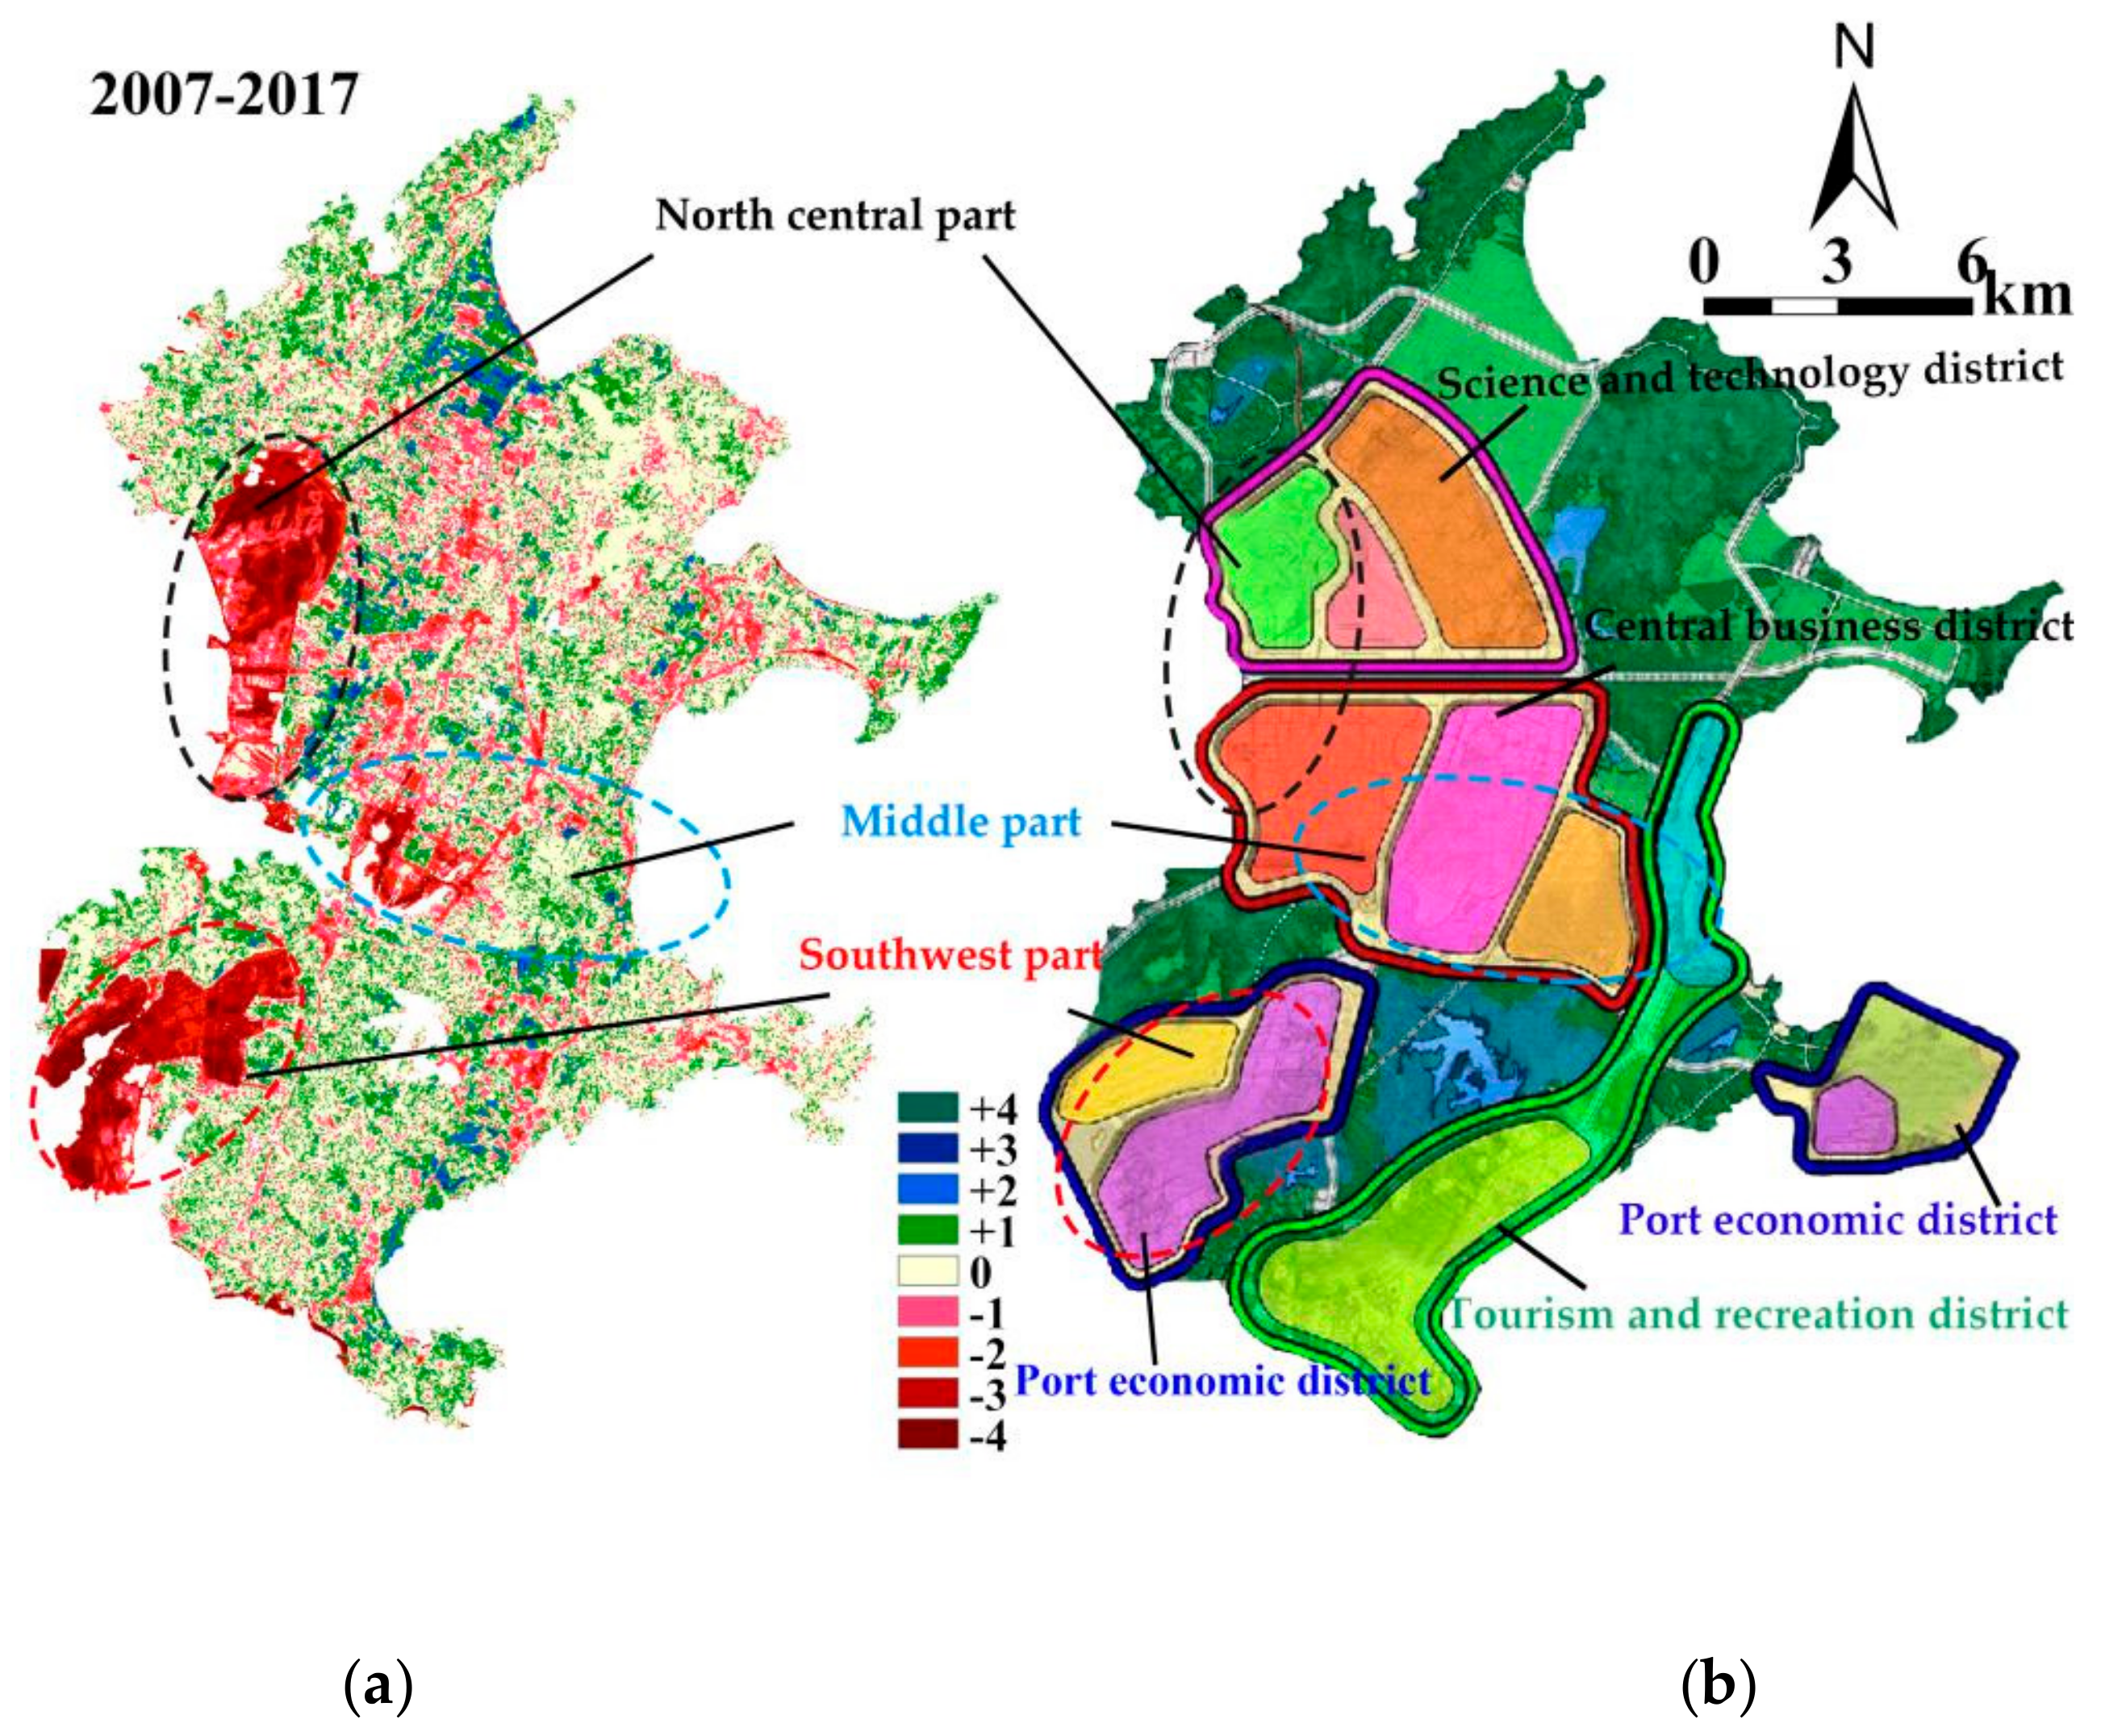
3.3. Ecological Effects of Overall Planning of Pingtan Island
4. Discussion
5. Conclusions
Author Contributions
Funding
Acknowledgments
Conflicts of Interest
References
- Cao, W.; Li, R.; Chi, X.; Chen, N.; Zhang, H.; Zhang, F. Island urbanization and its ecological consequences: A case study in the Zhoushan Island, East China. Ecol. Indic. 2017, 76, 1–14. [Google Scholar] [CrossRef]
- Kerr, J.T.; Ostrovsky, M. From space to species: Ecological applications for remote sensing. Trends Ecol. Evol. 2003, 18, 299–305. [Google Scholar] [CrossRef]
- Katovai, E.; Burley, A.L.; Mayfield, M.M. Understory plant species and functional diversity in the degraded wet tropical forests of Kolombangara Island, Solomon Islands. Biol. Conserv. 2012, 145, 214–224. [Google Scholar] [CrossRef]
- Yuan, C.; Shi, H.S.; Sun, J.K.; Zhen, G.; Ma, D.M. Evaluation on Island Resources and Environment Carrying Capacity under the Background of Urbanization. J. Nat. Resour. 2017, 32, 1374–1384. [Google Scholar]
- Boyd, D.S.; Foody, G.M. An overview of recent remote sensing and GIS based research in ecological informatics. Ecol. Inf. 2011, 6, 25–36. [Google Scholar] [CrossRef]
- Roerink, G.J.; Danes, M.H.G.I. Quantification of Ecological Changes by Remote Sensing. Geophys. Res. 2010, 12, 2010–4643. [Google Scholar]
- Willis, K.S. Remote sensing change detection for ecological monitoring in United States protected areas. Biol. Conserv. 2015, 182, 233–242. [Google Scholar] [CrossRef]
- Crétaux, J.-F.; Jelinski, W.; Calmant, S.; Kouraev, A.; Vuglinski, V.; Berge-Nguyen, M.; Gennero, M.-C.; Nino, F.; Abarca Del Rio, R.; Cazenave, A.; et al. SOLS: A lake database to monitor in the Near Real Time water level and storage variations from remote sensing data. Adv. Space Res. 2011, 47, 1497–1507. [Google Scholar] [CrossRef]
- Ochoa-Gaona, S.; Kampichler, C.; Jong, B.H.J.D.; Hernández, S.; Geissen, V.; Huerta, E. A multi-criterion index for the evaluation of local tropical forest conditions in Mexico. Forest Ecol. Manag. 2010, 260, 618–627. [Google Scholar] [CrossRef]
- Xu, H.Q. A new index-based built-up index (IBI) and its eco-environmental significance. Remote Sens. Technol. Appl. 2007, 22, 301–308. [Google Scholar]
- Wen, X.L.; Xu, H.Q. Remote sensing analysis of impact of Fuzhou City expansion on water quality of lower Minjiang River, China. Sci. Geogr. Sin. 2010, 30, 624–629. [Google Scholar]
- Suter, G.W.; Norton, S.B.; Cormier, S.M. A methodology for inferring the causes of observed impairments in aquatic ecosystems. Environ. Toxicolo. Chem. 2002, 21, 1101–1111. [Google Scholar] [CrossRef]
- Mozumder, C.; Tripathi, N.K.; Tipdecho, T. Ecosystem evaluation (1989–2012) of Ramsar wetland Deepor Beel using satellite-derived indices. Environ. Monit. Assess 2014, 186, 7909–7927. [Google Scholar] [CrossRef] [PubMed]
- Hazaymeh, K.; Hassan, Q.K. A remote sensing-based agricultural drought indicator and its implementation over a semi-arid region, Jordan. J. Arid Land. 2017, 3, 4–15. [Google Scholar] [CrossRef]
- Yanchuang, Z.; Xinyuan, W.; Novillo, C.J.; Patricia, A.F.; René, V.J.; Fernando, T.M. Albedo estimated from remote sensing correlates with ecosystem multifunctionality in global drylands. J. Arid Environ. 2018, 157, 116–123. [Google Scholar]
- Rodgers, K.S.; Kido, M.H.; Jokiel, P.L.; Eric, K.B. Use of Integrated Landscape Indicators to Evaluate the Health of Linked Watersheds and Coral Reef Environments in the Hawaiian Islands. Environ. Manag. 2012, 50, 21–30. [Google Scholar] [CrossRef] [PubMed]
- Farhan, A.R.; Lim, S. Vulnerability assessment of ecological conditions in Seribu Islands, Indonesia. Ocean Coast. Manag. 2012, 65, 1–14. [Google Scholar] [CrossRef]
- Mukherjee, N.; Siddique, G. Climate change and vulnerability assessment in Mousuni Island: South 24 Parganas District. Spat. Inf. Res. 2018, 26, 163–174. [Google Scholar] [CrossRef]
- Xu, H.Q. A remote sensing index for assessment of regional ecological changes. China Environ. Sci. 2013, 33, 889–897. (In Chinese) [Google Scholar]
- Hu, X.S.; Xu, H.Q. A new remote sensing index for assessing the spatial heterogeneity in urban ecological quality: A case from Fuzhou City, China. Ecol. Indic. 2018, 89, 11–21. [Google Scholar] [CrossRef]
- Xu, H.Q.; Wang, M.Y.; Shi, T.T.; Guan, H.D.; Fang, G.Y.; Lin, Z.L. Prediction of ecological effects of potential population and impervious surface increases using a remote sensing based ecological index (RSEI). Ecol. Indic. 2018, 93, 730–740. [Google Scholar] [CrossRef]
- Bai, X.Y.; Du, P.J.; Guo, S.C.; Zhang, P.; Lin, C.; Tang, P.F.; Zhang, C. Monitoring Land Cover Change and Disturbance of the Mount Wutai World Cultural Landscape Heritage Protected Area, Based on Remote Sensing Time-Series Images from 1987 to 2018. Remote Sens. 2019, 11, 1332. [Google Scholar] [CrossRef]
- Yue, H.; Liu, Y.; Li, Y.; Lu, Y. Eco-environmental quality assessment in China’s 35 major cities based on remote sensing ecological index. IEEE Access 2019, 7, 51295–51311. [Google Scholar] [CrossRef]
- Shan, W.; Jin, X.B.; Ren, J.; Wang, Y.C.; Xu, Z.G.; Fan, Y.T.; Gu, Z.M.; Hong, C.Q.; Lin, J.H.; Zhou, Y.K. Ecological environment quality assessment based on remote sensing data for land consolidation. J. Clean. Prod. 2019, 239, 118126. [Google Scholar] [CrossRef]
- Chander, G.; Markham, B.L.; Helder, D.L.l. Summary of current radiometric calibration coefficients for Landsat MSS, TM, ETM+, and EO-1 ALI sensors. Remote Sens. Environ. 2009, 113, 893–903. [Google Scholar] [CrossRef]
- Chavez, P.S., Jr. Image-based atmospheric corrections: Revisited and revised. Photogramm. Eng. Remote Sens. 1996, 62, 1025–1036. [Google Scholar]
- Xu, H.Q. Image-based normalization technique used for Landsat TM/ETM+imagery. Geomatics Inf. Sci. Wuhan Univ. 2007, 32, 62–66. (In Chinese) [Google Scholar]
- Rouse, J.W.; Haas, R.H.; Schell, J.A.; Deering, D.W. Monitoring vegetation systems in the Great Plains with ERTS. In ERTS Symposium Conference; NASASP-351: Greenbelt, MD, USA, 1973; pp. 309–317. [Google Scholar]
- Eric, P.C. A TM Tasseled Cap equivalent transformation for reflectance factor data. Remote Sens. Environ. 1985, 17, 301–306. [Google Scholar]
- Xu, H.Q. Analysis of Impervious Surface and its Impact on Urban Heat Environment using the Normalized Difference Impervious Surface Index (NDISI). Photogramm. Eng. Remote Sens. 2010, 76, 557–565. [Google Scholar] [CrossRef]
- Jimenez-Munoz, J.C.; Cristobal, J.; Sobrino, J.A.; Sòria, G.; Ninyerola, M.; Pons, X. Revision of the Single-Channel Algorithm for Land Surface Temperature Retrieval from Landsat Thermal-Infrared Data. IEEE Trans. Geosci. Remote Sens. 2009, 47, 339–349. [Google Scholar] [CrossRef]
- Boelman, N.T.; Stieglitz, M.; Rueth, H.M.; Sommerkon, M.; Grifin, K.L.; Shaver, G.R.; Gamon, J.A. Response of NDVI, Biomass, and Ecosystem Gas Exchange to Long-Term Warming and Fertilization in Wet Sedge Tundra. Oecologia 2003, 135, 414–421. [Google Scholar] [CrossRef] [PubMed]
- Verbesselt, J.; Jonsson, P.; Lhermitte, S.; Aardt, J.V.; Coppin, P. Evaluating satellite and climate data-derived indices as fire risk indicators in savanna ecosystems. IEEE Trans. Geosci. Remote Sens. 2006, 44, 1622–1632. [Google Scholar] [CrossRef]
- Jin, S.; Sader, S.A. Comparison of time series tasseled cap wetness and the normalized difference moisture index in detecting forest disturbances. Remote Sens. Environ. 2005, 94, 364–372. [Google Scholar] [CrossRef]
- Baig, M.H.A.; Zhang, L.; Shuai, T.; Tong, Q.X. Derivation of a tasselled cap transformation based on Landsat 8 at-satellite reflectance. Remote Sens. Lett. 2014, 5, 423–431. [Google Scholar] [CrossRef]
- Xu, H.Q. A new index for delineating built-up land features in satellite imagery. Int. J. Remote Sens. 2008, 29, 4269–4276. [Google Scholar] [CrossRef]
- Essa, W.; Verbeiren, B.; Van der Kwast, J.; Van de Voorde, T.; Batelaan, O. Evaluation of the DisTrad thermal sharpening methodology for urban areas. Int. J. Appl. Earth Obs. Geoinf. 2012, 19, 163–172. [Google Scholar] [CrossRef]
- Julia, B.; John, S.; Simon, H.; Raqueno, N.G.; Markham, B.L.; Radocinski, R.G. Landsat-8 Thermal Infrared Sensor (TIRS) Vicarious Radiometric Calibration. Remote Sens. 2014, 6, 11607–11626. [Google Scholar]
- Nichol, J. Remote Sensing of Urban Heat Islands by Day and Night. Photogramm. Eng. Remote Sens. 2005, 71, 613–622. [Google Scholar] [CrossRef]
- Sobrino, J.A.; Jimenez-Munoz, J.C.; Paolini, L. Land surface retrieval from LANDSAT TM5. Remote Sens. Environ. 2004, 90, 434–440. [Google Scholar] [CrossRef]
- Fujian Urban and Rural Planning and Design Institute. Available online: http://www.fjplan.org/chgnr.asp?id=225 (accessed on 10 September 2019).
- PTNET. Available online: http://en.ptnet.cn/index.html (accessed on 10 December 2019).
- Sohu. Available online: http://www.sohu.com/a/167112662_263546 (accessed on 10 December 2019).


| Satellite | Acquisition Date |
|---|---|
| Landsat TM | 2007-09-14 |
| 2011-09-09 | |
| Landsat OLI/TIRS | 2014-09-01 |
| 2017-09-25 |
| Index | 2007 | Rate 07–11 (%) | 2011 | Rate 11–14 (%) | 2014 | Rate 14–17 (%) | 2017 | ||||
|---|---|---|---|---|---|---|---|---|---|---|---|
| Mean | PC1 Load | Mean | PC1 Load | Mean | PC1 Load | Mean | PC1 Load | ||||
| NDVI | 0.628 | −0.474 | −8.92 | 0.572 | −0.485 | 6.64 | 0.610 | −0.496 | 1.97 | 0.622 | −0.497 |
| WET | 0.757 | −0.509 | −5.02 | 0.719 | −0.509 | 0.83 | 0.725 | −0.504 | −6.76 | 0.676 | −0.506 |
| NDBSI | 0.536 | 0.541 | 1.66 | 0.550 | 0.541 | −4.18 | 0.527 | 0.535 | 4.93 | 0.553 | 0.537 |
| LST | 0.448 | 0.473 | 23.44 | 0.553 | 0.461 | −17.72 | 0.455 | 0.462 | −4.62 | 0.434 | 0.457 |
| RSEI | 0.519 | −2.50 | 0.506 | −0.79 | 0.502 | 4.18 | 0.523 | ||||
| RSEI Level | 2007 | 2011 | 2014 | 2017 | ||||
|---|---|---|---|---|---|---|---|---|
| Area (km2) | Pct. (%) | Area (km2) | Pct. (%) | Area (km2) | Pct. (%) | Area (km2) | Pct. (%) | |
| Level 1: Poor (0.0~0.2) | 6.24 | 2.5 | 9.41 | 3.7 | 24.99 | 9.1 | 11.63 | 4.2 |
| Level 2: Fair (0.2~0.4) | 62.17 | 25.3 | 77.97 | 30.6 | 74.99 | 27.2 | 81.60 | 29.4 |
| Level 3: Moderate (0.4~0.6) | 101.15 | 41.2 | 93.78 | 36.8 | 79.12 | 28.7 | 82.11 | 29.5 |
| Level 4: Good (0.6~0.8) | 55.42 | 22.6 | 53.74 | 21.1 | 65.78 | 23.8 | 66.14 | 23.8 |
| Level 5: Excellent (0.8~1.0) | 20.33 | 8.3 | 19.78 | 7.8 | 31.06 | 11.3 | 36.47 | 13.1 |
| Total | 245.31 | 100 | 254.68 | 100 | 275.93 | 100 | 277.95 | 100 |
| Ecological Change Type | Grade Differential | 2007–2011 | 2011–2017 | ||
|---|---|---|---|---|---|
| Area Proportion (%) | Increase/Decrease in Total (%) | Area Proportion (%) | Increase/Decrease in Total (%) | ||
| Improved | +4 | 0.001 | 15.077 | 0.009 | 32.190 |
| +3 | 0.067 | 0.319 | |||
| +2 | 0.615 | 3.868 | |||
| +1 | 14.394 | 27.994 | |||
| Unchanged | 0 | 64.940 | − | 54.355 | − |
| Degraded | –1 | 17.325 | 19.983 | 10.879 | 13.455 |
| –2 | 2.413 | 2.060 | |||
| –3 | 0.243 | 0.457 | |||
| –4 | 0.002 | 0.059 | |||
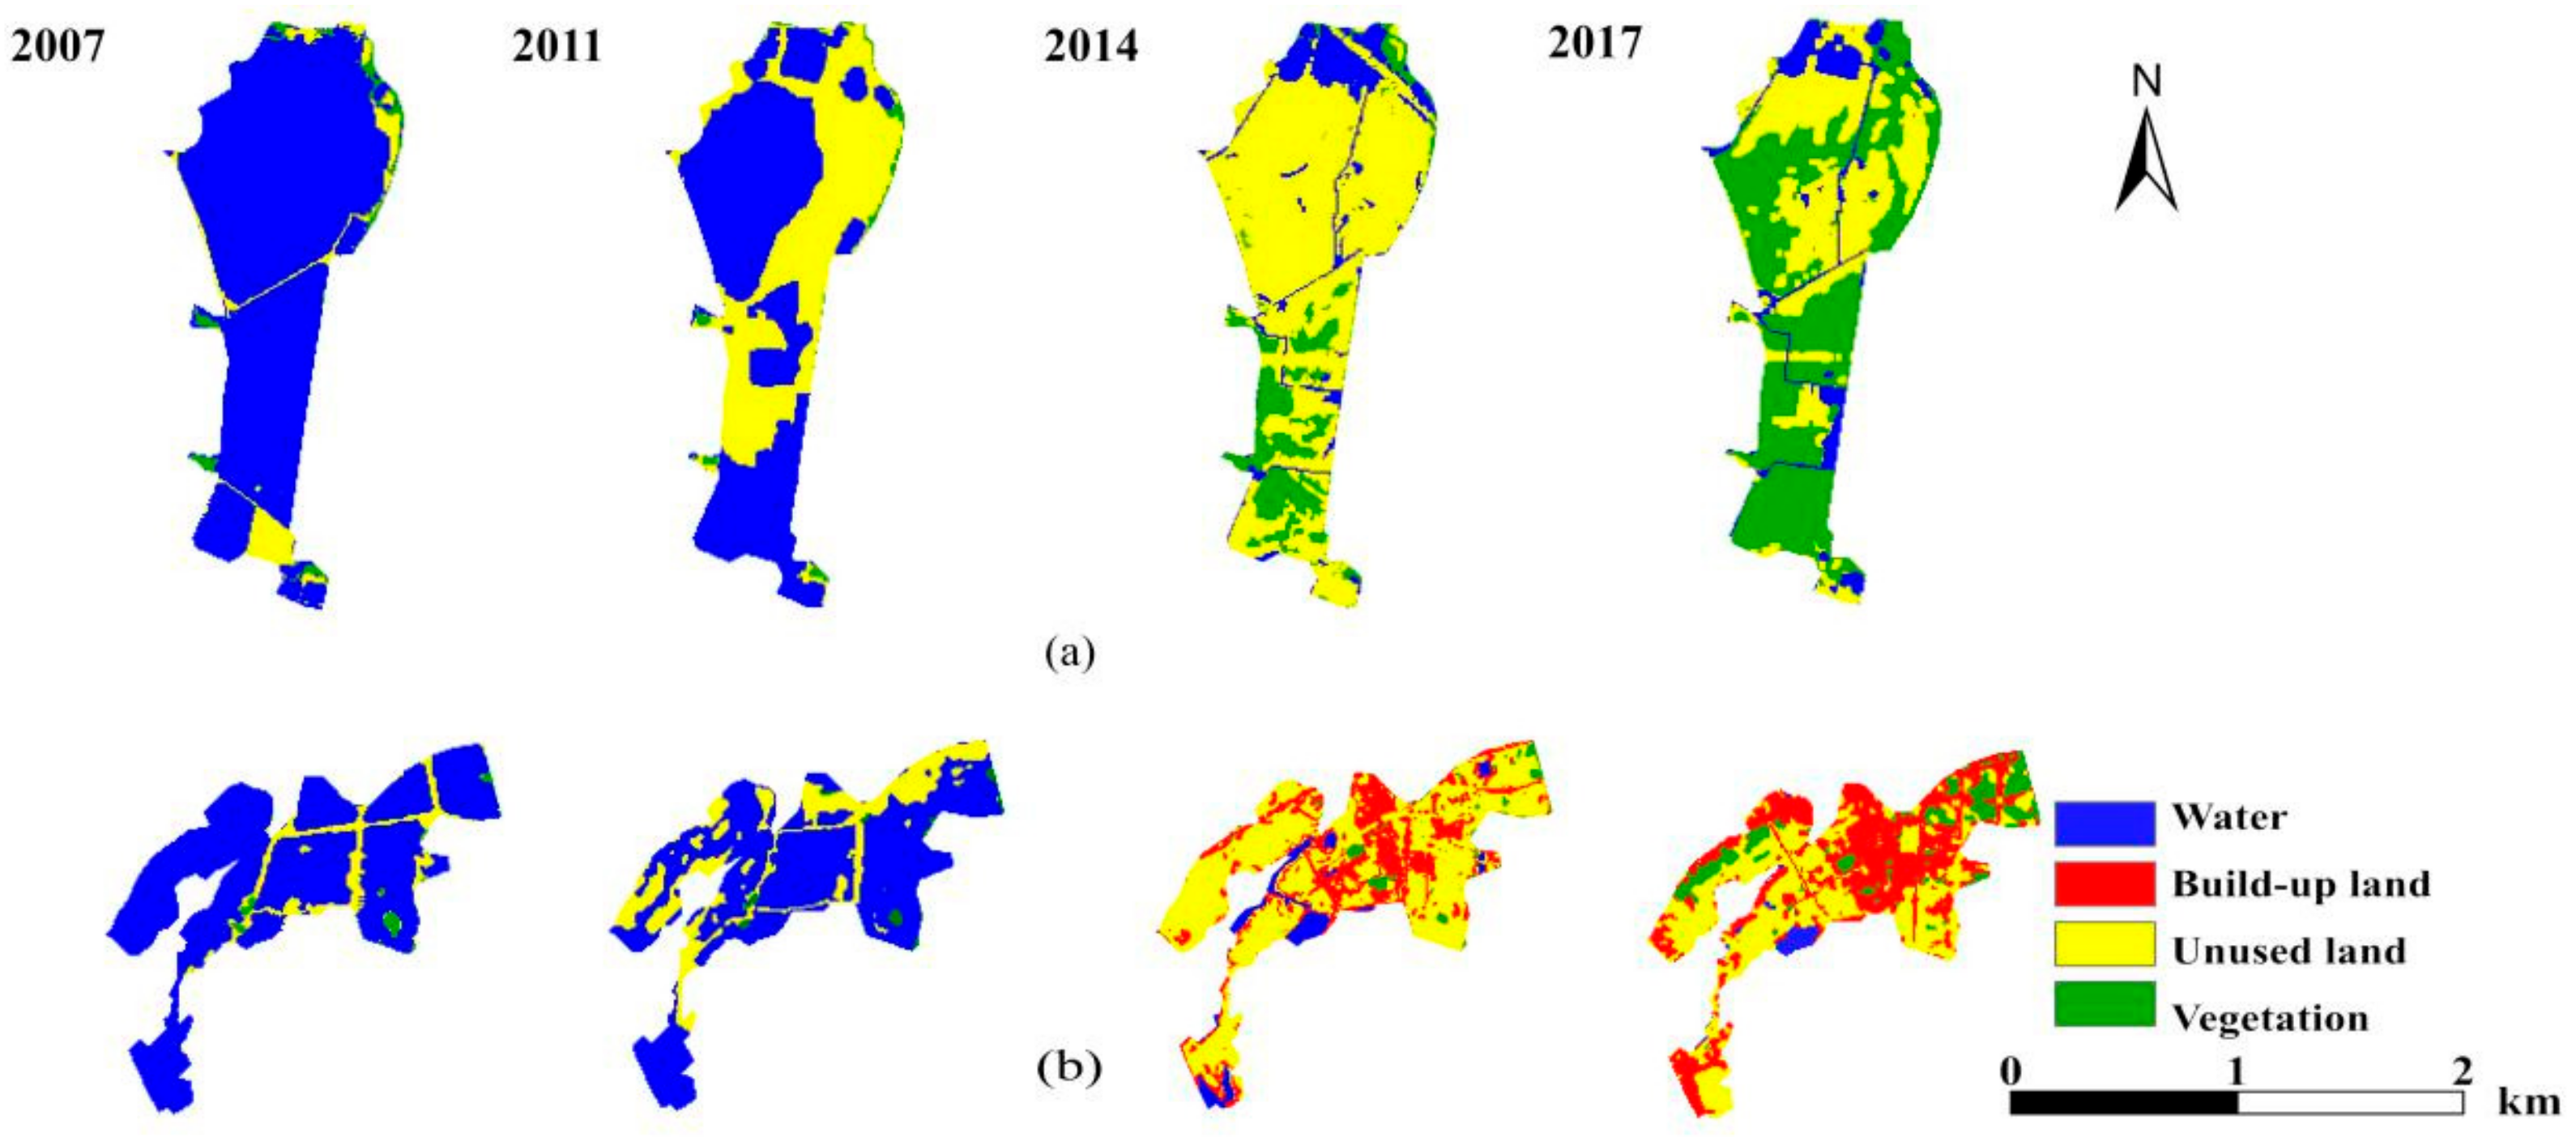
| (a) | ||||||||
| Land Use Type | 2007 | 2011 | 2014 | 2017 | ||||
| Area (km2) | Pct. (%) | Area (km2) | Pct. (%) | Area (km2) | Pct. (%) | Area (km2) | Pct. (%) | |
| Water | 8.95 | 89.48 | 2.30 | 22.63 | 0.61 | 6.01 | 0.23 | 2.26 |
| Vegetation | 0.16 | 1.64 | 0.13 | 1.27 | 0.31 | 3.04 | 1.25 | 12.50 |
| Build-up land | 0 | 0 | 0 | 0 | 2.62 | 25.95 | 4.08 | 40.67 |
| Unused land | 1.05 | 10.52 | 7.73 | 76.10 | 6.57 | 65.00 | 4.47 | 44.57 |
| Total | 10.17 | 100 | 10.16 | 100 | 10.12 | 100 | 10.03 | 100 |
| (b) | ||||||||
| Land Use Type | 2007 | 2011 | 2014 | 2017 | ||||
| Area (km2) | Pct. (%) | Area (km2) | Pct. (%) | Area (km2) | Pct. (%) | Area (km2) | Pct. (%) | |
| Water | 13.78 | 89.84 | 8.83 | 57.38 | 1.92 | 12.50 | 1.66 | 10.82 |
| Vegetation | 1.12 | 7.11 | 0.33 | 2.12 | 2.38 | 15.45 | 7.88 | 51.19 |
| Unused land | 0.48 | 3.05 | 6.23 | 40.50 | 11.09 | 72.04 | 5.85 | 37.99 |
| Total | 15.39 | 100 | 15.39 | 100 | 15.39 | 100 | 15.39 | 100 |
© 2019 by the authors. Licensee MDPI, Basel, Switzerland. This article is an open access article distributed under the terms and conditions of the Creative Commons Attribution (CC BY) license (http://creativecommons.org/licenses/by/4.0/).
Share and Cite
Wen, X.; Ming, Y.; Gao, Y.; Hu, X. Dynamic Monitoring and Analysis of Ecological Quality of Pingtan Comprehensive Experimental Zone, a New Type of Sea Island City, Based on RSEI. Sustainability 2020, 12, 21. https://doi.org/10.3390/su12010021
Wen X, Ming Y, Gao Y, Hu X. Dynamic Monitoring and Analysis of Ecological Quality of Pingtan Comprehensive Experimental Zone, a New Type of Sea Island City, Based on RSEI. Sustainability. 2020; 12(1):21. https://doi.org/10.3390/su12010021
Chicago/Turabian StyleWen, Xiaole, Yanli Ming, Yonggang Gao, and Xinyu Hu. 2020. "Dynamic Monitoring and Analysis of Ecological Quality of Pingtan Comprehensive Experimental Zone, a New Type of Sea Island City, Based on RSEI" Sustainability 12, no. 1: 21. https://doi.org/10.3390/su12010021
APA StyleWen, X., Ming, Y., Gao, Y., & Hu, X. (2020). Dynamic Monitoring and Analysis of Ecological Quality of Pingtan Comprehensive Experimental Zone, a New Type of Sea Island City, Based on RSEI. Sustainability, 12(1), 21. https://doi.org/10.3390/su12010021