Abstract
Evidence exists for the application of lean management practices in the design process. However, there is no systematic review of this type of practice that links the design management practices to the lean construction principles. There is no tool to assess the level of use of lean design management practices in construction projects either. Therefore, this paper aims to assess the lean management practices that are performed at the design phase of construction projects. The research was divided into a literature review of design management practices; a validation of lean design management practices with a practice–principle relationship, based on an expert survey; the devolvement of a tool (questionnaire) to evaluate the lean design management practices; and an assessment in 64 construction projects (coherence, reliability, correlation, and descriptive analysis). It is concluded that evidence exists for the implementation of 19 lean design management practices. These practices are grouped into three categories: stakeholder management, planning and control, and problem solving and decision making. Additionally, in the assessment of the 64 projects, it can be observed that the lean design management practices are at initial levels of implementations, so there is a significant development gap. This research proposes a tool to assess management practices in the design phase of construction projects; then, the study identifies implementations gaps, it provides benchmarks with other projects, and it improves the design process through a taxonomy of lean design management practices.
1. Introduction
The infrastructure life-cycle has several phases from the inception of the idea to the dismantlement of the facility [1,2]. Within this life cycle, the design phase is key because the decisions made during this phase can significantly affect the subsequent phase. In addition, the costs of changes in the design phase are negligible compared to the costs of changes in future phases [3]. Poor interactions within the work teams of the architecture, engineering and construction (AEC) industry can result in poor performances [4]. Poor performance results from activities that do not add value and are considered project losses, such as reworks and waiting times, among others [5]. Therefore, it is essential to appropriately manage the design process. Design management is the discipline of planning, organizing, and managing the design process to meet certain defined objectives [6]. Although there is no tradition of integral management of the design process, in recent years, several options have been studied to evaluate its performance [7], to implement integrated management systems and visual management tools [8], as well as to optimize this process [6].
Technological tools have great potential to improve the performance of projects, particularly in the design phase. However, the problems generated in the design of construction projects cannot be solved with technology alone but require an understanding of the social phenomena related to the processing of individual and collective information [9]. For this reason, certain lean tools can allow higher interactions because they encourage the management of commitment and trust among team members [10,11,12,13].
Evidence exists for the application of lean management principles and some of its tools in the design management process [14,15]. For example, Fosse & Ballard [16] presented a case study that demonstrated the change between traditional planning and planning using the last planner® system (LPS®) at the design phase. Although they did not present evidence of the changes in the project′s performance, they concluded that the degree of satisfaction of the project′s stakeholders increased when the LPS® was applied during the planning phase of the project. For their part, Knotten et al. [17] emphasized that the use of LPS® and collaborative planning in the design phase reinforced the trust and commitment among the members of the team, which are both considered fundamental elements of an effective team [18]. Additionally, integrated project delivery (IPD) has emerged as a new project delivery system with the potential to provide more collaboration and better performance through more supply chain integration, where the owner, designer, and constructor sign a single multiparty contract, and they build a common culture in the organization that encourages team collaboration [19].
Lean design introduces several elements that are part of the lean philosophy and that are fundamental in the design phase, for example, the active and systematic involvement of clients during early stages, maximization of the value, identification of the needs and objectives of all interested parties, simultaneous realization of the design of the product and the process, and postponement of the decision-making step until the last responsible moment, with the aim of reducing reworks and unnecessary tasks [20]. It is remarkable that several of these elements are also proposed by other management tools in the design; however, lean design can group all elements into a single framework of best practices. In addition, several lean tools can be used in lean design, such as target value design (TVD) [20,21,22,23], set-based design (SBD) [21,22,23], building information modeling (BIM) [21,23], choosing by advantage (CBA) [21,22,23], and LPS® [20,21,22,23,24], among others. In the BIM case, Sacks, Koskela, Dave and Owen [25] propose a matrix that links lean construction principles with BIM functionalities; they identify 56 issues that are presented as hypotheses being intended to guide and stimulate further research.
Although several experiences have been reported that reflect certain lean tools and principles in the design phase of construction projects, there is no systematic review that links some best design practices to the principles of lean construction; therefore, it is not known how these practices maximize the value of the design product of a construction project. Consequently, no evaluation tool is available, allowing the assessment of the level of using certain practices in a specific project. Therefore, the objective of this paper is to assess the lean management practices that are performed at the design phase of construction projects.
2. Research Method
To achieve the objective of this work, the research was divided into three stages: (1) literature review of lean design management practices; (2) validation of the relationships between lean design management practices and lean principles; and, finally, (3) assessment of lean design management practices, where an analysis of the relationship among these practices is shown as well as the identification of the main implementation gaps. These stages are displayed in Figure 1 and explained in-depth as follows.
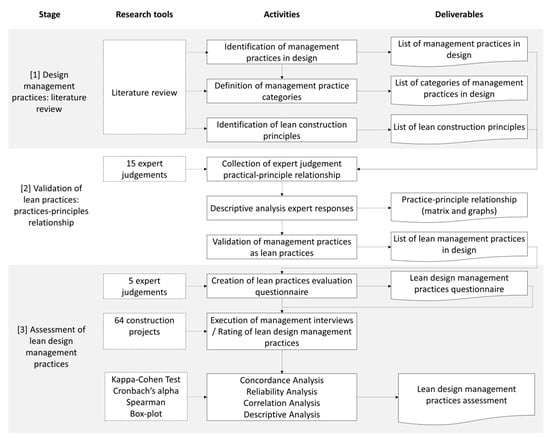
Figure 1.
Research process.
In the first stage, the management practices that have been applied in the design phase of construction projects were identified from a literature review; then, categories were defined associated with common themes; and finally, the lean construction principles as proposed by Koskela [26] were identified. The second stage sought to validate management practices such as lean design management practices; the relationship between the practices and lean construction principles was defined through a survey of 15 experts from the academic and professional sectors. Finally, in the third stage, a questionnaire was proposed to evaluate the use of lean practices based on a scale of 1 to 5; the tool was created in collaborative meetings with five experts. This assessment was applied to 64 construction projects at the design phase. From this assessment, the authors analyzed the relationship among the lean design management practices and also identified the main implementation gaps in the project evaluated.
2.1. Stage 1: Lean Design Management Practices—A Literature Review
A literature review was carried out of specialized journals on engineering and construction project management and of proceedings of main conferences between 1998 and 2018; the search was carried out in the following libraries: Engineering Village, Web of Science, and Scopus. The search topics were lean design, design management, lean management, design team, design projects, and LPS® in design. Articles were selected applying three inclusion/exclusion criteria regarding the document: (1) focused on lean design; (2) focused on the design phase; and (3) reporting lean management practices in a case study. For control and information collection, a table was prepared using Microsoft Excel software; for each document, it comprised information related to title, authors, database, publication year, and inclusion/exclusion criteria. In this review, 33 references of implementation or potential implementation of lean design management practices were found.
Based on the literature review, a set of lean design management practices was enumerated and classified into three major management areas: stakeholder management, planning and control, and problem solving and decision making. Practices associated with specific techniques, such as TVD, BIM, and CBA, among others, were not considered in this study because the focus of this study was management practices and not the use of particular technologies or tools that could support this objective.
2.2. Stage 2: Validation of Lean Design Management Practices: Practices–Principle Relationship
To validate the previously identified lean design management practices, the researchers assessed the relationship between these practices and the original lean construction principles proposed by Koskela [26] and adapted by Herrera et al. [27] (Table 1). While these 11 principles were the first to be proposed, new principles have been developed [25]. However, all elements are taken up in the original eleven [26], since the new principles [25] are particular to the construction execution.

Table 1.
Koskela’s lean construction principles [27] (based on [26]).
The validation was performed based on the judgment of experts (academics and practitioners). The sample was selected from the research network of the Centre of Excellence of Production (GEPUC), complying with the following two requirements: (a) more than 10 years of practice, and (b) experience implementing or researching in lean management and design management. This way, twenty-five experts were invited to take part in this research; out of these twenty-five, fifteen experts agreed to participate (Table 2). The international experts completed a matrix whose columns contained the eleven lean principles and whose rows contained the lean design management practices obtained from the literature review.
Table 2.
Characterization of the experts who answered the matrix.
For each lean design management practice, it was requested to describe the level of relationship between the practice and each lean construction principle based on three levels: (0) the practice is not related to the lean principle; (1) the practice is partially related to the lean principle; and (2) the practice is completely related to the lean principle.
To obtain a single value of the practice–principle relationship, the median value of the experts′ answers was used since the practice–principle relationship was of the ordinal type. In this way, a relationship matrix was generated between all the lean design management practices and the lean construction principles. A practice was considered a lean design management practice if it had a complete relationship with at least one lean principle or a partial relationship with two lean principles.
2.3. Stage 3: Assessment of Lean Design Management Practices
Given the lean design management practices that were systematically compiled from the literature, and their subsequent validation with lean construction principles, a tool was developed to assess these activities in construction projects at the design phase. Each practice was defined on a scale of five levels, that is, from null implementation to total implementation of lean design management practice in construction projects. A questionnaire was developed through collaboration with five academic experts and professionals, with at least ten years of experience in lean methodology or in the AEC industry (Table 3). The collaborative work of the experts consisted of five sessions in which the experts discussed and created a description for each of the five levels of the 19 lean design management practices.
Table 3.
Characterization of the experts who created the questionnaire.
To assess the level of implementation of the lean design management practices, the researcher applied the questionnaire in 64 construction projects. The researchers invited all the companies who participate in the network of collaborating organizations to join, of which 64 projects of companies interested were assessed. All projects had a design–bid–build contracting system, so the design was in a contract prior to the construction. Additionally, the projects were divided between building and infrastructure projects and by the design′s country of origin; the projects were from Colombia, Chile, and Spain (Table 4). Given these classifications, hypothesis tests were carried out to check if there were significant differences by type of classification (country and type of project). The assessment of each project followed this process: first, the researchers conducted an interview, which was recorded, with the project coordinator considering all the points addressed in the questionnaire (audio was recorded with the consent of the interviewee). Then, two researchers listened to the recorded interviews and individually rated each project for each of the management practices, defined in the questionnaire, using the 5-point Likert scale explained above. Then, in a collaborative session, the two researchers who qualified the projects were asked to discuss the final qualification of each practice.
Table 4.
Summary of project characteristics.
Finally, from the information of the 64 projects, the following analyses were carried out: (1) a concordance analysis using Cohen’s kappa test [28] was performed in three scenarios (between the answer of the two researchers, between the answer of the first researcher and the final decision, and between the answer of the second researcher and the final decision); (2) a reliability analysis using Cronbach’s alpha coefficient to assess the questionnaire internal consistency; (3) an analysis of significant differences of lean design management practices depending on country and type of project using the non-parametric Krustal–Wallis and Mann–Whitney U tests, respectively; (4) a relationship analysis among the lean design management practices using the Spearman correlation coefficient; and (5) a descriptive analysis to know the main implementation gaps of lean design management practices in the project evaluated.
3. Results and Discussion
3.1. Identification of Lean Design Management Practices from the Literature
Affinity methods are used in design thinking to help in making sense of the information when data come from diverse sources/contexts, such as facts, ethnographic research, brainstorming results, users’ opinions and needs, insights, and design issues [29]. Considering the exploratory nature of this study and the mixed nature of the data collected, affinity methods were selected for information classification. From the literature review, 19 lean design management practices were identified and grouped into three categories using the affinity method [30,31]: stakeholder management, project planning and control, and problem solving and decision making. Below, the practices of each of the categories are presented; for each one of the practices, its supporting references are presented by category.
The management of stakeholders (category 1) is one of the most important elements in the management of any type of project [32,33]. As an example of its relevance, the project management body of knowledge (PMBOK) as proposed by the Project Management Institute (PMI) added stakeholder management as the tenth area of knowledge to be considered by project managers [1]. Within this category, requirement management is usually one of the critical elements for the management of construction projects [33], where the identification and management must be conducted not only with external clients but also with all stakeholders of the project, while also considering internal clients [1,32]. To correctly manage requirements, the systematic participation of a client as a feedback agent of the proposition generated by designers is fundamental [14,23,34]. Additionally, the early involvement of specialist designers and builders will generate a design with a comprehensive value proposal; furthermore, the design will consider the knowledge and experience of these actors as internal clients, allowing them to anticipate potential incompatibility problems among designers and even consider an optimal design for future construction [6,35,36]. Table 5 provides a summary of the main references found in the literature about lean management practices associated with stakeholder management.
Table 5.
Lean practices associated with stakeholder management.
The planning and monitoring (category 2) of projects are activities that require more time when managing a project; in the latest version of the PMBOK [1], 73.47% of the proposed processes for project management belonged to the planning and monitoring categories [1]. In the AEC industry, there are certain standardized tools and practices that are commonly used for planning and control, specifically during the construction phase, such as the earned value method [49,50] or LPS® [22,51,52]. However, during the design phase, there are no common tools and practices for design teams [51]; currently, there have been reports and case studies about the application of certain management tools, such as the design structure matrix and LPS® [53]. Most of the practices compiled are related to the use of LPS® [16,52]. Table 6 provides a summary of the main references encountered in the literature about lean management practices associated with project planning and control.
Table 6.
Lean practices associated with project planning and control.
During the design phase, there are many iterations associated with both the creative process of design and the existence of problems of a different nature, such as incompatibilities between specialties, regulatory constraints, economic constraints, and ill-defined requirements, among others [34]. Therefore, these creative or problem iterations will generate instances of decision making and problem solving (category 3), which can be addressed individually and centralized, collaboratively and decentralized [60], or intuitively with defined and standardized action protocols [23,61]. The lean theory proposes collaborative, continuous, and standardized management as appropriate practices to solve problems, make decisions, and use the resulting information as lessons learned [35,43,57]. Table 7 provides a summary of the main references encountered in the literature about lean management practices associated with problem solving and decision making.
Table 7.
Lean practices associated with problem solving and decision making.
3.2. The Relationship between Lean Design Management Practices and Lean Principles
To validate the 19 lean design management practices, their relationships with the 11 principles of lean construction were investigated. The judgment of 15 experts was used to consider whether the practical–principle relationship was nonexistent (0), a partial relationship (1), or a complete relationship (2). As each expert provided their judgment on each of the 209 possible practice–principle relationships, the median value of the experts′ answers was used. All of the relationships were presented in a matrix of practical–principle relationships (Table 8), which could be visualized more compactly as a node diagram. In the node diagram, the nodes represented the principles and practices, while the edges represented relationships between the nodes (Figure 2).
Table 8.
Practice–principle relationship matrix.
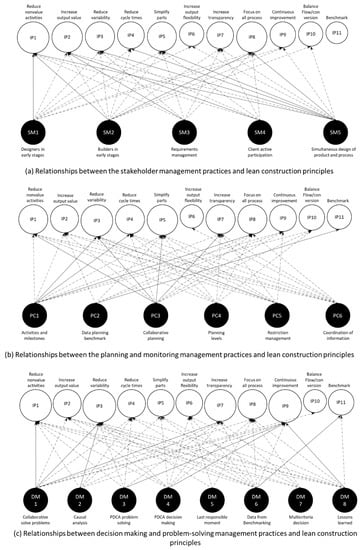
Figure 2.
Relationships between lean design management practices and lean construction principles.
Figure 2 depicts the network diagrams, where the white nodes represent the principles, and the black nodes are the practices associated with the various categories of stakeholder management, planning and monitoring, and problem solving and decision making. The size of the practice nodes remained constant; however, the size of the principle nodes increased as additional practices contributed to each principle. The connections, represented by arrows, were continuous lines when complete relationships existed and dotted lines when connections were partial. Figure 2 allows visualization of the management practices that contributed to each principle; therefore, the visualization of management practices could serve as a guide for organizations to decide which practices have higher priorities than others.
The 11 lean construction principles were linked by at least three practices and, at most, 17 of the 19 lean design management practices; that is, all of the lean construction principles were considered in the practices documented in this study. The principles that were most reinforced in the design phase of construction projects were as follows: increasing the output value through systematic consideration of customer requirements, reducing the amount of non-value-adding activities, reducing the process variability, reducing the cycle times, increasing the process transparency, and continuously improving processes. This was a predictable result, since during the design phase, clients are provided with a first approximation of the final product that they expect to receive. The principles that were least reinforced were increasing the output flexibility, balancing the flow improvement with conversion improvement, and benchmarking. The standard deviation of the number of practices connected to each principle was 4.68 practices; however, if the three least reinforced principles were not considered in the calculation, the standard deviation was 1.48; that is, without accounting for these three principles, a greater level of homogeneity existed among the remaining eight principles, which was altered when considering the eleven lean construction principles.
On average, each principle was connected with 12 of the 19 lean design management practices, which demonstrated a suitable level of compatibility between lean design management practices and lean construction principles. The number of total connections between practices and principles was 138 (including partial and complete relationships), which accounted for 66.03% of all potential relationships. However, of the total number of connections, 19.57% were complete relationships and 80.43% were partial relationships, which indicated that when applying lean construction principles during the design phase, there were, on average, two practices that would directly impact the management and application of these principles during the design phase. On average, there were six practices that only partially impacted the management and application of lean construction principles.
In addition, all practices were connected to each other through at least one principle; therefore, the implementation of lean practices in the design phase could be simple and gradual if the design team was clear about the lean construction principles that were being considered for implementation in the management process. However, each implementation process should be carried out gradually; therefore, it was important to identify which practices contributed to a greater number of lean construction principles. The identification would enable organizations to determine the rate at which practices would be gradually implemented. Figure 3 shows the number of principles that each of the practices contributed to: (A) partially and (B) completely.
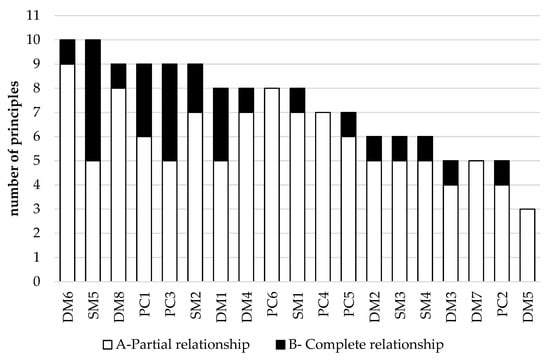
Figure 3.
Number of lean principles related to each lean design management practice.
The 19 defined lean design management practices were subject to at least three principles and a maximum of 10 out of 11 lean construction principles proposed by Koskela. The practices that contributed to a larger number of principles were the simultaneous design of the product and construction process, use of benchmarking information to make decisions, definition of activities, milestones and control points, and collaborative planning. Several of the aforementioned practices belonged to the planning and control category, which was in agreement with the literature review of lean construction principles in the design phase; most of the case studies in the literature reflected the implementation of LPS® during the design phase of construction projects.
The practices that contributed to fewer principles were the making of decisions at the last responsible moment, plan–do–check–act (PDCA) problem solving, multicriteria decision making, and benchmarking to obtain information for planning. Three of these four practices corresponded to the problem-solving and decision-making category; therefore, there would be a knowledge gap associated with the approach of this type of implementation of the lean construction principles. It is important to mention that the number of lean construction principles related to a practice does not imply that this practice is more or less important in the process of implementing a lean design process.
On average, each practice contributed to 7.26 principles. Distinguishing this information by category, practices of the stakeholder management, planning and control, and problem solving and decision-making categories contributed to, on average, 7.80, 7.50, and 6.75 principles, respectively; therefore, none of the categories dominated over the others, although it was again observed that the problem solving and decision making category was the least related to the principles of lean construction.
3.3. Assessment of Lean Design Management Practices in Construction Projects
Bloom and Van Reenen′s [65] developed a method to measure and explain management practices across firms and countries, which uses open-ended questions. This approach fits better to the current research than absolute scoring grids, and it is a proven model that is highly cited in the literature. Based on the list of lean design management practices, a project management questionnaire was created that contained five levels [65]. For each practice, the collaborative team of experts (Table 3) proposed a description was defined for scores 1, 3, and 5, while scores 2 and 4 were defined as an intermediate point between 1–3 and 3–5, respectively:
- Score 1: a traditional management practice,
- Score 3: an initial lean design management practice,
- Score 5: a developed lean design management practice.
The researchers assessed 64 projects in the design phase; each project was independently assessed by two researchers, and then the final score was collaboratively defined. To evaluate the degree of agreement between the two researchers, the Cohen′s kappa test [28] was used, where the null hypothesis (H0) was defined as no agreement between the two researchers, and the alternative hypothesis (H1) was defined as agreement between the two researchers. The test considered a level of significance of 5%. When applying Cohen’s kappa test, a percentage of agreement of 75% was obtained, with a Cohen’s kappa value of 0.65 and p-value of 0.03. Since the p-value was less than 0.05, the null hypothesis could be rejected, while the alternative hypothesis that there existed agreement between the two researchers could not be rejected [66]. When performing the Cohen’s kappa test considering the collaborative decision of the two independent researchers, Cohen’s kappa values of 0.81 and 0.82 were obtained, which indicated a high degree of agreement [66].
Then, the researcher analyzed the internal consistency of the questionnaire measuring scale using Cronbach’s alpha coefficient. For the questionnaire of 19 items and 64 test projects, a Cronbach’s alpha coefficient calculated was 0.918. Hence, the element of the tool assesses the same characteristics for a project for each lean design management practices. From the high level of internal consistency (reliability) and the high level of agreement between the researchers, it is concluded that the questionnaire is an objective and consistent tool for evaluating the levels of lean design management practices in construction projects.
In addition, hypothesis tests were conducted to identify significant differences according to the characteristic of the evaluated projects. Nonparametric hypothesis tests were applied with a significance level of 95% since the variables of each evaluation of the 19 lean design management practice are ordinal qualitative. The Mann–Whitney U test was used to compare pairs of samples (building and infrastructure projects), and the Krustal–Wallis test was used to compare three samples (Colombia, Chile, and Spain). Concerning the type of project, the p-value was not lower than 0.05; therefore, the authors do not have enough information to reject the hypothesis that building and infrastructure projects have significant differences in their lean design management practices. About the difference by country of project design, when performing the test, it was observed that there were significant differences (p-value < 0.05) in the lean design management practices SM1 and SM2, which correspond to the early incorporation of specialist designers and builders. This difference was generated specifically between the projects evaluated in Chile and Colombia, where the latter had a better development of these lean design management practices. In the other 17 practices, there were no significant differences among countries (p-value > 0.05); therefore, the projects can be compared between them.
Then, in order to verify whether there was a correlation at the performance level between the 19 lean design management practices, the authors built a Spearman correlation matrix (Table 9), in which the researchers calculated the Spearman’s rho coefficient and the level of correlation significance between each pair of lean design management practices. In the matrix, it can be observed that the magnitudes of the correlations were moderate (around 0.5); however, 74.85% of the correlations were significant (p-value < 0.05). This highlights the connection that exists between the lean design management practices, given that the joint realization of these practices is a contribution to the fulfillment of the principles of lean construction.
Table 9.
Spearman correlation matrix—lean design management practices.
Using the 64 evaluated projects, a descriptive analysis was conducted to determine the distribution of the levels for each lean design management practice (Figure 4). According to this figure, the practices with the highest level of implementation were “requirements management (identification of constraints, technical specifications, and special requirements)” and “client systematic participation and support during meetings concerning decision making and resolution of problems”; these are the only practices where there was a higher level than that of the initially implemented lean design management practices. Additionally, 75% of the projects were beginning to apply lean design with the practices “planning in different levels” and “constrains management visualization”, however, even at initial levels. The same happened with the lean design management practices “collaborative solving problems” and “PDCA problem solving”. The practices with the lowest level of implementation were “builders in early stages”, “decision-making until the last responsible moment”, and “multicriteria decision-making”, where lean implementation levels were practically nonexistent in about 75% of the evaluated projects. In addition, high ranges of variability can be observed in Figure 4, since in most lean design management practices (15 of 19) there is a two-level difference between the 75th percentile and the 25th percentile. This variability reflects that lean design practices are not yet a standard in management at this stage of the project.
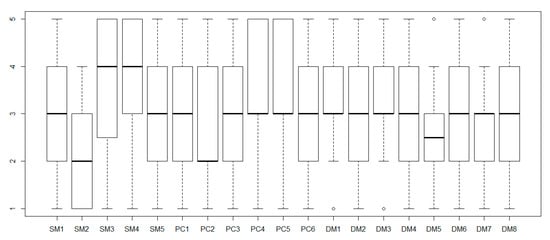
Figure 4.
Lean design management practices assessment.
Finally, from Figure 4 it can also be seen that the practices that contribute most to the development of lean construction principles (Figure 3) had normal behaviors in the range defined for each of the practices (DM6, SM5, DM8, PC1, PC3), that is, the minimum value at level 1, the 25th percentile at level 2, the median at level 3, the 75th percentile at level 4, and the maximum value at level 5. Therefore, the variability of lean design management practice assessment is transferred to fulfillment of the lean construction principles.
4. Conclusions
In this study, evidence was encountered in the literature about the implementation or potential implementation of at least 19 practices of the lean philosophy in the design process of construction projects. These practices were framed in three main areas: stakeholder management, planning and control, and problem solving and decision making. Each of the 19 practices had a high degree of relation with lean construction principles and revealed a balanced contribution to each of the principles of the lean philosophy; therefore, the defined practices could be regarded as lean practices in the design of construction projects. Some principles were most used during the design phase: increasing the output value through systematic consideration of customer requirements, reducing the amount of non-value-adding activities, reducing the process variability, reducing the cycle times, increasing the process transparency, and continuously improving processes. On the other hand, the principles that were least used were increasing the output flexibility, balancing the flow improvement with conversion improvement, and benchmarking. The practices that contributed to a larger number of principles were simultaneous design of the product and construction process, use of benchmarking information to make decisions, definition of activities, milestones and control points, and collaborative planning. The practices that contributed to fewer principles were making of decisions at the last responsible moment, plan–do–check–act (PDCA) problem solving, multicriteria decision making, and benchmarking to obtain information for planning.
Furthermore, this research proposed a tool (questionnaire) to evaluate the degree of implementation of each of the practices at the project level, defining a taxonomy of lean design management practices. The tool consisted of two researchers individually qualifying project practices based on interviews with project managers and then making collaborative decisions. This way, the authors carried out an evaluation of the 19 lean design management practices to 64 construction projects at the design phase where a high variability in the levels of lean implementations could be observed. The most developed practices were requirement management and active participation of the client; the least developed were “builders in early stages”, “decision-making until the last responsible moment”, and “multicriteria decision-making”. Therefore, there is a great opportunity to implement these practices in the design process and to continuously improve the implementation of lean design practices that are at the initial levels of development. Construction executives, project managers, and designers can benefit from this tool as it helps them to identify the main development gaps in the best practices of design management. Additionally, they can use the data obtained in this study to benchmark their lean design management practice.
Some limitations of this research are stated next. The identified practices were not necessarily the only ones since the practices associated with information technology were not considered, such as the use of BIM or the cloud. The 64 projects evaluated are not a statistical sample, considering the number of projects in the design process in the countries where they were evaluated; hence a larger number of projects should be assessed. Also, the authors did not assess specific tools, such as last planner system, target value design, or others. Additionally, this study proposes a quantitative measure of the level of the lean design management practices in each project based on an interview with the project coordinator; this assessment may have a biased view. Therefore, as future work, it could be interesting to conduct an in-depth study of each project that involves the viewpoint of different actors carrying out a qualitative and quantitative assessment of the project. The qualification of each project has to be done with at least two researchers or specialized consultants to provide higher objectivity of the assessment; therefore, future studies could create a tool that would be used as self-evaluation for each project. In addition, this study did not measure the effect of the application of the lean design management practices on the performance of the 64 projects. Therefore, future research should aim to assess the performance of the design process and the organizational performance of the design team; in this way, it will be possible to identify the effect of lean design management practices on the performance of the construction project, both during its design and in its execution. Future research should also consider practices associated with information technology, specifically, the collaborative work in the cloud and the use of BIM, to evaluate a larger number of projects of different types to understand and identify the gaps and opportunities for improvement that exist in the design phase of construction projects and understand the impacts of these practices on the performance of projects.
Author Contributions
This paper represents the results of teamwork. All of the authors jointly designed the research methodology and carried out the case study. R.F.H. and C.M. analyzed the results. All of the authors jointly worked on the validation. R.F.M. drafted the manuscript. Finally, C.M., L.F.A., and E.P. reviewed and edited the manuscript. All authors have read and agreed to the published version of the manuscript.
Funding
This research was funded by CONICYT grant number PCHA/National Doctorate/2018-21180884 for funding the graduate research of Herrera, and the financial support by FONDECYT (1181648).
Acknowledgments
The authors wish to thank all organizations participating in this study as well as the experts for the insight provided.
Conflicts of Interest
The authors declare no conflict of interest.
References
- PMI. A Guide to the Project Management Body of Knowledge (PMBOK® Guide), 6th ed.; Project Management Institute, Ed.; Project Management Institute: Newtown Square, PA, USA, 2017; ISBN 9781628251845. [Google Scholar]
- Pellicer, E.; Yepes, V.; Teixeira, J.C.; Moura, H.; Catalá, J. Construction Management; Wiley-Blackwell: Oxford, UK, 2014. [Google Scholar]
- The American Institute of Architects. Integrated Project Delivery: A Guide; The American Institute of Architects: Washington, DC, USA, 2007. [Google Scholar]
- Baiden, B.K.; Price, A.D.F.; Dainty, A.R.J. The extent of team integration within construction projects. Int. J. Proj. Manag. 2006, 24, 13–23. [Google Scholar] [CrossRef]
- Aziz, R.F.; Hafez, S.M. Applying lean thinking in construction and performance improvement. Alex. Eng. J. 2013, 52, 679–695. [Google Scholar] [CrossRef]
- Knotten, V.; Lædre, O.; Hansen, G.K. Building design management–key success factors. Archit. Eng. Des. Manag. 2017, 13, 479–493. [Google Scholar] [CrossRef]
- Salvatierra, J.L.; Galvez, M.; Bastias, F.; Castillo, T.; Herrera, R.F.; Alarcón, L.F. Developing a benchmarking system for architecture design firms. Eng. Constr. Archit. Manag. 2019, 26, 139–152. [Google Scholar] [CrossRef]
- Abou-Ibrahim, H.; Hamze, F. Design Management: Metrics and Visual Tools. In Proceedings of the 25th Annual Conference of the International Group for Lean Construction, Heraklion, Greece, 9–12 July 2017; pp. 465–473. [Google Scholar]
- Phelps, A.F. Behavioral Factors Influencing Lean Information Flow in Complex Projects. In Proceedings of the 20th Annual Conference of the International Group for Lean Construction 2012, IGLC 2012, San Diego, CA, USA, 18–20 July 2012. [Google Scholar]
- Simons, D.; Taylor, D. Lean thinking in the UK red meat industry: A systems and contingency approach. Int. J. Prod. Econ. 2007, 106, 70–81. [Google Scholar] [CrossRef]
- Perez, C.; Castro, R.; Simons, D.; Gimenez, G. Development of lean supply chains: A case study of the Catalan pork sector. Supply Chain Manag. Int. J. 2010, 15, 55–68. [Google Scholar] [CrossRef]
- Lamming, R. Squaring lean supply with supply chain management. Int. J. Oper. Prod. Manag. 1996, 16, 183–196. [Google Scholar] [CrossRef]
- Arkader, R. The perspective of suppliers on lean supply in a developing country context. Integr. Manuf. Syst. 2001, 12, 87–93. [Google Scholar] [CrossRef]
- Reifi, M.H.; Emmitt, S. Perceptions of lean design management. Archit. Eng. Des. Manag. 2013, 9, 195–208. [Google Scholar]
- Kestle, L.; Potangaroa, R.; Storey, B. Integration of lean design and design management and its influence on the development of a multidisciplinary design management model for remote site projects. Archit. Eng. Des. Manag. 2011, 7, 139–153. [Google Scholar] [CrossRef]
- Fosse, R.; Ballard, G. Lean design management in practice. In Proceedings of the 24th Annual Conference of the International Group for Lean Construction 2016, IGLC 2016, Boston, MA, USA, 18–24 July 2016; pp. 33–42. [Google Scholar]
- Knotten, V.; Svalestuen, F.; Hansen, G. Improving design management. In Proceedings of the 24th Annual Conference of the International Group for Lean Construction 2016, IGLC 2016, Boston, MA, USA, 18–24 July 2016; pp. 173–182. [Google Scholar]
- Svalestuen, F.; Frøystad, K.; Drevland, F.; Ahmad, S.; Lohne, J.; Lædre, O. Key Elements to an Effective Building Design Team. In Proceedings of the International Conference on Project Management, Singapore, 10–11 August 2015; Elsevier Masson SAS: Sapporo, Japan, 2015; Volume 64, pp. 838–843. [Google Scholar]
- Mesa, H.A.; Molenaar, K.R.; Alarcón, L.F. Exploring performance of the integrated project delivery process on complex building projects. Int. J. Proj. Manag. 2016, 34, 1089–1101. [Google Scholar] [CrossRef]
- Gambatese, J.A.; Pestana, C.; Lee, H.W. Alignment between Lean Principles and Practices and Worker Safety Behavior. J. Constr. Eng. Manag. 2017, 143. [Google Scholar] [CrossRef]
- Alves, T.d.C.L.; Lichtig, W.; Rybkowski, Z.K. Implementing target value design: Tools and techniques to manage the process. Health Environ. Res. Des. J. 2017, 10, 18–29. [Google Scholar]
- Munthe-kaas, T.S.; Hjelmbrekke, H.; Lohne, J. Lean design versus traditional design approach. In Proceedings of the 23th Annual Conference of the International Group for Lean Construction 2015, IGLC 2015, Perth, Australia, 29–31 July 2015; pp. 578–588. [Google Scholar]
- Salgin, B.; Arroyo, P.; Ballard, G. Exploring the relationship between lean design methods and C&D waste reduction: Three case studies of hospital projects in California. Rev. Ing. Constr. 2016, 31, 191–200. [Google Scholar]
- Tilley, P.A. Lean design management—A new paradigm for managing the design and documentation process to improve quality? In Proceedings of the 13th Annual Conference of the International Group for Lean Construction 2005, IGLC 2005, Sidney, Canada, 19–21 July 2005; pp. 283–295. [Google Scholar]
- Sacks, R.; Koskela, L.; Dave, B.A.; Owen, R. Interaction of Lean and Building Information Modeling in Construction. J. Comput. Civ. Eng. 2010, 136, 968–980. [Google Scholar] [CrossRef]
- Koskela, L. Application of the New Production Philosophy to Construction; Standford University: Standford, CA, USA, 1992. [Google Scholar]
- Herrera, R.F.; Sanz, M.A.; Montalbán-Domingo, L.; García-Segura, T.; Pellicer, E. Impact of Game-Based Learning on Understanding Lean Construction Principles. Sustainability 2019, 11, 5294. [Google Scholar] [CrossRef]
- Cohen, J. A Coefficient of Agreement for Nominal Scales. Educ. Psychol. Meas. 1960, 20, 37–46. [Google Scholar] [CrossRef]
- Dam, R.; Siang, T. Affinity Diagrams—Learn How to Cluster and Bundle Ideas and Facts. Available online: https://www.interaction-design.org/literature/article/affinity-diagrams-learn-how-to-cluster-and-bundle-ideas-and-facts (accessed on 8 December 2019).
- Foster, S.T.; Ganguly, K.K. Managing Quality: Integrating the Supply Chain; Pearson Prentice Hall: Upper Saddle River, NJ, USA, 2007. [Google Scholar]
- Carnevalli, J.A.; Miguel, P.C. Review, analysis and classification of the literature on QFD-Types of research, difficulties and benefits. Int. J. Prod. Econ. 2008, 114, 737–754. [Google Scholar] [CrossRef]
- Mok, K.Y.; Shen, G.Q.; Yang, J. Stakeholder management studies in mega construction projects: A review and future directions. Int. J. Proj. Manag. 2015, 33, 446–457. [Google Scholar] [CrossRef]
- Molwus, J.J.; Erdogan, B.; Ogunlana, S. Using structural equation modelling (SEM) to understand the relationships among critical success factors (CSFs) for stakeholder management in construction. Eng. Constr. Archit. Manag. 2017, 24, 426–450. [Google Scholar] [CrossRef]
- Ko, C.; Chung, N. Lean Design Process. J. Constr. Eng. Manag. 2014, 140, 1–11. [Google Scholar] [CrossRef]
- Ballard, G.; Tommelein, I.D.; Koskela, L.; Howell, G. Lean Construction Tools and Techniques. In Design and Construction: Bulding in Value; Best, R., de Valence, G., Eds.; Butterworth-Heinemann and Elsevier Ltd.: Amsterdam, The Netherlands, 2002; pp. 227–255. [Google Scholar]
- Franco, V.; Picchi, A. Lean design in building projects: Guiding principles and exploratoyry. In Proceedings of the 24th Annual Conference of the International Group for Lean Construction 2016, IGLC 2016, Boston, MA, USA, 20–22 July 2016; pp. 113–122. [Google Scholar]
- Hansen, G.K.; Olsson, N.O.E. Layered Project—Layered Process: Lean Thinking and Flexible Solutions. Archit. Eng. Des. Manag. 2011, 7, 70–84. [Google Scholar] [CrossRef]
- Formoso, C.T.; Tzotzopoulos, P.; Jobim, M.S.; Liedtke, R. Developing a protocol for managing the design process in the building industry. In Proceedings of the 6th Annual Conference of the International Group for Lean Construction 1998, IGLC 1998, Guarujá, Brazilian, 13–15 August 1998. [Google Scholar]
- Freire, J.; Alarcón, L.F. Achieving Lean Design Process: Improvement Methodology. J. Constr. Eng. Manag. 2002, 128, 248–256. [Google Scholar] [CrossRef]
- Ballard, G.; Zabelle, T. Project Definition; White Paper#9; Lean Construction Institute: Arlington, VA, USA, 2000. [Google Scholar]
- Cohen. Integrated Project Delibery: Case Studies; AIA: Sacramento, CA, USA, 2010. [Google Scholar]
- Koskela, L.; Huovila, P.; Leinonen, J. Design management in building construction: From theory to practice. J. Constr. Res. 2002, 3, 1–16. [Google Scholar] [CrossRef]
- Ballard, G.; Howell, G. Lean project management. Build. Res. Inf. 2003, 31, 119–133. [Google Scholar] [CrossRef]
- Sødal, A.H.; Lædre, O.; Svalestuen, F.; Lohne, J. Early Contractor Involvement: Advantages and Disadvantages for the Design Team. In Proceedings of the 22nd Annual Conference of the International Group for Lean Construction 2014, IGLC 2014, Oslo, Norway, 25–27 June 2014; pp. 519–531. [Google Scholar]
- Jaganathan, S.; Nesan, L.J.; Ibrahim, R.; Mohammad, A.H. Integrated design approach for improving architectural forms in industrialized building systems. Front. Archit. Res. 2013, 2, 377–386. [Google Scholar] [CrossRef]
- Ballard, G. Managing work flow on design projects: A case study. Eng. Constr. Archit. Manag. 2002, 9, 284–291. [Google Scholar] [CrossRef]
- Bade, B.M.; Haas, C. Using Lean Design and Construction to Get more from Capital Projects; Lean Construction Institute: Arlington, VA, USA, 2015; pp. 39–44. [Google Scholar]
- Arbulu, R.; Soto, J. A Design Case Study: Integrated Product and Process Management. In Proceedings of the 14th Annual Conference of the International Group for Lean Construction 2006, IGLC 2006, Santiago, Chile, 14–16 July 2006; pp. 107–119. [Google Scholar]
- Czemplik, A. Application of earned value method to progress control of construction projects. In Proceedings of the XXIII R-S-P Seminar, Theoretical Foundation of Civil Engineering; Elsevier: Amsterdam, The Netherlands, 2014; Volume 91, pp. 424–428. [Google Scholar]
- Bryde, D.; Unterhitzenberger, C.; Joby, R. Conditions of success for earned value analysis in projects. Int. J. Proj. Manag. 2018, 36, 474–484. [Google Scholar] [CrossRef]
- Herrera, R.F.; Mourgues, C.; Alarcón, L.F. Assessment of Lean Practices, Performance and Social Networks in Chilean Airport Projects. In Proceedings of the 26th Annual Conference of the International Group for Lean Construction 2018, IGLC 2018, Chennai, India, 18–20 July 2018; pp. 603–613. [Google Scholar]
- Hamzeh, F.R.; Ballard, G.; Tommelein, I.D. Is the Last Planner System applicable to design? A case study. In Proceedings of the 17th Annual Conference of the International Group for Lean Construction 2009, IGLC 2009, Taipei, Taiwan, 15–17 July 2009; pp. 407–416. [Google Scholar]
- Rosas, E. Integrating the Design Structure Matrix and the Last Planner System into Building Design. In Proceedings of the 21th Annual Conference of the International Group for Lean Construction 2013, IGLC 2013, Fortaleza, Brazil, 31 July–2 August 2013; pp. 389–398. [Google Scholar]
- Tauriainen, M.; Marttinen, P.; Dave, B.; Koskela, L. The effects of BIM and lean construction on design management practices. Procedia Eng. 2016, 164, 567–574. [Google Scholar] [CrossRef]
- Koskela, L.; Ballard, G.; Tanhuanpää, V.-P. Towards lean design management. In Proceedings of the 5th Annual Conference of the International Group for Lean Construction 1997, IGLC 1997, Gold Coast, Australia, 16–17 July 1997; pp. 1–13. [Google Scholar]
- Magalingam, A.; Yadav, A.K.; Varaprasad, J. Investigating the Role of Lean Practices in Enabling BIM Adoption: Evidence from Two Indian Cases. J. Constr. Eng. Manag. 2015, 141. [Google Scholar] [CrossRef]
- Wesz, J.G.B.; Formoso, C.T.; Tzortzopoulos, P. Planning and controlling design in engineered-to-order prefabricated building systems. Eng. Constr. Archit. Manag. 2018, 25, 134–152. [Google Scholar] [CrossRef]
- UUsitalo, P.; Olivieri, H.; Seppänen, O.; Pikas, E.; Peltokorpi, A. Review of Lean design management: Processes, methods and technologies. In Proceedings of the 25th Annual Conference of the International Group for Lean Construction 2017, IGLC 2017, Heraklion, Greece, 9–12 July 2017; pp. 571–578. [Google Scholar]
- Tribelsky, E.; Sacks, R. An Empirical Study of Information Flows in Multidisciplinary Civil Engineering Design Teams using Lean Measures. Archit. Eng. Des. Manag. 2011, 7, 85–101. [Google Scholar] [CrossRef]
- Savolainen, J.M.; Saari, A.; Männistö, A.; Kähkonen, K. Indicators of collaborative design management in construction projects. J. Eng. Des. Technol. 2018, 16, 674–691. [Google Scholar] [CrossRef]
- Arroyo, P.; Tommelein, I.D.; Ballard, G. Selecting Globally Sustainable Materials: A Case Study Using Choosing by Advantages. J. Constr. Eng. Manag. 2015. [Google Scholar] [CrossRef]
- Rahmawati, Y.; Utomo, C.; Anwar, N.; Negoro, N.P.; Nurcahyo, C.B. A framework of knowledge management for successful group decision in design process. In Proceedings of the 2014 IEEE Conference on Open Systems (ICOS), Subang, Malaysia, 26–28 October 2014; pp. 60–65. [Google Scholar]
- Kestle, L.; London, K. Towards the development of a conceptual design management model for remote sites. In Proceedings of the 10th Annual Conference of the International Group for Lean Construction 2002, IGLC 2002, Gramado, Brazil, 6–8 August 2002; pp. 1–14. [Google Scholar]
- Kalsaas, B.T.; Sacks, R. Conceptualization of interdependency and coordination. In Proceedings of the 19th Annual Conference of the International Group for Lean Construction, Lima, Peru, 13–15 July 2011; pp. 1–11. [Google Scholar]
- Bloom, N.; Reenen, J. Van Measuring and Explaining Management Practices across Firms and Countries; NBER Working Paper No. 12216; Centre for Economic London School of Economics and Political Science: London, UK, 2006. [Google Scholar]
- Mchugh, M.L. Interrater reliability: The kappa statistic. Biochem. Med. 2012, 22, 276–282. [Google Scholar] [CrossRef]


© 2019 by the authors. Licensee MDPI, Basel, Switzerland. This article is an open access article distributed under the terms and conditions of the Creative Commons Attribution (CC BY) license (http://creativecommons.org/licenses/by/4.0/).