A Study of Local Climate Zones in Abu Dhabi with Urban Weather Stations and Numerical Simulations

 ,
,  and
and
Abstract
:1. Introduction
2. Methodology
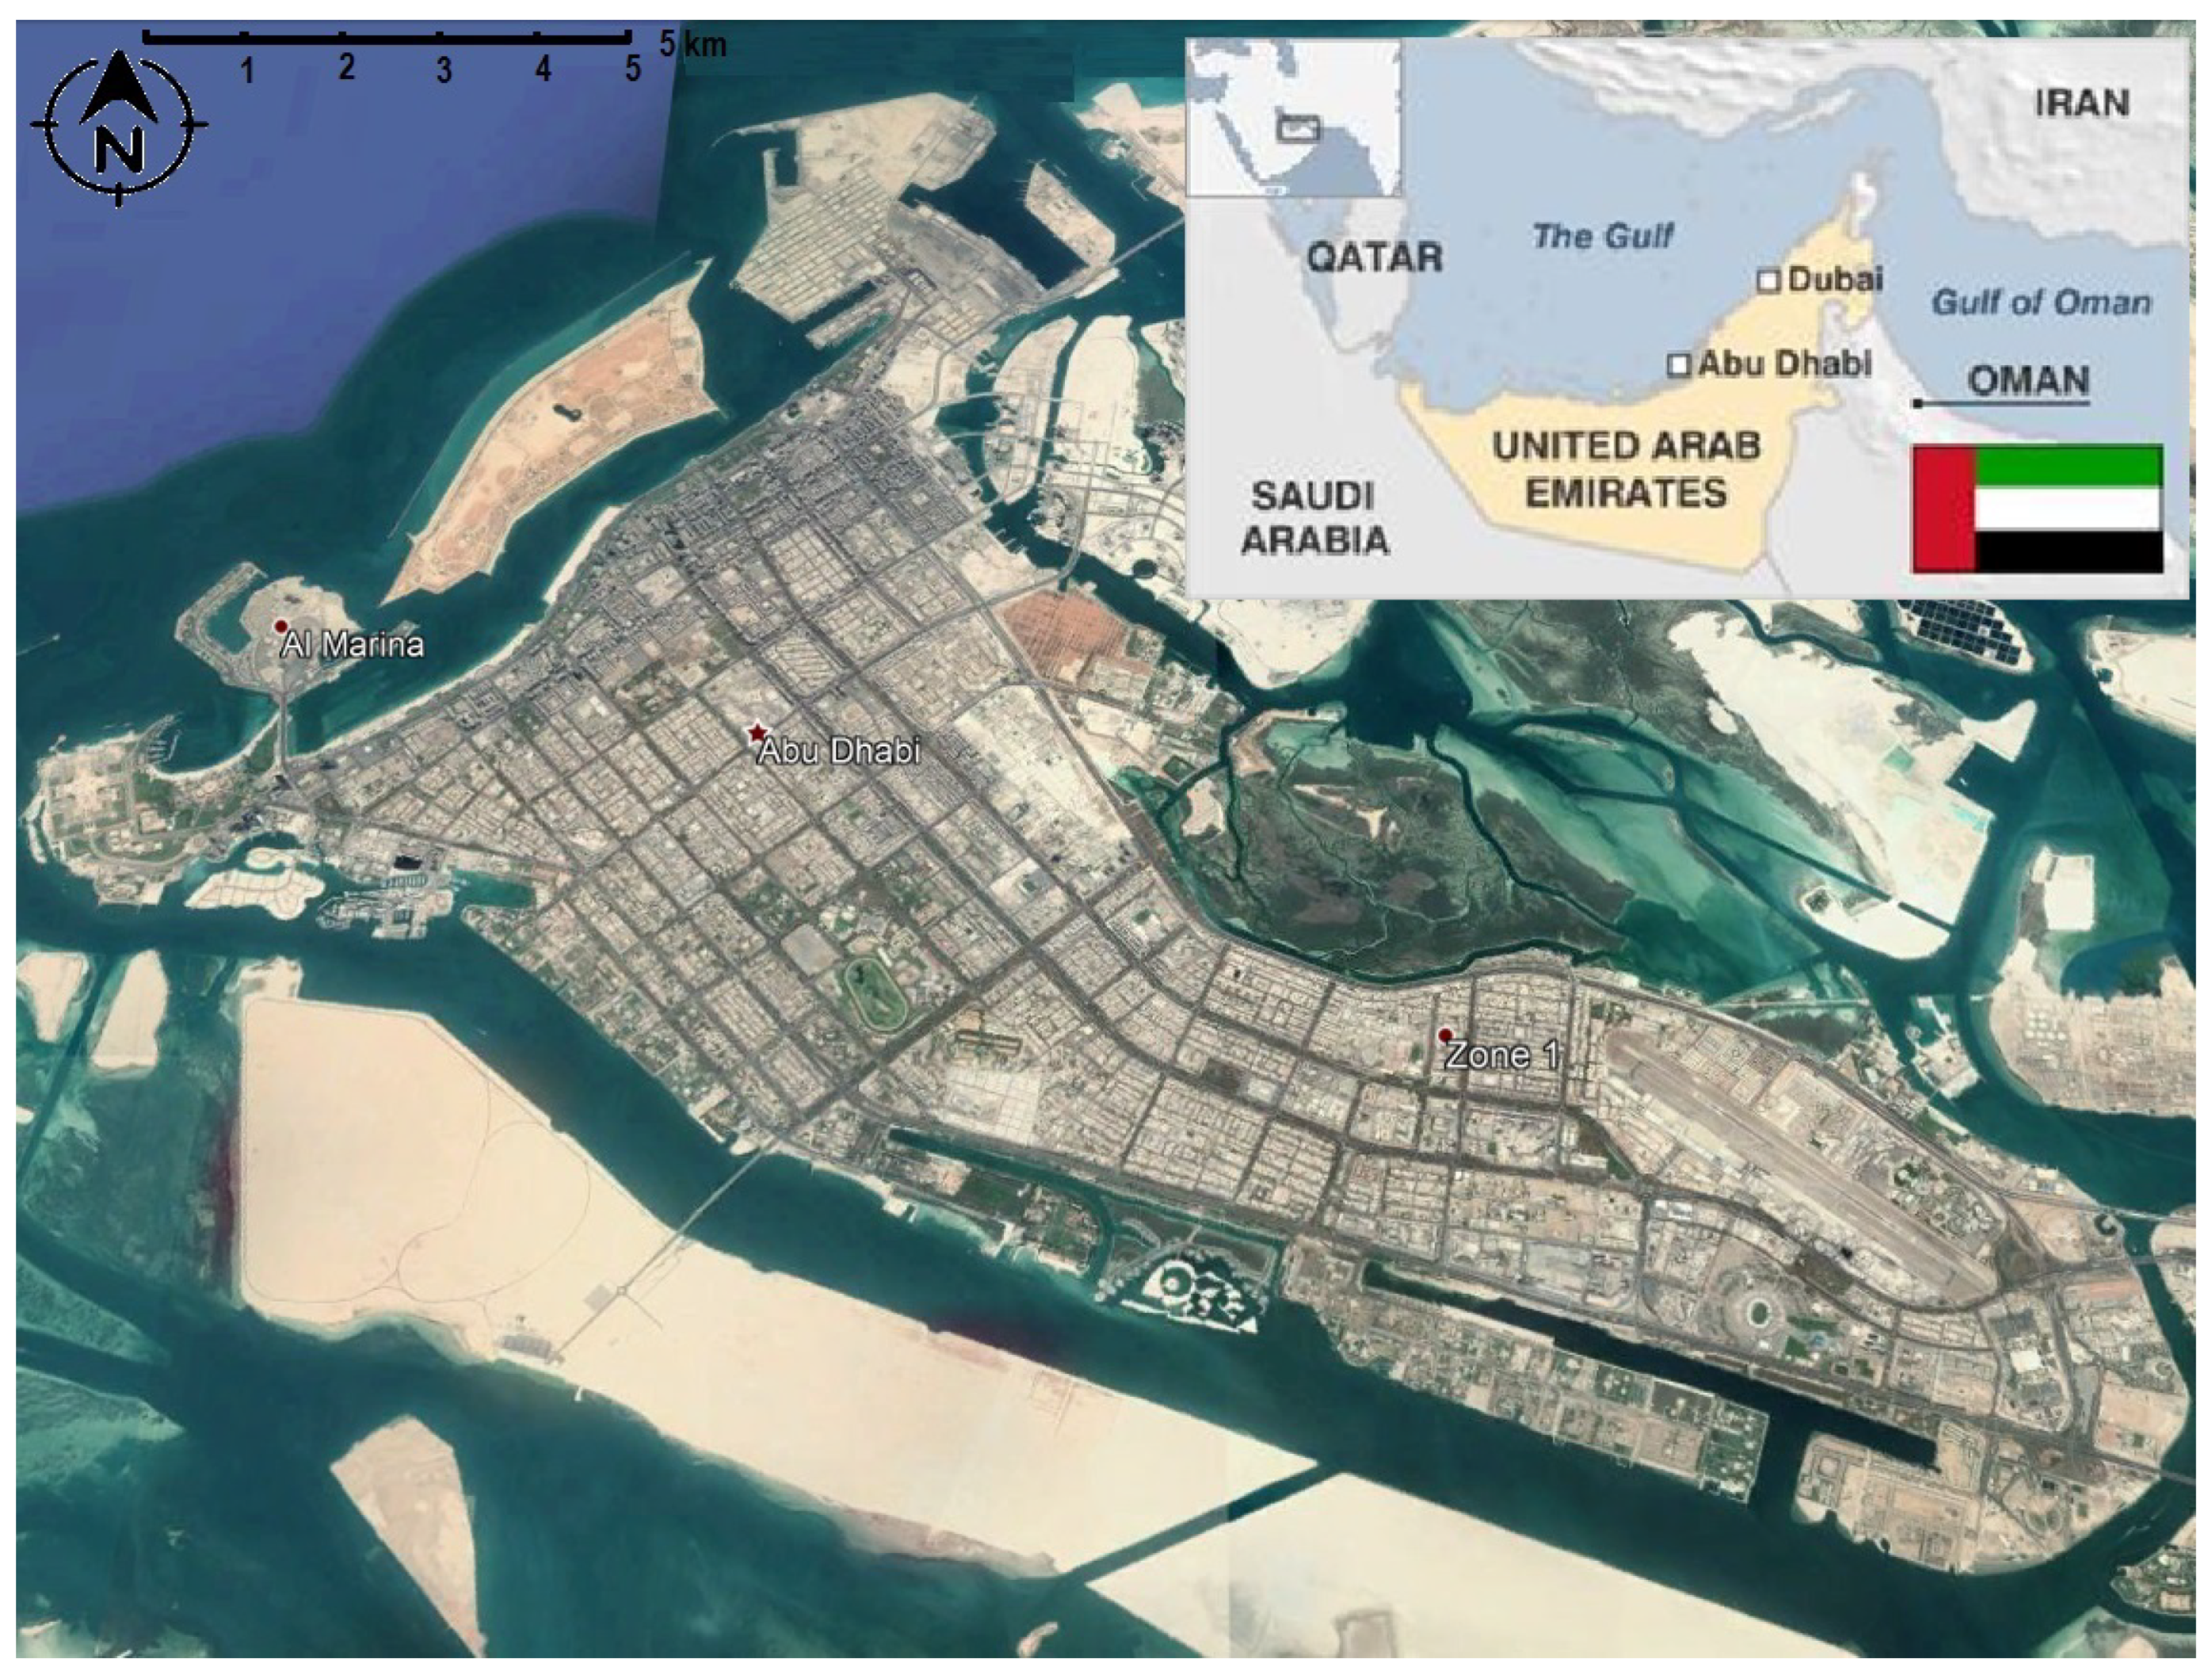
2.1. City Selection
- a mosque where people gather to pray,
- a main lane where there are shops and restaurants,
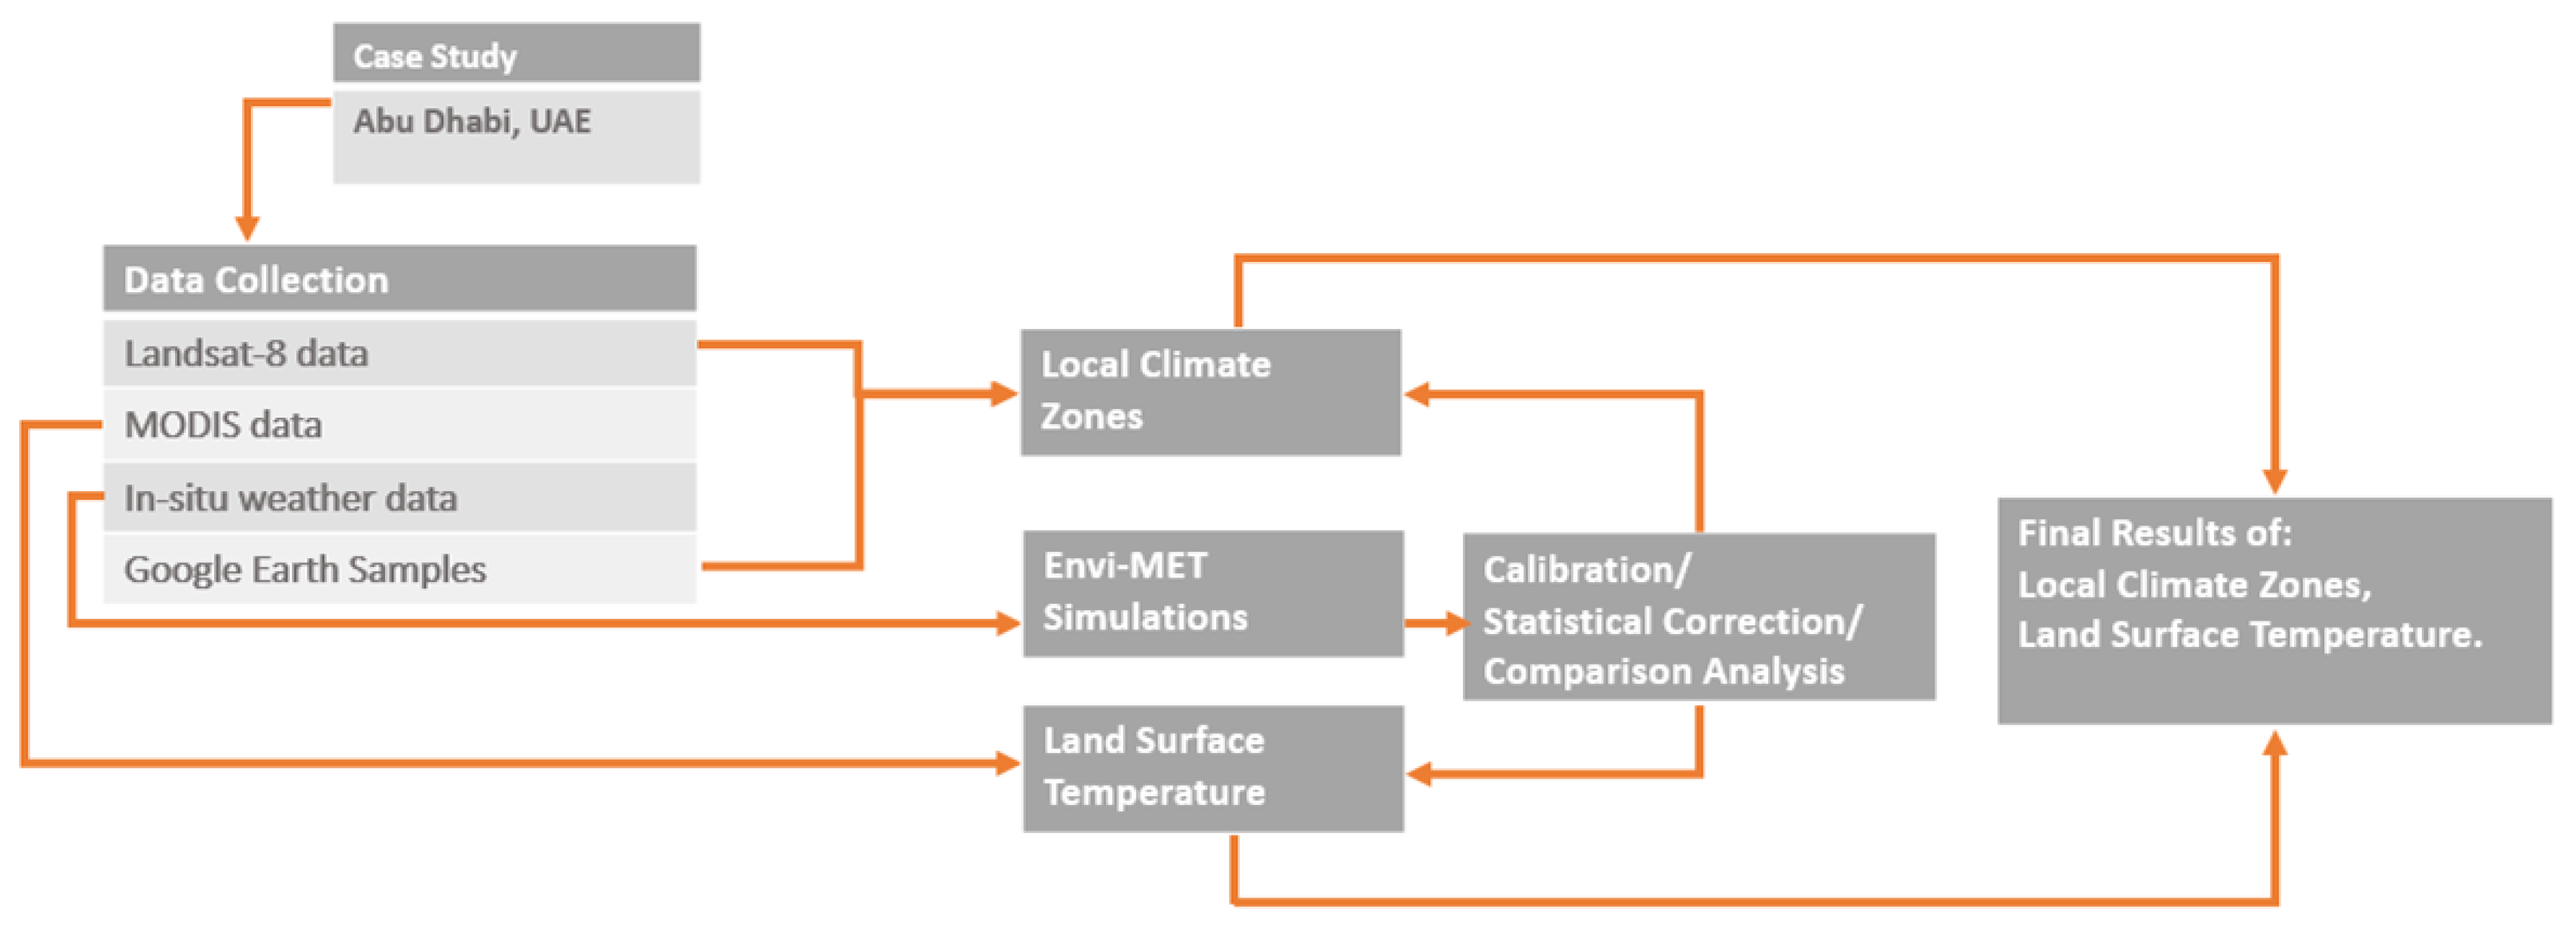
2.2. Data
- Landsat-8 images are used to perform classification of LCZ.
- Low spatial resolution MODIS/Terra data indicate the temporal trend of LST and as a means for validation of the in-situ temperature measurements.
- High temporal and temperature resolution, accuracy in-situ measurements from an extensive urban climate monitoring campaign.
2.2.1. Landsat-8 Data
2.2.2. MODIS Data
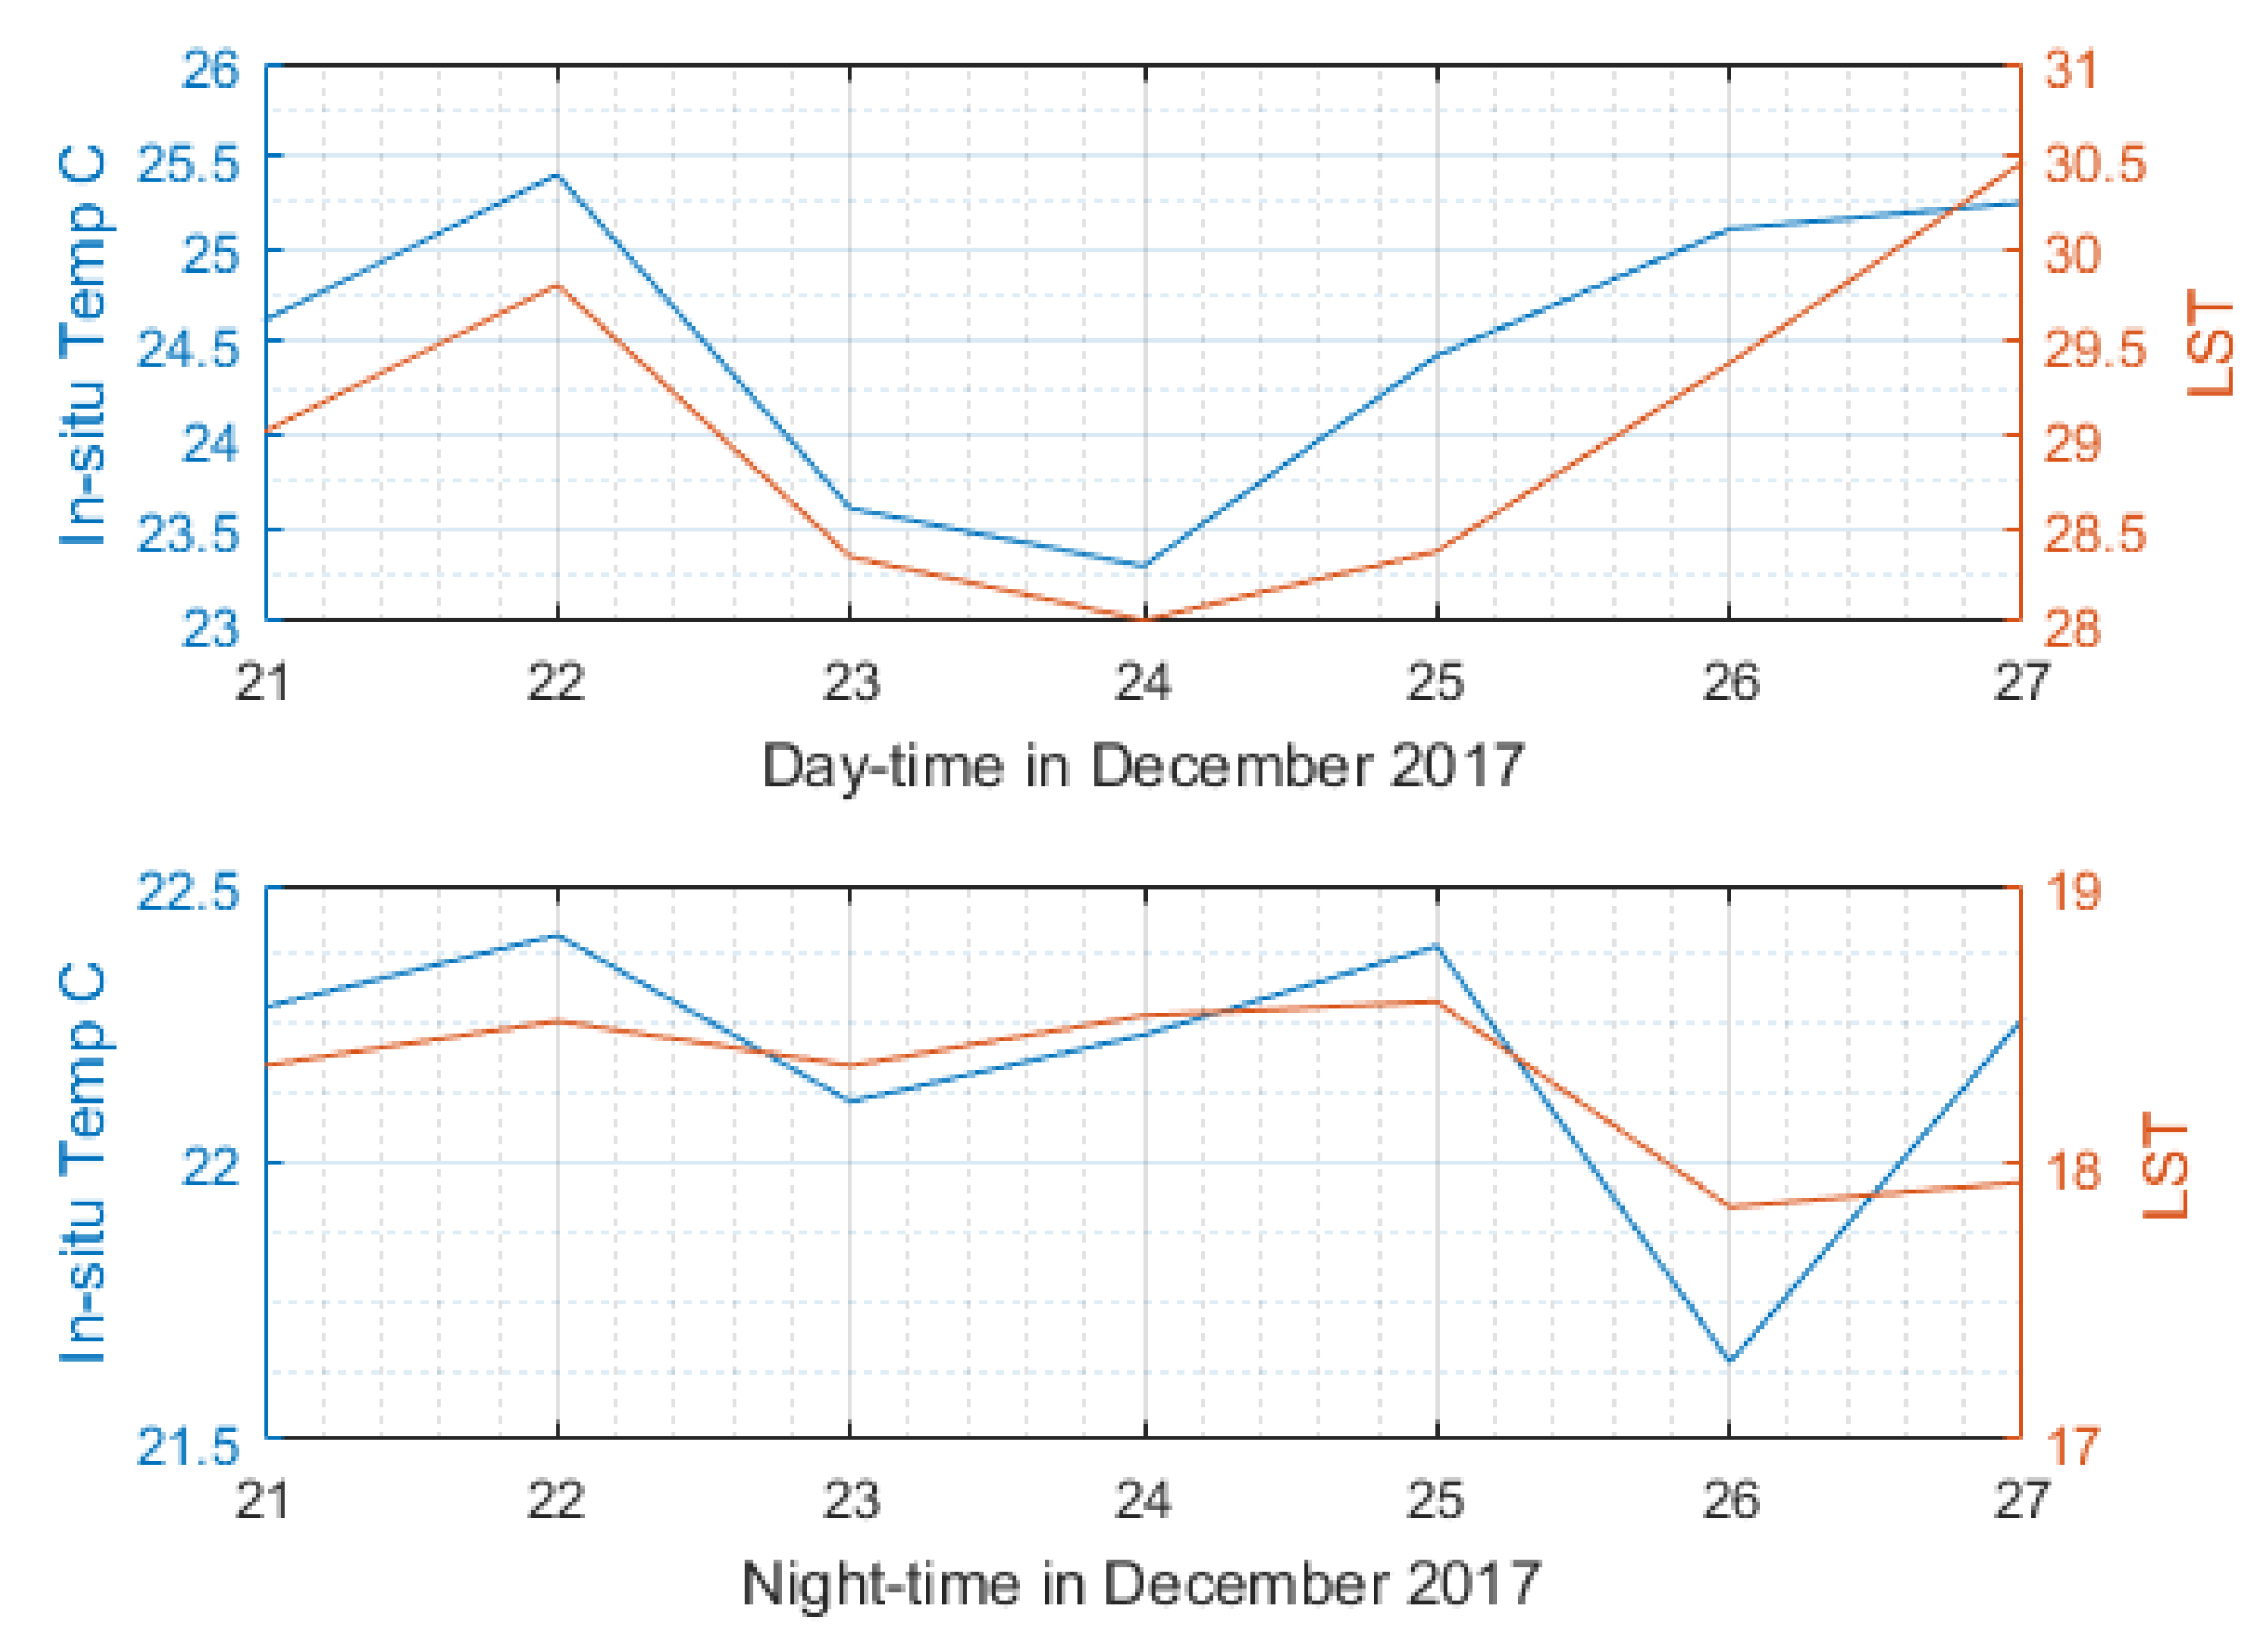
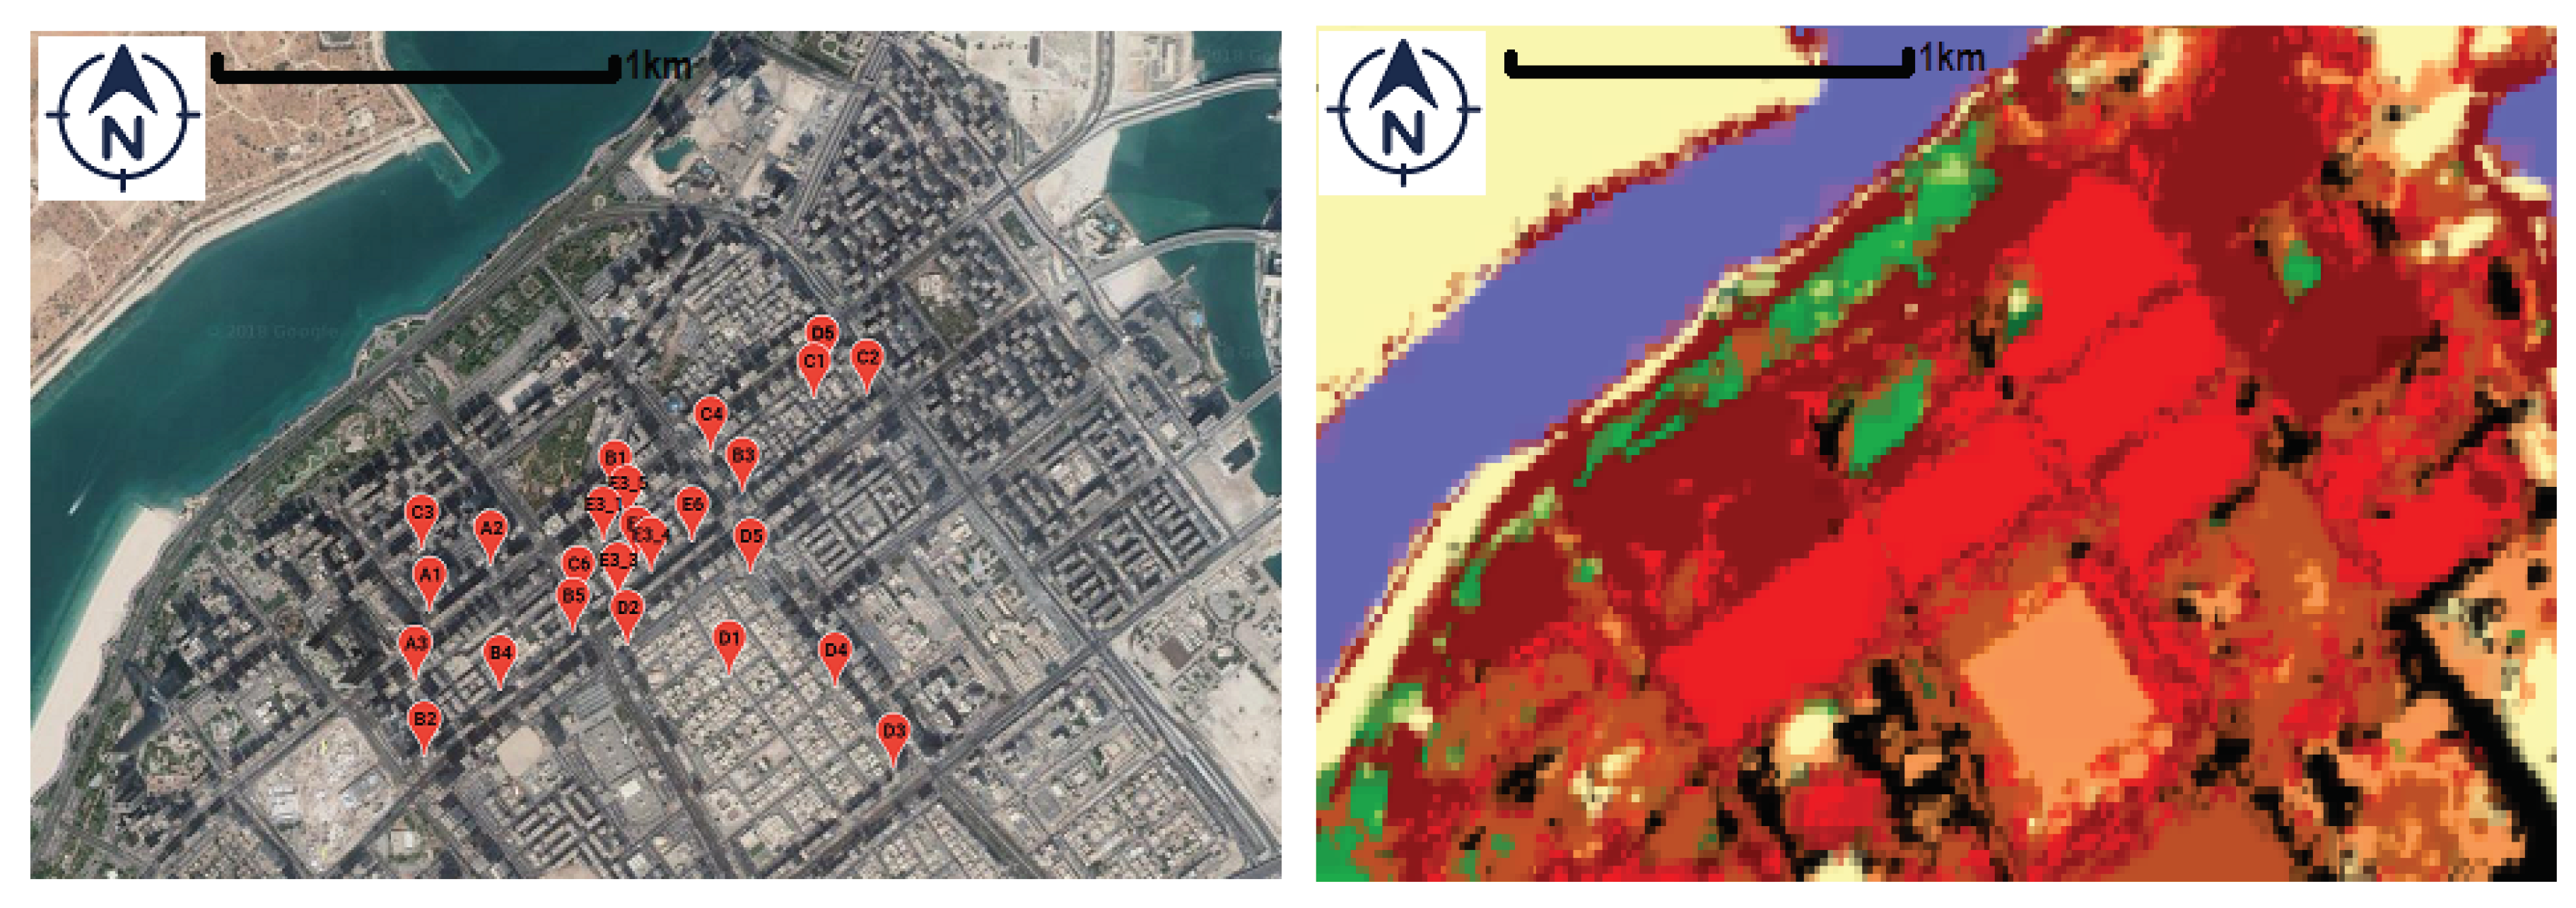
2.2.3. In-Situ Weather Data
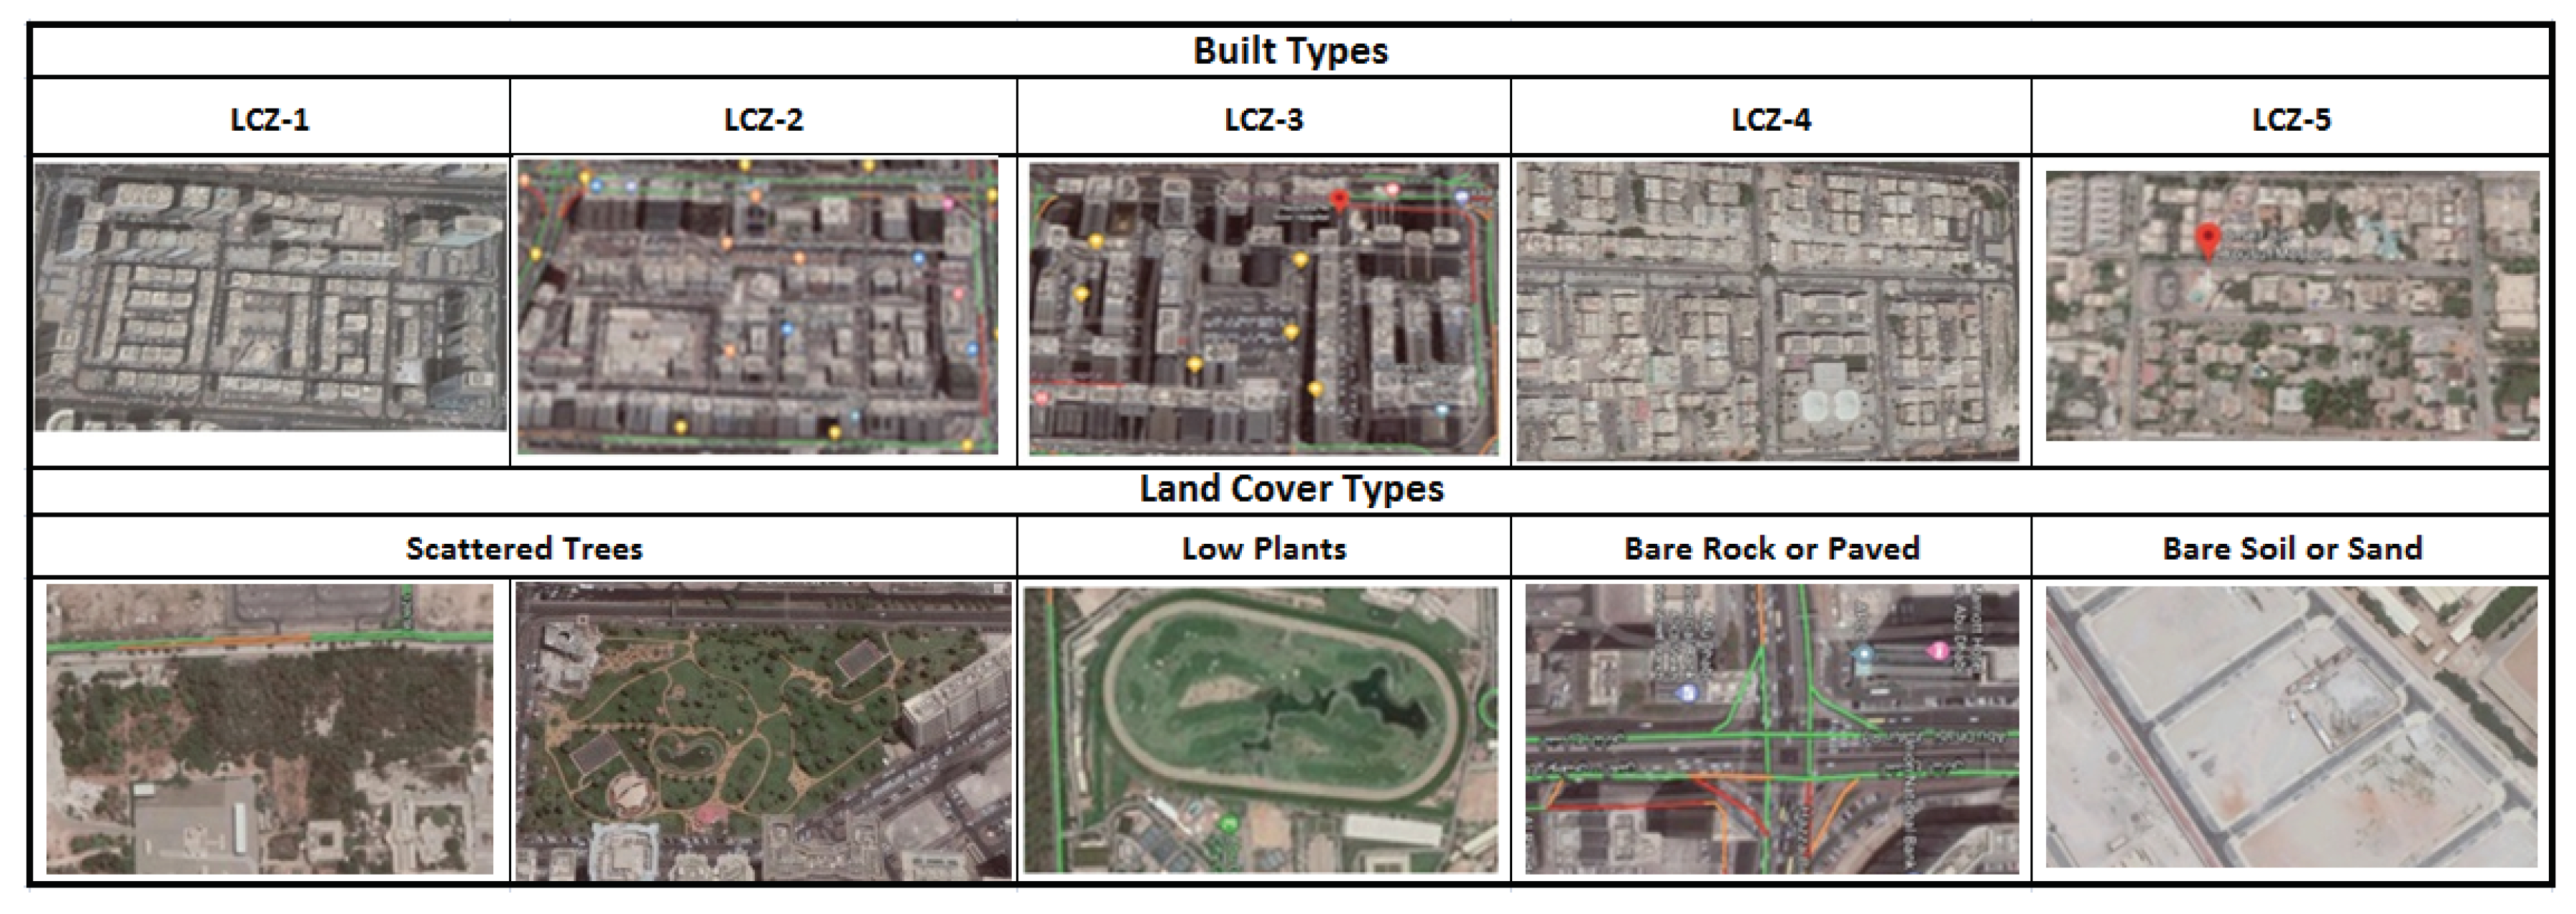
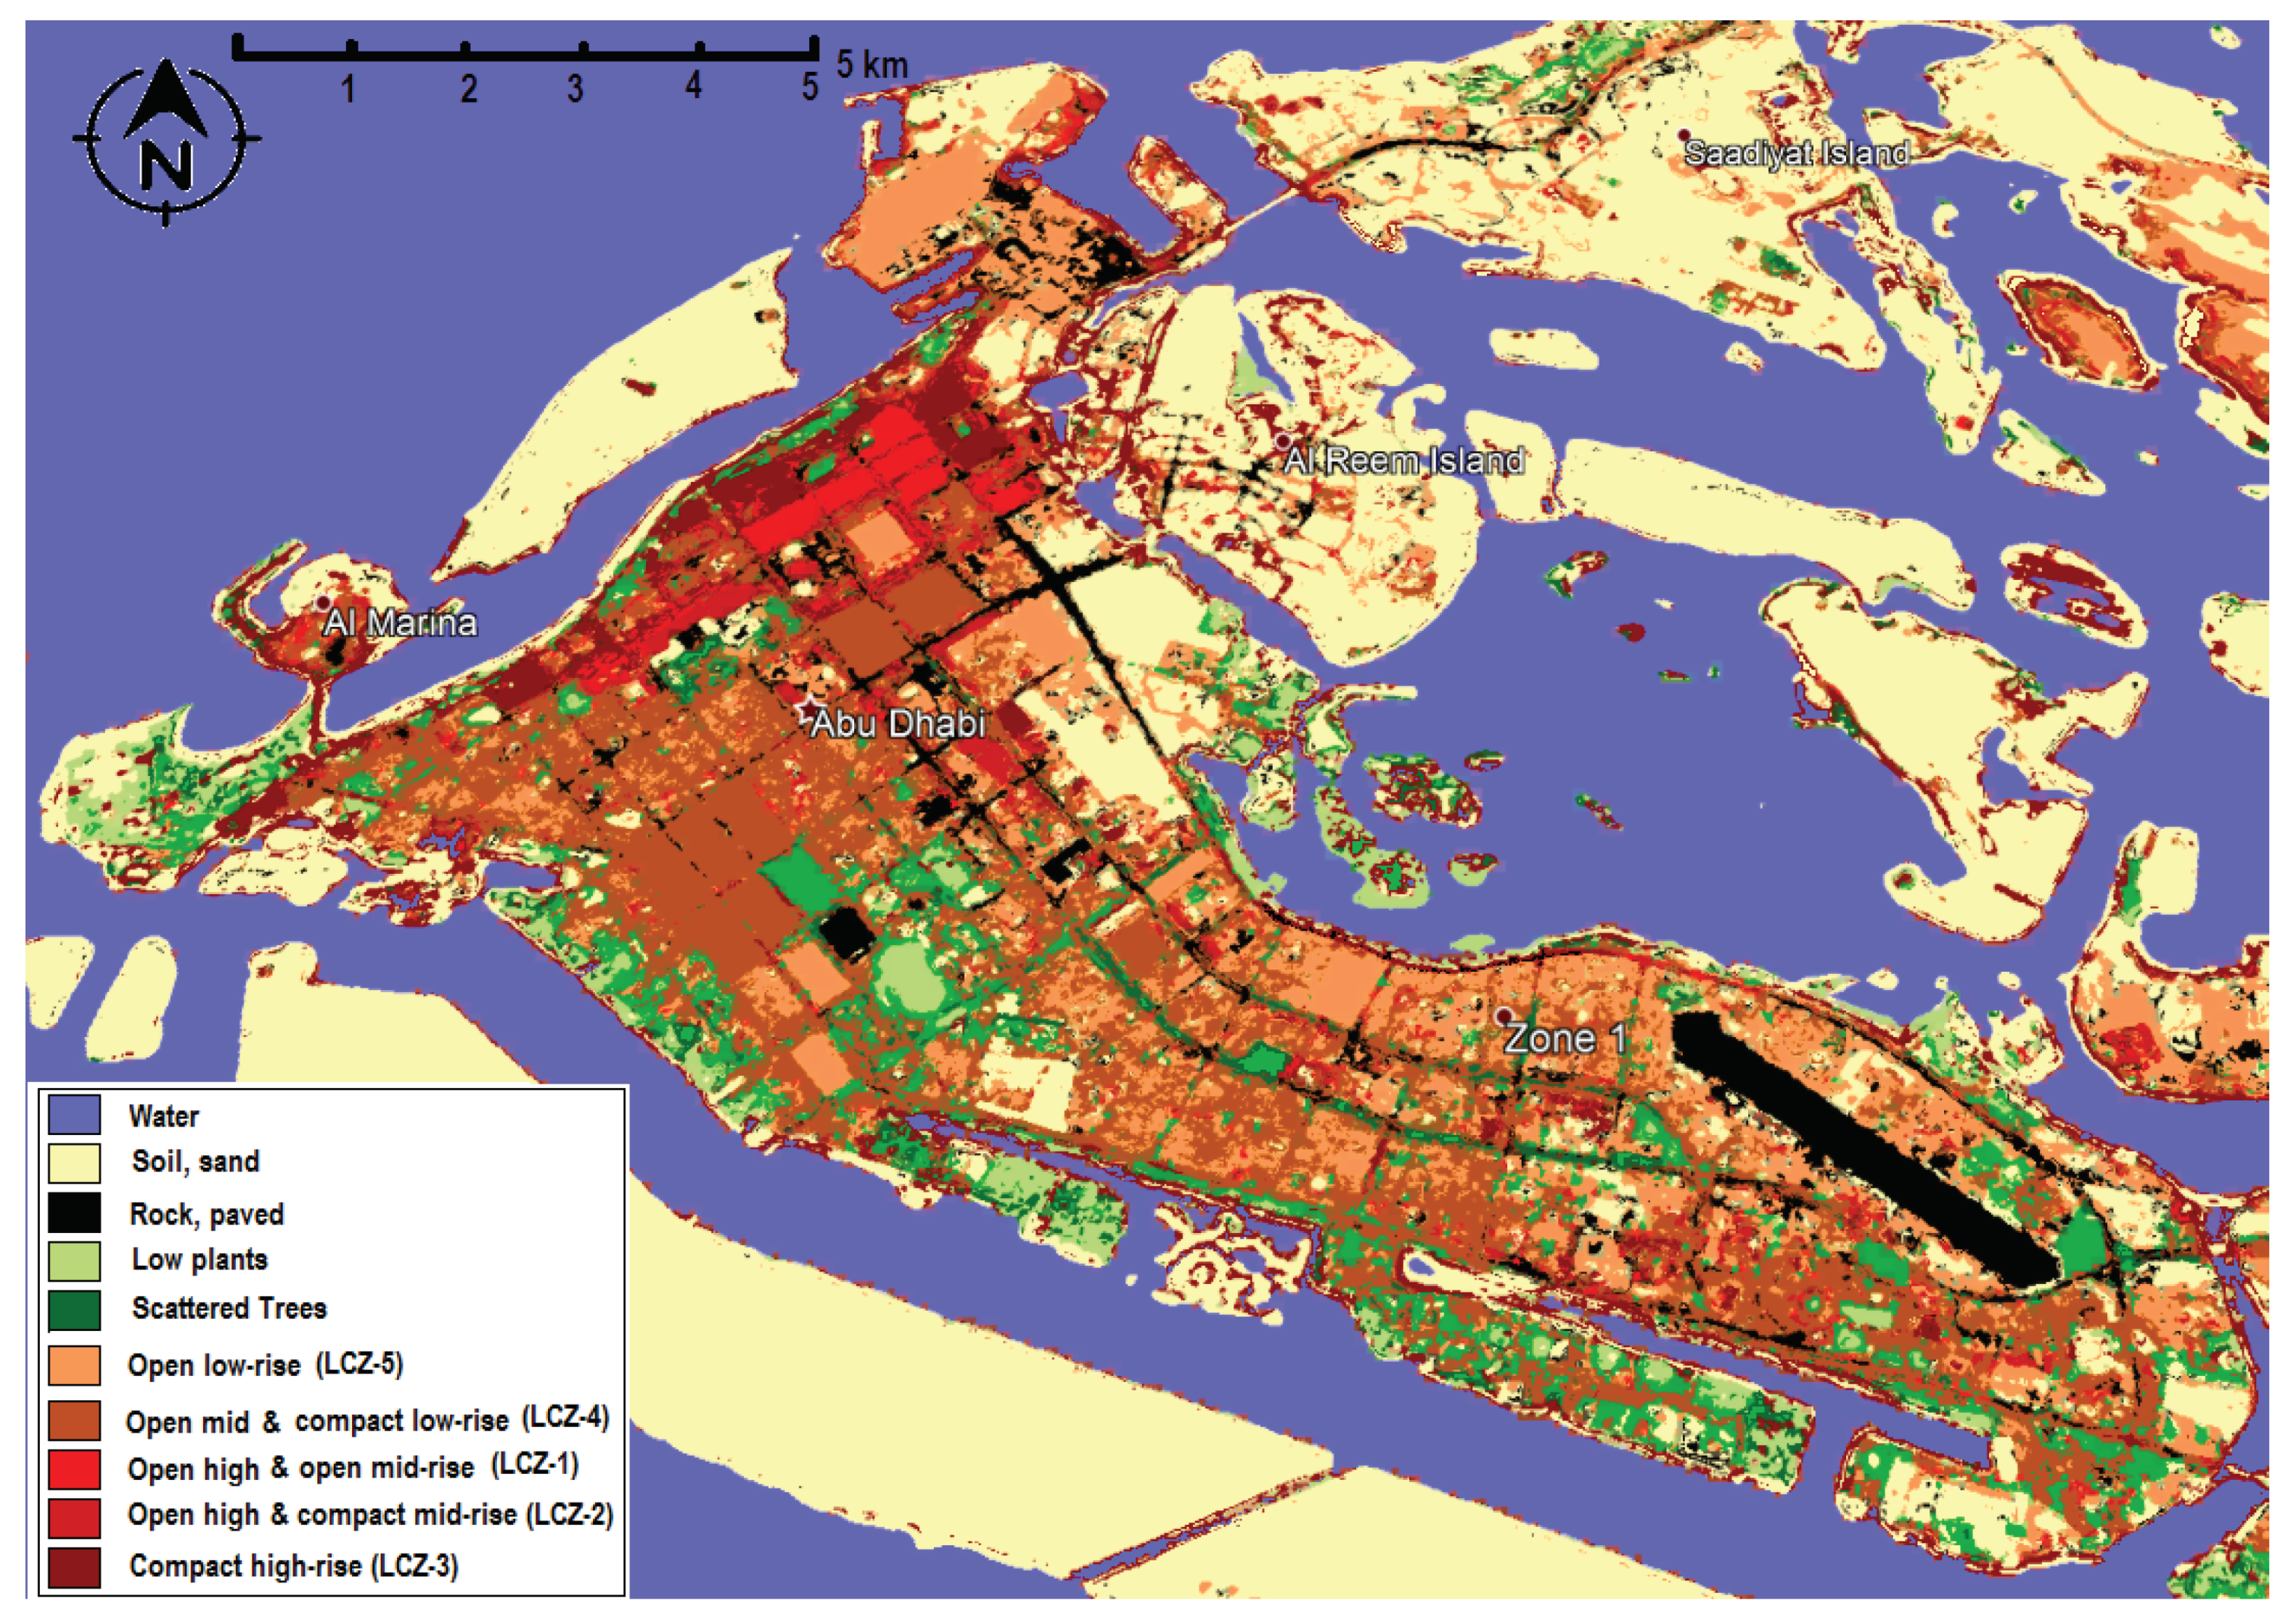
2.3. Local Climate Zone Classification
2.4. Modeling Using Envi-Met
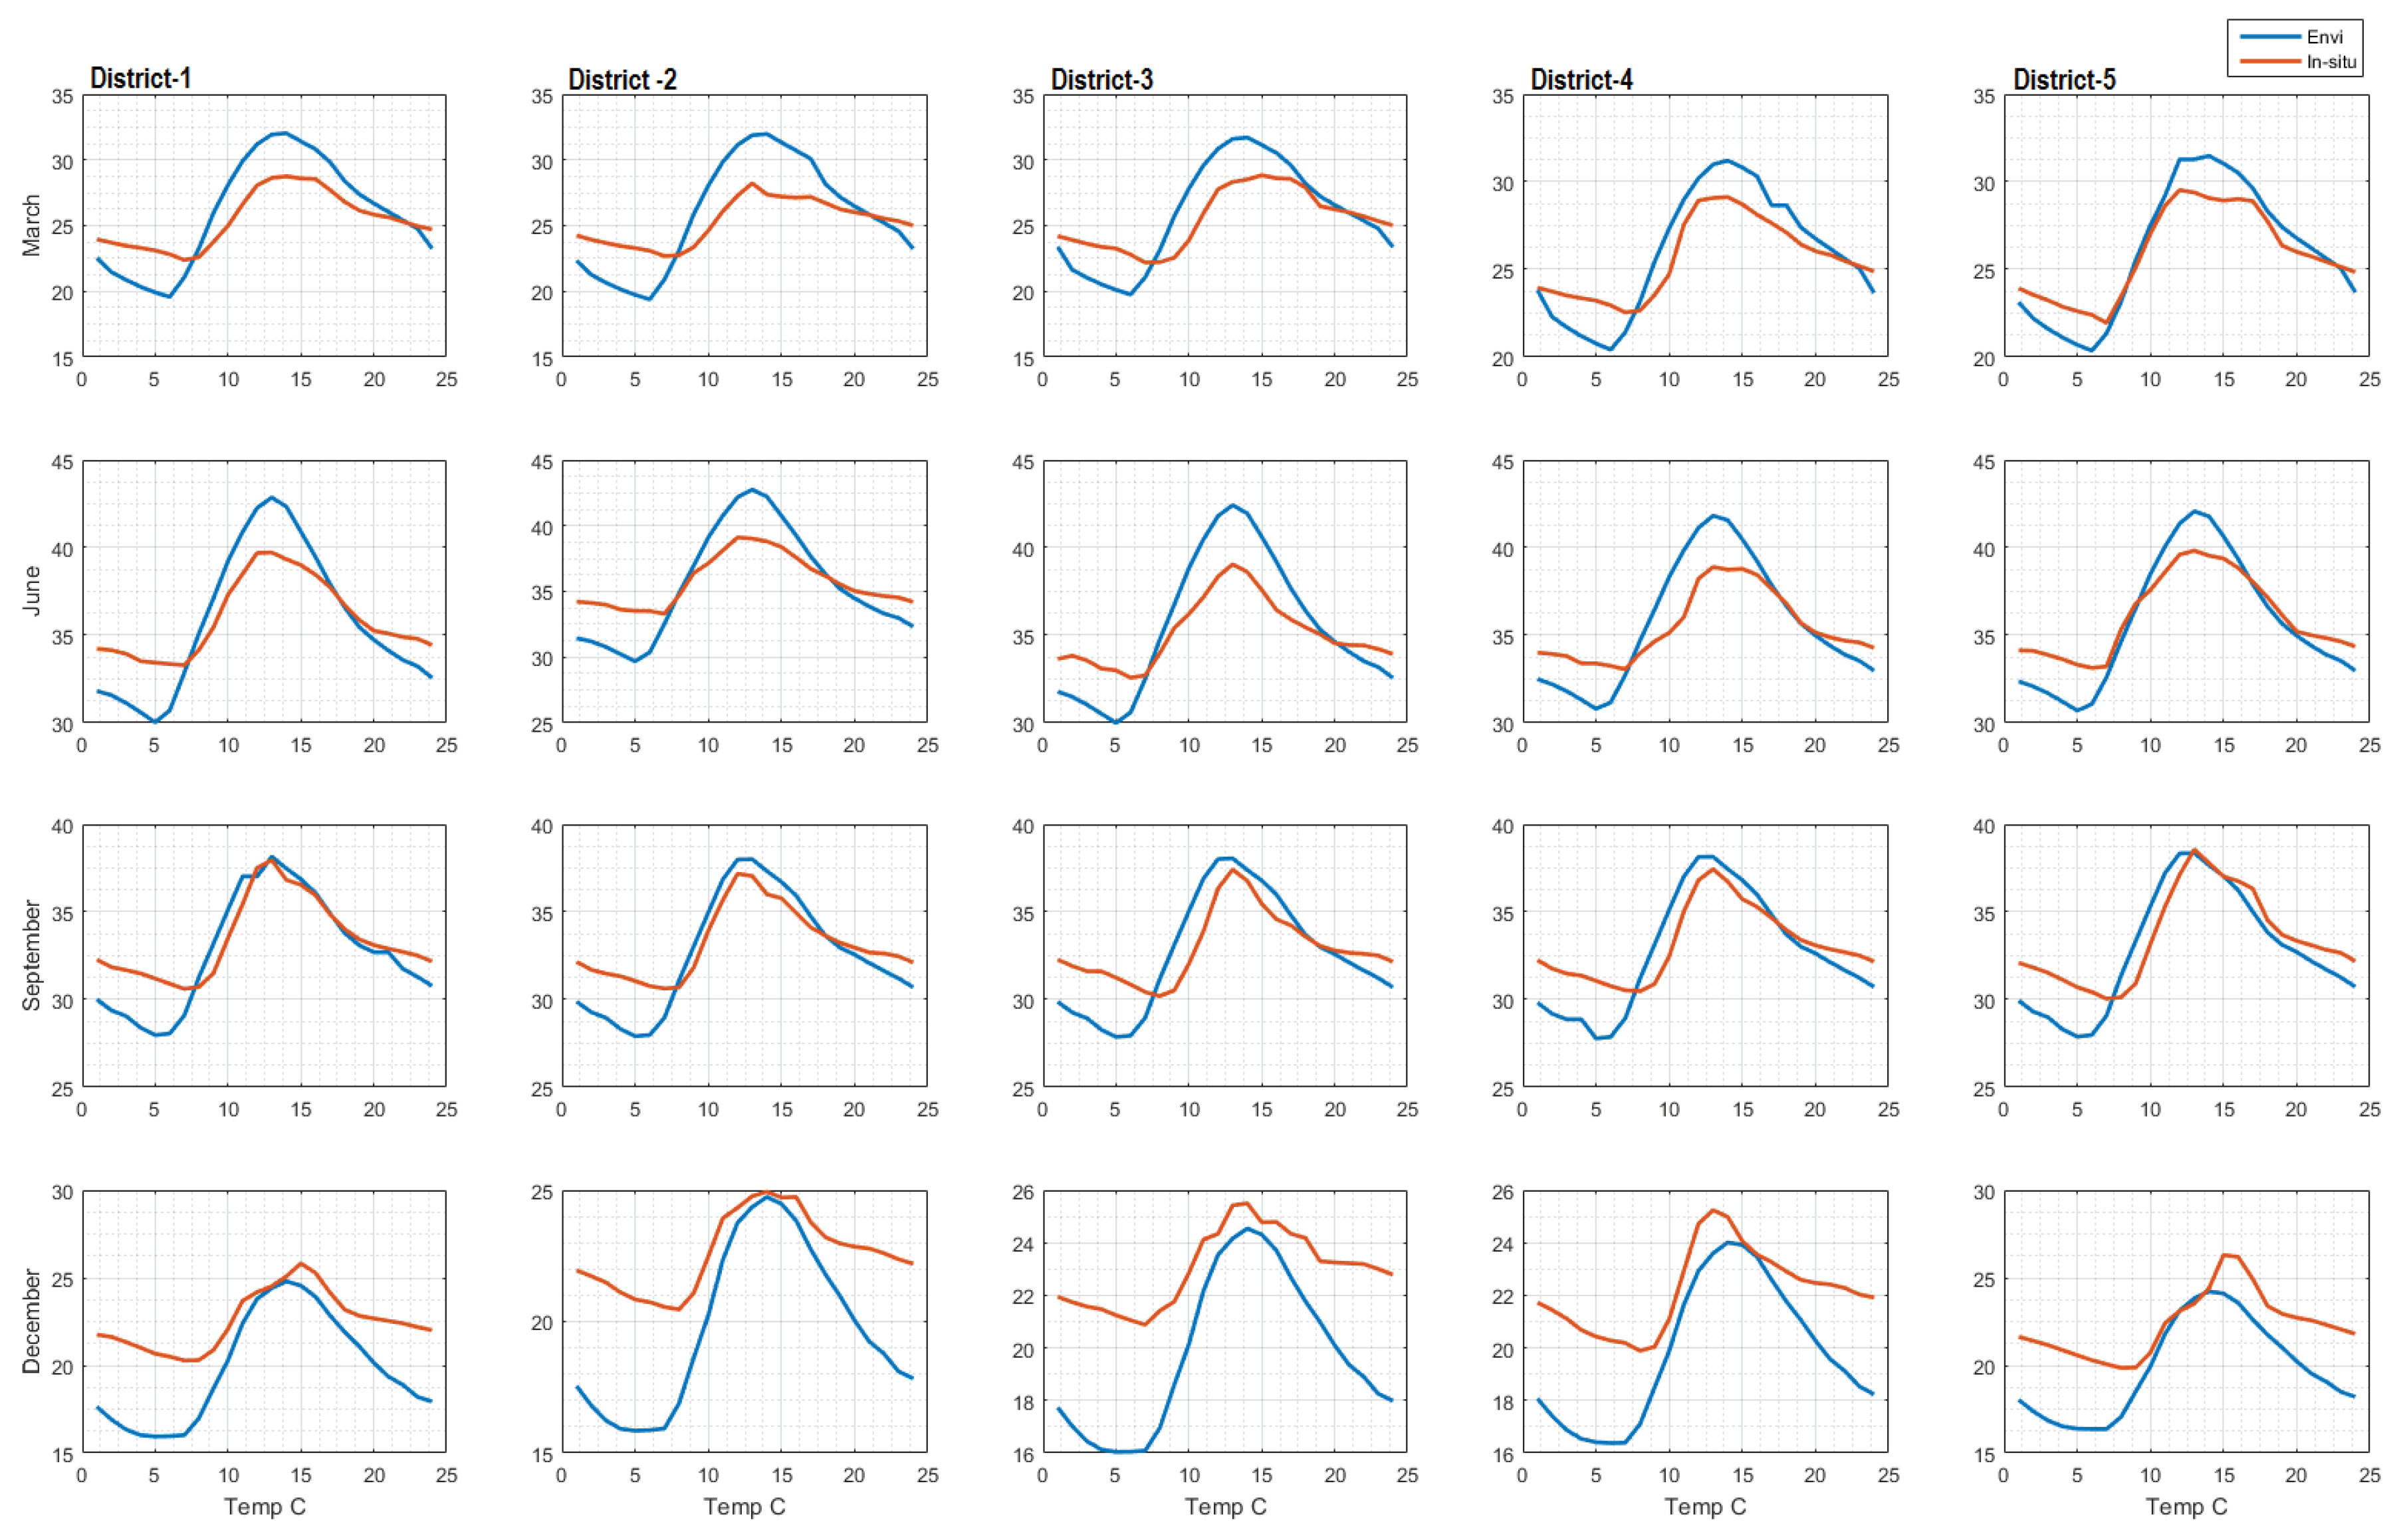
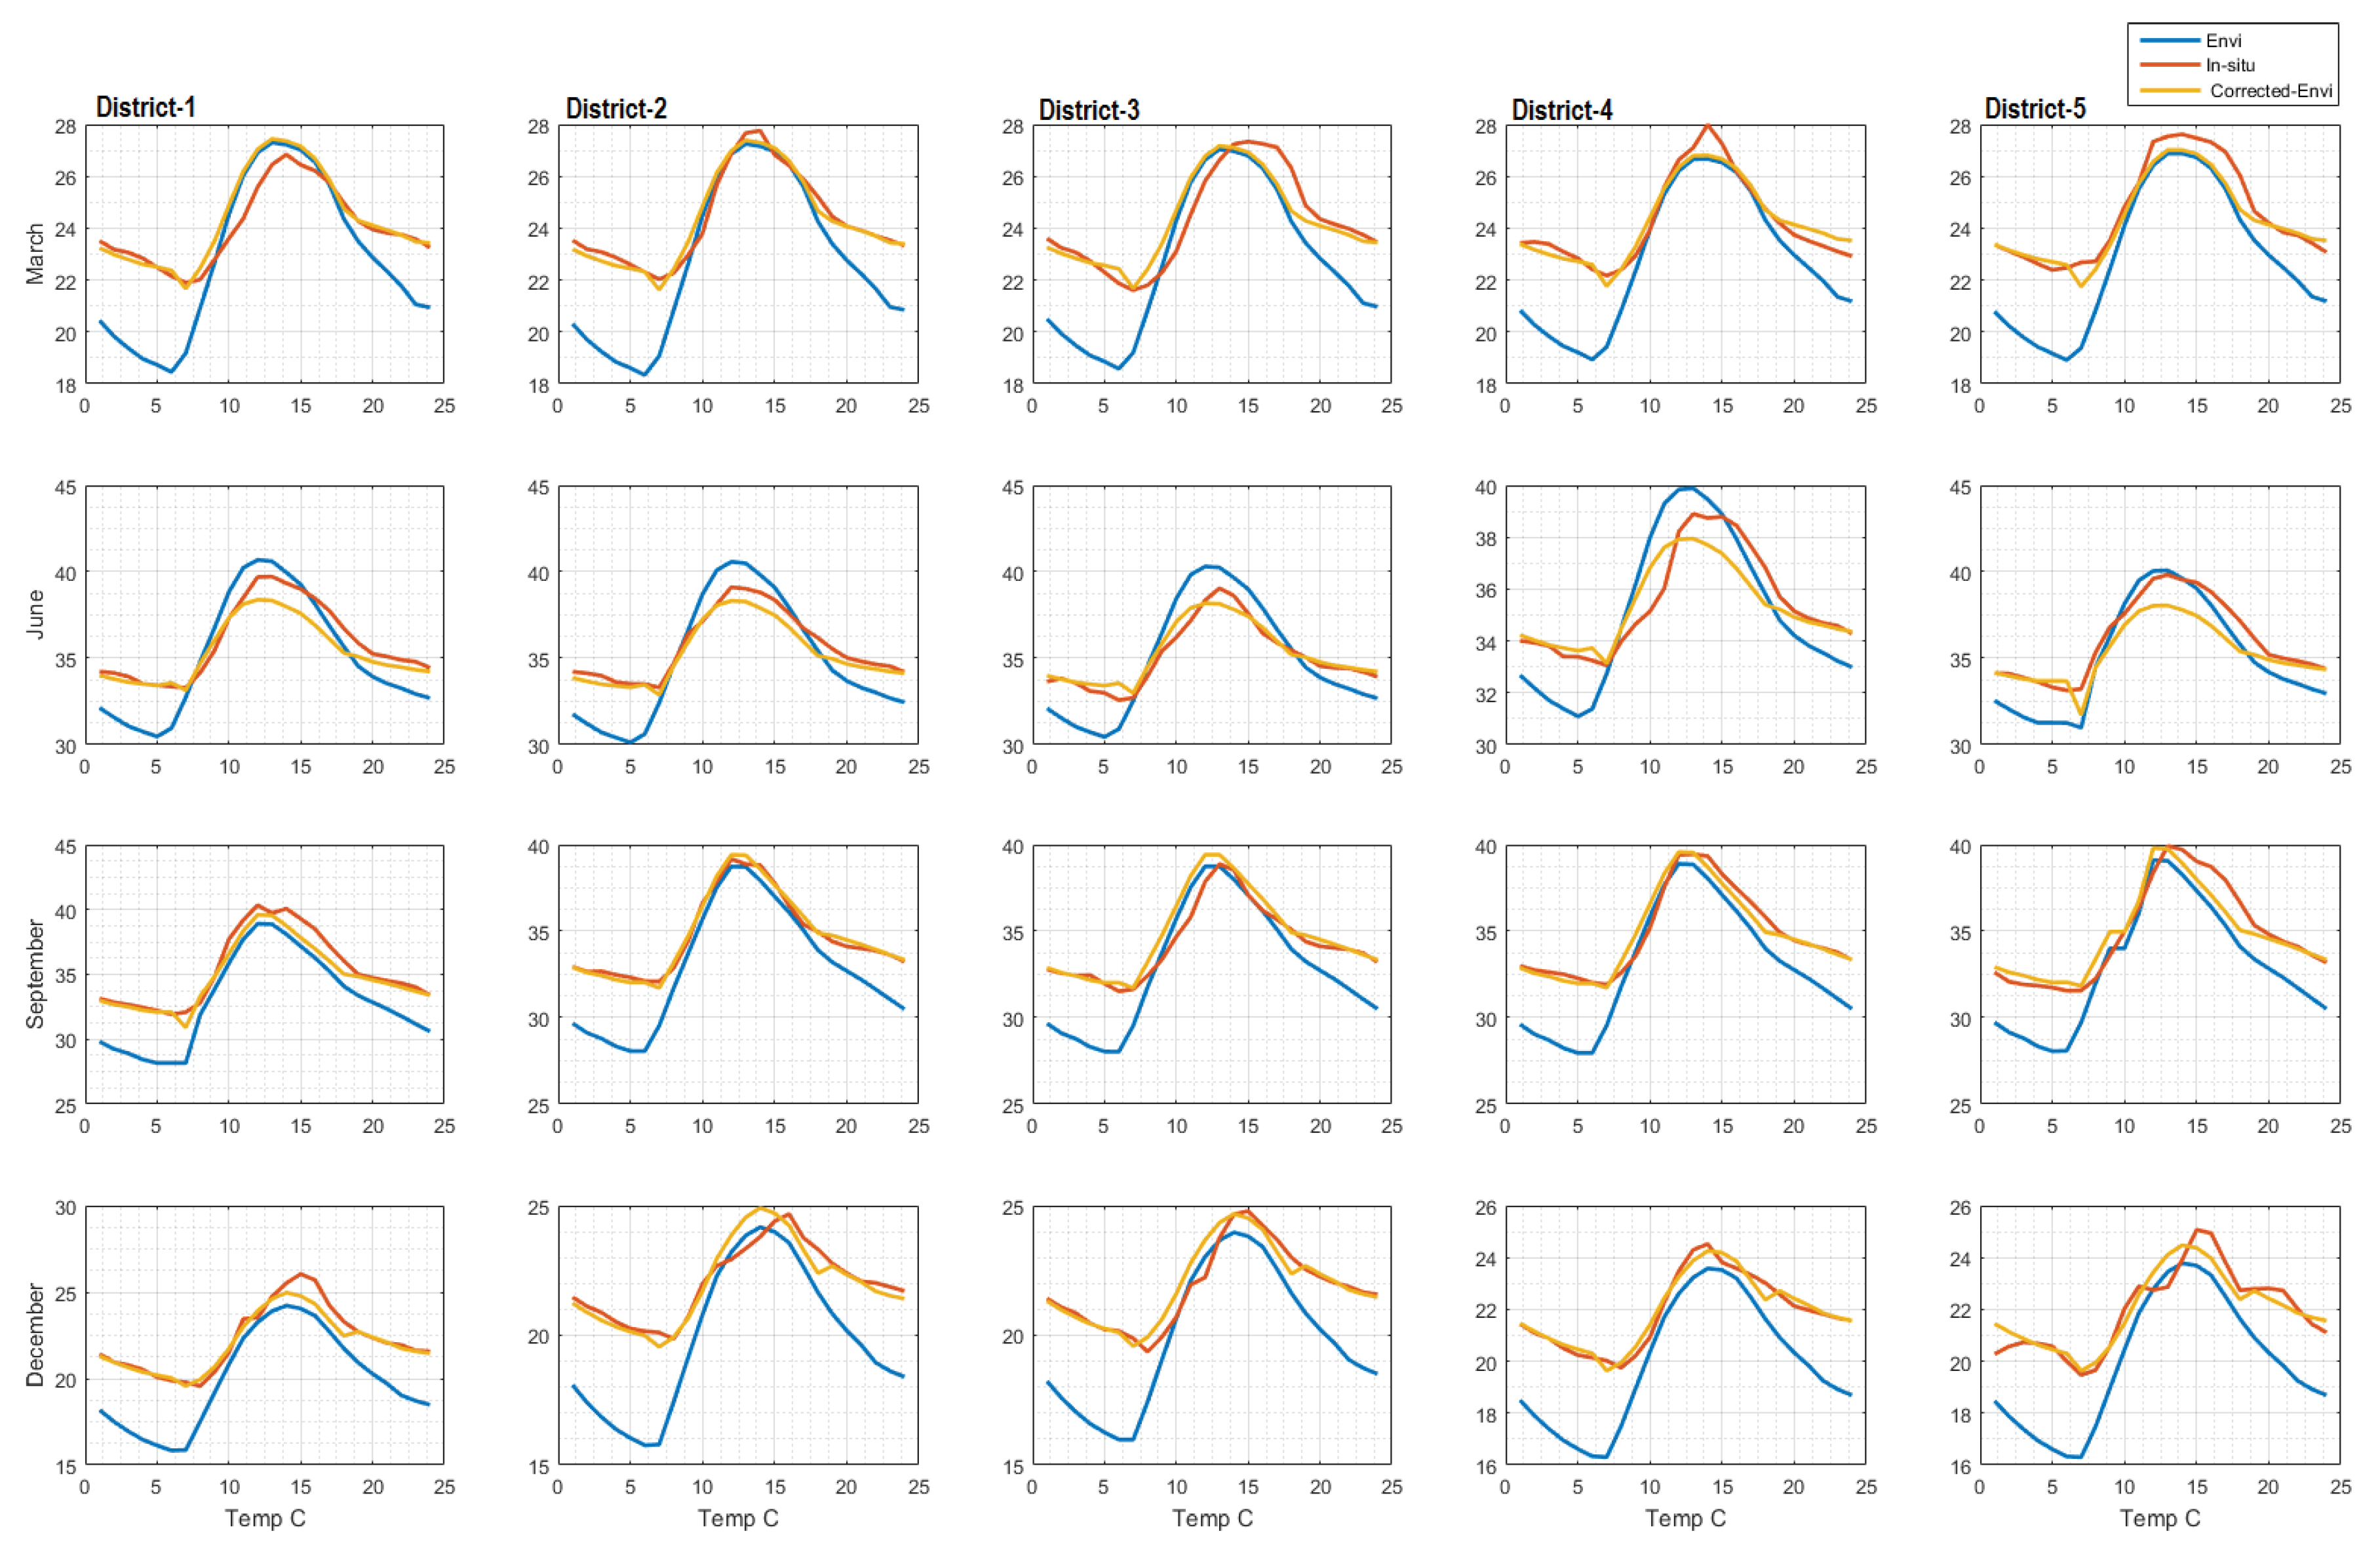
3. Results
4. Conclusions and Future Work
Author Contributions
Funding
Acknowledgments
Conflicts of Interest
Appendix A


References
- Demuzere, M.; Bechtel, B.; Middel, A.; Mills, G. Mapping Europe into local climate zones. PLoS ONE 2019, 14, e0214474. [Google Scholar] [CrossRef] [PubMed] [Green Version]
- Ching, J.; Mills, G.; Bechtel, B.; See, L.; Feddema, J.; Wang, X.; Ren, C.; Brousse, O.; Martilli, A.; Neophytou, M.; et al. WUDAPT: An urban weather, climate, and environmental modeling infrastructure for the anthropocene. Bull. Am. Meteorol. Soc. 2018, 99, 1907–1924. [Google Scholar] [CrossRef] [Green Version]
- Bechtel, B.; Alexander, P.J.; Beck, C.; Böhner, J.; Brousse, O.; Ching, J.; Demuzere, M.; Fonte, C.; Gál, T.; Hidalgo, J.; et al. Generating WUDAPT Level 0 data–Current status of production and evaluation. Urban Clim. 2019, 27, 24–45. [Google Scholar] [CrossRef] [Green Version]
- Martin, M.; Bande, L.; Marpu, P.; Afshari, A.; Al, M.; Mustafa, A.; Reddy, G. Data Extraction as Input for the Energy analysis of an urban district with UMI. In Proceedings of the CIB MENA, Abu Dhabi, UAE, 14–16 December 2014; pp. 1–11. [Google Scholar]
- Yin, C.; Yuan, M.; Lu, Y.; Huang, Y.; Liu, Y. Effects of urban form on the urban heat island effect based on spatial regression model. Sci. Total Environ. 2018, 634, 696–704. [Google Scholar] [CrossRef]
- Mills, G. Cities as agents of global change. Int. J. Climatol. 2007, 27, 1849–1857. [Google Scholar] [CrossRef]
- Mills, G. Urban climatology: History, status and prospects. Urban Clim. 2014, 10, 479–489. [Google Scholar] [CrossRef]
- Oke, T.R. City size and the urban heat island. Atmos. Environ. (1967) 1973, 7, 769–779. [Google Scholar] [CrossRef]
- Bokwa, A.; Hajto, M.J.; Walawender, J.P.; Szymanowski, M. Influence of diversified relief on the urban heat island in the city of Kraków, Poland. Theor. Appl. Climatol. 2015, 122, 365–382. [Google Scholar] [CrossRef] [Green Version]
- Alexander, P.J.; Mills, G. Local climate classification and Dublin’s urban heat island. Atmosphere 2014, 5, 755–774. [Google Scholar] [CrossRef] [Green Version]
- Emmanuel, R.; Krüger, E. Urban heat island and its impact on climate change resilience in a shrinking city: The case of Glasgow, UK. Build. Environ. 2012, 53, 137–149. [Google Scholar] [CrossRef]
- Lazzarini, M.; Marpu, P.R.; Ghedira, H. Temperature-land cover interactions: The inversion of urban heat island phenomenon in desert city areas. Remote Sens. Environ. 2013, 130, 136–152. [Google Scholar] [CrossRef]
- Lazzarini, M.; Molini, A.; Marpu, P.R.; Ouarda, T.B.; Ghedira, H. Urban climate modifications in hot desert cities: The role of land cover, local climate, and seasonality. Geophys. Res. Lett. 2015, 42, 9980–9989. [Google Scholar] [CrossRef] [Green Version]
- Stewart, I.D.; Oke, T.R. Local climate zones for urban temperature studies. Bull. Am. Meteorol. Soc. 2012, 93, 1879–1900. [Google Scholar] [CrossRef]
- Stewart, I.; Oke, T. Classifying urban climate field sites by “local climate zones”: The case of Nagano, Japan. In Proceedings of the IN: Seventh International Conference on Urban Climate, Yokohama, Japan, 29 June–3 July 2009; Volume 29. [Google Scholar]
- Meier, F.; Scherer, D. Spatial and temporal variability of urban tree canopy temperature during summer 2010 in Berlin, Germany. Theor. Appl. Climatol. 2012, 110, 373–384. [Google Scholar] [CrossRef]
- Lelovics, E.; Unger, J.; Gál, T.; Gál, C.V. Design of an urban monitoring network based on Local Climate Zone mapping and temperature pattern modelling. Clim. Res. 2014, 60, 51–62. [Google Scholar] [CrossRef] [Green Version]
- Lehnert, M.; Geletič, J.; Husák, J.; Vysoudil, M. Urban field classification by “local climate zones” in a medium-sized Central European city: The case of Olomouc (Czech Republic). Theor. Appl. Climatol. 2015, 122, 531–541. [Google Scholar] [CrossRef]
- Skarbit, N.; Gal, T.; Unger, J. Airborne surface temperature differences of the different Local Climate Zones in the urban area of a medium sized city. In Proceedings of the 2015 Joint IEEE Urban Remote Sensing Event (JURSE), Lausanne, Switzerland, 30 March–1 April 2015; pp. 1–4. [Google Scholar]
- Alexander, P.J.; Mills, G.; Fealy, R. Using LCZ data to run an urban energy balance model. Urban Clim. 2015, 13, 14–37. [Google Scholar] [CrossRef] [Green Version]
- Stewart, I.D.; Oke, T.R. Thermal differentiation of local climate zones using temperature observations from urban and rural field sites. In Proceedings of the Ninth Symposium on Urban Environment, Keystone, CO, USA, 2–6 August 2010; pp. 2–6. [Google Scholar]
- Ng, Y.X. A study of urban heat island using “Local Climate Zones”—The case of Singapore. Br. J. Environ. Clim. Chang. 2015, 116–133. [Google Scholar] [CrossRef]
- Kotharkar, R.; Bagade, A. Local Climate Zone classification for Indian cities: A case study of Nagpur. Urban Clim. 2018, 24, 369–392. [Google Scholar] [CrossRef]
- Essa, S.M.; Loughland, R.; Khogali, M.E. Change detection analysis of multi-temporal imagery to assess environmental development on AL Sammalyah Island, Abu-Dhabi. In Remote Sensing for Environmental Monitoring, GIS Applications, and Geology V; International Society for Optics and Photonics: San Diego, CA, USA, 2005; Volume 5983, p. 59830C. [Google Scholar]
- Yagoub, M.; Kolan, G.R. Monitoring coastal zone land use and land cover changes of Abu Dhabi using remote sensing. J. Indian Soc. Remote Sens. 2006, 34, 57–68. [Google Scholar] [CrossRef]
- Website. Online Portal. Available online: http://www.f-in-d.com/stories/abu-dhabi-guide-2014-introduction (accessed on 15 January 2019).
- Website. Online Portal. Available online: https://www.politesi.polimi.it/handle/10589/132660?mode=full (accessed on 18 December 2019).
- Jha, M.; Marpu, P.R.; Chau, C.K.; Armstrong, P. Design of sensor network for urban micro-climate monitoring. In Proceedings of the 2015 IEEE First International Smart Cities Conference (ISC2), Guadalajara, Mexico, 25–28 October 2015; pp. 1–4. [Google Scholar]
- Jha, M.; Tsoupos, A.; Marpu, P.R.; Chau, C.K.; Armstrong, P. In-situ Sensor Network for Microclimate and Urban Energy Modeling and Validation. In Proceedings of the Seventh International Conference on Future Energy Systems Poster Sessions (e-Energy ’16), Waterloo, ON, Canada, 21–24 June 2016; ACM: New York, NY, USA, 2016; pp. 1:1–1:2. [Google Scholar] [CrossRef]
- Conrad, O.; Bechtel, B.; Bock, M.; Dietrich, H.; Fischer, E.; Gerlitz, L.; Wehberg, J.; Wichmann, V.; Böhner, J. System for automated geoscientific analyses (SAGA) v. 2.1. 4. Geosci. Model Dev. 2015, 8, 1991–2007. [Google Scholar] [CrossRef] [Green Version]
- Aida, M. Urban albedo as a function of the urban structure—A model experiment. Bound.-Layer Meteorol. 1982, 23, 405–413. [Google Scholar] [CrossRef]
- Bruse, M. Modelling and strategies for improved urban climates. In Proceedings of the International Conference on Urban Climatology & International Congress of Biometeorology, Sydney, Australia, 8 November 1999; pp. 8–12. [Google Scholar]
- Bruse, M. Simulating microscale climate interactions in complex terrain with a high-resolution numerical model: A case study for the Sydney CBD area. In Proceedings of the International Conference on Urban Climatology & International Congress of Biometeorology, Sydney, Australia, 8 November 1999. [Google Scholar]
- Leconte, F.; Bouyer, J.; Claverie, R.; Pétrissans, M. Estimation of spatial air temperature distribution at sub-mesoclimatic scale using the LCZ scheme and mobile measurements. In Proceedings of the 9th International Conference on Urban Climate (ICUC9) Jointly with 12th Symposium on the Urban Environment, Toulouse, France, 20–24 July 2015. [Google Scholar]
- Bruse, M. ENVI-met 3.0: Updated Model Overview; University of Bochum: Bochum, Germany, 2004; Available online: www.envi-met.com (accessed on 18 December 2019).
- Huttner, S.; Bruse, M. Numerical modeling of the urban climate—A preview on ENVI-met 4.0. In Proceedings of the 7th International Conference on Urban Climate ICUC-7, Yokohama, Japan, 29 June–3 July 2009; Volume 29. [Google Scholar]


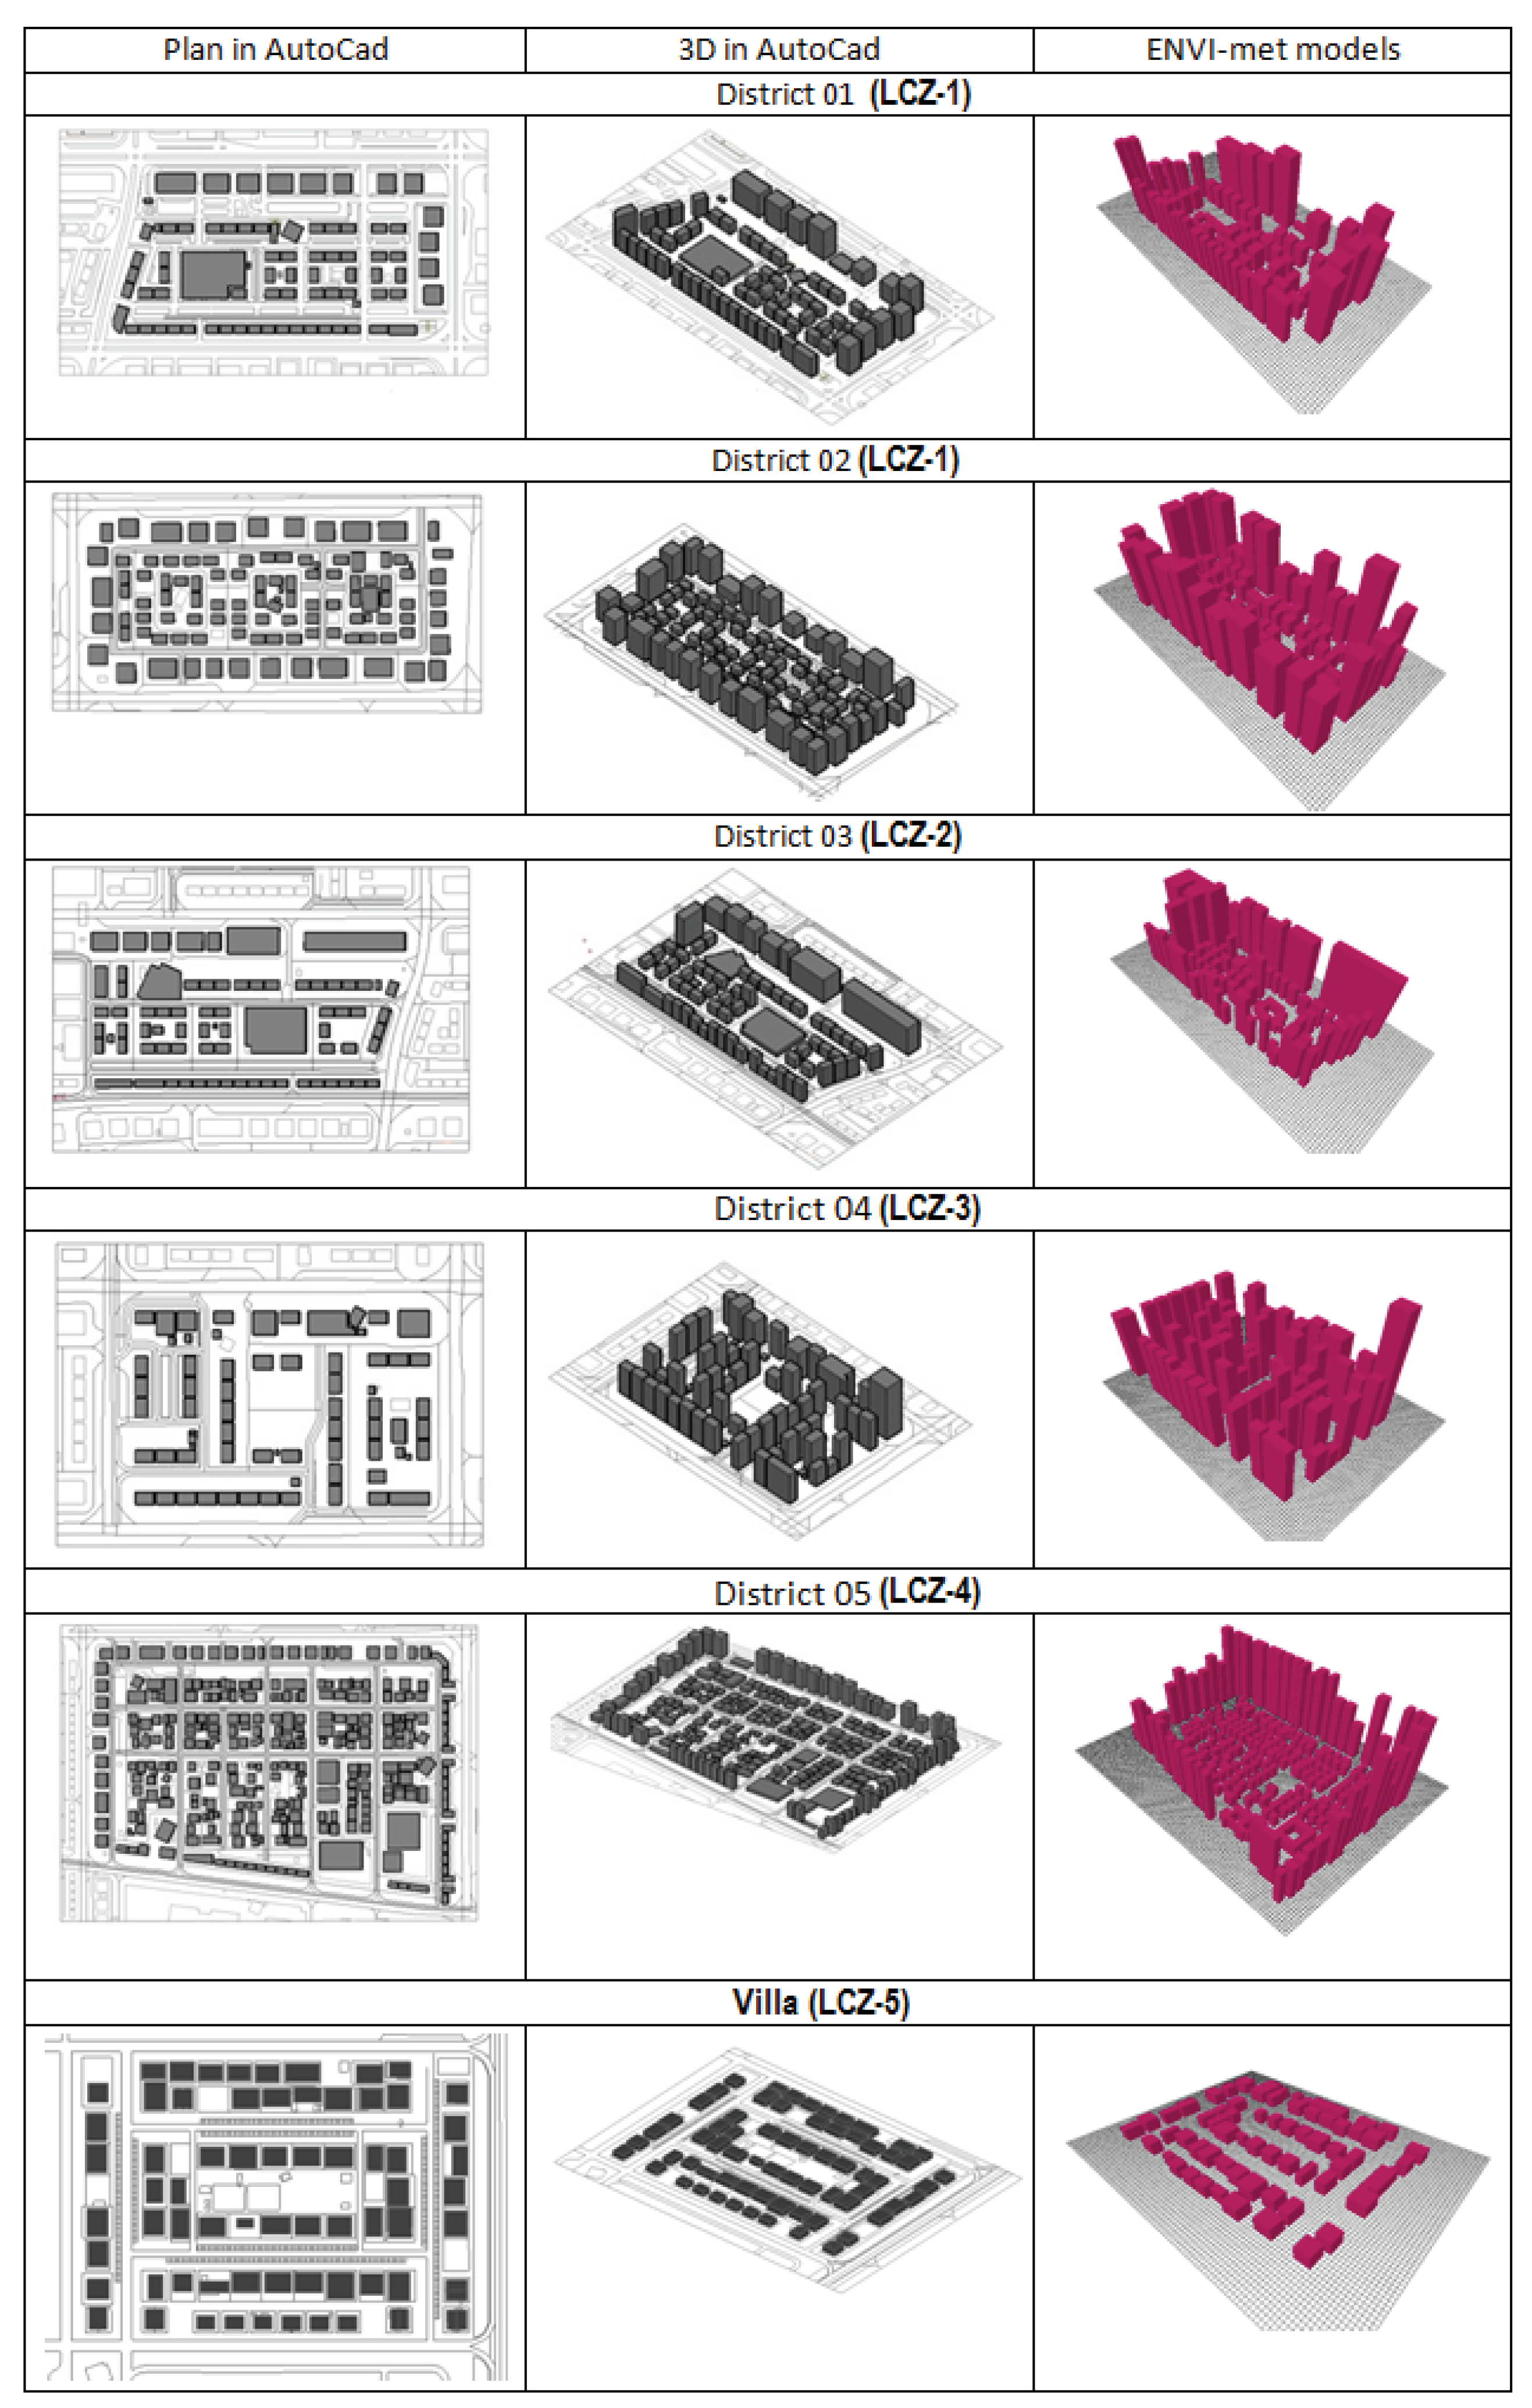
| Description | District (1 & 2) | District 3 | District 4 | District 5 | Villa |
|---|---|---|---|---|---|
| LCZ-Type | LCZ-1 | LCZ-2 | LCZ-3 | LCZ-4 | LCZ-5 |
| Area of district (m2) | 219.00 | 118.00 | 332.00 | 719.00 | 219.00 |
| Total build area (m2) | 48.00 | 45.00 | 27.00 | 112.00 | 28.00 |
| No. of Buildings | 70 | 67 | 48 | 150 | 68 |
| Avg. building H (m) | 44 | 44 | 70 | 40 | 9 |
| Avg. street Width (m) | 27 | 26 | 32 | 25 | 22 |
| Rural (R) | Urban (U) | Envi-met (E) | |||||||||||
|---|---|---|---|---|---|---|---|---|---|---|---|---|---|
| S.No. | Scenario | D-1 | D-2 | D-3 | D-4 | D-5 | D-1 | D-2 | D-3 | D-4 | D-5 | Villa | |
| 1 | Sept. | 33.18 | 33.40 | 33.28 | 32.95 | 33.14 | 33.47 | 32.72 | 32.61 | 32.64 | 32.68 | 32.79 | 32.8 |
| U-R/E-R | 0.22 | 0.10 | −0.23 | −0.04 | 0.29 | −0.46 | −0.57 | −0.54 | −0.5 | −0.39 | −0.38 | ||
| E-U | −0.68 | −0.67 | −0.31 | −0.46 | −0.68 | N/A | |||||||
| 2. | June | 35.41 | 35.93 | 35.71 | 35.63 | 35.47 | 36.09 | 35.61 | 35.46 | 35.50 | 35.67 | 35.69 | 35.81 |
| U-R/E-R | 0.52 | 0.30 | 0.22 | 0.06 | 0.68 | 0.20 | 0.05 | 0.09 | 0.26 | 0.28 | 0.40 | ||
| E-U | −0.32 | −0.25 | −0.13 | 0.20 | −0.40 | N/A | |||||||
| 3. | Dec. | 19.74 | 22.54 | 22.31 | 22.95 | 22.18 | 22.30 | 19.8 | 19.71 | 19.73 | 19.76 | 19.79 | 19.8 |
| U-R/E-R | 2.8 | 2.57 | 3.21 | 2.44 | 2.56 | 0.06 | −0.03 | −0.01 | 0.02 | 0.05 | 0.06 | ||
| E-U | −2.74 | −2.60 | −3.22 | −2.42 | −2.51 | N/A | |||||||
| 4. | Mar. | 24.01 | 25.43 | 25.26 | 25.47 | 25.6 | 25.86 | 25.92 | 25.8 | 25.86 | 25.92 | 26.01 | 25.97 |
| U-R/E-R | 1.42 | 1.25 | 1.46 | 1.59 | 1.85 | 1.91 | 1.79 | 1.85 | 1.91 | 2 | 1.96 | ||
| E-U | 0.49 | 0.54 | 0.39 | 0.32 | 0.15 | N/A | |||||||
| Season | Period | p1 | p2 | p3 | M | P |
|---|---|---|---|---|---|---|
| June | Day | −0.159 | 1.83 | −9.71 | 0.70 | 1.14 |
| September | Day | 0.023 | −0.74 | 33.6 | 0.65 | 1.04 |
| December | Day | 0.061 | −1.82 | 33.03 | 0.65 | 0.84 |
| March | Day | 0.004 | −1.15 | 29.02 | 0.52 | 0.61 |
| June | Night | 0.023 | −1.13 | 45.95 | 0.28 | 0.75 |
| September | Night | −0.002 | 0.70 | 14.58 | 0.44 | 0.74 |
| December | Night | −0.004 | 0.68 | 10.3 | 0.22 | 0.25 |
| March | Night | −0.017 | 1.09 | 7.92 | 0.45 | 0.54 |
| Uncorrected Envi Results | Corrected Envi Results (CER) | CER LCZ-1 | |||||||||
|---|---|---|---|---|---|---|---|---|---|---|---|
| Seasons | D-1 | D-2 | D-3 | D-4 | D-5 | D-1 | D-2 | D-3 | D-4 | D-5 | D-2 |
| June | 2.62 | 2.31 | 2.22 | 2.43 | 2.29 | 0.74 | 0.27 | 0.81 | 0.55 | 0.85 | 0.35 |
| September | 2.61 | 2.71 | 2.49 | 2.34 | 2.34 | 0.50 | 0.50 | 0.49 | 0.27 | 0.56 | 0.41 |
| December | 2.16 | 2.24 | 2.18 | 1.95 | 2.02 | 0.65 | 0.35 | 0.77 | 0.41 | 0.55 | 0.24 |
| March | 1.71 | 1.85 | 2.00 | 2.08 | 1.33 | 0.84 | 0.78 | 1.47 | 1.62 | 0.83 | 0.68 |
| Season | Period | p1 | p2 | p3 | RMSE |
|---|---|---|---|---|---|
| June | Day | −0.020 | 2.217 | −17.89 | 0.60 |
| September | Day | 0.064 | −3.461 | 76.6 | 0.83 |
| December | Day | 0.013 | 0.010 | 16.7 | 0.26 |
| March | Day | 0.033 | −1.164 | 31.61 | 0.58 |
| June | Night | 0.001 | 0.432 | 20.21 | 0.14 |
| September | Night | −0.012 | 1.156 | 8.395 | 0.17 |
| December | Night | −0.075 | 3.196 | −10.9 | 0.16 |
| March | Night | −0.001 | 0.491 | 13.93 | 0.12 |
© 2019 by the authors. Licensee MDPI, Basel, Switzerland. This article is an open access article distributed under the terms and conditions of the Creative Commons Attribution (CC BY) license (http://creativecommons.org/licenses/by/4.0/).
Share and Cite
Manandhar, P.; Bande, L.; Tsoupos, A.; Marpu, P.R.; Armstrong, P. A Study of Local Climate Zones in Abu Dhabi with Urban Weather Stations and Numerical Simulations. Sustainability 2020, 12, 156. https://doi.org/10.3390/su12010156
Manandhar P, Bande L, Tsoupos A, Marpu PR, Armstrong P. A Study of Local Climate Zones in Abu Dhabi with Urban Weather Stations and Numerical Simulations. Sustainability. 2020; 12(1):156. https://doi.org/10.3390/su12010156
Chicago/Turabian StyleManandhar, Prajowal, Lindita Bande, Alexandros Tsoupos, Prashanth Reddy Marpu, and Peter Armstrong. 2020. "A Study of Local Climate Zones in Abu Dhabi with Urban Weather Stations and Numerical Simulations" Sustainability 12, no. 1: 156. https://doi.org/10.3390/su12010156
APA StyleManandhar, P., Bande, L., Tsoupos, A., Marpu, P. R., & Armstrong, P. (2020). A Study of Local Climate Zones in Abu Dhabi with Urban Weather Stations and Numerical Simulations. Sustainability, 12(1), 156. https://doi.org/10.3390/su12010156