Article

Biotope Area Factor: An Ecological Urban Index to Geovisualize Soil Sealing in Padua, Italy

by
Francesca Peroni
1,*,
Guglielmo Pristeri
2,
Daniele Codato
2,
Salvatore Eugenio Pappalardo
2 and
Massimo De Marchi
2
1
Department of Historical and Geographic Sciences and the Ancient World—DiSSGeA, University of Padova, 35141 Padova, Italy
2
Department of Civil, Environmental and Architectural Engineering, University of Padova, 35131 Padova, Italy
*
Author to whom correspondence should be addressed.
Sustainability 2020, 12(1), 150; https://doi.org/10.3390/su12010150
Submission received: 6 November 2019 / Revised: 5 December 2019 / Accepted: 19 December 2019 / Published: 23 December 2019

Abstract

:
Over the last few years, soil sealing has been recognized as one of the major threats in terms of soil degradation and loss of ecosystem services. Although many efforts have been promoted to increase the awareness of safeguarding soil for stakeholders, its value as a non-renewable resource as well as soil-related services in urban ecosystems is not implemented enough in urban planning and policies. Due to the spatially explicit component and the geographical scale of soil sealing, mapping and quantifying the number of sealed surfaces is crucial. The aim of this paper was to estimate and geovisualize the soil sealed in the city of Padua (Italy) at a very detailed scale, testing the use of the Biotope Area Factor (BAF) index. Moreover, the paper aimed to simulate an alternative mitigation scenario in a specific study area of the city. Spatial analysis was performed testing the BAF index in a Geographic Information Sistem (GIS) environment and using aerial ortho-photos at very high resolution. The results show different values of the BAF index for all four neighborhoods from 0.35 to 0.69. In the mitigation scenario, the value of the BAF index was improved using a measure of green roofs. In conclusion, the paper provides an insightful case study for enriching the debate about soil sealing and gives scientific support for sustainable urban planning.

1. Soil Sealing in Europe and Italy

Soil sealing is one of the main forms of land take that affects urban and rural areas. It is considered the most intense form of land take by the increase of new artificial surfaces or settlement areas, for instance, residential, commercial, green urban areas, and transport areas [1]. As a result, agricultural lands, grasslands, and semi-natural lands are completely transformed [2]. Nevertheless, when the process of urbanization covers natural or semi-natural areas with artificial and impermeable materials, for example, asphalt or concrete, it is defined as soil sealing [3,4].
It has been observed that in wealthier countries, land take and soil sealing are not directly proportional to the growth of population as well as the expansion of urbanization as it usually occurs in developing countries [5]. It has been estimated by the European Environment Agency (EEA) that since the mid-1950s, the total surface area of cities in the European Union (EU) has increased by 78%, whereas the population has grown by only 33% [6].
Academic research and the EU Commission in 2002 began to focus on the soil sealing phenomenon as defined above, as it was recognized as one of the major threats in terms of the degradation of soil and the ecosystem services it provides [7]. In fact, the sealing of natural and semi-natural surfaces drastically reduces soil system processes and functions, affecting all the goods and services that soil provides to human well-being and ecosystems: carbon sequestration, microclimate regulation, groundwater reserves, biodiversity, and food production [8,9,10]. The process of sealing covers almost permanently natural or semi-natural soil, isolating other ecosystem compartments [8]. Thus, exchanges of energy, water, and gases are reduced or totally impeded [9]. Effects of soil sealing are exerted not only on the surfaces that are converted into artificial areas, but also on neighboring unsealed surfaces. Since soil is sealed and anthropic activities begin, full or partial restoration of ecosystem functions is a long and costly process [11,12]. For instance, recent studies have shown that for restored agricultural soil, biophysical processes are re-activated in about 15 years [13]. Moreover, urbanization processes and increases in built-up areas usually trigger the detriment of rural areas, which are critically affected by a decrease in arable lands and increase in the degradation of the most fertile soils [2,8,14,15].
Even if the preservation of the soil is crucial for human well-being and for the sustainability of ecosystems, at present in the EU there is a lack of specific legislation to protect the soil. The attempt promoted by the EU Commission to design a community framework for soil protection, the Soil Framework Directive, was withdrawn in 2014 [16]. Consequently, soil legislation was extremely fragmented across EU countries, governance levels, and policy domains [17,18]. In Italy, even if there were no laws to safeguard soil enforced at the national level, some regions have written their own laws over the last few years. In 2017, the Regional Council of Veneto wrote its own legislation for all of the regional territory including the city of Padua. The main target of the Veneto Regional Law 14/2017 is to achieve ‘no net land take’ by 2050, in accordance with the EU Environment Action Program to 2020 (Seventh EAP) [19,20]. Indeed, the law attempts to limit the construction of new buildings and infrastructures, defining a maximum net share of new sealed surfaces for each municipality in the region [21].
The track of European policies regarding soil sealing was released in 2012 when the EU Commission published the “Guidelines on best practice to limit, mitigate, or compensate soil sealing”, illustrating some solutions to deal with the phenomenon. This document is addressed to policymakers at all levels of governance and urban planners; it shows not only practical examples, for instance, local planning tools, but also policies and legislation to be applied for all EU countries. It pinpoints three general actions defined as limitation, mitigation, and compensation of soil sealing that may be adopted at different scales, and in different contexts and urban fabric. The most important measure is the limitation of soil sealing by means of preventing the conversion of green spaces or rural areas into new buildings or infrastructure. Whereby this solution does not occur, it is possible to maintain some functions of the soil by applying mitigation measures. For example, some mitigation measures are based on highly permeable materials and surfaces (reinforced grass systems with gravel, grass grids, or permeable concrete pavers), natural water harvesting systems, and green roofs (both intensive and extensive roofs) [22,23]. Benefits from these practices are different and multiple: reduction of surface run-off, improvement of air quality, microclimate regulation, and increase in biodiversity [24,25,26]. Finally, compensation measures are taken into account only in the case that it is not possible to act with limitation or mitigation measures.
Generally, the soil sealing phenomenon is investigated using statistical data on a local basis (municipalities and provinces), aerial imagery (satellites images or ortho-photos), and LiDAR [27,28,29]. When using remote sensed images, different vegetation-based (Normalized Difference Vegetation Index—NDVI, Soil-Adjusted Vegetation Index—SAVI, Normal Difference Built-up Index—NDBI) and ecological urban indexes (Biotope Area Factor, BAF) are adopted to assess soil sealing [30,31,32].
Due to the spatially explicit component and the geographical scale of the soil sealing phenomenon, mapping and quantifying the amount of sealed surfaces is crucial [29]. Moreover, soil sealing monitoring through time is paramount to support decision making regarding sustainable territory planning and to assess the state of urban ecosystem services. Since 2006, soil sealing has been monitored in all EU countries by mainly using statistical data (Land Use/Land Cover Area Frame Survey—LUCAS Program), and then, in 2015, using remotely sensed data through satellites images. In 2018, the Copernicus Land Monitoring Service performed a full reprocessing of the time series between 2006 and 2012 for comparative analyses by using an automatic derivation based on the calibrated normalized difference vegetation index (NDVI) [33]. Elaborations of updated data show that in Europe, between 2006 and 2009 and 2009 to 2012 periods, the soil sealing increased 2396 km2 and 2840 km2 respectively; finally, there was a decrease between the period of 2012 and 2015, with 1650 km2 of new sealing.
Moreover, the Copernicus Program supplied free and open data from satellite images at a geometric resolution of 10 m pixel, which the Italian National Institute for Environmental Protection and Research (ISPRA) has adopted to analyze and quantify soil sealing for the entire country. In Italy, in 2017, the percentage of impermeable surfaces was 7.65%, which corresponds to 23,063 km2 [34]. According to the EEA, Italy is one of the European countries with the highest amount of impervious surfaces. In the last ten years, probably due to the economic crisis, the speed of sealing has slightly decreased. On the other hand, in 2018, 54 km2 were transformed into impervious surfaces. The Po valley is the most affected sector in Italy; Lombardia and Veneto with 13% and 12.4% of sealed surfaces, respectively, are the first two Italian regions most affected by the phenomenon. Apart from the Campania region (10.43%), the other Italian regions present values lower than 10% of sealed surfaces [35]. Today, the availability of high resolution aerial images such as ortho-photos or satellite imagery has given local institutions the chance to monitor soil sealing at a very detailed scale. In particular, municipalities could improve their sustainable territory to limit and mitigate soil sealing, paying close attention to the unique characteristics of their cities and urban fabric.
The general aim of this paper was to estimate and geovisualize the soil sealed at urban scale in Padua, one of the most sealed cities in Italy [35]. The specific aims were to (i) quantify the amount of soil sealing at a very detailed scale; (ii) test the use of the BAF index to quantify the amount of soil sealing; and (iii) simulate an alternative mitigated scenario by testing the use of the BAF index in a specific study area.

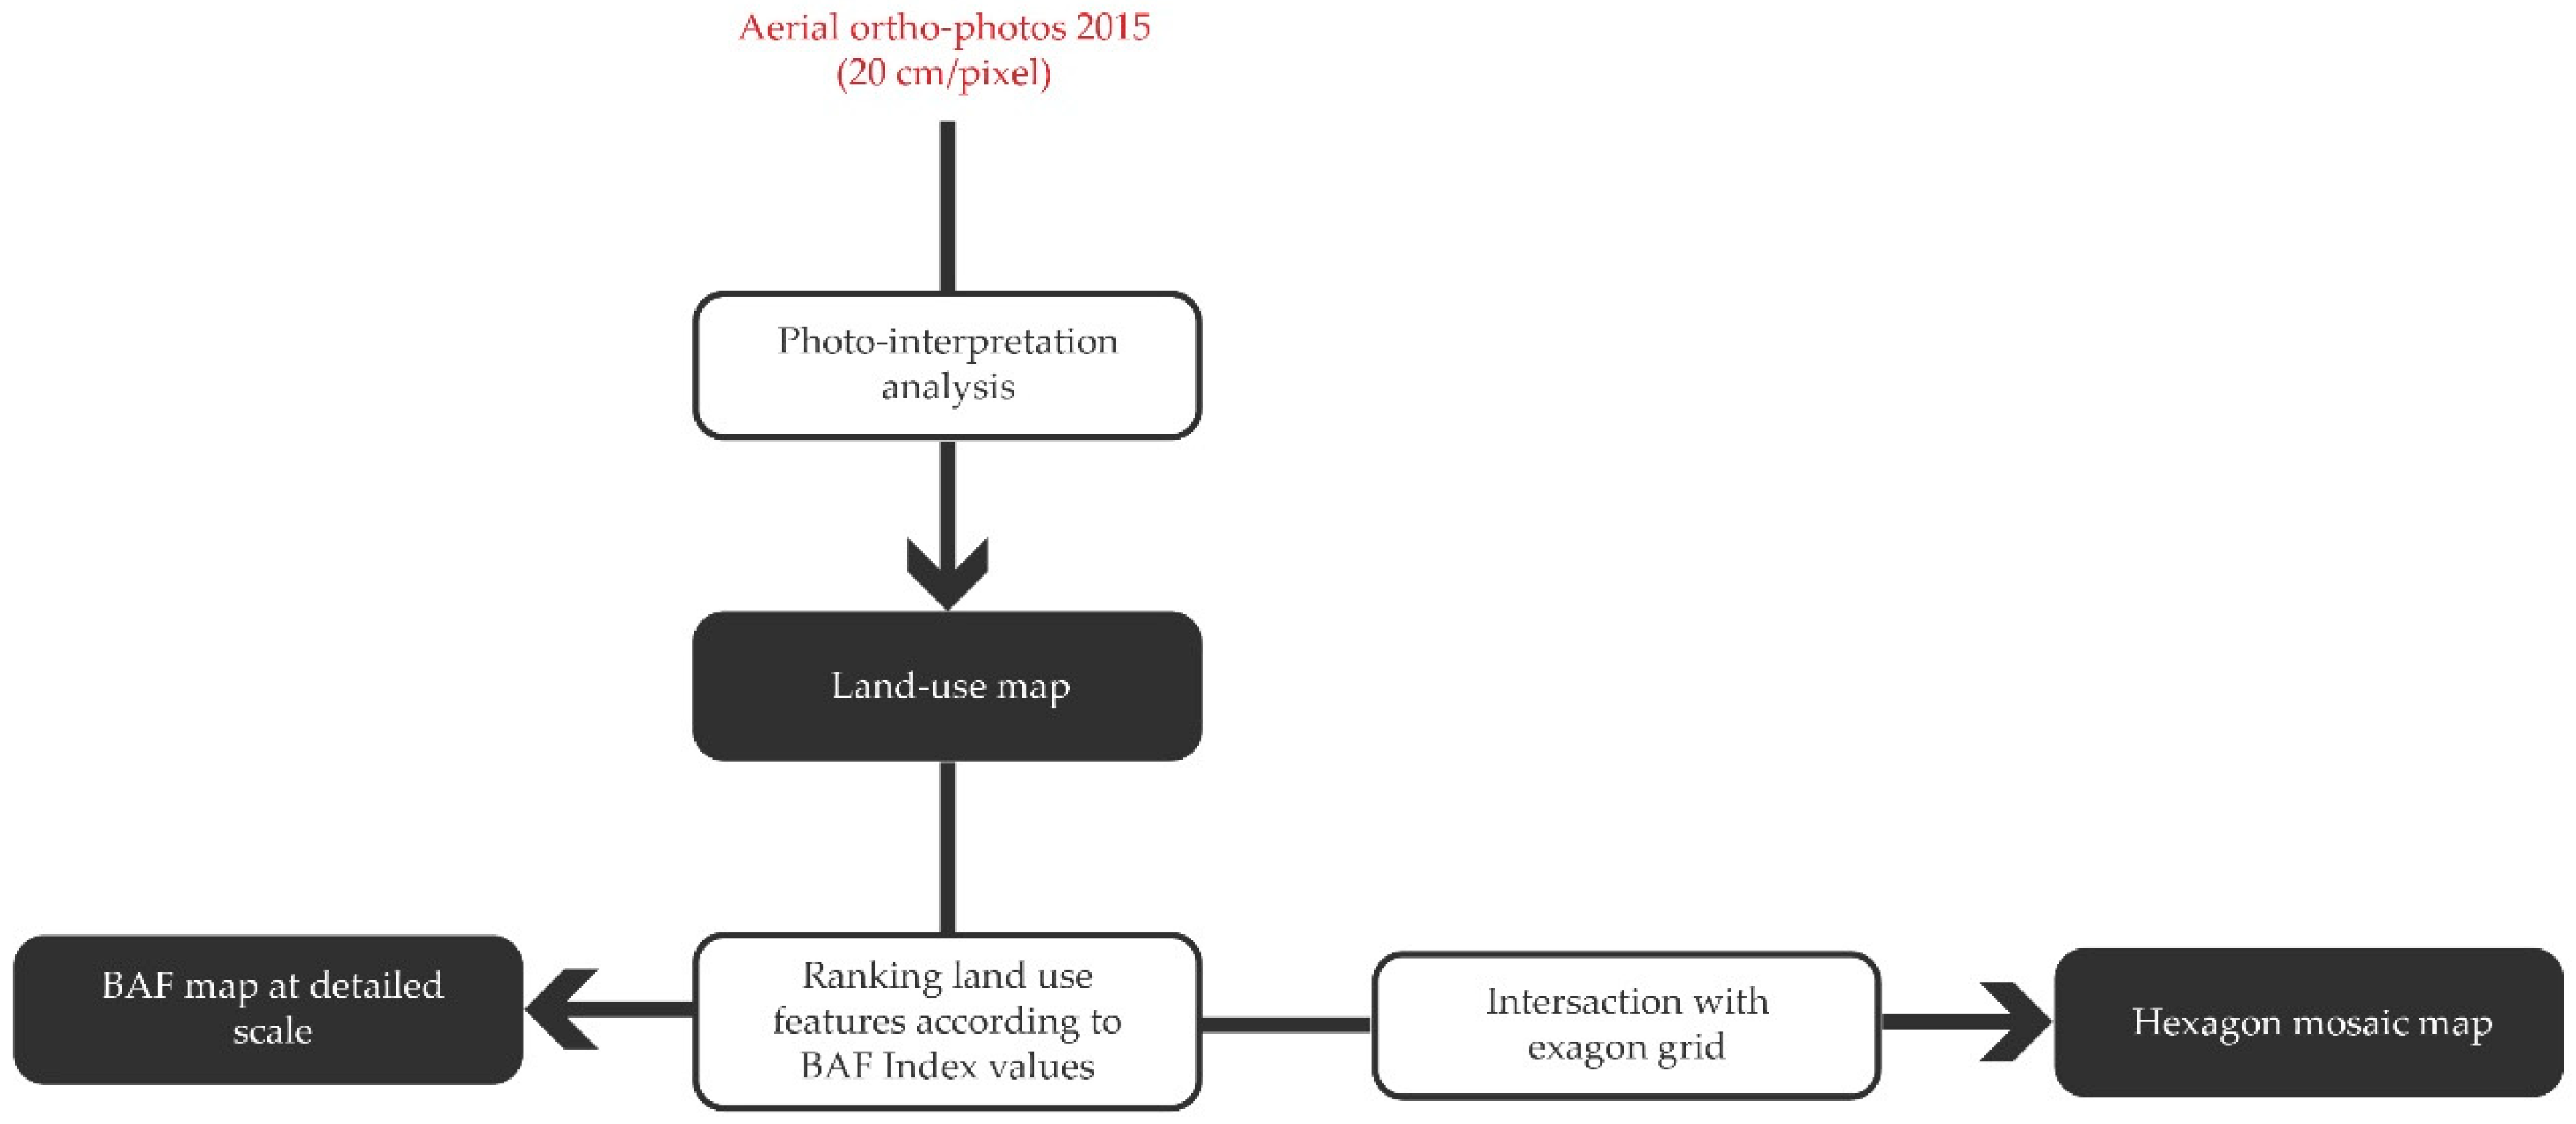
2. Materials and Methods

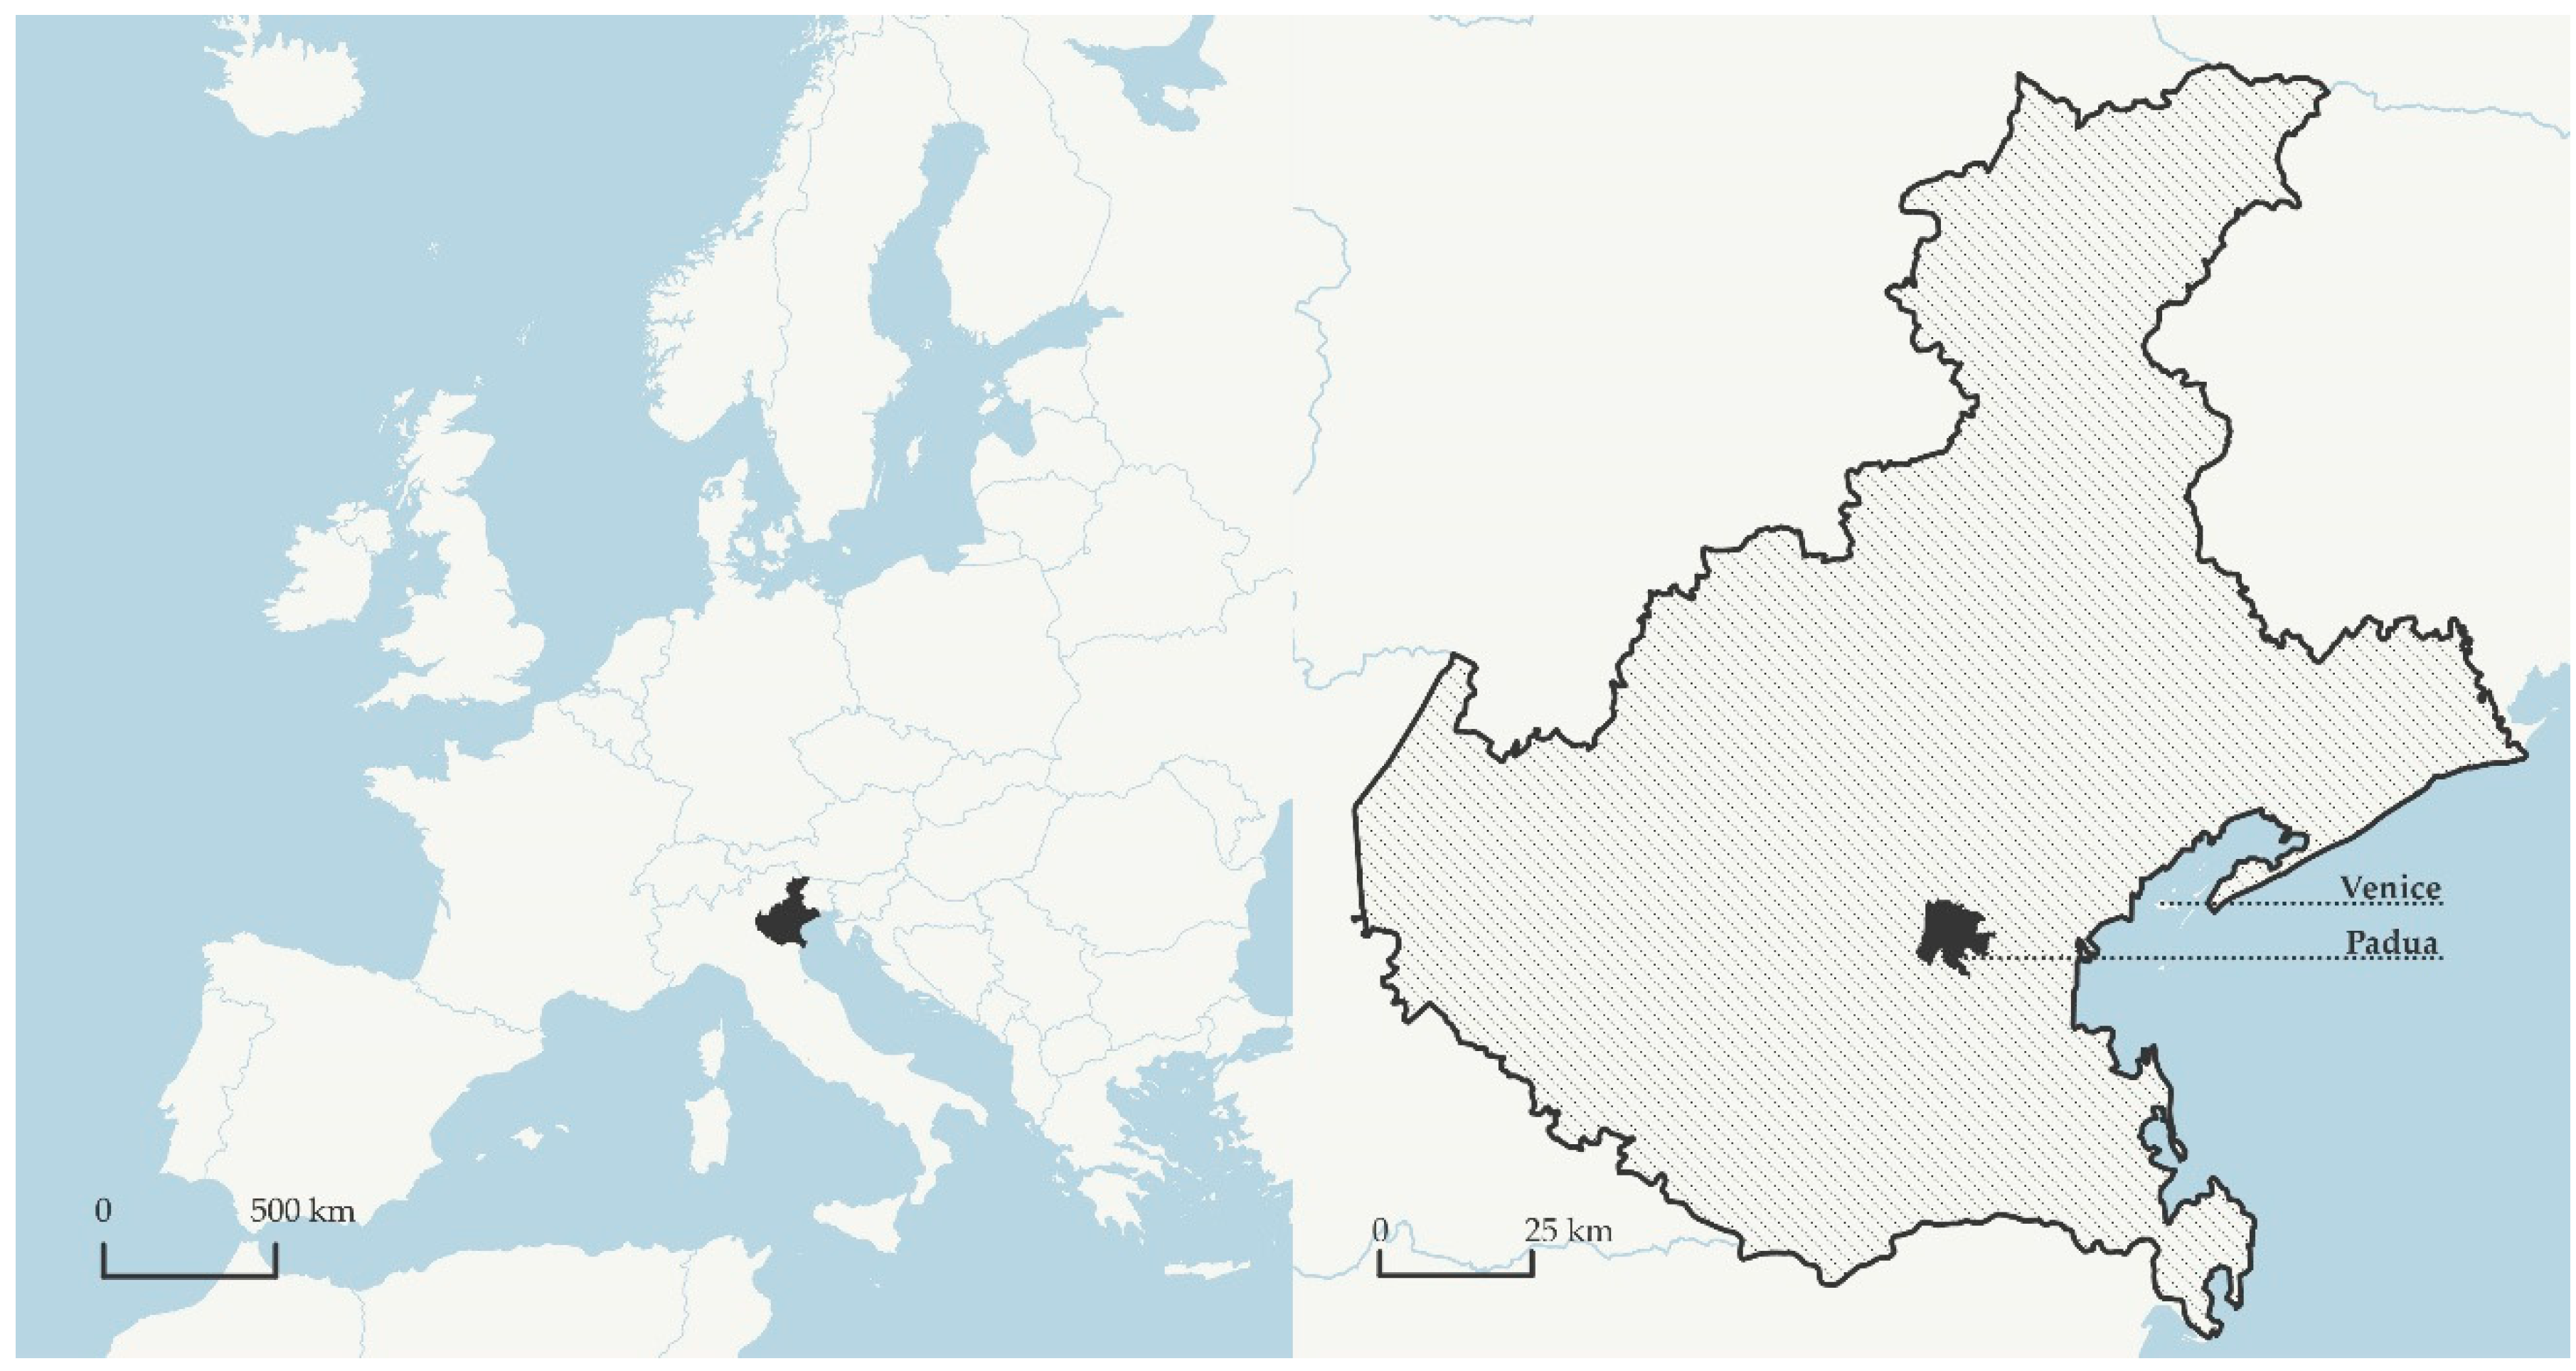
2.1. Case Study: Soil Sealing in Padua

The municipality of Padua is located in the Veneto Region (Italy) and has a total surface of 93 km2 ( Italian National Institute of Statistics, 2019), with 209,829 inhabitants (Italian National Institute of Statistics, 2017) [36] (Figure 1).
The city of Padua was developed within the Brenta and Bacchiglione Rivers; the ancient Venetian walls and canals surround the historical urban core [37]. The expansion and the current shape of the city are mainly the results of the urban development that occurred from 1957 to 1975 during the Italian economic boom and urbanization process. On account of the industrial growth and infrastructure development, the city was structured over the ancient walls of the city [38]. Due to the different phases of historical urban development, together with economic drivers, the urban fabric is at present highly heterogeneous and fragmented, mixing new residential areas with green spaces, and commercial and productive districts (Figure 2) [39].
According to ISPRA 2018, the municipality of Padua shows 49.4% of its territory completely sealed, with 46 km2 covered by impervious surfaces (ISPRA, 2018). Moreover, in 2015, the municipality of Padua was rated as one of the 20 Italian cities with the highest values of soil sealing.
Spatial analysis of soil sealing was performed by using recent aerial ortho-photos at very high geometric resolution, provided by the Veneto Region (2015). An aerial survey was performed in the summer of 2015, and ortho-photos were processed at 20-cm pixel geometric resolution for all multispectral bands (3-bands in the visible, 1-band in the near-infrared spectrum). Thanks to the high geometric resolution, a minimum mapping unit of 6 m2 was established to enable a detailed photo-interpretation of the land use and land cover surfaces. Photo-interpretation using visible (natural color composition, RGB) and near-infrared (false color composition) was performed at a variable scale from 1:2,000 to 1:500, in order to assess and extract land use features for further soil sealing analysis within the complex urban fabric of the city. Mapping at a very detailed scale allowed the identification of small permeable/impermeable surfaces such as garden units in wide residential areas, mid-size flowerbeds, boulevard, and cabin units.
Within the municipality boundaries of Padua, we identified, by a preliminary land use/land cover screening performed in GIS environment, four representative macro-areas. Boundaries of the macro-areas corresponded to four distinct neighborhoods showing geographical features of different representative urban fabrics of the city: San Lazzaro (348 ha), the industrial district of Padua located on the east border of the municipality; the Forcellini (267 ha) and Basso Isonzo (278 ha) districts, two residential neighborhoods located near the center; and Brentelle (263 ha), an agricultural-dominant neighborhood located in the western sector of Padua (Figure 2).

2.2. The Biotope Area Factor (BAF)

The BAF is an ecological index that was developed to assess and enhance urban ecosystems, and increase the sustainability of city development. The BAF index was developed to control and regulate the construction and renovation of buildings in densely built-up areas [40]. It has been specifically developed to be used at a very detailed scale such as building, parcel, and urban district scales [41,42]. BAF values were assessed and calculated by using a basic ecological factor, namely the process of the interception of rainfall generated by a surface [43]. Alterations of this process, caused by different degrees of surface impermeability, may generate negative impacts on the ecosystem services. Therefore, the BAF index geovisualizes the level of permeability of the soil and grounds, allowing the possibility of checking the ecological status of built-up areas through this process. It was designed by the Landscape Program for West Berlin in the late 1980s [44]. After the reunification of the capital, BAF assessment was established in the Landscape Plans (1994) and became mandatory for selected parts of the city where there is a high level of sealing. The BAF index ranges from 0 (completely impermeable surfaces or waterproof) to 1 (complete permeable surfaces) including nine classes. A BAF index equal to 1 corresponds to a green or agricultural land; on the other hand, a 0 value corresponds to buildings, streets, or parking. The intermediate classes of the BAF index also refer to the vegetation areas that have more or less connection with the underlying soil.
Since its application in Berlin, other cities have introduced the BAF index. For instance, it was adopted by Malmo in Sweden, Seattle in the USA, and in the city of Seoul in South Korea [42,45].
The BAF index is calculated using the following equation [44,46]:
BAF   =   i   =   1 n A i × w i   i   =   1 n A i
where Ai corresponds to each surface of the study area that is homogeneous in terms of the BAF value multiplied by wi, which corresponds to the BAF coefficient (Equation (1)). The result corresponds to the ecologically effective surface area (EESA). The BAF value for the considered study area equals the sum of all of the EESAs divided by the sum of the areas.
In order to test the BAF index, the methodology was based on two phases: (1) extraction of the land-use features from high resolution aerial images of 2015 and classification of the same features according to the land use classification elaborated from the Corine Land Cover database; and (2) ranking every land-use feature using the BAF index values (from 0 to 1) (Figure 3).
Hence, by a previous display analysis of the urban fabric of the city, a regular grid model (or fishnet) of 1000 m2 was set to geovisualize and represent the soil sealed and the degree of surface permeability at sub-urban scales. Regular grids are frequently used to represent univariate geographical data for spatial analyses and geovisualization in both landscape ecology and urban planning analyses [47]. According to a literature review, the hexagon grid tessellation (hexagon cells) of the area shows some advantages such as reduction of the edge effect and improvement in the geovisualization of connectivity and patterns [48,49]. We therefore produced hexagon mosaic maps to geovisualize the soil sealed at an urban scale and to provide simple thematic maps for urban planning.

2.3. Simulated Mitigation Scenario

To perform a simulated mitigation scenario, the San Lazzaro neighborhood was selected as it covers a sector of the industrial district of Padua, widely affected by soil sealing as well as being the most suitable area for rooftop greening. This scenario was modeled using the BAF index value (0.7), which expresses the rooftop surface permeability. According to the principles provided by the Municipality of Berlin, the value 0.7 refers to both intensively and extensively green roofs. The 0.7 value takes into account five different criteria: evapotranspiration efficiency, capacity for binding dust, infiltration ability and storage of rainwater, long-term guarantee of the conservation or development of soil functions, and availability as a habitat for plants and animals [44]. It is worth highlighting that benefits provided by intensive roofs (deep soil layers with plants and bushes) are more effective than benefits provided by extensive roofs (thin soil layers with small plants and grass) [50]. Overall, extensive roofs are worldwide the most common category due to building weight restrictions and costs [51].
To perform the “rooftop greening” scenario, it was simulated that roofs of the industrial buildings could be regenerated into green roofs. In this way, the BAF index of the industrial roofs were substituted with the 0.7 value of the BAF index in place of the 0 value.

3. Results and Discussion

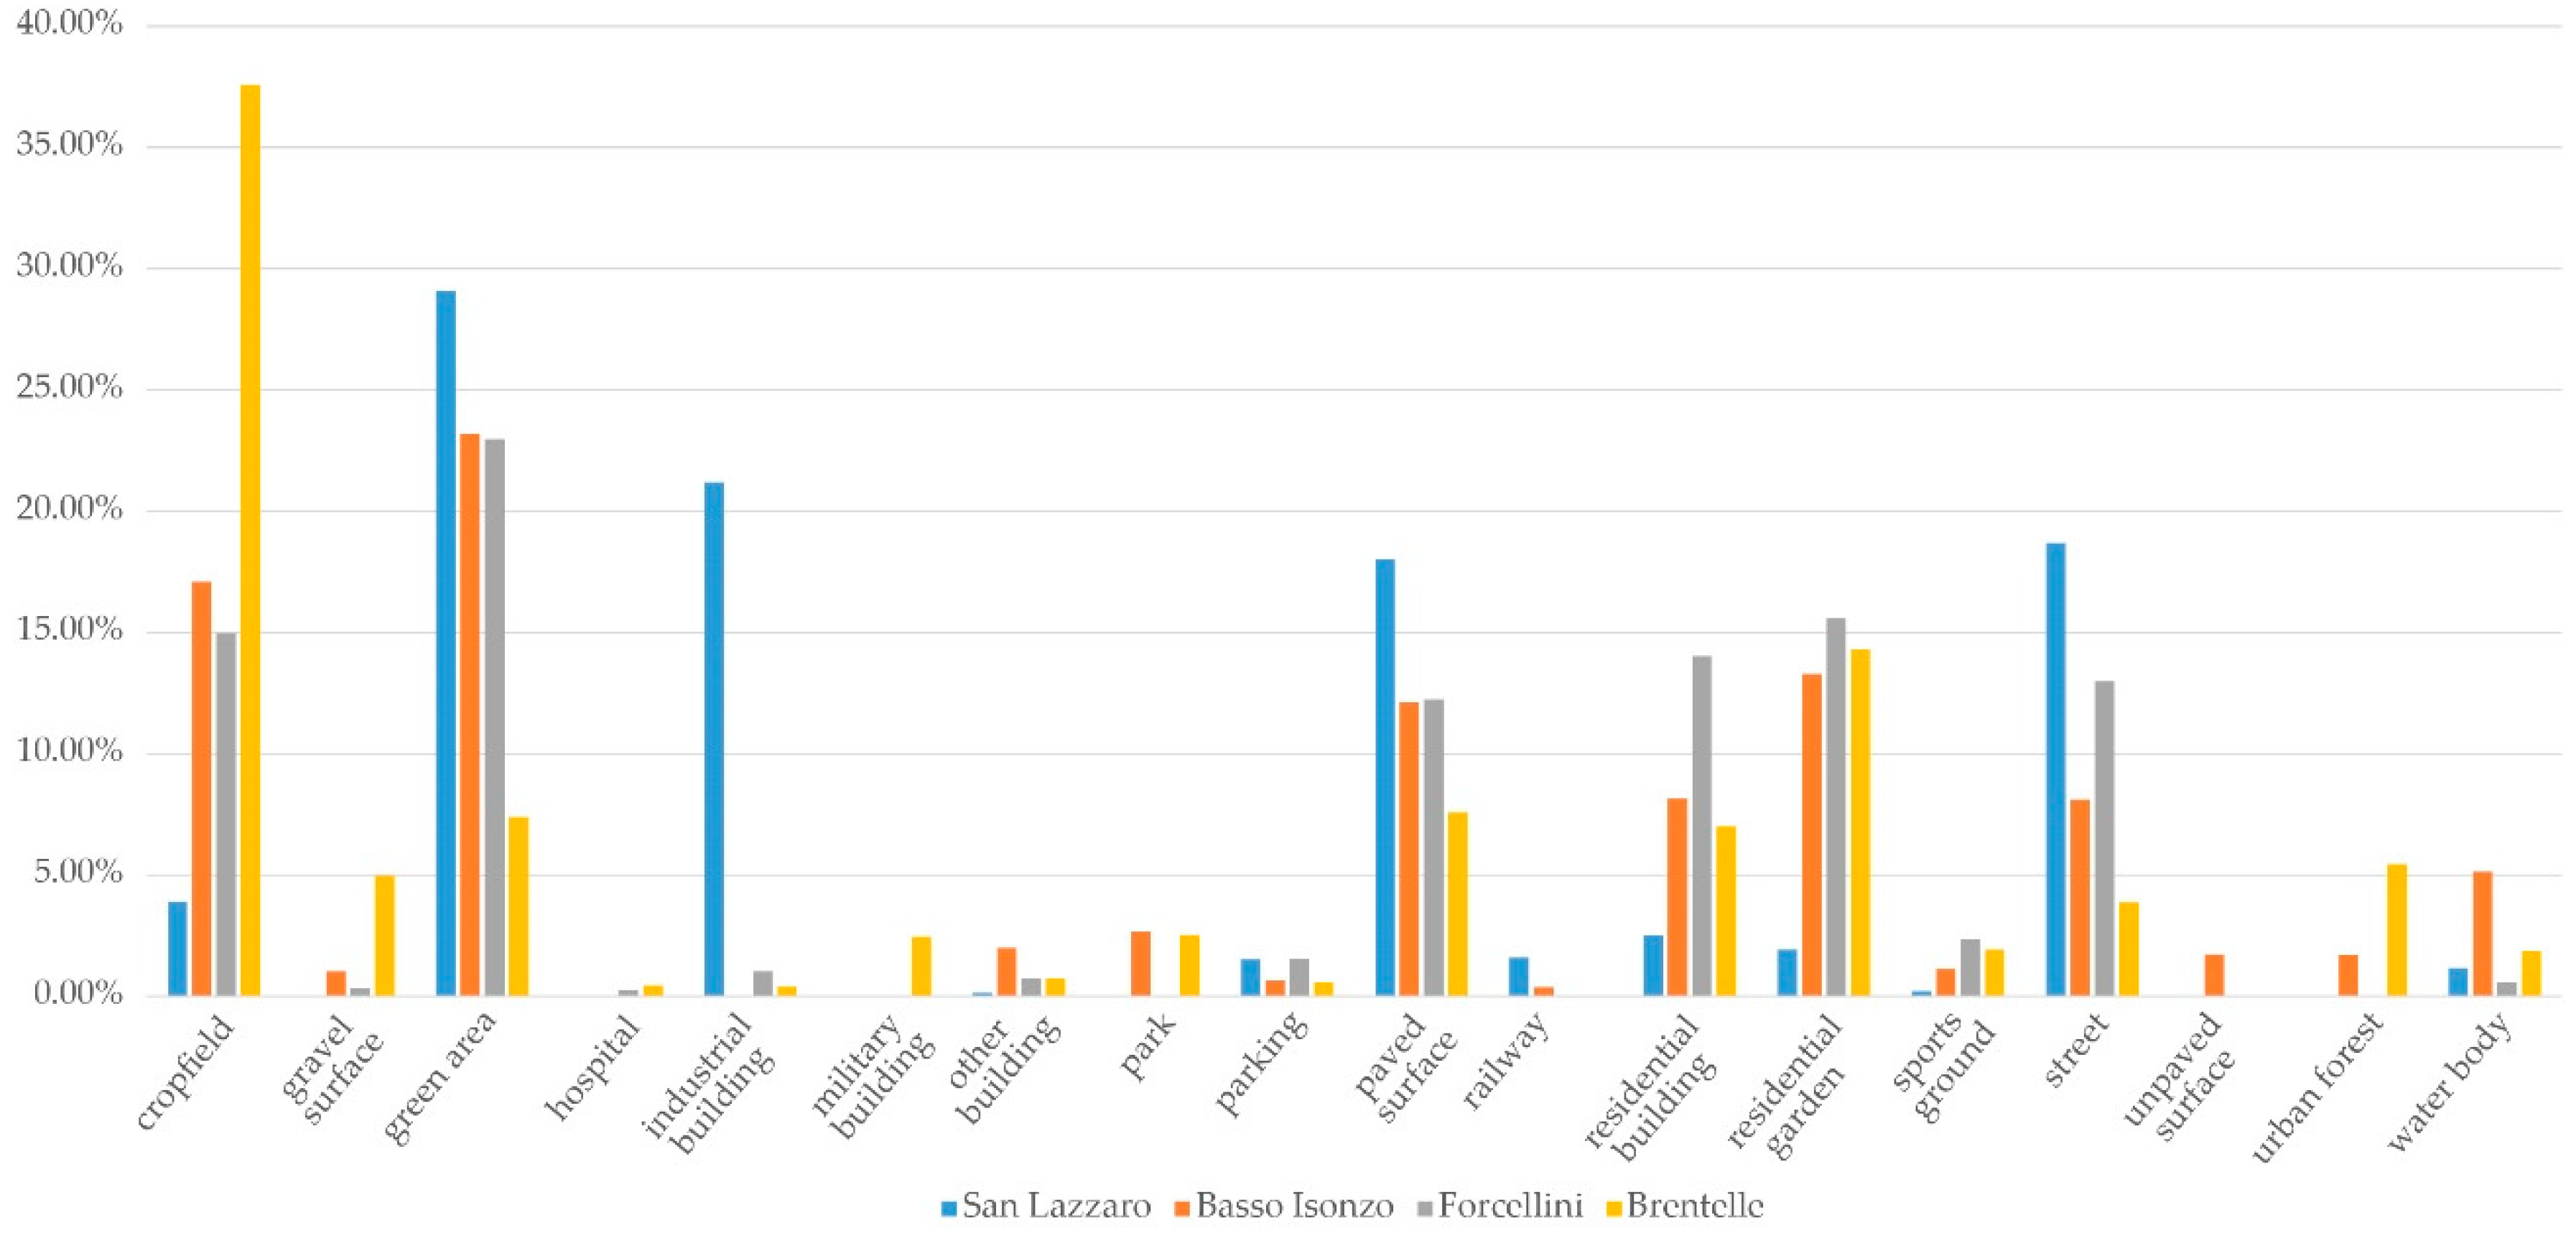
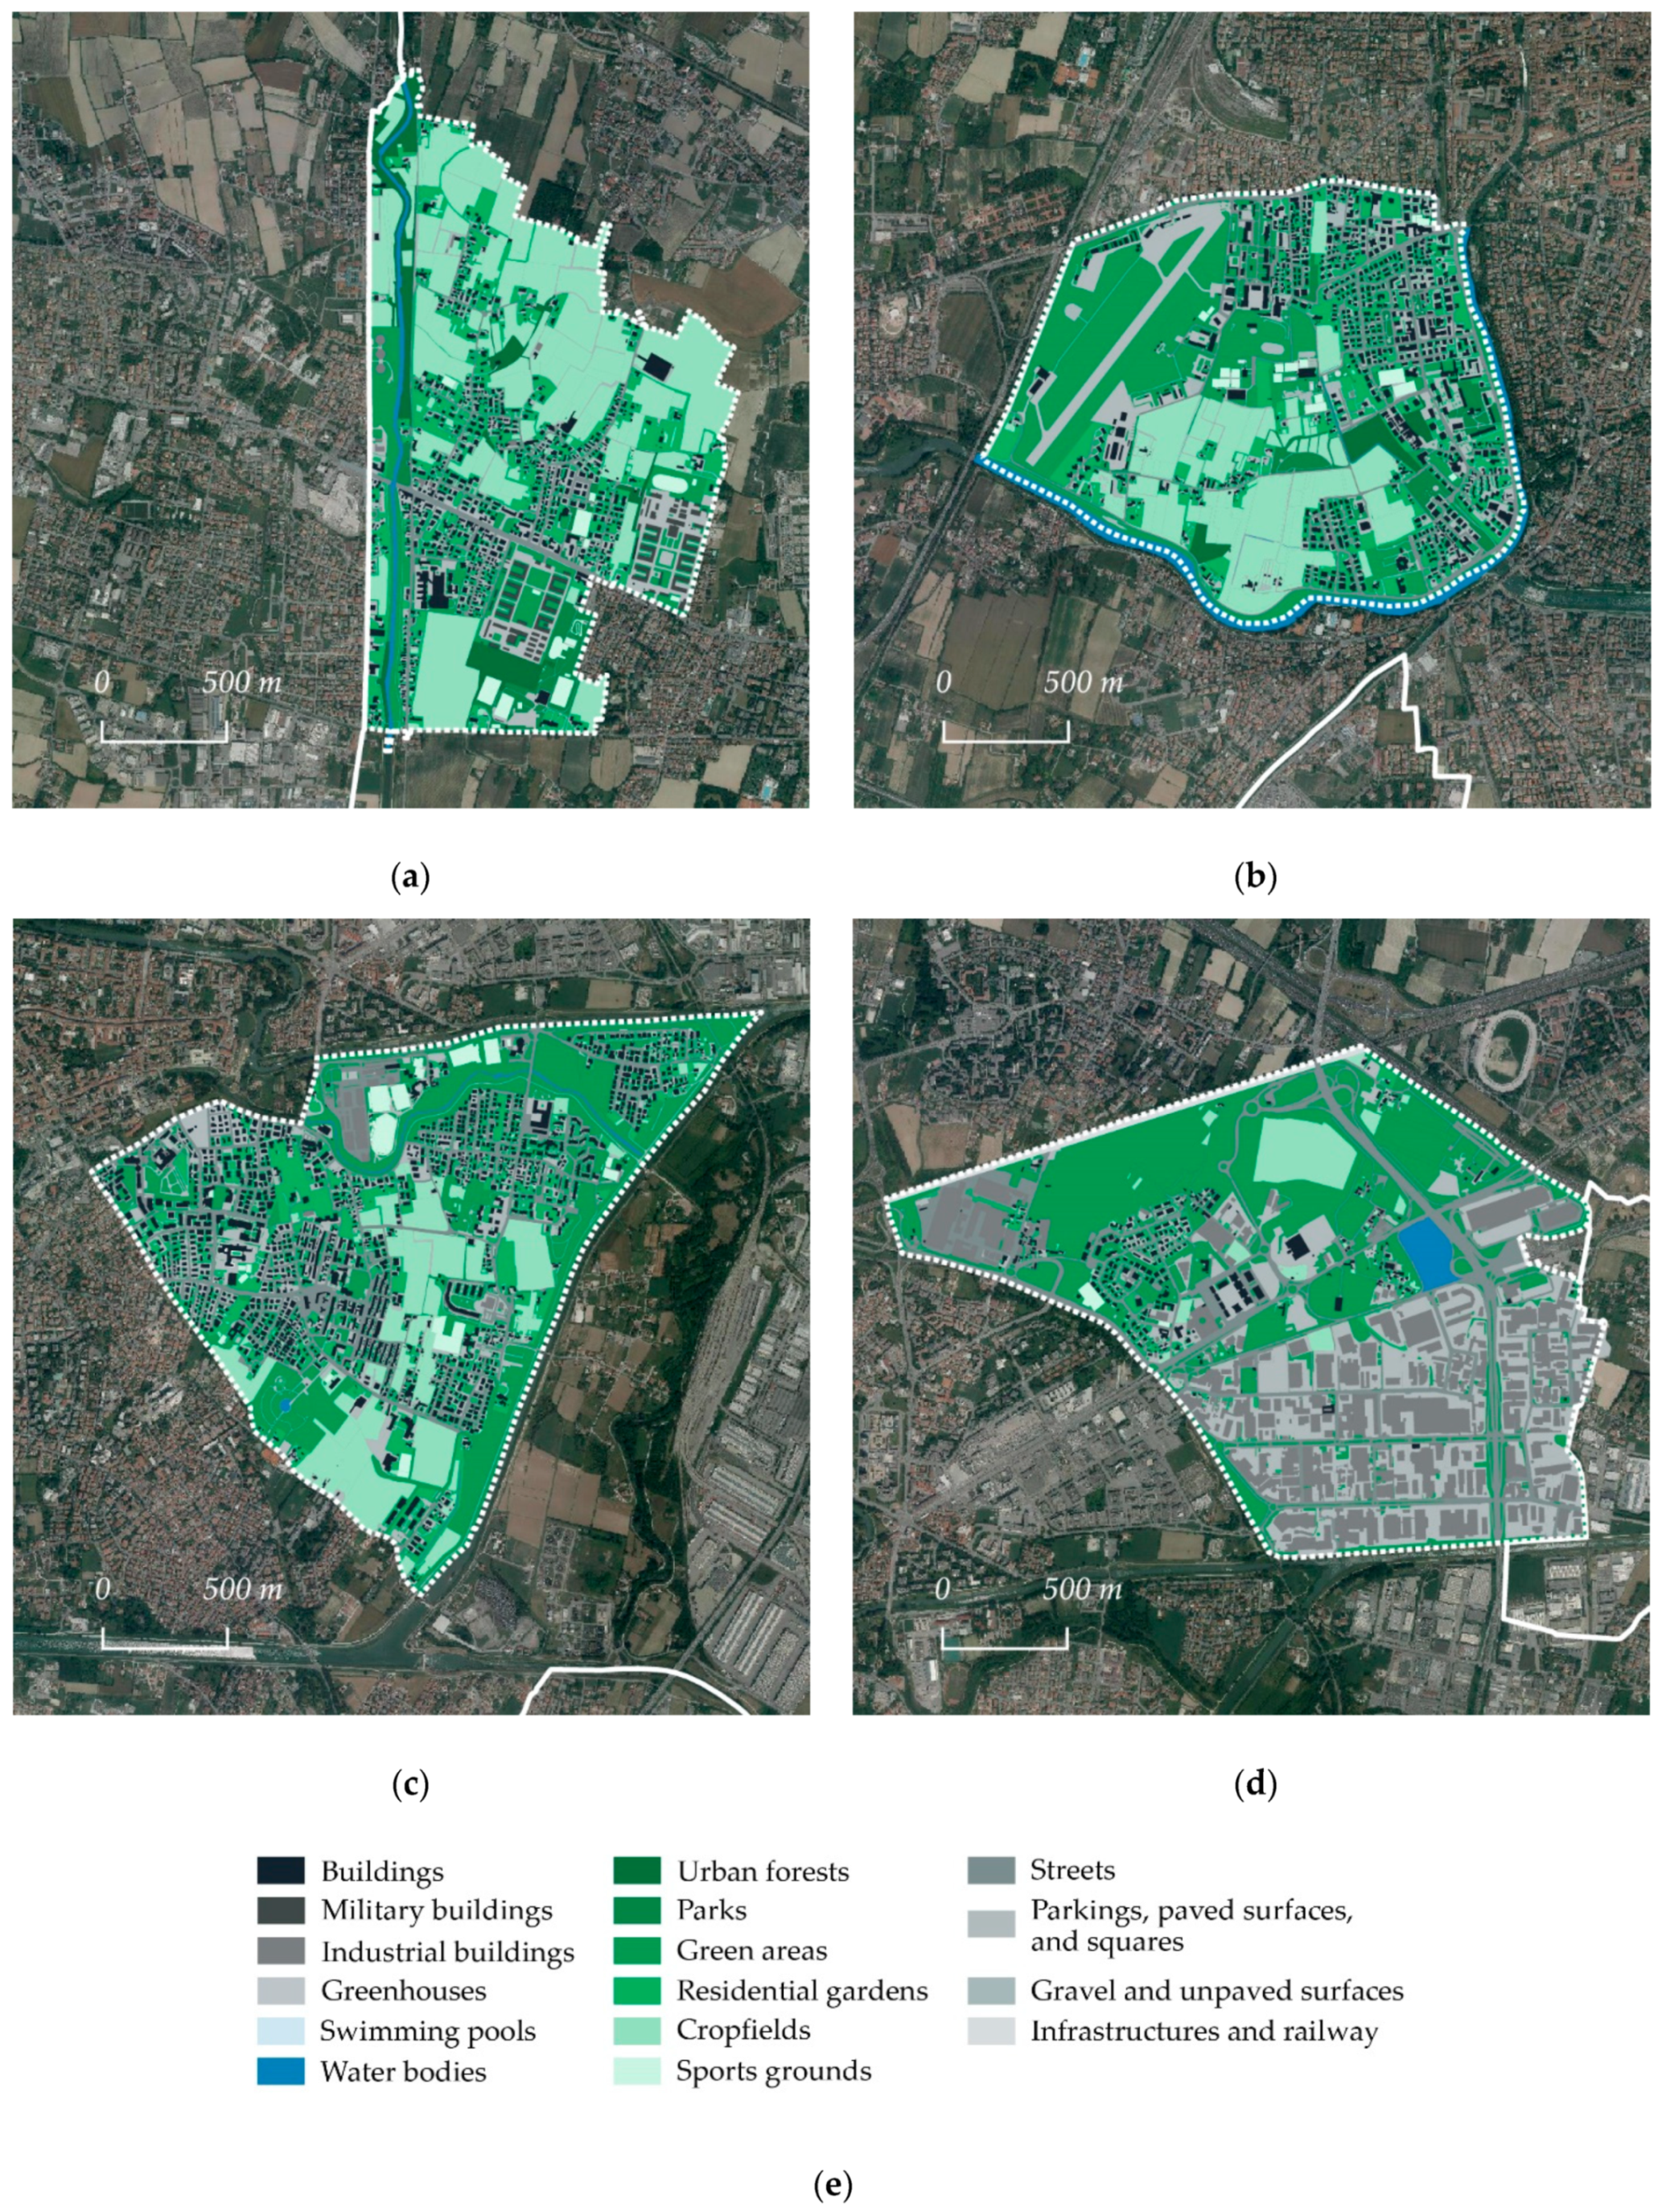
3.1. Land Use Analysis
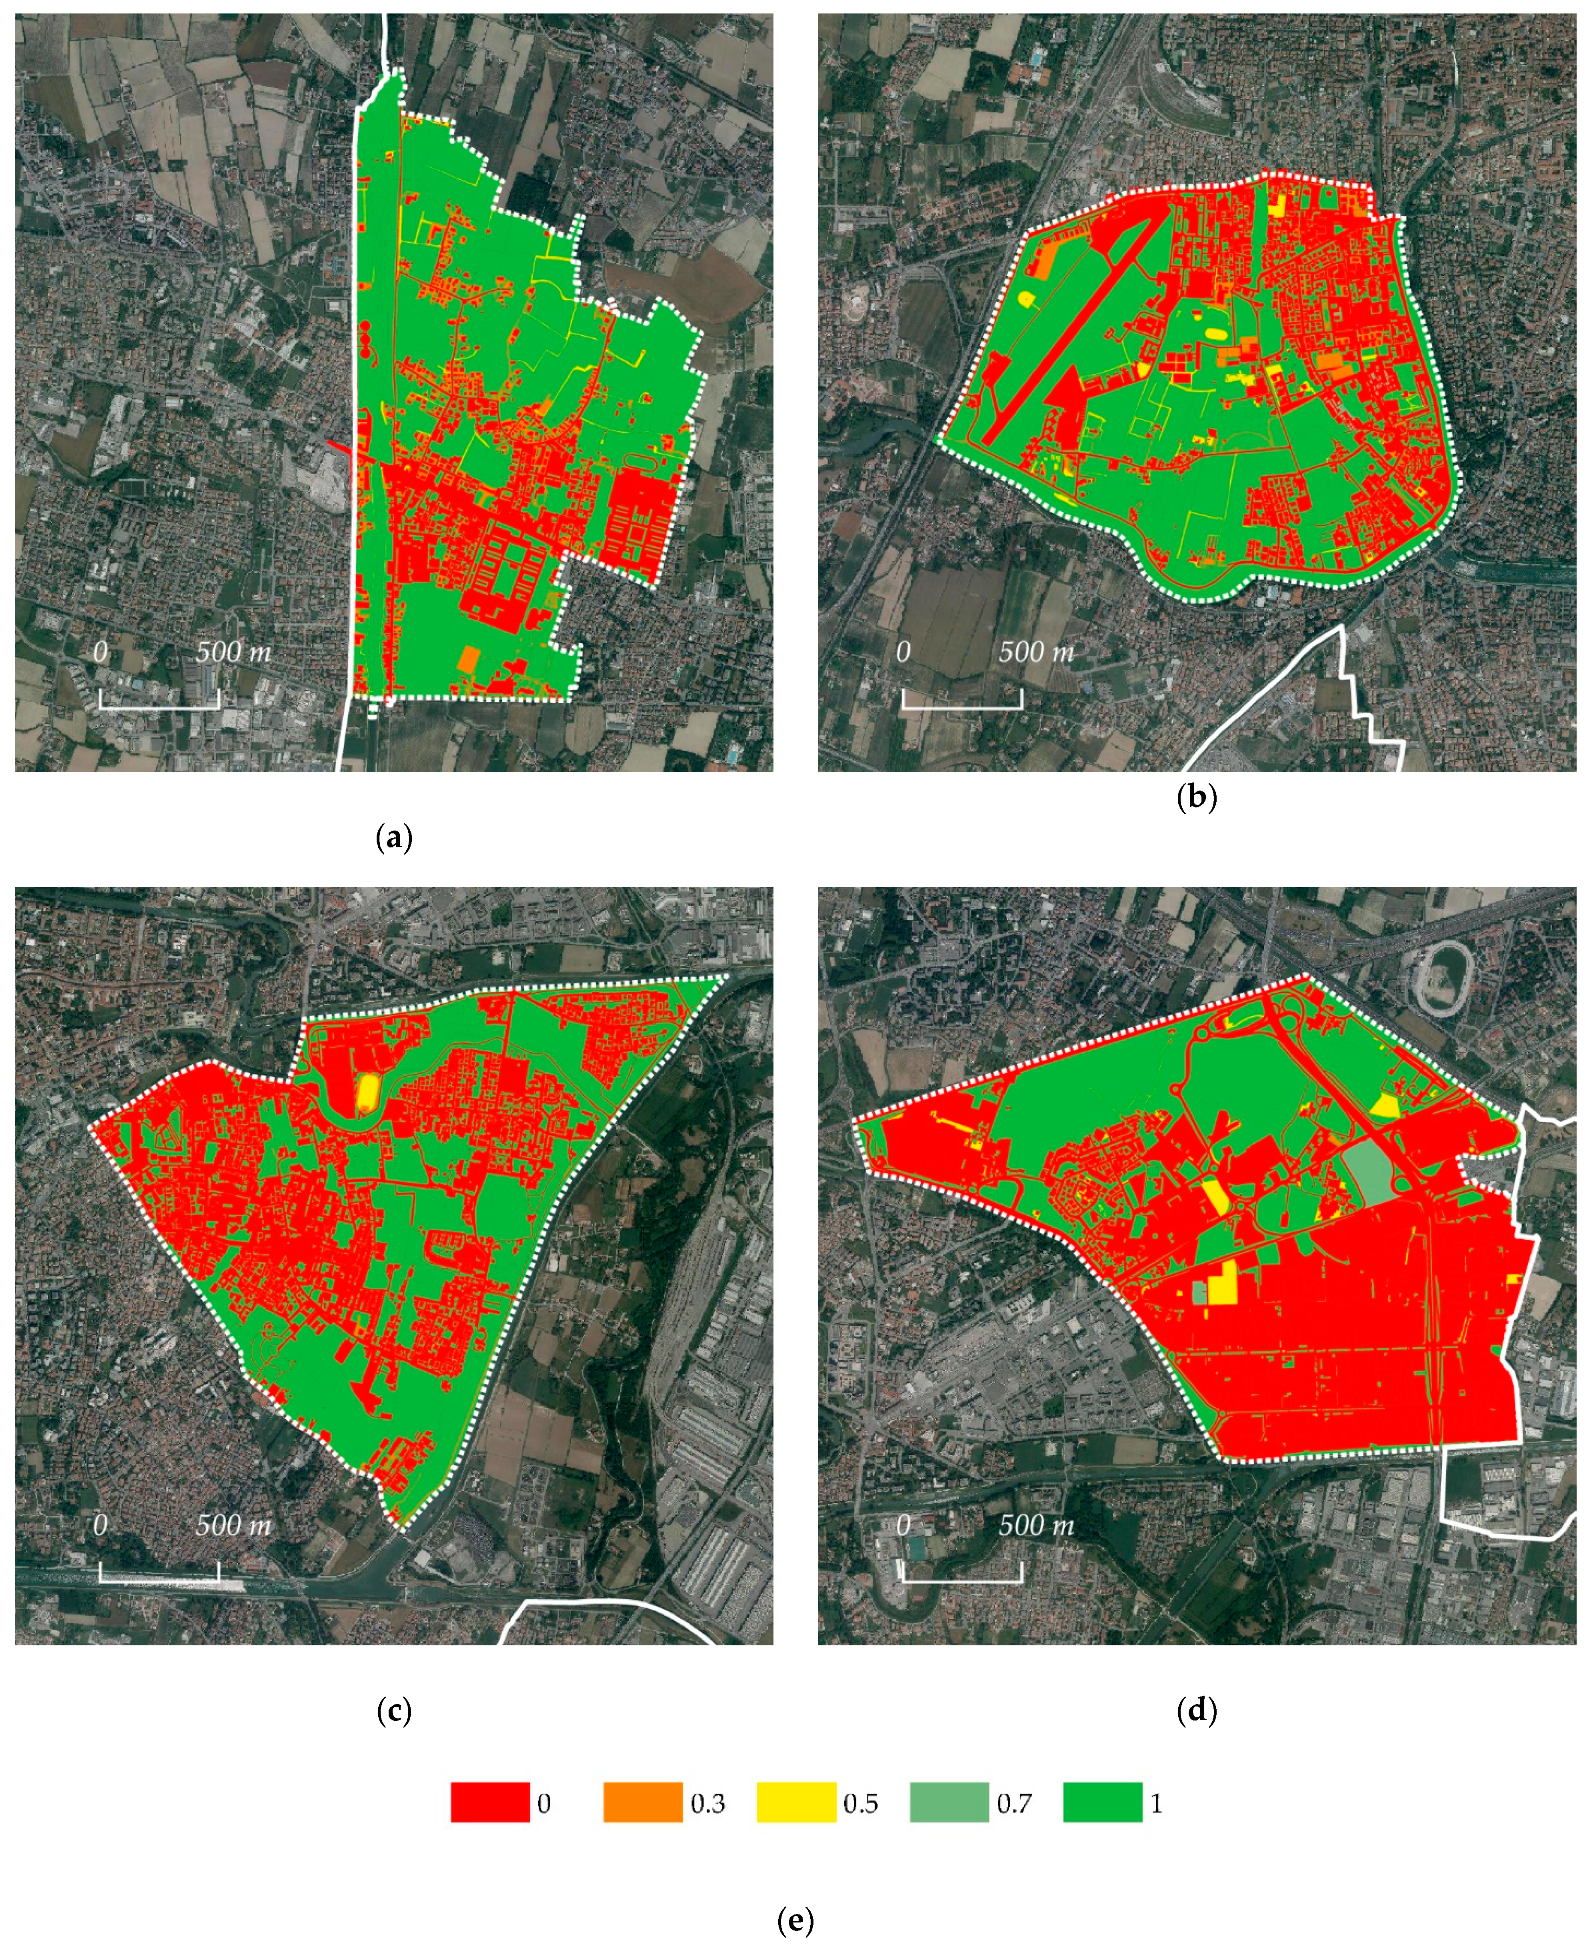
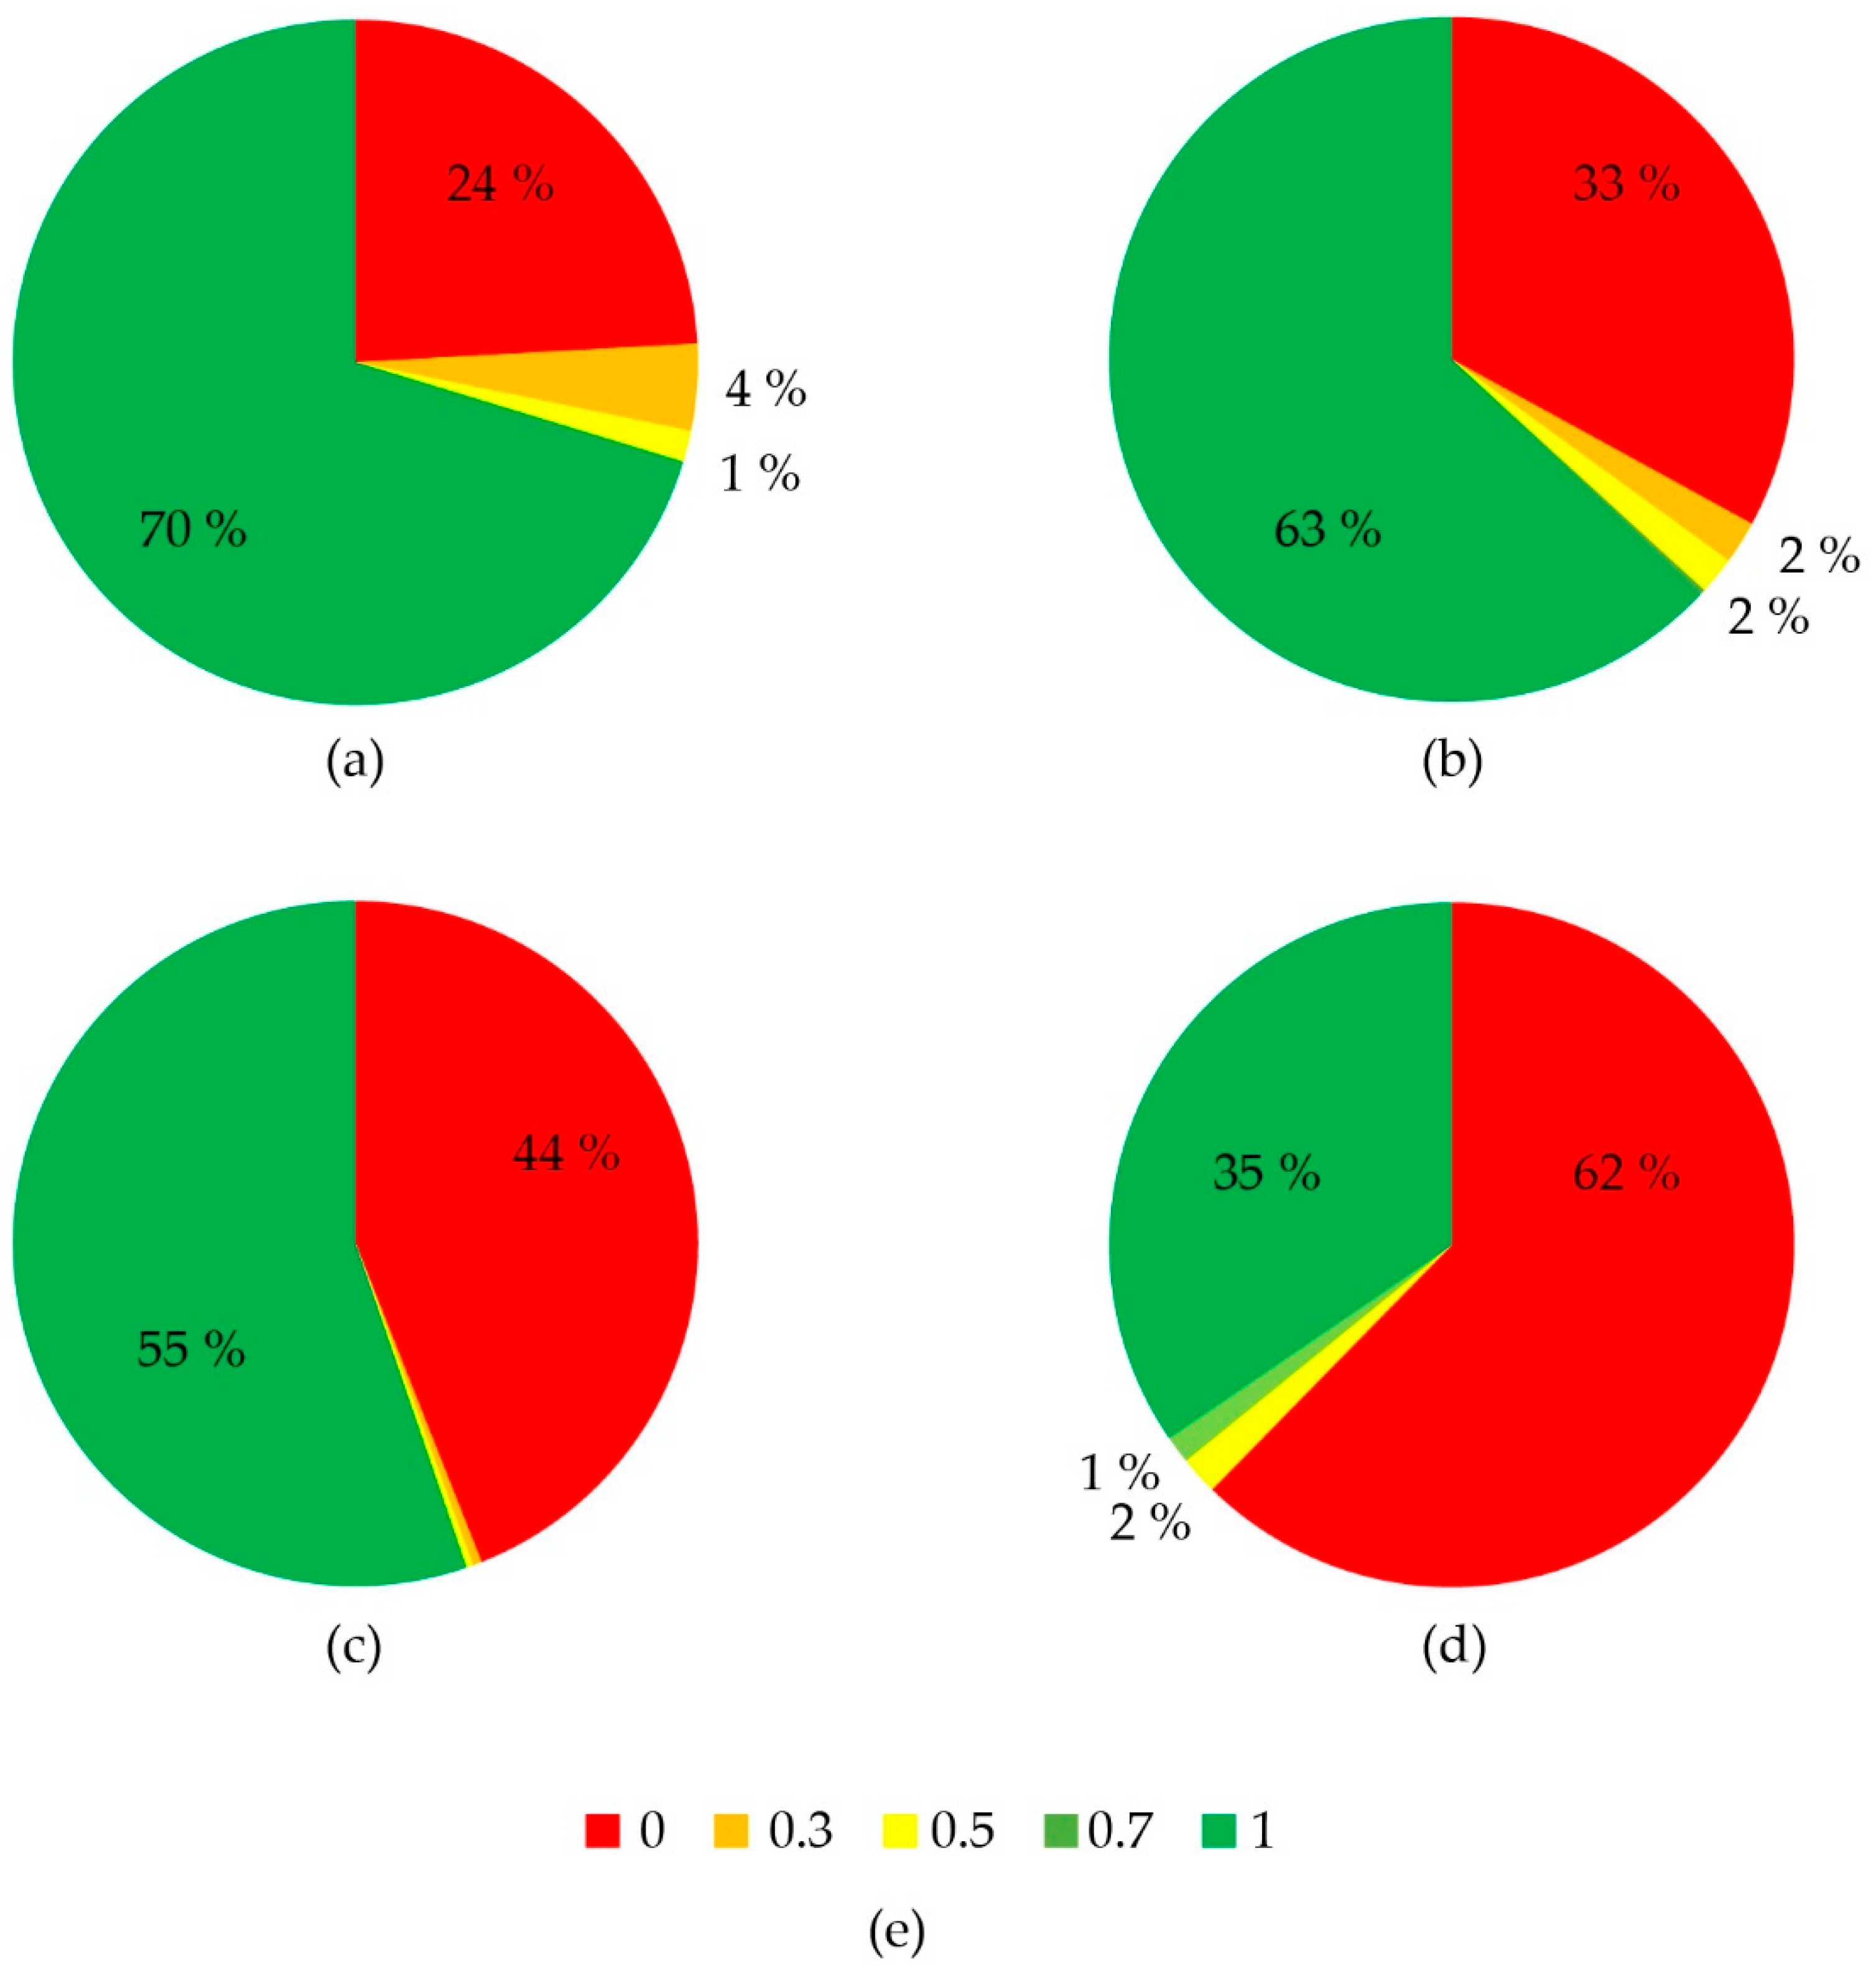
The analysis of land use was the first phase of the methodology. The results of the land use analysis allowed us to identify 16 classes of land use in the four neighborhoods. The results of land use classification are summarized in Figure 4 and Figure 5. The Brentelle neighborhood presented high values of urban cropfield, with 37.6% covered, which are mainly located in the northern sector of the neighborhood. Both the Basso Isonzo and Forcellini neighborhoods presented lower values of cropfield, close to 15%. While these were mainly located in the southern sector of the neighborhood in Basso Isonzo, in Forcellini, they appeared to be more scattered and fragmented. Finally, the San Lazzaro neighborhood had very low values of cropfield (3.9%).
Surprisingly, San Lazzaro showed a high value of green areas, close to 30%, that were entirely located in the northern sector of the neighborhood. In contrast, the other classes that mainly covered San Lazzaro were composed of industrial buildings (21.2%), paved surfaces (18%), and streets (18.7%). These classes were mostly pinpointed in the southern sector. It is worth noting that the sum of all these classes was almost 60% of the entire neighborhood.
The Forcellini and Basso Isonzo neighborhoods showed high values of green areas, both 23%, while in contrast, Brentelle showed values of 10%. Concerning all classes that included buildings related to residential areas (i.e., “residential building”, “religious building”, “recreational building and “other building”), the Forcellini, Basso Isonzo, and Brentelle neighborhoods showed values of 31%, 25%, and 23%, respectively. In contrast, the San Lazzaro neighborhood presented a buildings value 4.5%. These results highlight the residential character of Forcellini, Basso Isonzo, and Brentelle, while San Lazzaro has an industrial urban fabric.

3.2. BAF Analysis

The maps in Figure 6 show the results of the BAF index for each neighborhood. San Lazzaro is the most impermeable area and shows the lowest BAF index value by only 0.35. More than 60% corresponded to impermeable surfaces, whereas 35% were completely permeable (Figure 7). The highest value of the BAF index was held by the Brentelle neighborhood at 0.69. In Brentelle, the results were completely different than that in the San Lazzaro neighborhood: approximately 70% of surfaces were permeable, whereas the impermeable surfaces were around 25%. The Basso Isonzo and Forcellini neighborhoods presented similar values of the BAF index with 0.64 and 0.56, respectively.
In Basso Isonzo, more than a third of surfaces were impermeable, whereas around 60% were permeable surfaces. In Forcellini, the percentages of permeable and impermeable surfaces were quite similar, with 55% permeable surfaces and 44% impermeable surfaces.
It is noteworthy in all the four neighborhoods, the BAF classes were strongly polarized on impermeable and permeable surfaces by BAF index values of 0 and 1, respectively. Indeed, the values of the BAF index of 0.3 and 0.5 were close to 2%–4% in Brentelle and in Basso Isonzo, and corresponded to unpaved roads related to cropfield and agricultural lands. The percentages of all BAF index values are summarized in Figure 6. Moreover, the class of the 0.7 BAF index was not present in any of the four neighborhoods as it refers to rooftop greening. It is evident that the Municipality of Padua has not yet taken into account any mitigation measures to manage the soil sealing issue, especially in areas where there is a high pressure of sealed surfaces like the San Lazzaro neighborhood. Indeed, in accordance with Veneto Regional Law 14/2017, which addresses the control of the phenomenon of soil sealing, the Municipality is mainly focused on limiting the construction of new buildings and encouraging brownfield regeneration without suggesting some mitigation actions [21].
Further analyses showed that the amount of permeable surfaces (BAF value of 1) mainly consisted of “green areas” or “park” land use classes (Figure 8). The most striking result emerged from the comparison of the four neighborhoods highlighting San Lazzaro, which provides permeable surfaces with more than 80% of “green area” class. Although the Basso Isonzo and Forcellini neighborhoods showed high values of the “green area” land use class of 36.8% and 41.6%, respectively, they also presented mixed classes of BAF value 1. Hence, in these two neighborhoods, the BAF value of 1 also includes other relevant classes, for instance, “residential garden” and “cropfield”. The amount of “residential garden” class was rather significant both in Forcellini (28.2%), Basso Isonzo (21%), and Brentelle (20%).
In addition, it is worth noting that the high rate of “cropfield” class was notable only in the Brentelle neighborhood (53.5%). In this neighborhood, other classes were less dominant.

3.3. Hexagon Mosaic Map for Soil Sealing Geovisualization

Figure 9 shows the results of the hexagon tessellation and the distribution of values of the BAF index for each neighborhood. The hexagon mosaic maps show the average permeability degree from the BAF value, normalized on 1000 m2 areal units.
In Brentelle, the impermeable surfaces were mainly located in the central sector of the neighborhood, while permeable surfaces were in the surrounding areas. The comparison with the land use map showed that all red hexagons corresponded to the residential pattern of the neighborhood. On the other hand, Basso Isonzo presented a different spatial distribution: the most impervious surfaces were located in the east sector and north–east, whereas the south sector was almost all permeable. The permeable surfaces in the south corresponded to “Parco Agro-Paesaggistico” of Padua, which would collect all of the contiguous cropfields remaining in the Basso Isonzo neighborhood.
In the Forcellini neighborhood, the permeable areas were also quite fragmented as the impermeable surfaces were scattered. The hexagon tessellation with a 0.3 value on the BAF index (orange) showed the presence of a mixed urban pattern of the neighborhood. In the San Lazzaro neighborhood, the overall value of the BAF index is low. Using the map, it is possible to geovisualize that the permeable surfaces were located in the central–north sector of the neighborhood, surrounded by impermeable surfaces. It is important to note that the southern sector was overall sealed without permeable surfaces and corresponded to the industrial area of Padua.
The comparison of the maps of the BAF analysis and the hexagon tessellation (Figure 6 and Figure 9) highlights an urban pattern of balance between impermeable surfaces such as buildings and streets, and green areas or cropfields. Particularly, this pattern emerged from the two neighborhoods of Basso Isonzo and Forcellini, in the sectors mainly covered by residential settlements. In contrast, in San Lazzaro, this balanced pattern does not occur due to the strong presence of industrial buildings that are obviously not fragmented by green areas or cropfields.

3.4. Mitigation Scenario: Rooftop Greening

Among the four study areas, the San Lazzaro neighborhood was chosen to simulate a mitigation scenario named “rooftop greening”. What stands out in this scenario is the significant outcome of results from the BAF index, showing a value of 0.59. A comparison of the two results (Figure 10) of the BAF index for San Lazzaro revealed a marked increase in the BAF index from 0.35 to 0.59 of the mitigation scenario by rooftop greening. Moreover, the result of the rooftop greening showed that the surfaces with a value of 1 on the BAF index were not modified by the increase in surfaces with a 0.7 value. In contrast, surfaces with a 0 on the BAF index were drastically reduced. Finally, surfaces with a 0.7 value on the BAF index represented 21.3% of the neighborhood, while a 0 BAF index value constituted 41.2%; surfaces with a value of 1 on the BAF index represented 31.7%. The map of the BAF index showed that the 0.7 value of the BAF index was mainly localized in the southern sector. Interestingly, the hexagon tessellation showed the positive effects that were generated by the 0.7 BAF index value, especially in the southern sector of the neighborhood. Indeed, the 0.7 BAF index value is able to balance the 0 value that already exists in the area, which is related to streets and parking. Hence, the results show that there are many hexagons in the range from 0.40–0.60 values and from 0.60–0.80. This is evidence that the pressure exerted nowadays by the industrial area could be mitigated and reduced by rooftop greening.

3.5. Towards More Sustainable Cities: BAF as Tool for Urban Planning

In light of the EU guidelines on the best practice to limit, mitigate, or compensate soil sealing, this study suggests some elements to support urban soil sealing management, especially in densely built-up areas. In particular, a high-resolution analysis could suggest the implementation of mitigation measures to policymakers and urban planners to achieve a more sustainable urban development. The BAF index is a notable and successful tool to calculate soil sealing at urban scale and to geovisualize the degree of soil permeability [41]. A known example is the Municipality of Berlin, which at present, maintains the mandatory use of the BAF index for urban planning within the inner city. Over the last few years, other cities have followed the example of Berlin, for instance, Malmö, Seattle, and Seoul. In Italy, only the city of Bolzano (Alto Adige/Südtirol Autonomous Province) has introduced a similar tool [52]. The examples reveal that the application of the BAF index is an important tool in urban planning, not only for the regeneration of buildings, but also for new construction. In fact, it could be a support to reduce sealed surfaces via green areas, green roofs, and permeable surfaces [53]. Hence, in the study, the index successfully identified and geovisualized areas and sectors of the neighborhoods of high soil sealing. Moreover, BAF maps with the exact land use features expressing the permeability degree and the hexagon tessellation maps at 1000 m2 areal unit represent, together, an important tool for mitigating and compensating soil sealing: the former is useful for specific interventions such as urban greening and hydraulic adjustments, the latter geovisualizes soil sealing and highlights critical hotspots for urban drainage management and important permeable areas to preserve. Hence, the use of BAF maps in urban planning clearly show in which neighborhoods it is fundamental to act [44].
Moreover, it is important to highlight that a systemic urban strategy for soil sealing management could be more powerful and far-sighted. This means that at all levels of governance, stakeholders should act, taking into account all three measures proposed by the guidelines of the EU Commission. In this context, the Veneto Regional Law 14/2017 may be considered not only as the limitation of soil sealing, but also the adoption of mitigation measures in areas where it is impossible to restore a natural or semi-natural soil. Overall, strategies to contrast soil sealing should achieve the conservation, maintenance, or restoration of ecosystem services related to soil in all sectors of a city.
Finally, it is worth noting that if aerial images at very high resolution are available and updated, BAF analysis from photo-interpretation is a very powerful tool to quantify and monitor soil sealing at a very detailed scale. Hence, it allows for the identification and mapping of soil sealing in critical areas, representing a baseline to achieve and plan local and region-specific solutions to face the issue. However, the photo-interpretation method of extracting land uses features at a very detailed scale is time-consuming, especially for wide areas such as big cities. Moreover, different expert operators are often required for photo-interpretation and features extraction from aerial images. In this case, if land use and/or topographic databases at the municipal scale are available, comparisons with the photo-interpretation of macro sample areas may be used for validation and scaling-up soil sealing analysis at an urban level.

5. Conclusions

Over the last few decades, soil sealing has been recognized as one of the major threats to soil degradation and the ecosystem services that it provides. Although many efforts have been promoted to increase the awareness of stakeholders and citizens for soil conservation, as asserted by the International Year of Soils (2015) and the United Nations within the Sustainable Development Goals framework, the issue of soil sealing is currently scarcely considered. Frequently, the value of soil as non-renewable resource as well as soil-related services in urban ecosystems are not implemented in territory planning and territorial sustainability policies [2]. The methodology adopted in this research could provide an insightful case study for enriching the debate about the soil sealing phenomenon and provide scientific support for sustainable urban planning. Indeed, the study provides a relevant example of how significant it is to geovisualize and quantify the amount of soil sealing at a very detailed scale. This was performed using the BAF index in four different neighborhoods of Padua, which has the highest rate of sealing among Italian cities [35].
Moreover, the mitigation simulated scenario of “rooftop greening” shows how it could be interesting to push toward a mitigation approach as an alternative measure in a dense and industrial urban fabric. Indeed, according to the principles of the Municipality of Berlin, roof greening should be taken into consideration, even considering its costly technological set-up. However, they could be suitable in particularly problematic areas with limited on-site qualification options, for example, industrial areas [44]. The measure proposed has the potential to enhance some of the ecosystem services related to soil, for instance, decreasing the runoff and enhancing the urban microclimate through evapotranspiration [54,55]. However, it is worth noting that the study does not provide any differences between intensive and extensive green roofs, even if, according to the Urban SMS-Soil Management Strategy, a minimum depth of 10 cm of soil is recommended to achieve benefits in ecosystem services [11]. Further research is necessary to better investigate the equivalent contribution of each solution and to reflect into the BAF index.
The study highlights that there is not one unique solution to steer soil sealing, but there is a need for a strategy that is able to take into account not only the spatial, but also the social and ecological dimensions [56,57].
In conclusion, this study strengthens the idea that to study the phenomenon of soil sealing locally, it is necessary to work at a very detailed scale. For this reason, the study should be implemented using the BAF index for the whole city of Padua to better understand in which areas it is fundamental to act.

Author Contributions

This paper is the result of discussions and analysis conducted by the five authors (F.P., G.P., D.C., S.E.P., and M.D.M.), who equally contributed to the final assemblage of the ideas and concepts contained in this paper. All authors have read and agreed to the published version of the manuscript.

Funding

This research received no external funding.

Acknowledgments

We would like to thank the GIScience D4G LAB (ICEA Department, University of Padua) for supporting GIS and remote sensing analyses. The authors would also thank all the students who worked on the “Il Valore del Suolo: servizi ecosistemici urbani a Padova” project (University of Padua) for contributing to the land use analysis on the Forcellini neighborhood. Special thanks go to Edoardo Crescini for his contribution to all of the analyses in the GIS environment related to the Forcellini neighborhood. Moreover, the authors would like to thank Giulia Castaldo and Daniele Zago for their contributions to land use analysis on the Basso Isonzo and Brentelle neighborhoods, respectively.

Conflicts of Interest

The authors declare no conflicts of interest.

References

  1. Prokop, G.; Jobstmann, H.; Schönbauer, A. Report on Best Practices for Limiting Soil Sealing and Mitigating Its Effects; European Commission: Brussels, Belgium, 2011. [Google Scholar]
  2. Naumann, S.; Frelih-Larsen, A.; Prokop, G.; Ittner, S.; Reed, M.; Mills, J.; Morari, F.; Verzandvoort, S.; Albrecht, S.; Bjuréus, A.; et al. Land Take and Soil Sealing—Drivers, Trends and Policy (Legal) Instruments: Insights from European Cities. In International Yearbook of Soil Law and Policy 2018; Ginzky, H., Dooley, E., Heuser, I.L., Kasimbazi, E., Markus, T., Qin, T., Eds.; Springer: Cham, Switzerland, 2019; pp. 83–112. [Google Scholar]
  3. Artmann, M.; Breuste, J. Cities Built for and by Residents: Soil Sealing Management in the Eyes of Urban Dwellers in Germany. J. Urban Plan. Dev. 2015, 141, A5014004. [Google Scholar] [CrossRef]
  4. European Commission. Science for Environment Policy. In Soil Sealing; European Commission: Brussels, Belgium, 2012; pp. 1–41. [Google Scholar]
  5. Seto, K.C.; Fragkias, M.; Güneralp, B.; Reilly, M.K. A Meta-Analysis of Global Urban Land Expansion. PLoS ONE 2011, 6, e23777. [Google Scholar] [CrossRef] [PubMed]
  6. Soil-Soil Sealing. Available online: https://ec.europa.eu/environment/soil/sealing_guidelines.htm (accessed on 5 November 2019).
  7. Commission of the European Communities. Towards a Thematic Strategy for Soil Protection; CEC: Brussels, Belgium, 2002. [Google Scholar]
  8. Gardi, C. Urban Expansion, Land Cover and Soil Ecosystem Services, 1st ed.; Gardi, C., Ed.; Routledge: New York, NY, USA, 2017; ISBN 9781317504719. [Google Scholar]
  9. Scalenghe, R.; Marsan, F.A. The anthropogenic sealing of soils in urban areas. Landsc. Urban Plan. 2009, 90, 1–10. [Google Scholar] [CrossRef]
  10. Wessolek, G. Sealing of soils. In Urban Ecology: An International Perspective on the Interaction Between Humans and Nature; Marzluff, J.M., Shulenberger, E., Endlicher, W., Alberti, M., Bradley, G., Ryan, C., Simon, U., ZumBrunnen, C., Eds.; Springer: New York, NY, USA, 2008; pp. 161–179. [Google Scholar]
  11. Siebielec, G.; Lazar, S.; Kaufmann, C.; Jaensch, S. Handbook for Measures Enhancing Soil Function Performance and Compensating Soil Loss during Urbanization Process; Urban SMS project: Stuttgart, Germany, 2010. [Google Scholar]
  12. Opolot, E.; Yu, Y.Y.; Finke, P.A. Modeling soil genesis at pedon and landscape scales: Achievements and problems. Quat. Int. 2015, 376, 34–46. [Google Scholar] [CrossRef]
  13. Tobias, S.; Conen, F.; Duss, A.; Wenzel, L.M.; Buser, C.; Alewell, C. Soil sealing and unsealing: State of the art and examples. Land Degrad. Dev. 2018, 29, 2015–2024. [Google Scholar] [CrossRef]
  14. Aksoy, E.; Gregor, M.; Schröder, C.; Löhnertz, M.; Louwagie, G. Assessing and analysing the impact of land take pressures on arable land. Solid Earth 2017, 8, 683–695. [Google Scholar] [CrossRef] [Green Version]
  15. Ceccarelli, T.; Bajocco, S.; Salvati, L.; Perini, L. Investigating syndromes of agricultural land degradation through past trajectories and future scenarios. Soil Sci. Plant Nutr. 2014, 60, 60–70. [Google Scholar] [CrossRef] [Green Version]
  16. Stankovics, P.; Tóth, G.; Tóth, Z.; Stankovics, P.; Tóth, G.; Tóth, Z. Identifying Gaps between the Legislative Tools of Soil Protection in the EU Member States for a Common European Soil Protection Legislation. Sustainability 2018, 10, 2886. [Google Scholar] [CrossRef] [Green Version]
  17. Paleari, S. Is the European Union protecting soil? A critical analysis of Community environmental policy and law. Land Use Policy 2017, 64, 163–173. [Google Scholar] [CrossRef]
  18. Ronchi, S.; Salata, S.; Arcidiacono, A.; Piroli, E.; Montanarella, L. Policy instruments for soil protection among the EU member states: A comparative analysis. Land Use Policy 2019, 82, 763–780. [Google Scholar] [CrossRef]
  19. EU Parliament; EU Council. General Union Environment Action Programme to 2020 Living Well, Within the Limits of Our Planet; Publications Office if the European Union: Luxembourg, 2013; pp. 171–200. [Google Scholar]
  20. Decoville, A.; Schneider, M. Can the 2050 zero land take objective of the EU be reliably monitored? A comparative study. J. Land Use Sci. 2016, 11, 331–349. [Google Scholar] [CrossRef]
  21. Regione del Veneto. Disposizioni per il contenimento del consumo di suolo e modifiche della legge regionale 23 aprile 2004, n. 11. In Norme Per Il Governo Del Territorio e in Materia di Paesaggio; Regione del Veneto: Venezia, Italia, 2017; pp. 1–22. [Google Scholar]
  22. European Commission. Guidelines on Best Practice to Limit, Soil Sealing Mitigate or Compensate; EC: Brussels, Belgium, 2012. [Google Scholar]
  23. Rodríguez-Rojas, M.I.; Huertas-Fernández, F.; Moreno, B.; Martínez, G.; Grindlay, A.L. A study of the application of permeable pavements as a sustainable technique for the mitigation of soil sealing in cities: A case study in the south of Spain. J. Environ. Manag. 2018, 205, 151–162. [Google Scholar] [CrossRef] [PubMed]
  24. Buccola, N.; Spolek, G. A Pilot-Scale Evaluation of Greenroof Runoff Retention, Detention, and Quality. Water Air Soil Pollut. 2011, 216, 83–92. [Google Scholar] [CrossRef]
  25. Alexandri, E.; Jones, P. Temperature decreases in an urban canyon due to green walls and green roofs in diverse climates. Build. Environ. 2008, 43, 480–493. [Google Scholar] [CrossRef]
  26. Oberndorfer, E.; Lundholm, J.; Bass, B.; Coffman, R.R.; Doshi, H.; Dunnett, N.; Gaffin, S.; Köhler, M.; Liu, K.K.Y.; Rowe, B. Green Roofs as Urban Ecosystems: Ecological Structures, Functions, and Services. Bioscience 2007, 57, 823–833. [Google Scholar] [CrossRef]
  27. Sinha, P.; Verma, N.K.; Ayele, E. Urban Built-up Area Extraction and Change Detection of Adama Municipal Area using Time-Series Landsat Images. Int. J. Adv. Remote Sens. GIS 2016, 5, 1886–1895. [Google Scholar] [CrossRef]
  28. Hung, C.-L.J.; James, L.A.; Hodgson, M.E. An automated algorithm for mapping building impervious areas from airborne LiDAR point-cloud data for flood hydrology. GISci. Remote Sens. 2018, 55, 793–816. [Google Scholar] [CrossRef]
  29. Behnisch, M.; Poglitsch, H.; Krüger, T.; Behnisch, M.; Poglitsch, H.; Krüger, T. Soil Sealing and the Complex Bundle of Influential Factors: Germany as a Case Study. ISPRS Int. J. Geo-Inf. 2016, 5, 132. [Google Scholar] [CrossRef] [Green Version]
  30. Huete, A.R. A soil-adjusted vegetation index (SAVI). Remote Sens. Environ. 1988, 25, 295–309. [Google Scholar] [CrossRef]
  31. Congedo, L.; Sallustio, L.; Munafò, M.; Ottaviano, M.; Tonti, D.; Marchetti, M. Copernicus high-resolution layers for land cover classification in Italy. J. Maps 2016, 12, 1195–1205. [Google Scholar] [CrossRef] [Green Version]
  32. De Lotto, R.; Casella, V.; Franzini, M.; Gazzola, V.; Morelli di Popolo, C.; Sturla, S.; Venco, E.M. Estimating the Biotope Area Factor (BAF) by Means of Existing Digital Maps and GIS Technology. In Computational Science and Its Applications—ICCSA 2015; Gervasi, O., Murgante, B., Misra, S., Gavriloca, M.L., Alves Coutinho Rocha, A.M., Torre, C., Taniar, D., Apduhan, B.O., Eds.; Springer International Publishing AG Switzerland: Basel, Switzerland, 2015; pp. 617–632. ISBN 9783319214696. [Google Scholar]
  33. European Environment Agency. Copernicus Land Monitoring Service—High Resolution Layer Imperviousness: Product Specifications Document; Copernicus Team at EEA: Copenhagen, Denmark, 2018. [Google Scholar]
  34. ISPRA. Consumo di Suolo, Dinamiche Territoriali e Servizi Ecosistemici. Edizione 2018, 1st ed.; Munafò, M., Ed.; ISPRA: Roma, Italia, 2018; ISBN 9788844809027. [Google Scholar]
  35. ISPRA. Consumo di Suolo. Dinamiche Territoriali e Servizi Ecosistemici. Edizione 2019, 1st ed.; Michele, M., Ed.; ISPRA: Roma, Italia, 2019; ISBN 9788844807764. [Google Scholar]
  36. ASC-Atlante Statistico dei Comuni. Available online: http://asc.istat.it/asc_BL/ (accessed on 2 November 2019).
  37. Comune di Padova. Padova, Città D’acque. Un Modo Diverso Per Conoscere La Città; Ufficio Turismo Settore Comunicazioni ai Cittadini: Padova, Italy, 2004. [Google Scholar]
  38. Gullino, G. Storia Di Padova. Dall’antichità All’età Contemporanea; Gullino, G., Ed.; Cierre Edizioni: Verona, Italy, 2009; ISBN 978-8883145292. [Google Scholar]
  39. Marzari, S. Padova e la città metropolitana. In 1807–2007 La Metamorfosi Del Paesaggio Urbano; Marzari, S., Ed.; I Antichi Editori: Venezia, Italia, 2008. [Google Scholar]
  40. Berlin Biotope Area of Factor-Implementation Guidelines Helping to Control Temperature and Runoff-Climate Adapt. Available online: https://climate-adapt.eea.europa.eu/metadata/case-studies/berlin-biotope-area-factor-2013-implementation-of-guidelines-helping-to-control-temperature-and-runoff/#challenges_anchor (accessed on 5 November 2019).
  41. Ahern, J. Green infrastructure for cities: The spatial dimension. In Cities of the Future: Towards Integrated Sustainable Water and Landscape Management; Novotny, V., Brown, P., Eds.; IWA Publishing: London, UK, 2007; pp. 267–283. [Google Scholar]
  42. Keeley, M. The Green Area Ratio: An urban site sustainability metric. J. Environ. Plan. Manag. 2011, 54, 937–958. [Google Scholar] [CrossRef]
  43. Ingegnoli, V. Landscape Bionomics Biological-Integrated Landscape Ecology; Springer: Milan, Italy, 2015; ISBN 9788847052253. [Google Scholar]
  44. Becker, G.; Mohren, R. The Biotope Area Factor as an Ecological Parameter; Landschaft: Planen & Bauen: Berlin, Germany, 1990. [Google Scholar]
  45. Lakes, T.; Kim, H.O. The urban environmental indicator biotope Area Ratio-An enhanced approach to assess and manage the urban ecosystem services using high resolution remote-sensing. Ecol. Indic. 2012, 13, 93–103. [Google Scholar] [CrossRef]
  46. Casella, V.; Franzini, M.; De Lotto, R. Geomatics for smart cities: Obtaining the urban planning BAF index from existing digital maps. In Proceedings of the International Archives of the Photogrammetry, Remote Sensing and Spatial Information Sciences, Prague, Czech Republic, 12–19 July 2016; pp. 689–694. [Google Scholar]
  47. Birch, C.P.D.; Oom, S.P.; Beecham, J.A. Rectangular and hexagonal grids used for observation, experiment and simulation in ecology. Ecol. Model. 2007, 206, 347–359. [Google Scholar] [CrossRef]
  48. Carr, D.B.; Olsen, A.R.; White, D. Hexagon Mosaic Maps for Display of Univariate and Bivariate Geographical Data. Cartogr. Geogr. Inf. Syst. 1992, 19, 228–236. [Google Scholar] [CrossRef]
  49. Goldblatt, R.; Stuhlmacher, M.F.; Tellman, B.; Clinton, N.; Hanson, G.; Georgescu, M.; Wang, C.; Serrano-Candela, F.; Khandelwal, A.K.; Cheng, W.H.; et al. Using Landsat and nighttime lights for supervised pixel-based image classification of urban land cover. Remote Sens. Environ. 2018, 205, 253–275. [Google Scholar] [CrossRef]
  50. Berndtsson, C.J. Green roof performance towards management of runoff water quantity and quality: A review. Ecol. Eng. 2010, 36, 351–360. [Google Scholar] [CrossRef]
  51. Rowe, D.B.; Getter, K.L. The role of extensive green roofs in sustainable development. HortScience 2006, 41, 1276–1285. [Google Scholar]
  52. De Lotto, E.M. Venco Efficacia e Attuabilità di Indici Ecologico Ambientali nella Pratica Urbanistica. In Proceedings of the XXVIII Congresso dell’INU: Il governo della città nella contemporaneità, Salerno, Italia, 24–26 October 2015; Sbetti, E.M., Rossi, E.M., Talia, E.M., Trillo, E.M., Eds.; La Città Come Motore Di Sviluppo. INU Edizioni: Salerno, Italia, 2015. [Google Scholar]
  53. Centro di Ricerca sui Consumi di Suolo. CRCS 2018: Consumo Di Suolo, Servizi Ecosistemici E Green Infrastructures; Arcidiacono, A., Di Simine, D., Ronchi, S., Salata, S., Eds.; INU Edizioni: Roma, Italy, 2018; ISBN 9788876031854. [Google Scholar]
  54. Gao, Y.; Wang, D.; Schmidt, A.; Tang, Y. Exploring the Response of Combined Urban Sewer System to the Implementation of Green Roof. In The 4th International Conference on Environmental Systems Research; IOP Publishing Ltd: Bristol, UK, 2017; pp. 1–7. [Google Scholar]
  55. Köhler, M.; Schmidt, M.; Grimme, F.W.; Laar, M.; Gusmão, F. Urban Water Retention by Greened Roofs in Temperate and Tropical Climate. In Proceedings of the 38th IFLA World Congress International Federation of Landscape Architects, Singapore, 26–29 June 2001; pp. 151–162. [Google Scholar]
  56. Artmann, M. Urban gray vs. urban green vs. soil protection—Development of a systemic solution to soil sealing management on the example of Germany. Environ. Impact Assess. Rev. 2016, 59, 27–42. [Google Scholar] [CrossRef]
  57. Artmann, M. Managing urban soil sealing in Munich and Leipzig Germany-From a wicked problem to clumsy solutions. Land Use Policy 2015, 46, 21–37. [Google Scholar] [CrossRef]
Figure 1. Geographical framework: Veneto region and the municipality of Padua.
Sustainability 12 00150 g001
Figure 2. (a) The municipality of Padua and the boundaries of the four neighborhoods; (b) a zoom of the urban fabric of Brentelle neighborhood; (c) detail of the urban fabric of the Basso Isonzo neighborhood; (d) San Lazzaro neighborhood; (e) and Forcellini neighborhood.
Sustainability 12 00150 g002
Figure 3. From the aerial ortho-photos to the BAF index calculation and representation.
Sustainability 12 00150 g003
Figure 4. Land use analysis in the four neighborhoods: San Lazzaro (blue), Basso Isonzo (orange), Forcellini (gray), and Brentelle (yellow).
Sustainability 12 00150 g004
Figure 5. Land use analysis. (a) Brentelle neighborhood; (b) Basso Isonzo neighborhood; (c) Forcellini neighborhood; (d) San Lazzaro neighborhood. (e) Legend of land use analysis.
Sustainability 12 00150 g005
Figure 6. Biotope area factor (BAF) analysis, showing different degrees of permeability, from 0 to 1: (a) Brentelle; (b) Basso Isonzo; (c) Forcellini; (d) San Lazzaro. (e) Legend of BAF analysis.
Sustainability 12 00150 g006
Figure 7. Percentage of BAF analysis in each neighborhood. (a) Brentelle; (b) Basso Isonzo; (c) Forcellini; (d) San Lazzaro. (e) Legend of percentage of the BAF analysis.
Sustainability 12 00150 g007
Figure 8. The pie chart with the percentage value of 1 in the BAF class in each neighborhood. (a) Brentelle neighborhood; (b) Basso Isonzo neighborhood; (c) Forcellini neighborhood; (d) San Lazzaro neighborhood.
Sustainability 12 00150 g008
Figure 9. Hexagon tessellation of the BAF analysis in each neighborhood. (a) Brentelle neighborhood; (b) Basso Isonzo neighborhood; (c) Forcellini neighborhood; (d) San Lazzaro neighborhood. (e) Legend of hexagon tessellation.
Sustainability 12 00150 g009
Figure 10. Mitigation scenario in the San Lazzaro neighborhood: rooftop greening. (a) BAF analysis showing different degrees of permeability (from 0 to 1); (b) Hexagon tessellation of the BAF analysis.
Sustainability 12 00150 g010

